1. Introduction
In North China, the Palaeozoic lithosphere was as much as 200 km thick (Wang et al. Reference Wang, Sueao, Takahashi, Yurimoto and Gasparik2000) and was thinned to 80 km in the Cenozoic as revealed by mantle xenoliths from Cenozoic basalts (Fan et al. Reference Fan, Zhang, Baker, Jarvis, Mason and Menzies2000). Thus, at least 120 km of rigid lithospheric mantle was removed during the Mesozoic (Zhang & Sun, Reference Zhang and Sun2002; Zhang et al. Reference Zhang, Sun, Zhou, Zhou, Fan and Zheng2003). Although thinning of the lithospheric mantle from the Palaeozoic to Cenozoic in South China was inferred by Xu et al. (Reference Xu, O'Reilly, Griffin and Zhou2000), the change was poorly documented and the processes involved were unknown because of the paucity of Palaeozoic and Mesozoic mantle-derived rocks. Clearly, the nature of the Mesozoic lithospheric mantle underneath South China is important for understanding mantle evolution in the region and needs to be well documented.
Based on spinel peridotite xenoliths in SE China, the Proterozoic subcontinental lithospheric mantle (SCLM) underwent heterogeneous replacement by Phanerozoic mantle before late Jurassic times (Zheng et al. Reference Zheng, O'Reilly, Griffin, Zhang, Lu and Liu2004). In the Mesozoic, an arc-like mantle was formed by modification of previous material (Li & McCulloch, Reference Li, McCulloch, Flower, Chung, Lo and Lee1998; Wang, Reference Wang2002; Zhao, Hu & Liu, Reference Zheng, O'Reilly, Griffin, Zhang, Lu and Liu2004; Xie et al. Reference Xie, Hu, Franco, Li, Cao, Jiang and Zhao2006), and in the Cenozoic the lithosphere had OIB-like affinities according to basalts in SE China (Chung et al. Reference Chung, Sun, Tu, Chen and Lee1994, Reference Chung, Jahn, Chen, Lee and Chen1995; Ho et al. Reference Ho, Chen, Lo and Zhao2003; Zheng et al. Reference Zheng, O'Reilly, Griffin, Zhang, Lu and Liu2004). Thus, the Mesozoic mafic intrusions provide a good opportunity to investigate the lithospheric mantle evolution beneath South China. Although mafic dykes in SE China, such as in Jiangxi province (Xie et al. Reference Xie, Hu, Franco, Li, Cao, Jiang and Zhao2006) and Guangdong province (Li & McCulloch, Reference Li, McCulloch, Flower, Chung, Lo and Lee1998), have been previously reported, mafic dykes in Fujian province have not been extensively studied. This paper reports major and trace element compositions and Sr–Nd–Pb isotopic data for selected mafic intrusions in Fujian province, accompanied by previously published data for mafic dykes in Jiangxi and Guangdong provinces. Our objectives are: (1) to determine the nature of the Mesozoic mantle source for the mafic rocks; (2) to constrain the processes and mechanism(s) related to their formation; and (3) to provide a better understanding of the evolution of the lithospheric mantle beneath SE China.
2. Geological background
South China was formed by amalgamation of the Yangtze Block to the west and the Cathaysia Block to the east along a Neoproterozoic collision belt (Chen & Jahn, Reference Chen and Jahn1998). The Yangtze Block is composed of basement complexes overlain by a Neoproterozoic (Sinian) to Cenozoic cover sequence (Zhou et al. Reference Zhou, Zhao, Qi, Su and Hu2006). The Cathaysian Block collided with the Yangtze Block at about 1000 Ma and consists of Proterozoic basement and Sinian to Triassic sedimentary strata (Chen & Jahn, Reference Chen and Jahn1998).
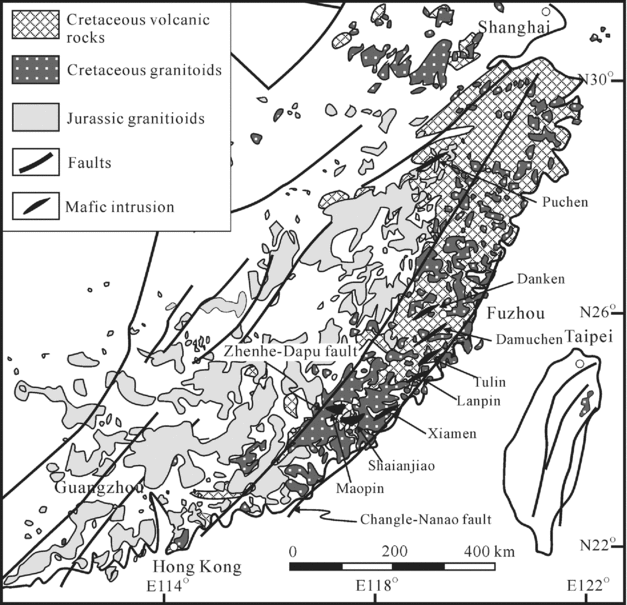
The coastal area of Fujian province in SE China lies within the Cathaysian Block and is adjacent to the Pacific Plate (Fig. 1). Two NE-trending faults, the Changle–Nanao and Zhenhe–Dapu fault, separate the area into three tectonic belts from east to west, the Pingtan–Dongshan metamorphic belt, the Cretaceous magmatic belt and the Early Palaeozoic foldbelt.
Simplified geological map of SE China showing the distribution of the Late Mesozoic magmatic rocks (modified from Li, Reference Li2000) and location of sampled mafic dykes and intrusions.

The Pingtan–Dongshan metamorphic belt is composed of lower Palaeozoic regionally metamorphosed rocks, late Mesozoic granites, volcanic rocks and mafic–ultramafic rocks. The metamorphic rocks include biotite gneiss, amphibolite, sillimanite schist and quartz schist. These rocks have Rb–Sr isochron ages of 165–178 Ma (Jahn, Chen & Yan, Reference Jahn, Chen and Yan1976; Lu et al. Reference Lu, Jia, Wang, Guo, Shi and Zhang1994). Mafic–ultramafic rocks occur only along the Changle–Nanao fault, and have been dated at 95–115 Ma using the zircon U–Pb method (Li et al. Reference Li, Dong, Xu and Zhou1995; Dong et al. Reference Dong, Zhou, Li, Ren and Zhou1997) and whole rock Sm–Nd method (Wang, Reference Wang2002).
The Cretaceous magmatic belt, which is 500 km long and 100 km wide, is composed of Cretaceous granitic and volcanic rocks (Fig. 1) (Li, Reference Li2000). The granitic rocks include Early Cretaceous I-type granites and minor Late Cretaceous A-type granites. Based on Rb–Sr and K–Ar dating results, the I-type granites have ages of 165 Ma and 120–90 Ma (Jahn, Chen & Yan, Reference Jahn, Chen and Yan1976), whereas the A-type granites have ages of 90 to 70 Ma (GMRBF, 1985). The plutonic rocks intruded upper Triassic to upper Jurassic sandstone, volcanic rocks and phyllite and form a distinct calc-alkaline magmatic belt.
The Early Palaeozoic fold belt to the west consists of a Proterozoic basement known as the Mayuan and Mamianshan complexes (Jin & Sun, Reference Jin and Sun1997), overlain by Cambrian and Triassic strata. Granites are widely distributed in this belt, and have variable ages ranging from 120 Ma to 500 Ma (Li, Reference Li2000).
Relatively abundant mafic intrusions in the Cretaceous magmatic belt include mafic plutons, such as the Maopin and Shaianjiao bodies, and numerous mafic dykes (Fig. 1). Both of the plutons are sill-like bodies, about 3 km long and 1.5 km wide, and are composed of relatively undifferentiated mafic rocks. They intrude Jurassic tuffs and Triassic strata and the Tianling muscovite granite which has been dated at 138 Ma by the K–Ar method (GMRBF, 1985). Locally, the intrusions have chilled margins against their hosts. Mafic dykes, which also intrude the Mesozoic successions, are typically several metres wide and mostly trend NE. These dykes, which crop out in the coastal area of Fujian province, include the Damuchen, Danken, Xiamen, Tulin, Lanpin and Puchen bodies that were investigated in this study (Fig. 1). Rocks from both the mafic plutons and dykes are massive and are composed mainly of clinopyroxene and plagioclase with minor Fe–Ti oxides and quartz.
3. Analytical methods
Relatively fresh samples were collected with care to avoid weathered, hydrothermally altered and mineralized parts. Whole-rock samples were trimmed to remove slightly weathered surfaces, and then powdered using an agate mill. K–Ar age determinations were carried out utilizing the MM1200 spectrometer at the Institute of Geology, China Seismology Bureau. Parameters used were: λe = 0.581×10⁻¹⁰ year−1, λβ = 4.962×10⁻¹⁰ year−1;40 K = 0.01167 atom % (Steiger & Jäger, Reference Steiger and Jäger1977).
The major oxides were analysed by routine wet chemistry with precisions better than ± 2 %. Trace elements, including REE, were analysed using a Finnigan Element ICP-MS at the Institute of Geochemistry, Chinese Academy of Sciences (CAS), following the procedures described in Qi, Hu & Gregoire (Reference Qi, Hu and Gregoire2000). Precisions are within ± 5–10 %.
Sr and Nd isotopic compositions were determined using a Micromass Isoprobe MC-ICPMS at the Guangzhou Institute of Geochemistry. 87Sr/86Sr ratios of the NBS 987 and 143Nd/144Nd ratios of Shin Etsu JNDi-1 standard measured during this study were 0.710243 ± 14 (2σ) and 0.512124 ± 11 (2σ), respectively. Detailed descriptions of the analytical techniques can be found in Li et al. (Reference Li, Liu, Sun, Li, Liang and Liu2004).
For Pb-isotope determination, 200 mg of sample powder were placed into a Teflon® beaker, spiked and dissolved in concentrated HF at 800 °C for 72 hours. Pb was separated and purified by conventional ion-exchange techniques with 0.5 M HBr as eluant followed by 2 M HCl leaching and collection of the Pb in 1.5 ml of 6 M HCl. Samples were then dried on a hot plate under a lamp in a nitrogen gas flow tank for about two hours. Isotope ratios were measured at the Isotope Analysis Center of the Institute of Geology, Beijing Nucleus Industry, using a MAT261 thermal ionization mass spectrometer. During the course of this study, measured ratios of the NBS981 Pb standard were 208Pb/206Pb = 2.165246 ± 69, 207Pb/206Pb = 0.914510 ± 56 and 204Pb/206Pb = 0.059199 ± 13.
4. Analytical results
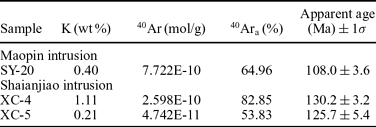
Whole-rock samples have K–Ar ages ranging from 108 to 130 Ma (Table 1). These ages are in agreement with the field relationships.
K–Ar ages for rocks from the Maopin and Shaianjiao intrusions, Fujian Province, SE China

Parameters for 40K: λe = 0.581 × 10⁻¹⁰ year−1, λβ = 4.962 × 10⁻¹⁰ year−1; 40K = 0.01167 atom % (Steiger & Jäger, Reference Steiger and Jäger1977).
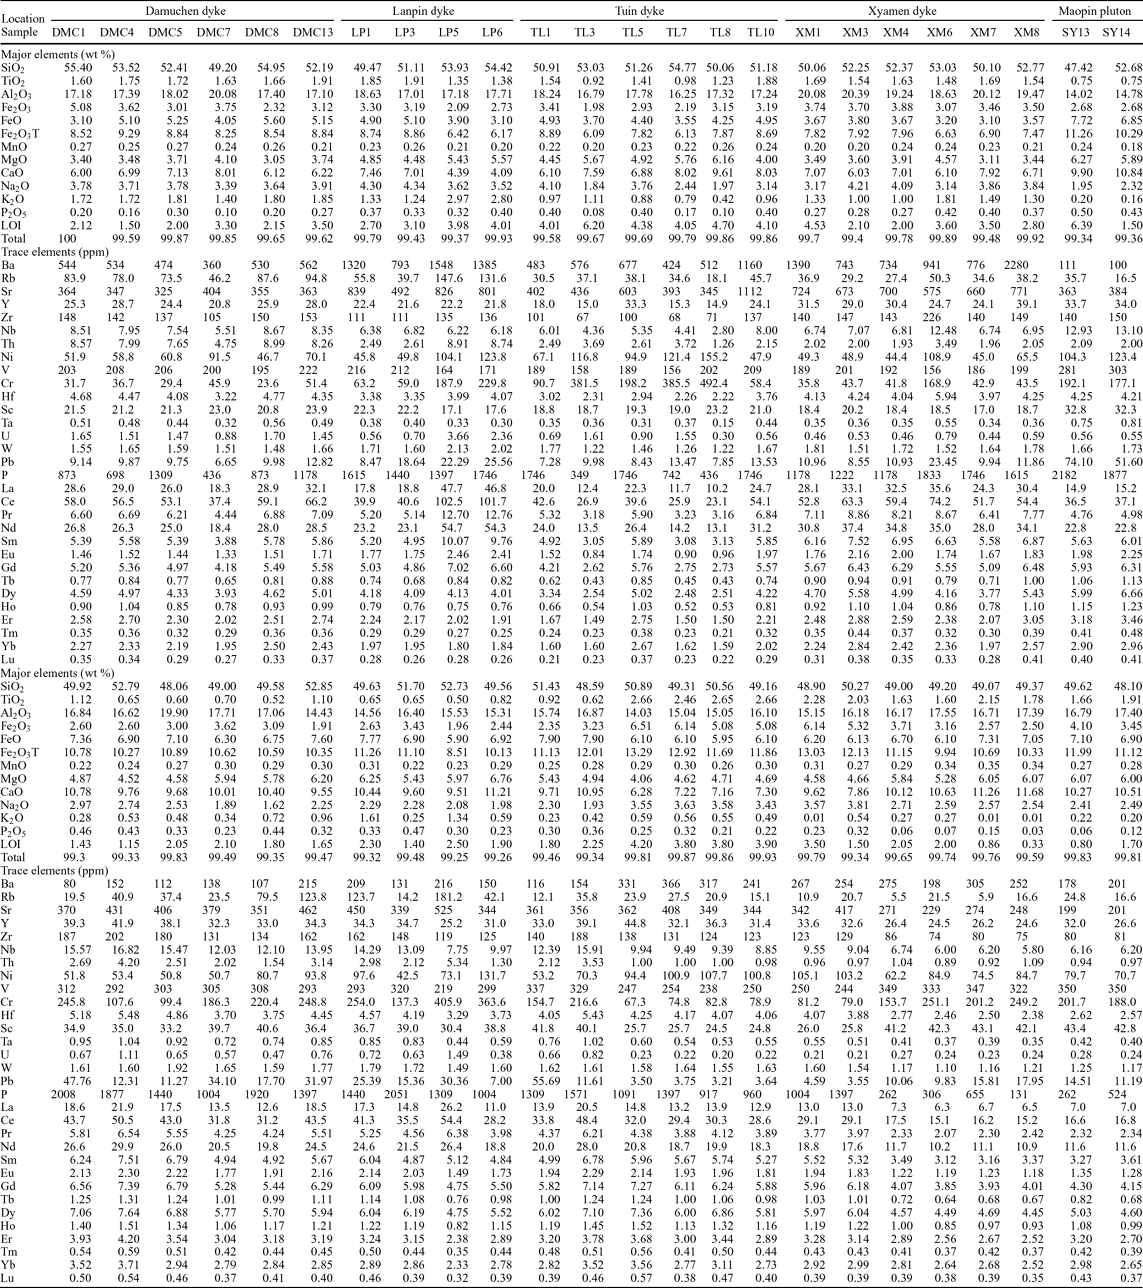
Samples from the Danken, Tulin and Lanpin dykes have loss on ignition (LOI) up to 6 wt %, whereas those from the Shaianjiao and Maopin intrusions have LOI less than 3 wt %, indicating weak to moderate alteration. High field strength (HFSE) and rare earth elements (REE) are essentially immobile under such conditions (e.g. Pearce & Cann, Reference Pearce and Cann1973; Whalen, Syme & Stern, Reference Whalen, Syme and Stern1999), thus we focus mainly on these elements to constrain the petrogenesis of the rocks.
4.a. Major and trace elements
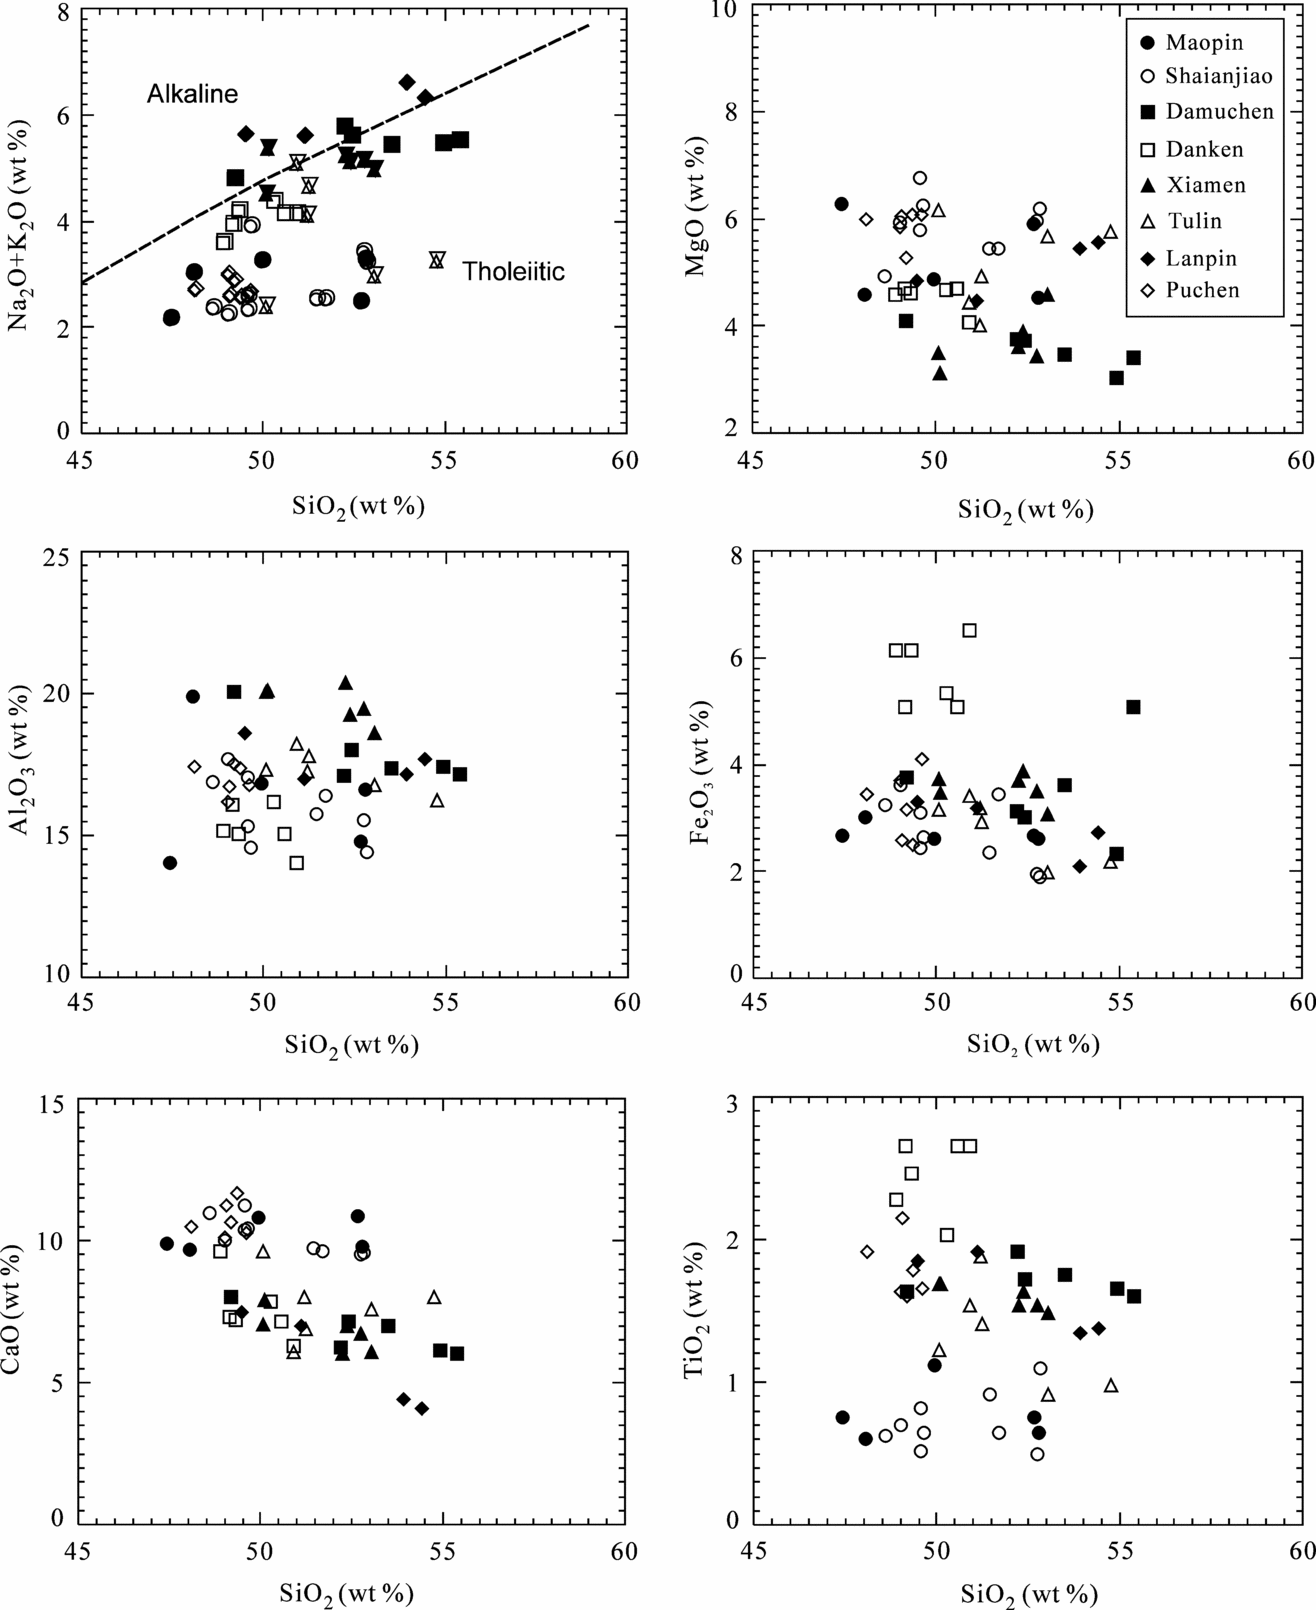
Forty-eight representative samples from the two mafic plutons and six mafic dykes were analysed (Table 2). Both the plutons and dykes have similar chemical compositions and are tholeiitic in terms of a SiO2 v. (K2O+Na2O) plot (Fig. 2). SiO2 ranges from 47.42 to 55.40 wt %, MgO from 3.05 to 6.76 wt %, Fe2O3 from 1.91 to 6.51 wt % and CaO from 4.09 to 11.68 wt % (Table 2). SiO2 correlates negatively with MgO and CaO. The Al2O3 contents of the rocks vary from 14.02 to 20.39 wt % and K2O+Na2O from 2.15 to 6.59 wt % (Table 2).
Major oxides and trace element compositions for mafic rocks from Fujian province, SE China
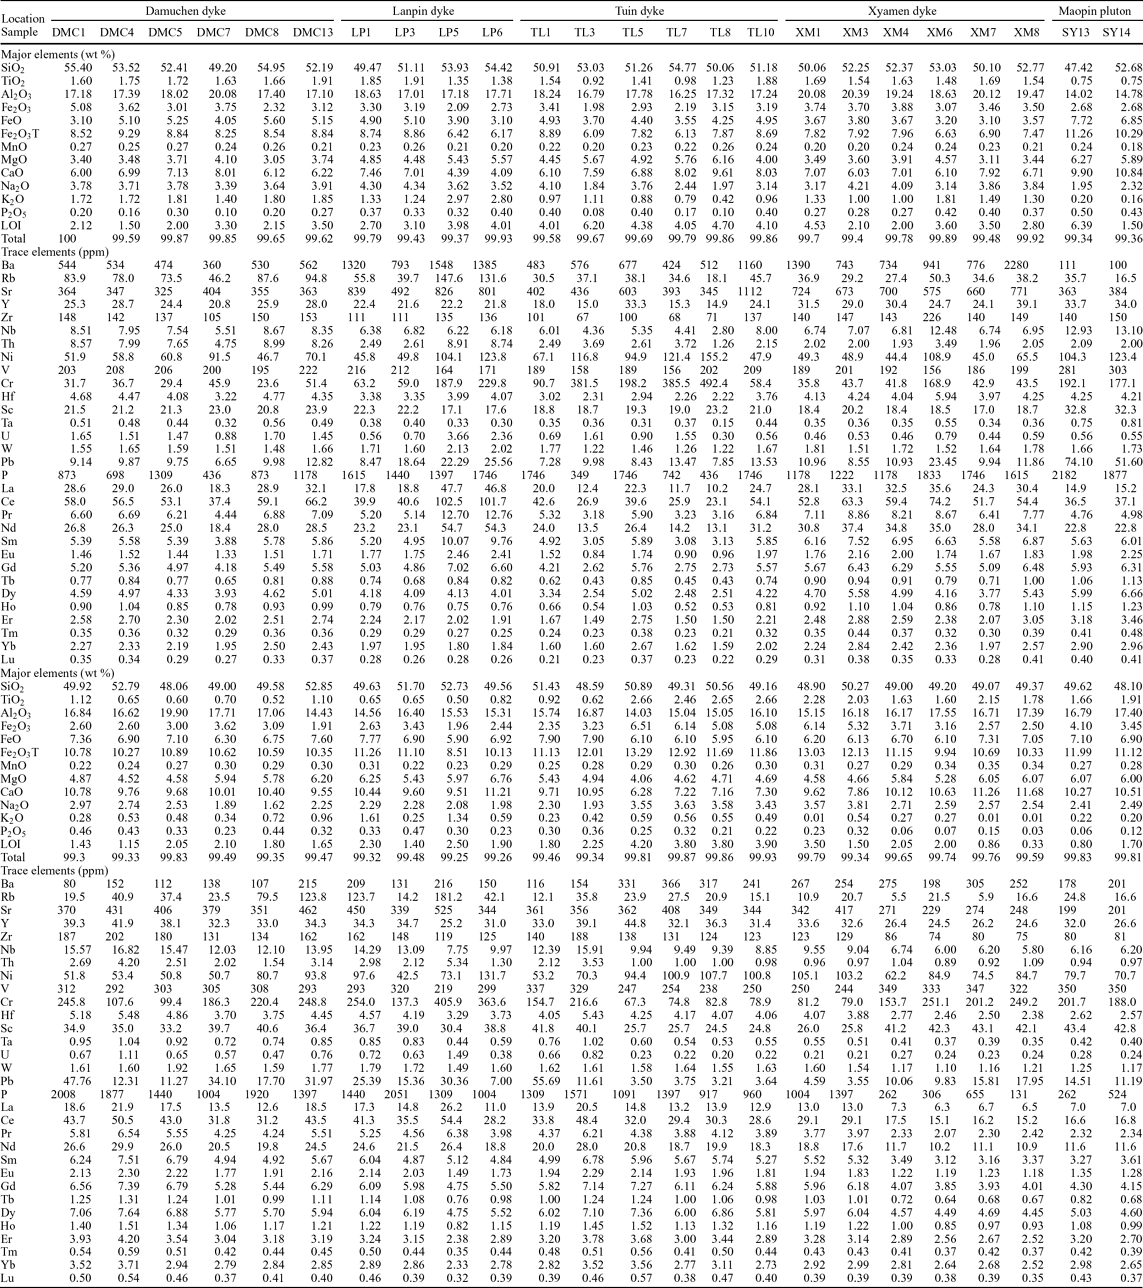
LOI – loss on ignition.
SiO2 v. other major oxides of the mafic intrusions from the coastal area of the Fujian Province, SE China.

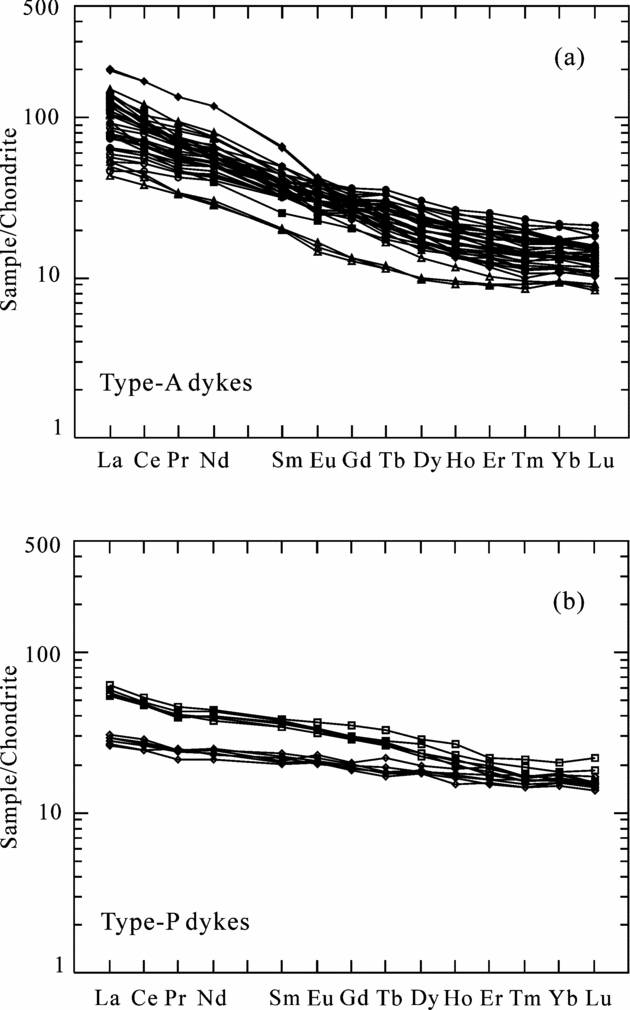
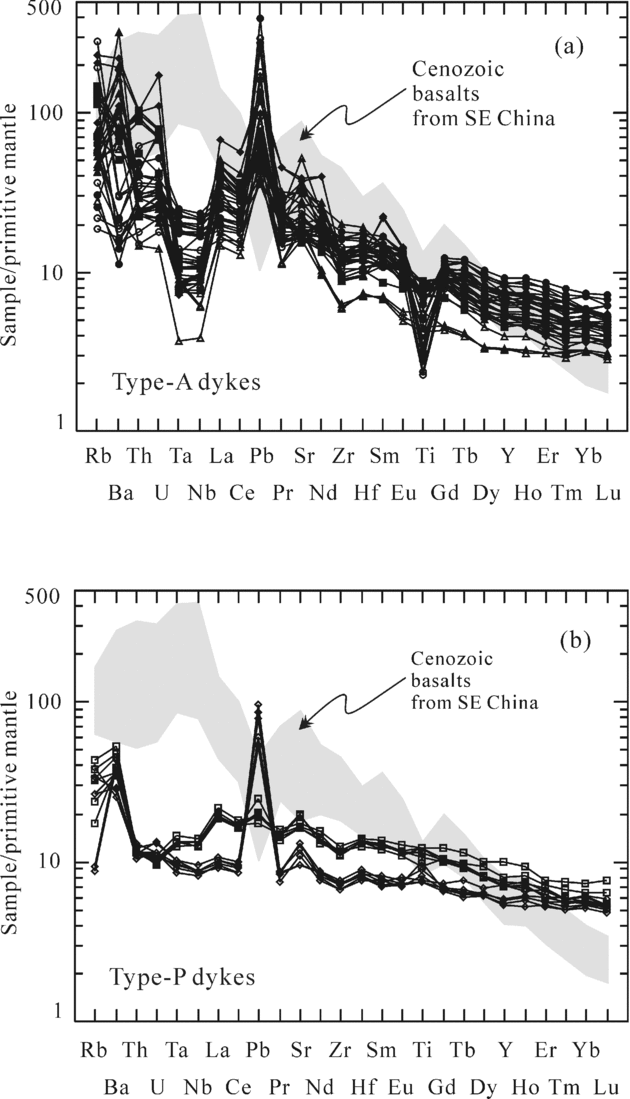
The intrusions are divided into two types, type A and type P, based on their geochemistry. Type-A rocks are slightly enriched in LREE, with (La/Yb)n ratios ranging from 2.85 to 19.0 (fig. 3a), and have arc-like primitive mantle-normalized patterns with enrichment of large ion lithophile elements (LILE: Rb, Ba, Th and U), depletion of high field strength elements (HFSE: Nb, Ta, Zr and Hf) and positive Pb and negative Ti anomalies (fig. 4a). Type-P rocks are characterized by flat REE patterns with (La/Yb)n ratios of 1.68 to 3.43 (Fig. 3b) and flat primitive mantle-normalized trace element patterns with slight enrichment of Rb, Ba and Pb (fig. 4b). Both types of mafic rocks have low Nb/U (1.70–27.13), Ce/Pb (0.49–7.40) and La/Th (< 16.57) ratios except for those from the Danken body, which have high Nb/U (41.17–46.72) and Ce/Pb (6.32–9.44) ratios, compared with primitive mantle and N-MORB values (Sun & McDonough, Reference Sun, McDonough, Saunders and Norry1989).
Chondrite-normalized REE patterns for the mafic rocks from the coastal area of the Fujian province, SE China. Type A comprises the Maopin, Shaianjiao, Damuchen, Xiamen, Tulin and Lanpin intrusions which have relatively steeper REE patterns (a) compared with the type-P samples from the Danken and Puchen dykes (b). Normalization values are from Sun & McDonough (1998).

4.b. Sr–Nd and Pb–Pb isotopes
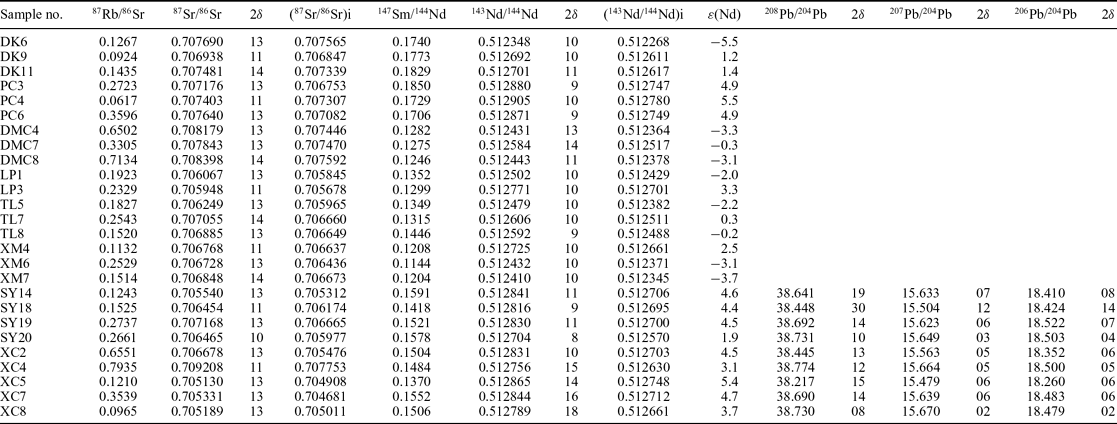
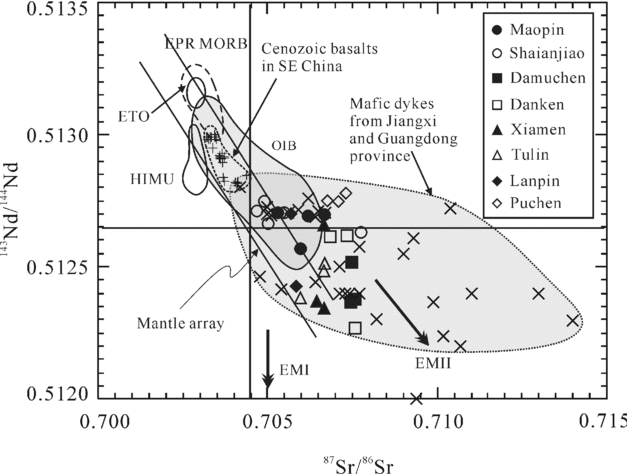
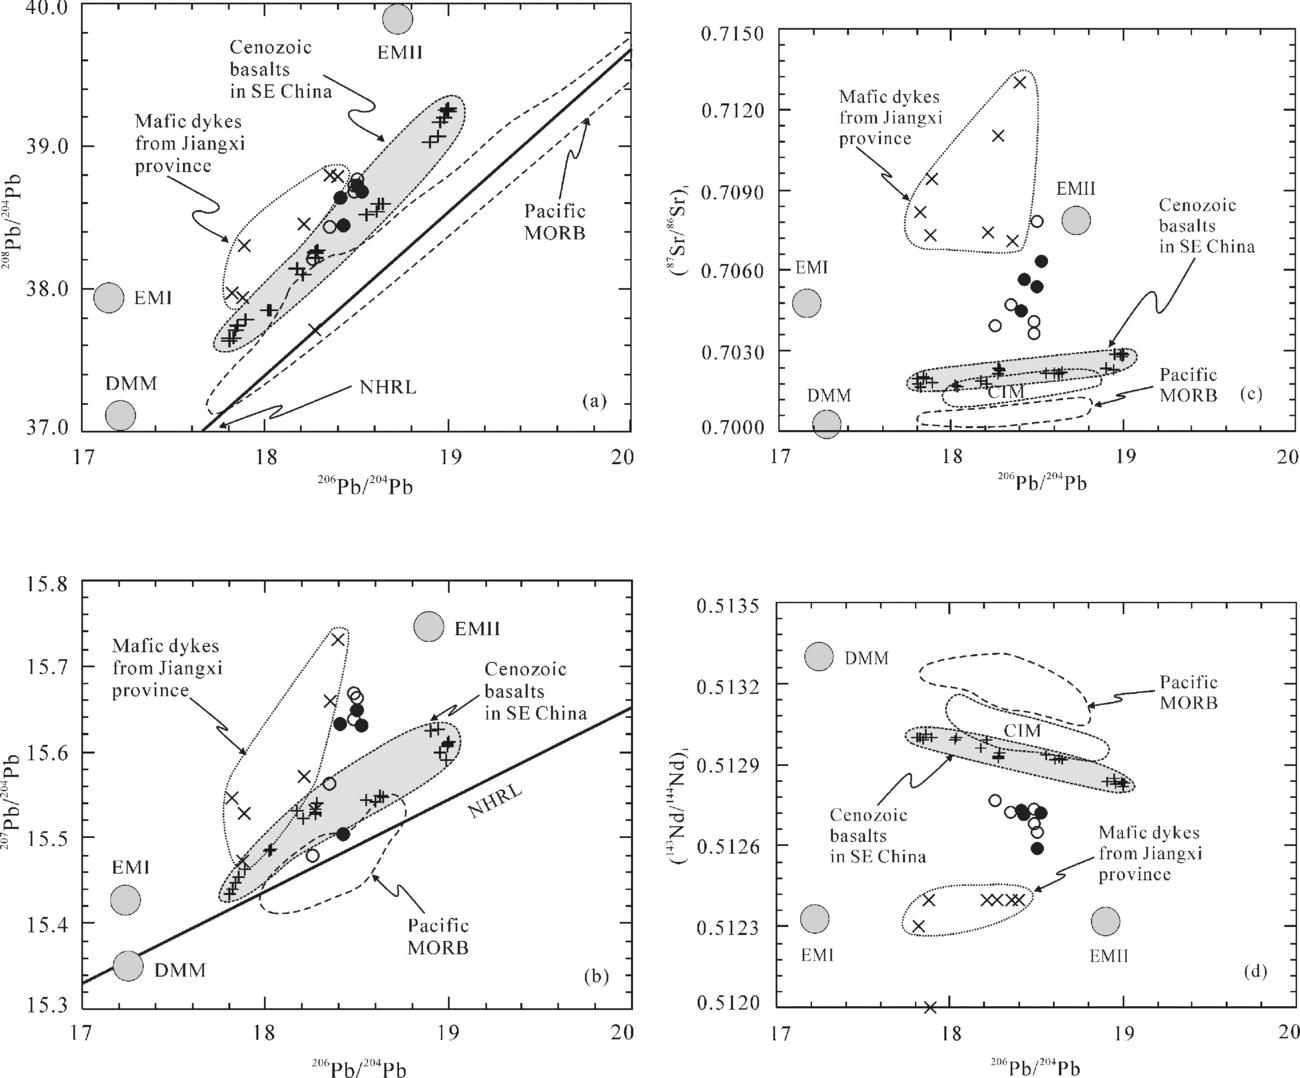
Age-corrected 87Sr/86Sr ratios for the type-A samples range from 0.7047 to 0.7078 (Table 3), and the high 87Sr/86Sr and low 143Nd/144Nd (0.5124–0.5129) ratios form a trend roughly toward enriched mantle type II (EMII) (Fig. 5). The type-P samples from the Puchen and Danken dykes have slightly higher average 143Nd/144Nd (0.5127–0.5129) and 87Sr/86Sr ratios (0.7068–0.7073) except for sample DC6. All the samples from Fujain province have 87Sr/86Sr and 143Nd/144Nd ratios similar to those of the late Mesozoic mafic dykes in Jiangxi and Guangdong provinces (Li & McCulloch, Reference Li, McCulloch, Flower, Chung, Lo and Lee1998; Xie et al. Reference Xie, Hu, Franco, Li, Cao, Jiang and Zhao2006). Rocks from the Maopin and Shaianjiao intrusions have a narrow range of 206Pb/204Pb (18.26–18.52) with slightly more radiogenic 207Pb and 208Pb than 206Pb (Fig. 6). Their 208Pb/204Pb and 207Pb/204Pb ratios range from 38.2 to 38.8 and from 15.5 to 15.7, respectively (Table 3).
Rb–Sr, Sm–Nd and Pb–Pb isotopic compositions for the mafic intrusions from the coastal area of Fujian Province, SE China

Chondrite uniform reservoir (CHUR) values (87Rb/86Sr = 0.0816, 87Sr/86Sr = 0.7045, 147Sm/144Nd = 0.1967, 143Nd/144Nd = 0.512638) are used for calculation. λRb = 1.41 × 10⁻¹¹ year−1, λSm = 6.54 × 10⁻¹² year−1 (Lugmair & Marti, Reference Lugmair and Marti1978). Both (87Sr/86Sr)i and εNd were calculated by the mean K–Ar age 80 Ma for the Damuchen, Xiamen and Lanpin samples, 70 Ma for the Dancan samples, 110 Ma for the Tulin and Puchen samples and 130 Ma for the Maopin and Shaianjiao samples. K–Ar age data for calculation are from (J. H. Zhao, unpub. Honours thesis, Chinese Academy of Sciences, Institute of Geochemistry, 2004).
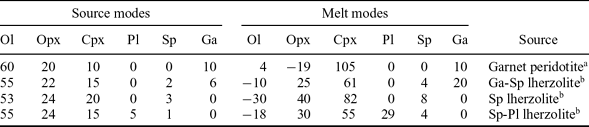
Source and melt modes used for melting calculations

aJohnson (Reference Johnson1998); bGurenko & Chaussidon (Reference Gurenko and Chaussidon1995).
Ol – olivine; Opx – orthopyroxene; Cpx – clinopyroxene; Pl – plagioclase; Sp – spinel; Ga – garnet.
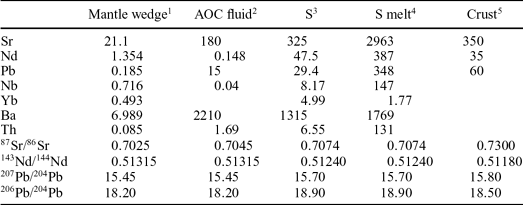
Mixing end-members used for model calculations

1Trace element concentrations are adopted from Sun & McDonough (Reference Sun, McDonough, Saunders and Norry1989). Isotopic composition is based on the data from White, Hofmann & Puchelt (Reference White, Hofmann and Puchelt1987) and Mahoney et al. (Reference Mahoney, Sinton, Kurz, Mcdougall, Spencer and Lugmair1994) at 143Nd/144Nd = 0.51315.
2Altered Oceanic Crust (AOC) fluid after Dorendorf, Wiechert & Wörner (Reference Dorendorf, Wiechert and Wörner2000) and Ishizuka et al. (Reference Ishizuka, Taylor, Milton and Nesbitt2003).
3Average sediment composition (S) after Plank & Langmuir (Reference Plank and Langmuir1998).
4Sediment melt (5%) (S melt) in equilibrium with sediment (40:40:20 by mass clinopyroxene:garnet:biotite), partition coefficients and accumulated fractional melting equation: (CL/C0=1/F*[1-(1-F)1/D]) are from Münker (Reference Münker2000).
5Trace elements and isotopic compositions are estimated from Palaeo- to Meso-Proterozoic metamorphic rocks of South China (Yu et al. Reference Xu, O'Reilly, Griffin and Zhang2003). Pb, 207Pb/204Pb and 206Pb/204Pb are estimated from the Mesozoic granites in SE China (Zhang et al. Reference Zhang, Wang, Chen, Liu, Yu, Wu and Lan1994).
5 Discussion
5.a. Effects of crustal contamination
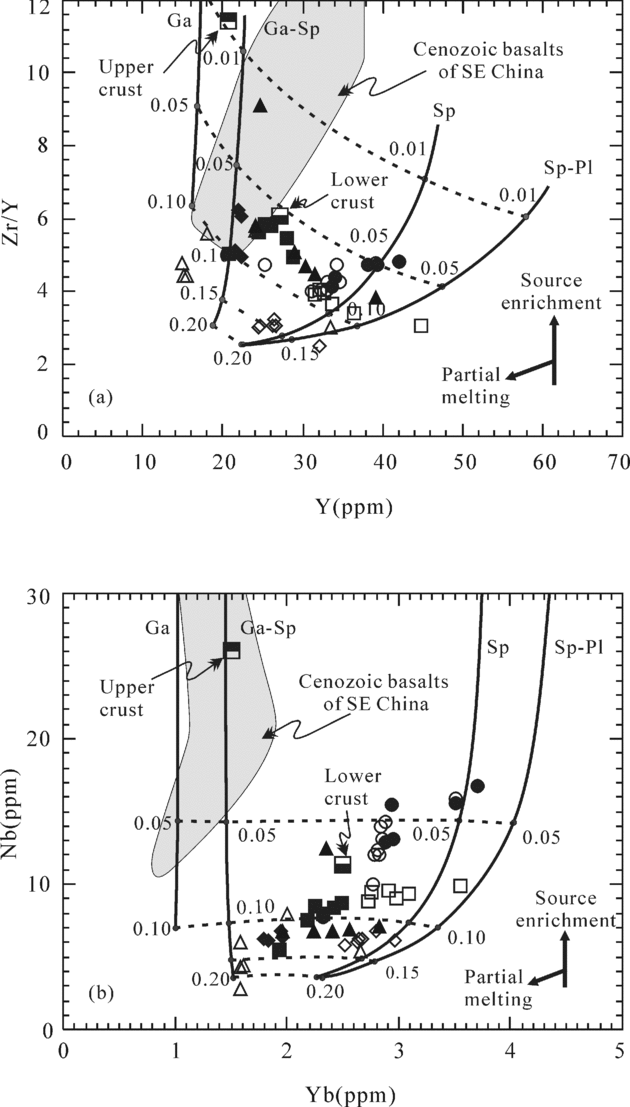
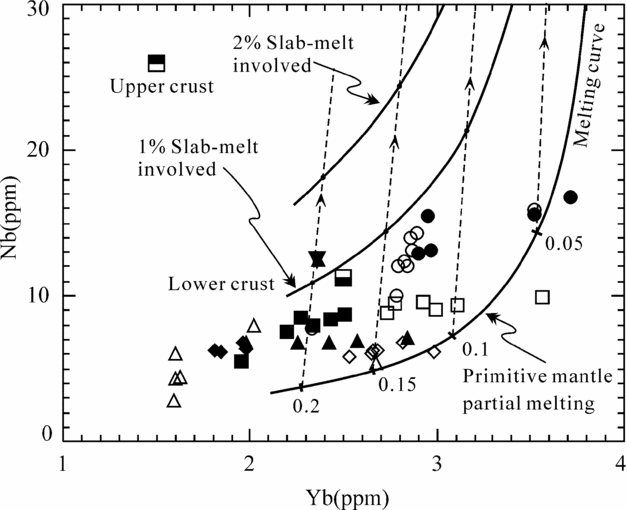
Crustal contamination commonly plays an important role during magma emplacement and its effects must be evaluated carefully. Samples from the Lanpin, Xiamen and Damuchen dykes show negative correlations between Y and Zr/Y ratios, suggesting a significant addition of crustal components to their primary magmas (fig. 7a). This conclusion is supported by their large variation of εNd (−3.7 to +3.3). Samples from the Damuchen dyke have 87Sr/86Sr ratios slightly higher than the average value for Pacific sediments (0.7074) (Plank & Langmuir, Reference Plank and Langmuir1998) (Fig. 5), further suggesting significant crustal contamination during magma emplacement. Samples from the Maopin and Shaianjiao intrusions have well-defined positive correlations between Y and Zr/Y ratios, suggesting little or no crustal contamination. A lack of crustal contamination in these two intrusions is consistent with their higher Nb and Yb concentrations relative to the lower and upper crust (fig. 7b). Mafic rocks from the Puchen dyke have relatively constant Y contents and Zr/Y ratios, suggesting minor involvement of crustal components. Nevertheless, all of these samples form a well-defined positive correlation between Nb and Yb, inconsistent with a crustal contamination trend (fig. 7b), indicating these two elements were not significantly modified by crustal contamination.
In summary, rocks of the Lanpin, Xiamen and Damuchen dykes were strongly influenced by crustal contamination, and similar contamination has been recorded in Cretaceous mafic dykes elsewhere in SE China. For example, dykes from Jiangxi and Guangdong provinces have 87Sr/86Sr ratios up to 0.7140 (Li & McCulloch, Reference Li, McCulloch, Flower, Chung, Lo and Lee1998; Xie et al. Reference Xie, Hu, Franco, Li, Cao, Jiang and Zhao2006). On the other hand, samples from the Puchen, Maopin and Shaianjiao intrusions show only minor crustal contamination and can be used to constrain the evolution of their parental magmas. In addition, such elements as Nb and Yb were not significantly modified by crustal contamination in any of the Fujian intrusions and thus can be used to examine the nature of the mantle source region.
5.b. Nature of the mantle source and degree of partial melting
Zr and Y in primitive magmas are buffered by the mantle residuum (Pearce & Parkinson, Reference Pearce, Parkinson, Prichard, Alabaster, Harris and Neary1993; Woodhead, Eggins & Gamble, Reference Woodhead, Eggins and Gamble1993), and thus their concentrations are controlled mainly by variations in partial melting (McCulloch & Gamble, Reference McCulloch and Gamble1991; Stalder et al. Reference Stalder, Foley, Brey and Horn1998). More incompatible elements, such as Nb and Ta, are extremely sensitive to depletion/enrichment events because they enter the melt very efficiently (Pearce & Parkinson, Reference Pearce, Parkinson, Prichard, Alabaster, Harris and Neary1993; Woodhead, Eggins & Gamble, Reference Woodhead, Eggins and Gamble1993). Therefore, Nb, Zr, Y and Yb are all useful for estimating degrees of melting and mantle compositions (Münker, Reference Münker2000).
Garnet has a high partition coefficient for Y (Dgarnet/melt = 4–11) relative to Zr (Dgarnet/melt = 0.4–0.7) (Jenner et al. Reference Jenner, Foley, Jackson, Green, Fryer and Longerich1993). Thus, the Zr and Y contents of primitive melts vary with the amount of garnet in the source region but the Zr/Y ratios of the melts correlate with Y contents. However, the partition coefficients of Zr and Y decrease from garnet peridotite (DZrmantle/melt = 0.04744; DYmantle/melt = 0.26170) to spinel–plagioclase lherzolite (DZrmantle/melt = 0.02735; DYmantle/melt = 0.07468). Accordingly, partial melting of a garnet peridotite mantle would produce a steeper trend in a Zr/Y v. Y diagram than melting of a spinel–plagioclase lherzolite mantle (fig. 7a). Plots of Nb v. Yb (fig. 7b) produce similar results. On a Zr/Y v. Y plot (fig. 7a), type-A rocks from the Maopin and Shaianjiao mafic intrusions lie along the spinel lherzolite melting curve. Mafic rocks from the Puchen dyke (type P) have lower Y and Zr/Y ratios than those of the Maopin and Shaianjiao intrusions, but also plot along the spinel lherzolite melting curve. In the Nb v. Yb diagram, all of these rocks define a flat, positive trend, compatible with a spinel lherzolite source (fig. 7b). Calculations suggest that the parental magmas of the Maopin and Shaianjiao intrusions were formed by 5–15 % partial melting of a spinel lherzolite. The parental magma of the Puchen dyke was formed from a similar source but experienced higher degrees of partial melting (Fig. 7a, b).
5.c. Enrichment of the lithospheric mantle
5.c.1 HFSE enrichment and EMII component in the source region
The samples from the Maopin and Shaianjiao intrusions were not significantly modified by crustal contamination, as discussed above, and therefore can be used to constrain the nature of their source. They are rich in Nb, ten times greater than primitive mantle melts with similar degrees of melting (Fig. 7b). Therefore, negative Nb anomalies on the primitive mantle-normalized trace element patterns indicate an enrichment of LILE rather than depletion of HFSE by subduction-related processes such as retention in the residual mantle or slab minerals as suggested by Münker (Reference Münker2000). The high Nb and Zr contents of the Maopin and Shaianjiao mafic rocks cannot be explained simply by melting of primitive mantle, suggesting enrichment of these elements in the mantle source.
On plots of Pb isotope compositions (fig. 6a, b), samples from the Maopin and Shaianjiao intrusions, together with those from mafic dykes in Jiangxi province, fall to the left of the northern hemisphere reference line (NHRL). Compared with 206Pb/204Pb (18.26–18.522), the relatively large variations of 207Pb/204Pb (15.479–15.670) and 208Pb/204Pb (38.217–38.774) define a high-angle array away from the NHRL (Hart, Reference Hart1984) that extends from Pacific MORB to EMII end-member (fig. 6a, b). A generally positive correlation between 87Sr/86Sr and 206Pb/204Pb ratios and a negative correlation between 143Nd/144Nd and 206Pb/204Pb ratios also suggest that the mafic rocks have EMII-like components (fig. 6c, d). It should be noted that four samples from the Jiangxi province have relative low 143Nd/144Nd and 206Pb/204Pb ratios, suggesting enriched mantle type I (EMI) may have been involved, although Xie et al. (Reference Xie, Hu, Franco, Li, Cao, Jiang and Zhao2006) attributed this to mixing between EMII and depleted MORB mantle (DMM). Thus, the mafic rocks in SE China are not only enriched in HFSE, but also have EM-like components in their lithospheric mantle source.
5.c.2 OIB v. subducted sediment components in the source region
Two models are proposed to explain the nature of the mantle source (Fig. 6). The first model is mixing of a depleted asthenospheric mantle and an EMII-like lithospheric mantle source. The second model involves derivation of the melts from a depleted lithospheric mantle source which was contaminated by subduction components.
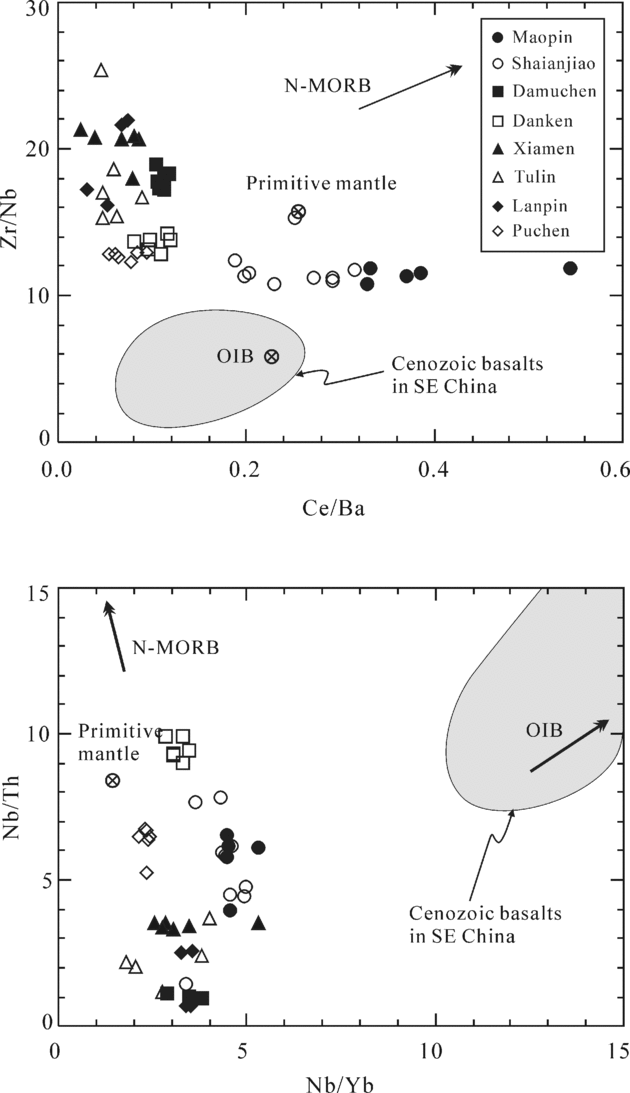
The relationship revealed in Figure 6 can be explained by mixing of a depleted asthenospheric mantle with an EMII-like lithosphere source. Depleted asthenospheric mantle beneath SE China has OIB-like geochemical characters as revealed by Cenozoic basalts (Qu, Taylor & Zhou, Reference Qu, Taylor and Zhou1994; Chung et al. Reference Chung, Sun, Tu, Chen and Lee1994; Zou et al. Reference Zou, Zindler, Xu and Qu2000; Ho et al. Reference Ho, Chen, Lo and Zhao2003), and such a mixing model has been proposed for some Mesozoic dykes in Jiangxi province (Xie et al. Reference Xie, Hu, Franco, Li, Cao, Jiang and Zhao2006). Although mixing of asthenospheric and lithospheric mantle would produce the good correlation between Pb and Sr isotopic ratios (Fig. 6) observed in the Fujian samples, it cannot explain their strong arc-like geochemical characteristics as shown on the primitive mantle normalized-trace element patterns (Fig. 4). The Fujian samples have trace element ratios distinctly different from OIB, N-MORB and Cenozoic basalts in SE China (Fig. 8, upper), and the negative correlation between Nb/Th and Nb/Yb in these rocks further rules out any contribution of asthenospheric components to their source (Fig. 8, lower).
Primitive mantle-normalized trace element diagrams for (a) the type-A and (b) type-P mafic rocks from the coastal area of Fujian province, SE China. Primitive mantle values are from Sun & McDonough (Reference Sun, McDonough, Saunders and Norry1989). The shaded field shows the predominant trace-element range of Cenozoic basalts of SE China (Zou et al. Reference Zou, Zindler, Xu and Qu2000).

Initial 143Nd/144Nd v. 87Sr/86Sr ratios for the mafic rocks from the coastal area of Fujian province. The mafic rocks from Fujian province, together with these from Jiangxi (Xie et al. Reference Xie, Hu, Franco, Li, Cao, Jiang and Zhao2006) and Guangdong provinces (Li & McCulloch, Reference Li, McCulloch, Flower, Chung, Lo and Lee1998), form a trend extending roughly toward the EMII end-member. The approximate fields of DMM, EMI and EMII are from Zindler & Hart (Reference Zindler and Hart1986). The fields for OIB, the East Taiwan Ophiolite (ETO), the East Pacific Rise MORB (Ho et al. Reference Ho, Chen, Lo and Zhao2003 and references therein) and Cenozoic basalts of SE China (Zou et al. Reference Zou, Zindler, Xu and Qu2000; Tu & Flower, Reference Tu and Flower1991) are shown for comparison. Plus symbols (+) represent Cenozoic basalts of SE China, cross symbols (×) are Late Mesozoic mafic dykes in SE China from Xie et al. (Reference Xie, Hu, Franco, Li, Cao, Jiang and Zhao2006) and Li & McCulloch (Reference Li, McCulloch, Flower, Chung, Lo and Lee1998).

Plots of (a) 206Pb/204Pb v. 207Pb/204Pb ratios, (b) 206Pb/204Pb v. 208Pb/204Pb ratios, (c) 206Pb/204Pb v. initial 87Sr/86Sr ratios and (d) 143Nd/144Nd for the Maopin and Shaianjiao intrusions compared with Cenozoic basalts in SE China (Zou et al. Reference Zou, Zindler, Xu and Qu2000; Tu & Flower, Reference Tu and Flower1991) and late Mesozoic mafic dykes from Jiangxi province (Xie et al. Reference Xie, Hu, Franco, Li, Cao, Jiang and Zhao2006). The samples with 206Pb/204Pb ratios less than 17.0 seem to show an EMI signature. NHRL is the Northern Hemisphere Reference Line (Hart, Reference Hart1984). The approximate fields of DMM, EMI and EMII are from Zindler & Hart (Reference Zindler and Hart1986). The fields for Pacific MORB and Central Indian MORB (CIM) are from Zou et al. (Reference Zou, Zindler, Xu and Qu2000).

Plots of Y v. Zr/Y (a) and Nb v. Yb (b) for the mafic rocks from Fujian province in comparison with the calculated melting curves of garnet lherzolite (Ga), garnet-spinel lherzolite (Ga-Sp), spinel lherzolite (Sp) and spinel-plagioclase lherzolite (Sp-Pl). Labels along melting curves indicate degrees of partial melting (0.1 indicates 10 % melting). Starting compositions are assumed to be Pri-mantle (Sun & McDonough, Reference Sun, McDonough, Saunders and Norry1989). Dashed lines are isograds of partial melting for different mantle sources. Partial melting partition coefficients (D values) are from Gorring & Kay (Reference Gorring and Kay2001). Source and melt modes are given in Table 4, and the starting compositions are given in Table 5. The equation CL/Co = (1-(1-PF/D)1/P)/F is used, where CL is the element concentration in the melt. The data for Cenozoic basalts of SE China are also shown for comparison (Zou et al. Reference Zou, Zindler, Xu and Qu2000). Sample symbols are same as in Figure 2.

Plots of Zr/Nb v. Ce/Ba and Nb/Th v. Nb/Yb for the mafic rocks from the coastal area of Fujian province. Primitive mantle, OIB and N-MORB values are from Sun & McDonough (Reference Sun, McDonough, Saunders and Norry1989). Cenozoic basalts of SE China are from Zou et al. (Reference Zou, Zindler, Xu and Qu2000).

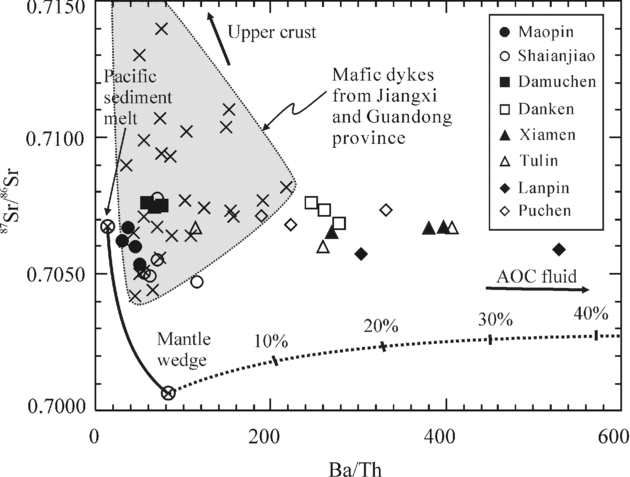
Alternatively, the primary magmas may have originated from a lithospheric mantle that had been enriched in incompatible trace elements and modified isotopically by melts or fluids derived from a subducted slab (Hawkesworth et al. Reference Hawkesworth, Kempton, Rogers, Ellan and van Calsteren1990; Mukasa, Fischer & Barr, Reference Mukasa, Fischer and Barr1996). Oceanic crust is composed of basaltic rocks covered by sediments. Melting of the MORB portion of the subducted slab requires unusually steep thermal gradients and is limited to young and relatively hot oceanic crust (Peacock, Rushmer & Thompson, Reference Peacock, Rushmer and Thompson1994; Stern & Kilian, Reference Stern and Kilian1996). Subducted sediment therefore is a more likely source of Nb in this environment. Entrainment of subducted sediment into the mantle wedge occurs as melt rather than by bulk mixing (Nichols, Wyllie & Stern, Reference Nichols, Wyllie and Stern1994; Hawkesworth et al. Reference Hawkesworth, Turner, McDermott, Peate and van Calsteren1997). Calculations reveal that addition of less than 1 % subducted sediment-derived melt to the mantle wedge can explain the Nb compositions of the samples from Fujian province (Fig. 9). Samples from the Maopin and Shaianjiao intrusions experienced the highest source contamination, which is consistent with their position near the mixing line between the mantle wedge and Pacific sediment melts in Figure 10. Samples from the Puchen and Danken dykes approximately match the melting line of lherzolite mantle in Figure 9, suggesting no subducted slab melts were involved in their formation.
Plot of Nb v. Yb for the mafic rocks from Fujian province in comparison with the calculated mixing curves. Mixing end-members are partial melts of a spinel lherzolite mantle and Pacific sediment melts (5 % degree partial melting). Labels along curves indicate degree of partial melting. Dashed lines connect identical degrees of partial melting. Melting curve for spinel lherzolite is the same as in Figure 7, and sample symbols are the same as in Figure 2.

Plots of initial 87Sr/86Sr v. Ba/Th for the mafic rocks from the coastal area of Fujian province. Solid line is a mixing curve between the mantle wedge and the sediment melt. Dotted line is mixing curve between the mantle wedge and the slab-derived fluid. Labels along this line are percentage of fluids involved. Samples from the mafic dykes in the Jiangxi (Xie et al. Reference Xie, Hu, Franco, Li, Cao, Jiang and Zhao2006) and Guangdong provinces (Li & McCulloch, Reference Li, McCulloch, Flower, Chung, Lo and Lee1998) have high radiogenic 87Sr/86Sr ratios and low Ba/Th ratios, suggesting strong crustal contamination. Mixing end-members are listed in Table 5.

5.c.3 Enrichment by fluids from a subducted slab
In the 87Sr/86Sr v. Ba/Th diagram (Fig. 10), all of the Fujian samples fall to the right of the mixing line between the lithospheric mantle and sediment melts. The high Ba/Th ratios (29.8–1100) and their negative correlation with 87Sr/86Sr ratios imply the addition of another component to the mantle source of these rocks. Fluids derived from subducted slabs are the principal carriers of incompatible elements and promote metasomatism in the mantle wedge (Stolper & Newman, Reference Stolper and Newman1994; Johnson & Plank, Reference Johnson and Plank1999). Cervantes & Wallace (Reference Cervantes and Wallace2003) demonstrated that fluxing of the wedge with an H2O-rich component from the subducted slab is important in the formation of magmas rich in LILE and LREE relative to HFSE, producing a source with high LILE/HFSE ratios. The high Ba/Th ratios of the Fujian samples, especially those from the Xiamen and Tulin dykes, suggest that a large amount of slab-derived fluid was involved in their petrogenesis (Fig. 10).
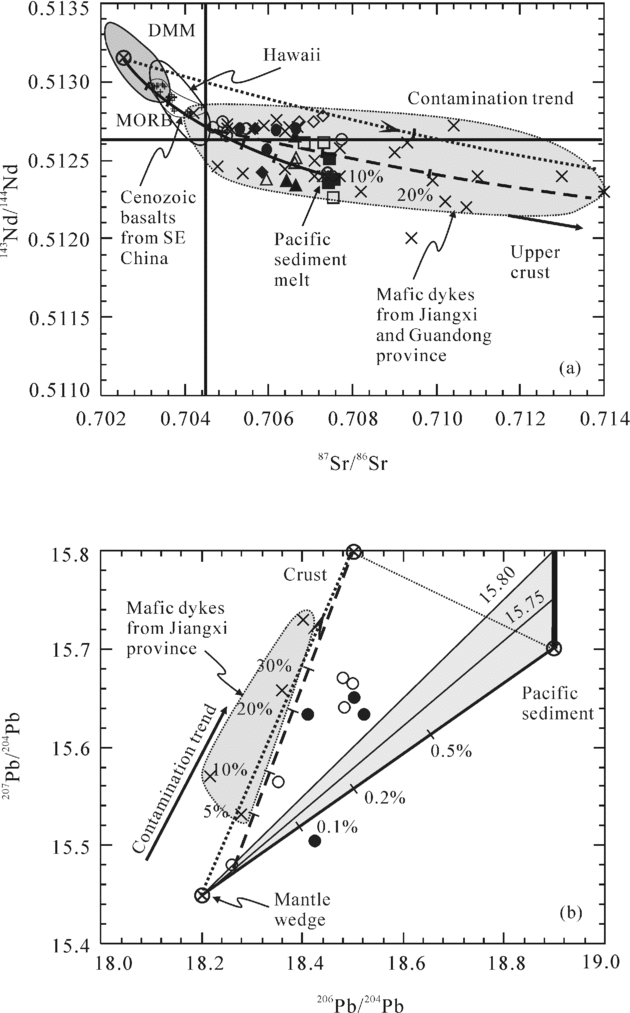
Geochemically, the two different types of mafic rocks in Fujian province could have been produced by heterogeneous modification of the mantle source by subduction components. However, such a model cannot explain the high 87Sr/86Sr and 207Pb/204Pb ratios of the mafic rocks from the Maopin and Shaianjiao intrusions, which plot above the mixing line between DDM and average Pacific sediment melt, although the isotopic compositions of the Pacific sediments are assumed to have 87Sr/86Sr and 207Pb/204Pb ratios as high as 0.7150 and 15.80, respectively (fig. 11a, b). In addition, samples from Jiangxi and Guangdong provinces have 87Sr/86Sr ratios as high as 0.714, suggesting that crustal contamination was widespread in eastern China. Thus, we propose that although crustal contamination played a major role in determining the geochemistry of these rocks, it did not significantly influence HFSE and HREE abundances, as discussed above. The isotopic variations of these rocks can be readily explained by a three-component mixing model: mantle wedge, crustal component and subducted sediment melt (Fig. 11). Less than 1 % source assimilation combined with 20 % crustal contamination can explain the chemical compositions in the Fujian mafic rocks. Some dykes, such as those from Jiangxi and Guangdong provinces, require more than 20 % crustal components to account for their composition (Fig. 11).
Plots of (a) 87Sr/86Sr v. 147Nd/144Nd ratios and (b) 206Pb/204Pb-207Pb/204Pb ratios for the rocks from the mafic dykes, SE China. Samples with 206Pb/204Pb less than 18 are not included due to their abnormal EMI features. Solid lines are mixing curves between the mantle wedge and the sediment melt. 207Pb/204Pb ratios for the subducted sediment are assumed to vary from 15.70 to 15.80 (Plank & Langmuir Reference Plank and Langmuir1998). Shaded area represents source contamination field. Dotted lines with arrows are mixing lines between mantle wedge and continental crust components. Dashed line is calculated by mixing between sample XC5 and crustal components, labels along the curve are degrees of crustal contamination, suggesting that up to 20 % continental crust was involved in the magma petrogenesis. Mixing end-members used in the calculation are listed in Table 5. Sample symbols are same as in Figure 10.

5.d. Secular evolution of the lithospheric mantle beneath SE China
Geological and geophysical evidence indicates that at least 100 km of Archaean to Proterozoic lithospheric mantle has been removed beneath southeastern China since late Mesozoic times (Xu et al. Reference Xu, O'Reilly, Griffin and Zhou2000). This lithospheric thinning resulted from two separate episodes of chemical and mechanical modification.
Collision between the Palaeo-Pacific Plate and Eurasian Plate occurred in the Palaeozoic (Maruyama et al. Reference Maruyama, Isozaki,, Kimura, and Terabayashi,1997). Melts and fluids derived from the subducted Pacific slab were introduced into the lithospheric mantle during the Mesozoic, and the Proterozoic lithosphere was heterogeneously replaced by arc-like lithosphere (Zheng et al. Reference Zheng, O'Reilly, Griffin, Zhang, Lu and Liu2004). Most mafic dykes in SE China show arc-like geochemical characteristics, suggesting widespread and extensive modification by slab materials (Li & McCulloch, Reference Li, McCulloch, Flower, Chung, Lo and Lee1998; Dong et al. Reference Dong, Zhang, Xu, Yen and Zhu2006; Xie et al. Reference Xie, Hu, Franco, Li, Cao, Jiang and Zhao2006). The type-P rocks from the Puchen and Danken dykes show primitive mantle-like trace element patterns (Fig. 4b), suggesting that their source region may have been residual Proterozoic lithosphere.
During late Mesozoic times, subduction of the Palaeo-Pacific plate initiated continental extension, which led to upwelling of the asthenospheric mantle, producing voluminous felsic magmatism (Lapierre et al. Reference Lapierre, Jahn, Charvet and Yu1997; Li, Reference Li2000) associated with mafic magmas (Li & McCulloch, Reference Li, McCulloch, Flower, Chung, Lo and Lee1998; Xie et al. Reference Xie, Hu, Franco, Li, Cao, Jiang and Zhao2006). This suggests that the Mesozoic lithosphere was hotter than the Palaeozoic lithosphere. The upwelling asthenosphere may have triggered melting of the previously enriched and highly modified lithosphere to produce the mafic dykes and plutons described in this paper. The occurrence of mafic dykes in Jiangxi, Fujian and Guandong provinces suggest that lithospheric extension was active and widespread in southeast China during late Mesozoic times.
Cenozoic basalts in SE China were mainly derived from asthenospheric mantle material (Flower et al. Reference Flower, Zhang, Chen, Tu and Xie1992; Liu, Masuda & Xie, Reference Zhang, Wang, Chen, Liu, Yu, Wu and Lan1994; Qu, Taylor & Zhou, Reference Qu, Taylor and Zhou1994; Zou et al. Reference Zou, Zindler, Xu and Qu2000) and have OIB (Zou et al. Reference Zou, Zindler, Xu and Qu2000) and EMII-like signatures (Chung et al. Reference Chung, Jahn, Chen, Lee and Chen1995; Ho et al. Reference Ho, Chen, Lo and Zhao2003). Their formation was also related to asthenospheric upwelling and lithospheric extension (Yu et al. Reference Xu, O'Reilly, Griffin and Zhang2003), resulting in thermal and mechanical erosion. Sun & McDonough (Reference Sun, McDonough, Saunders and Norry1989) suggested that later intraplate melts may overprint or even erase arc-like geochemical signatures from lithospheric mantle that had been previously modified by subduction-related processes, but that EMII signatures would be preserved. The strong OIB character of the Cenozoic basalts in southeastern China suggests that the Mesozoic arc-like lithosphere in this region may have been consumed or completely modified. The EMII signatures of these basalts may have been derived from continental lithospheric mantle affected by Mesozoic subduction (Tu & Flower, Reference Tu and Flower1991; Flower et al. Reference Flower, Zhang, Chen, Tu and Xie1992; Chung et al. Reference Chung, Sun, Tu, Chen and Lee1994; Zhang et al. Reference Zhang, Tu, Xie and Flower1996).
6. Conclusions
(1) Most of the Mesozoic mafic plutons in SE China have arc-like geochemical features strongly indicating derivation from an EMII-like mantle source. Minor mafic dykes show primitive mantle-like trace element patterns and were probably derived from a mantle source unmodified by subduction.
(2) Parental magmas of the mafic rocks from the Fujian province are believed to have formed by about 5–15 % partial melting of a spinel lherzolite mantle source. The magmas for the type-A rocks were derived from subduction-modified lithospheric mantle, whereas the type-P rocks were derived from a mantle source unmodified by subduction. Both types of rocks experienced high degrees of crustal contamination.
(3) Proterozoic lithospheric mantle beneath SE China was heterogeneously modified by subduction components to become the Mesozoic arc-like lithospheric mantle. Subsequent upwelling of asthenospheric material in the Cenozoic completely erased the arc signatures of the mantle but preserved its EMII signature.
Acknowledgements
This work was jointly supported by the Knowledge-Innovation Program of the Chinese Academy of Sciences (KZCX3-SW-125) and Outstanding Young Researcher Awards from National Natural Sciences Foundation of China (40129001 and 49925309 to Hu and Zhou). We appreciate comments and constructive suggestions by journal editor Dr David Pyle and three anonymous reviewers.