Introduction
Eating disorders (EDs), including anorexia nervosa (AN), bulimia nervosa (BN) and binge eating disorder (BED), are mental illnesses associated with significant physical and psychological impairment (Butterfly Foundation, 2012) and premature death (Franko et al., Reference Franko, Keshaviah, Eddy, Krishna, Davis, Keel and Herzog2014) with AN having the highest mortality rate of any psychiatric illness (Arcelus et al., Reference Arcelus, Mitchell, Wales and Nielsen2011). In Australian women, the lifetime prevalence rates of AN and partial AN (or AN broad – absence of amenorrhea) are 4.3% and 4–7% for BN (Wade et al., Reference Wade, Bergin, Tiggemann, Bulik and Fairburn2006; Madden et al., Reference Madden, Morris, Zurynski, Kohn and Elliot2009). The three-month prevalence has been estimated at: 0.46% for AN-broad, 0.66% for BN, 0.3% for avoidant/restrictive food intake disorder (ARFID), 1.5% for BED broad (defined as participants with weekly or more frequent objective binge eating episodes associated with ‘a lot’ of distress, and BMI ⩾ 18.5), 32% for other specified feeding or eating disorder (OSFED) and 10.4% for unspecified feeding or eating disorder (UFED – most recurrent binge eating without marked distress) (Hay et al., Reference Hay, Mitchison, Collado, González-Chica, Stocks and Touyz2017).
It is well established that EDs have a substantial impact on health-related quality of life (HRQoL), with the degree of reported impairment increasing with the severity of the ED (Jenkins et al., Reference Jenkins, Hoste, Meyer and Blissett2011; Ágh et al., Reference Ágh, Kovács, Supina, Pawaskar, Herman, Vokó and Sheehan2016). For instance, compared to the general population, people with ED have lower scores in all areas of HRQoL (e.g. pain, social, emotional and mental health subscales) as measured by the Medical Outcomes Study Short Form-36 Health Survey (SF-36) (Winkler et al., Reference Winkler, Christiansen, Lichtenstein, Hansen, Bilenberg and Støving2014). However, the impact of specific ED characteristics (e.g. binge eating, distress associated with binge eating) on HRQoL is a relatively neglected area of research (Jenkins et al., Reference Jenkins, Hoste, Meyer and Blissett2011; Winkler et al., Reference Winkler, Christiansen, Lichtenstein, Hansen, Bilenberg and Støving2014; Ágh et al., Reference Ágh, Kovács, Supina, Pawaskar, Herman, Vokó and Sheehan2016).
Research has shown that people with a high-body mass index (BMI) have significantly lower levels of HRQoL, compared to those with the normal BMI. Findings have been mixed for people with an extremely low BMI, particularly for people with AN who may not report QoL impairment (Jenkins et al., Reference Jenkins, Hoste, Meyer and Blissett2011; Winkler et al., Reference Winkler, Christiansen, Lichtenstein, Hansen, Bilenberg and Støving2014; Ágh et al., Reference Ágh, Kovács, Supina, Pawaskar, Herman, Vokó and Sheehan2016). Furthermore, it is unclear whether the relationship between the BMI and QoL is consistent in those with and without an ED. Such information is particularly valuable to decision-makers who compare the burden of disease estimates and the impacts of health care interventions on the ED conditions to allocate health expenditure.
Economic evaluation has become an important tool for comparing costs and consequences of different interventions to assist decision-makers in allocating health resources. Yet, there is limited evidence on economic evaluations conducted within the context of EDs and comparisons across conditions are constrained because of the use of different outcome measures (Le et al., Reference Le, Hay and Mihalopoulos2018). A common generic measure that enables such comparisons is the quality-adjusted life year (QALY). QALYs combine a person's quality of life and quantity of life into a common metric (Drummond et al., Reference Drummond, Sculpher, Torrance, O'Brien and Stoddart2015). However, to date, cost-utility analyses using QALYs as an outcome metric have been limited in EDs. One reason is that there is little information available regarding health state utility values (HSUVs) for EDs, which inform the ‘Q-component’ of QALY. HSUVs are preference scores/weights associated with a health condition anchored on a scale from 0 to 1, where a value of 1 represents full health, and 0 is equivalent to being dead (Drummond et al., Reference Drummond, Sculpher, Torrance, O'Brien and Stoddart2015). It is possible to score a negative HSUV, this denotes a life worse than dead. The length of time affected by any health state is then multiplied by the specific HSUV associated with that health state in order to derive the QALY estimate. Moreover, HSUV estimates for specific disorders allow comparisons to population norms (Norman et al., Reference Norman, Church, van den Berg and Goodall2013) to determine the potential disease burden of these conditions.
The aim of the current study was to estimate HSUVs for the full spectrum of EDs according to Diagnostic and Statistical Manual of Mental Disorders-5 (DSM-5) criteria including BN, BED-broad and ARFID by using a large population-based sample of South Australian (SA) adults. Furthermore, we aim to estimate HSUVs for subthreshold disorders such as OSFED, AN-broad and UFED since these are less well established and have not previously been studied in this context. A further aim was to investigate the association between ED symptoms (e.g. binge eating frequency and distress related to binge eating episodes) and the corresponding HSUVs in those with and without an ED. Finally, the study aimed to investigate the possible moderating role of weight status in the relationship between ED and HSUVs.
Methods
This study analysed the HRQoL (used to determine HSUVs), anthropometry and social-demographic data collected in two consecutive SA Health Omnibus surveys undertaken in 2015 and 2016. The Health Omnibus is an annual survey conducted by Harrison Health Research under the auspices of the SA Health Commission and the University of Adelaide (Taylor et al., Reference Taylor, Dal Grande and Wilson2006). These surveys were undertaken to provide data on demographic characteristics, health conditions and health service use.
In brief, the Health Omnibus is a population-based household survey using face-to-face interviews of ~3000 individuals aged 15 years or over, from randomly selected urban areas and country towns with a population of at least 1000 people in SA. This survey achieved a participation rate of 66% in 2015 and 68% in 2016. The most frequent reason for no participation was refusal. Data from both surveys were pooled in order to increase the power of the study to examine subgroups. The surveys were approved by the University of Adelaide Human Research Ethics Committee and all participants provided informed consent. Additional information about the survey methodology has been reported elsewhere (Hay et al., Reference Hay, Girosi and Mond2015; Mitchison et al., Reference Mitchison, Touyz, González-Chica, Stocks and Hay2017).
Measurement
Health state utility values
HRQoL was assessed in both surveys by using the Medical Outcomes Study Short Form (12-item), version 1 (SF-12v1) (Ware et al., Reference Ware, Kosinski and Keller1996). Scores from SF-12 were converted to utility-based SF-6D scores (the HSUVs) using the published algorithm by Brazier and Roberts (Reference Brazier and Roberts2004). The SF-6D is a generic multi-attribute utility measure (MAUI), generating 18 000 possible health states. Composite utility scores for SF-6D health states range from 0.30 to 1.0, where 1.0 represents full health. The SF-6D captures six dimensions, including physical functioning, role limitation, social functioning, pain, mental health and vitality. Each domain has between three and five levels, with higher scores on the dimensions reflecting poorer health.
Eating disorder diagnoses and symptoms
In the Health Omnibus survey, EDs were established based on diagnostic questions derived from the ED examination [16], a structured interview used to assign ED diagnosis. These questions focused on four ED features: (1) binge eating (objective and subjective – the latter was reported in the 2016 survey only); (2) purging and extreme dietary restriction; (3) overvaluation of weight or shape and (4) the presence of extreme dietary restriction/fasting.
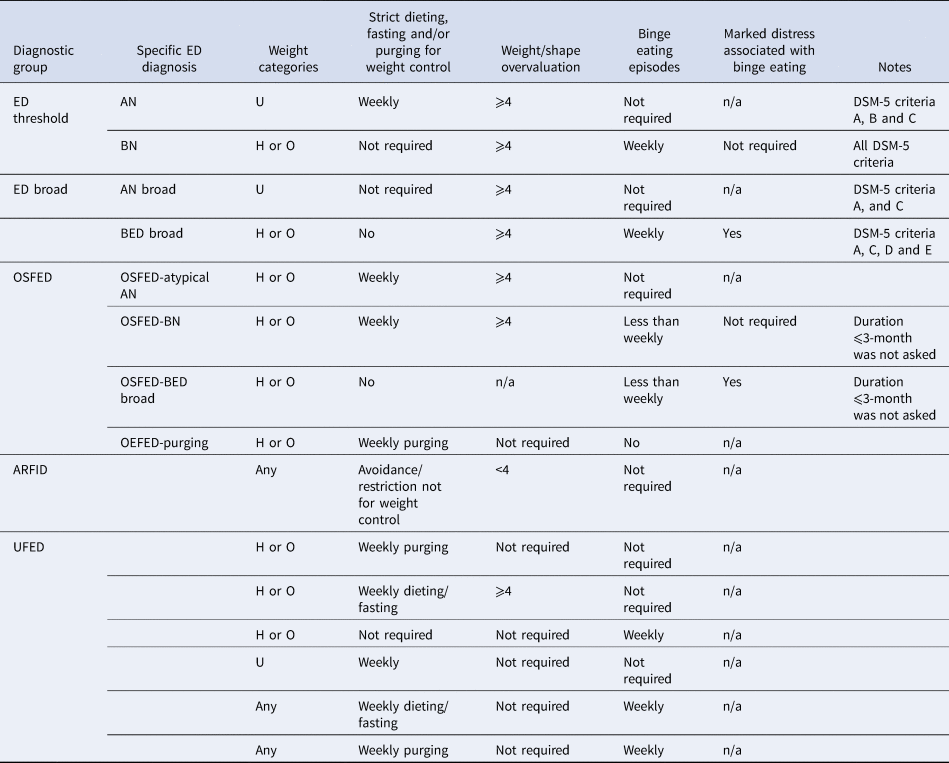
In addition, questions were asked assessing the presence and reasons for current food avoidance/restriction based on DSM-5 criteria for ARFID. Based on the assessed ED features, mutually exclusive DSM-5 diagnostic categories of EDs were determined using the algorithms from previous publications (Hay et al., Reference Hay, Girosi and Mond2015; Hay et al., Reference Hay, Mitchison, Collado, González-Chica, Stocks and Touyz2017). These exclusive groups include ED threshold (AN, BN and BED broad); ED subthreshold [i.e. subthreshold diagnoses are people with a clinical level of ED symptoms – AN broad; OSFED (OSFED-BN, OSFED-BED, OSFED-atypical AN and OSFED-purging); ARFID, UFED (UFED with or without BMI criteria)] and no ED diagnosis. The specific criteria for each ED threshold and subthreshold diagnoses are presented in Table 1. For establishing the ARFID diagnosis group, the following question was asked by interviewers: ‘Are you currently avoiding or restricting eating any foods to the degree that you have lost a lot of weight and/or become lacking in nutrition (e.g. have low iron) and/or had problems with family, friends or at work?’. The participants can choose across option: ‘1. Yes – for cultural or medical reason e.g. Lent, Ramadan, nut or other food allergy, 2. Dieting to prevent weight gain, 3. Yes – because of food dislike or fear of swallowing or any other reason, 4. No’. Those who endorsed three criteria above and who had weight/shape overvaluation <4 were identified as ARFID.
Eating disorder diagnostic categories based on DSM-5 (American Psychiatric Association, 2013) – Adapted from Hay et al. (Reference Hay, Mitchison, Collado, González-Chica, Stocks and Touyz2017)

U, underweight; H, healthy weight; O, overweight or obese; AN, anorexia nervosa; BN, bulimia nervosa; BED, binge eating disorder; OSFED, other specified feeding or eating disorder; UFED, unspecified feeding or eating disorder; ARFID, avoidant/restrictive food intake disorder.
Finally, the frequency of objective binge eating episodes (not at all, <weekly, once weekly, or twice or more per week) and the level of distress associated with binge eating (not at all, a little, or a lot) were used to generate two additional binary variables explored as ED symptoms (binge eating episodes no/yes; distress associated with binge eating no/yes).
Sociodemographic information and body mass index
Sociodemographic information collected included gender, age, highest educational attainment, marital status, country of birth and working status. The BMI was calculated from self-reported height and weight. Body weight categories were assigned based on the recommendation from the Centers for Disease Control and Prevention (CDC BMI-for-age), which has different classification rules between children and adult (Centers for Disease Control and Prevention, 2000). These categories include underweight (<the 5th percentile if children under 21 years and BMI <18.5 kg/m2 if adults aged 21 years and over); healthy weight (5th percentile to <85th percentile if children under 21 years and 18.5 ⩽ BMI <25 kg/m2 if adults aged 21 years and over) and overweight or obese (⩾85th percentile if children under 21 years and BMI ⩾ 25.0 kg/m2 if adults aged 21 years and over).
Data analysis
Data in both years were weighted based on the inverse of the individuals' probability of selection, then re-weighted to the population distribution in the Australian Census. Individuals with missing utility scores (n = 24) or BMI (n = 443) were excluded from all analyses using listwise deletion methods. All statistical analyses were performed using Stata 15.0 (StataCorp, Texas, USA).
Descriptive statistics
Descriptive statistics of HSUVs for each ED diagnostic groups were estimated overall and by sociodemographic variables. The means of HSUVs were tested against sociodemographic variables by using t tests or analysis of variance (ANOVA) statistical techniques, as appropriate.
Comparison HSUVs between ED diagnosis and no ED diagnosis
Multiple linear regression models, with or without adjustment for sociodemographic covariates, were used to detect the mean differences in HSUVs between those who had or did not have an ED diagnosis. Age, sex, working status, marital status, country of birth and education were used as covariates for adjustment because of their association with HSUVs (p value <0.05). The severity of multicollinearity was checked using the variance inflation factor, with values higher than ten indicating further investigation may be required.
Association between ED symptoms or weight status and HSUVs
Crude and adjusted regression models were also used to explore the relationship between ED symptoms (objective binge eating episodes or distress associated with objective binge eating), weight status (healthy weight, underweight or overweight or obese) and HSUVs in the whole sample. Multiplicative terms between each of these variables and the presence of ED were then included in the regression models and considered as indicative of effect modification when a p value <0.05 was obtained. Results were then stratified according to the presence or absence of an ED.
Results
Characteristics of the studied populations
A total of 5609 participants provided complete data for classifying ED diagnosis groups, of which 983 (17.5%, the point prevalence) met diagnostic criteria for threshold and subthreshold EDs (34% in males and 66% in females). There were 147 (3%) who met diagnostic criteria for ED threshold (BN & BED broad). No AN case was found but 32 (0.6%) met AN-broad diagnostic criteria. The mean age of people with EDs was 40.0 (s.d. = 16.8) years, which was younger than those without EDs (48.8, s.d. = 19.4). Participants with ED threshold had the highest BMI (mean 32.0, s.d. = 7.5) and participants with AN-broad had the lowest BMI (17.8, s.d. = 0.6). A lower proportion of participants with a bachelor's degree or higher qualification was found in the group of those who met diagnostic criteria for ED threshold (11.6%) or AN broad (9%) compared to other groups (overall 23.1%). Details of demographic characteristics of participants in this survey can be found elsewhere (Hay et al., Reference Hay, Mitchison, Collado, González-Chica, Stocks and Touyz2017).
Health state utility values of eating disorders
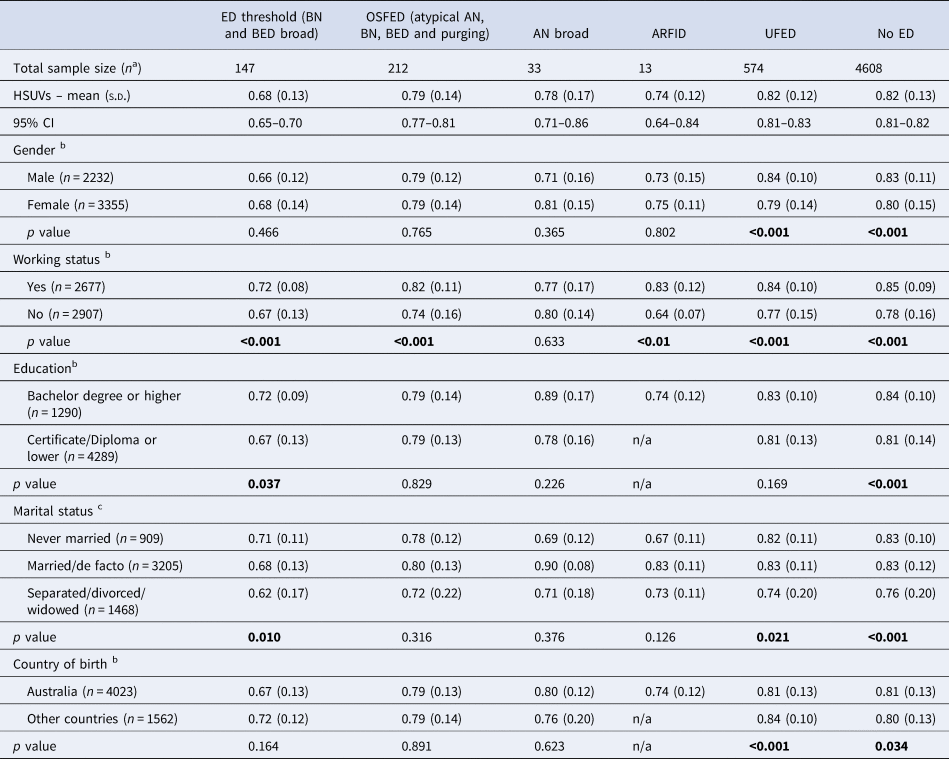
The mean HSUV in the sample was 0.81 (s.d. = 0.13). Table 2 shows unadjusted associations between the sociodemographic variables and HSUVs, stratified by the presence of an ED diagnosis. The average HSUV was lowest in the ED threshold group (0.68, s.d. = 0.13), followed by the ARFID group (0.74, s.d. = 0.14), the AN-broad group (0.78, s.d. = 0.16) and the OSFED group (0.79, s.d. = 0.14). Except for AN broad, people not currently working showed lower HSUVs than their peers, regardless of their ED condition. Marital status and education were inversely associated with HSUVs only among those with an ED threshold or without an ED. People with UFED who were born in Australia had significantly lower HSUVs than those born overseas.
Unadjusted means and standard deviation of HSUVs according to sociodemographic variables among individuals aged 15 + years in South Australia (N = 5609)

ED, eating disorder; OSFED, other specified feeding and eating disorder; AN, anorexia nervosa; BN, bulimia nervosa; BED, binge eating disorder; ARFID, avoidant/restrictive food intake disorder; UFED, unspecified feeding or eating disorder; s.d., standard deviation; BMI, body mass index.
a unweighted sample size was reported.
b t test.
c ANOVA test.
Comparison with non-eating disorder population
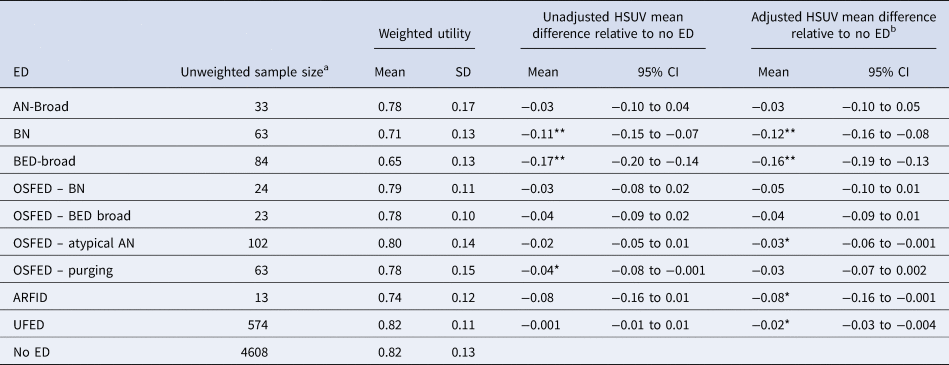
Table 3 shows the crude and adjusted analyses between each ED and HSUVs. People who met the diagnosis for BED broad or BN had the lowest mean HSUV (0.65 points s.d. = 0.13 and 0.71 s.d. = 0.13, respectively). Compared to those without an ED, mean HSUV differences were −0.16 (95% CI −0.19 to −0.13) for BED and −0.12 (95% CI −0.16 to −0.08) for BN after adjusting for covariates. People with ARFID, OSFED-atypical AN or UFED were also found to have significantly lower HSUVs than those without an ED in adjusted results.
Crude and adjusted associations between EDs and HSUVs among individuals aged 15 + years in South Australia (N = 5609)

ED, eating disorder; OSFED, other specified feeding and eating disorder; AN, anorexia nervosa; BN, bulimia nervosa; BED, binge eating disorder; ARFID, avoidant/restrictive food intake disorder; UFED, unspecified feeding or eating disorder; s.d., standard deviation; CI, confidence interval.
a Those who had missing data were excluded in the analysis.
b Adjusted for age, sex, working status, marital status, country of birth and education.
**p < 0.001; *p < 0.05.
Association between eating disorder symptoms, weight categories and health state utility values
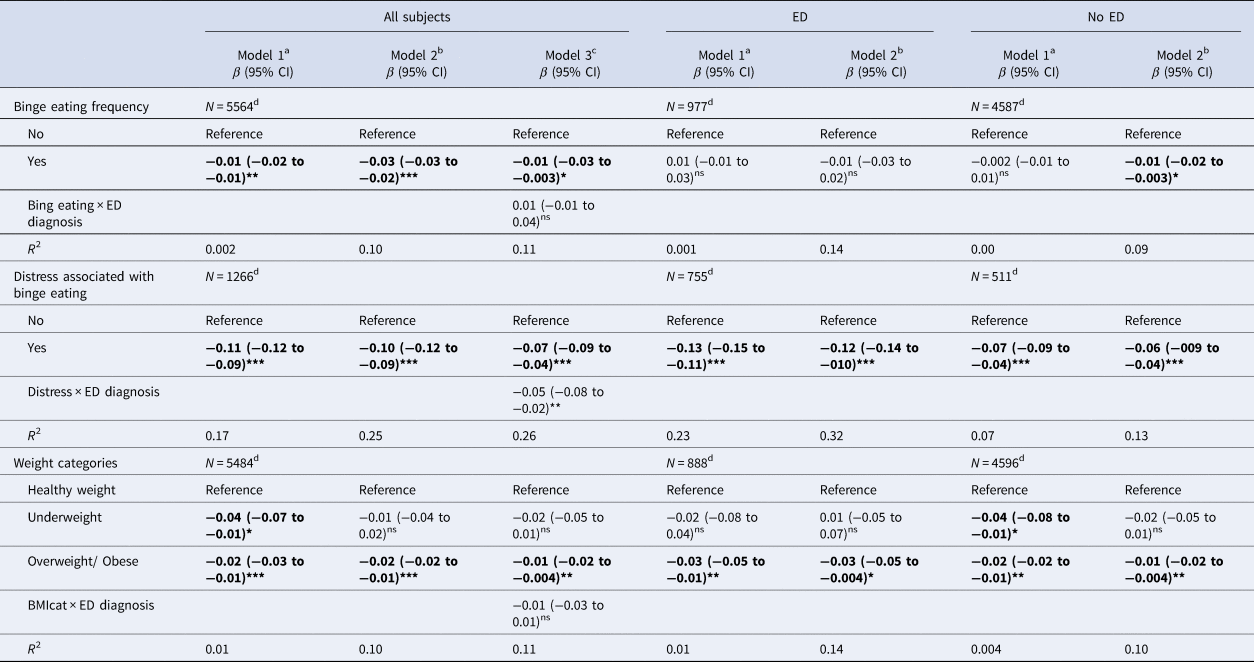
There were 1279 people (or 23% of total samples) who reported objective binge eating episodes. Four hundred and eighty-two people (8.5% of the total samples) reported distress associated with binge eating. Binge eating episodes were associated with impairment in HSUV in adjusted and unadjusted analysis for all subjects (adjusted difference = −0.01, 95% CI −0.03 to −0.003) or adjusted analysis for people without an ED (adjusted difference = −0.01, 95% CI −0.02 to −0.003). Participants who reported distress associated with binge eating had significant lower HSUVs than those without reported distress associated with binge eating in both ED (adjusted difference = −0.12, 95% CI −0.14 to −0.10) and non-ED groups (adjusted difference = −0.06, 95% CI −0.09 to −0.04) (Table 4). The association between distress associated with objective binge eating and HSUVs was greater in people with an ED compared to those without an ED (p value for interaction <0.05). Conversely, there was no evidence of interaction between the frequency of objective binge eating and the presence of ED in the association with HSUVs.
Association between ED symptoms or weight status and HSUVs among individuals aged 15 + years in South Australia (N = 5609)

ED, eating disorders; R 2, multiple correlation coefficient squared; β, unstandardized regression coefficients; CI, confidence interval; ns, non-significant.
Statistically significant findings are reported in bold.
a Model 1 – unadjusted.
b Model 2 – adjusted for age, sex, working status, marital status, country of birth and education.
c Model 3 – adjusted for age, sex, working status, marital status, country of birth and education and the interaction between ED symptoms or BMI categories and the presence of ED.
d Unweighted sample size.
*p < 0.05; ** p < 0.01; ***p < 0.001.
Table 4 shows that people who had high BMI had significantly lower HSUVs than individuals who had healthy weight in ED (adjusted difference −0.03, 95% CI−0.05 to −0.004) and non-ED groups (adjusted difference −0.01, 95% CI −0.02 to −0.004). The interaction effect between BMI categories and the presence of ED was not significant.
Discussion
This population-based study provides a comprehensive assessment of the burden of EDs based on the most recent diagnostic criteria of DSM-5. The point prevalence of threshold and subthreshold EDs (18%) reported in this study is consistent with previous Australian studies (Hay et al., Reference Hay, Mitchison, Collado, González-Chica, Stocks and Touyz2017; Mitchison et al., Reference Mitchison, Mond, Bussey, Griffiths, Trompeter, Lonergan, Pike, Murray and Hay2019). Importantly, this figure includes a broad range of EDs and is consistent with international estimates in the literature (e.g. Galmiche et al. (Reference Galmiche, Déchelotte, Lambert and Tavolacci2019) reported weighted means (ranges) of point prevalence of any EDs were reported at 19.4% (6.5–36%) for women and 13.8% (3.6–27.1%) for men). For established EDs such as BN and BED, the point prevalence from this study (3%) is consistent with the figures reported in the literature (Galmiche et al. (Reference Galmiche, Déchelotte, Lambert and Tavolacci2019) reported 5.7% (0.9–13.5%) for women and 2.2% (0.2–7.3%) for men). It is noteworthy that this study did not found any threshold current (3-month) cases of AN is consistent with variable prevalence of AN that has been reported in the literature. In particular, a meta-analysis by Galmiche et al. (Reference Galmiche, Déchelotte, Lambert and Tavolacci2019) reported the weighted mean range of AN 12-month prevalence was zero to 0.8% for women and zero to 0.2% for men. Thus, the true point prevalence of AN appears to be low and may be undetectable in community surveys. Reluctance to participate in such surveys and/or disclose symptoms may be an added factor where there is a high degree of personal and community endorsement of AN behaviours compared to other mental health problems (Guarda, Reference Guarda2008; Star et al., Reference Star, Hay, Quirk and Mond2015). This study showed that the SF-6D could measure the impacts of EDs since the HSUVs of those with EDs were less than those without. To our knowledge, this is the first study that has provided a set of consistently derived HSUVs across ED diagnostic categories, a range of key socioeconomic backgrounds and disease-specific symptoms. These values can be used in future economic modelling studies to inform input parameters.
Only a few studies have investigated the HSUVs of different diagnoses within their samples in EDs (Jenkins et al., Reference Jenkins, Hoste, Meyer and Blissett2011; Winkler et al., Reference Winkler, Christiansen, Lichtenstein, Hansen, Bilenberg and Støving2014). Findings consistently support the conclusion that EDs are associated with lower HSUVs. As expected, the level of HSUV impairment was closely related to the severity of the underlying ED. People with BN and BED broadly experience mean utility differences of −0.12 and −0.15, respectively. These differences were three times larger than 0.041, which is the mean of the minimally important difference for SF-6D utility scores as reported by Walters and Brazier (Reference Walters and Brazier2005). People with sub-threshold EDs or UFED experienced slightly lower HSUVs than those without an ED. Interestingly, the results showed that the HSUVs of ED thresholds, especially BED broad (0.65), are comparable to HSUVs of generalised anxiety disorders (0.63–0.66), depression (0.55), schizophrenia (0.68–0.71), panic disorders (0.65) or mood disorders (0.65) reported using the SF-6D (Mulhern et al., Reference Mulhern, Mukuria, Barkham, Knapp, Byford and Brazier2014; Prigent et al., Reference Prigent, Auraaen, Kamendje-Tchokobou, Durand-Zaleski and Chevreul2014; Roberts et al., Reference Roberts, Lenton, Keetharuth and Brazier2014).
Importantly, this is also the first study that has reported significant impairment of HSUVs in those with ARFID, a newly described diagnosis in DSM-5. The prevalence of ARFID ranges from 1.5% to 14% in paediatric inpatient ED programs and up to 22.5% in paediatric day treatment programs (Nicely et al., Reference Nicely, Lane-Loney, Masciulli, Hollenbeak and Ornstein2014; Norris et al., Reference Norris, Robinson, Obeid, Harrison, Spettigue and Henderson2014; Eddy et al., Reference Eddy, Thomas, Hastings, Edkins, Lamont, Nevins, Patterson, Murray, Bryant-Waugh and Becker2015; Nakai et al., Reference Nakai, Nin, Noma, Hamagaki, Takagi, Teramukai and Wonderlich2017). Young people with ARFID usually require more enteral nutrition and longer hospitalization periods than those with AN (Strandjord et al., Reference Strandjord, Sieke, Richmond and Rome2015). A previous publication using data from one of the same surveys as this study showed that people with ARFID had significantly lower scores on ‘role performance’ and ‘mental health’ on the SF-12 compared to those without an ED (Hay et al., Reference Hay, Mitchison, Collado, González-Chica, Stocks and Touyz2017). Therefore, further research is required to validate this diagnostic category as a distinct ED diagnosis in DSM-5.
Our findings also highlighted the inverse relationship between distress associated with objective binge eating and HSUV among individuals with and without an ED. This may explain the finding that people with BED broad had the lowest HSUVs compared to those with other types of EDs. Furthermore, our study found that a subgroup of people who did not report strict dieting, fasting and/or purging for weight control and had less than weekly binge eating and ‘a little’ distress did not met any criteria for an ED but had significantly lower HSUVs compared to those without distress associated with binge eating. The relatively impaired HRQoL for this group casts some doubt whether they should be regarded as subthreshold disorders. Previous research studies highlighted a relationship between once and twice weekly binge eating episodes and HRQoL (Mitchison et al., Reference Mitchison, Touyz, González-Chica, Stocks and Hay2017). Our study has added an important finding that the presence of binge eating was associated with impairment in HSUVs in those without an ED rather than people with an ED. Further research on the impact of binge eating is therefore required.
Finally, people with a high BMI relative to those with healthy weight had lower HSUVs, independent of the presence or absence of an ED. This is consistent with results of previous studies demonstrating that a high BMI is associated with impairments in the HRQoL (Jenkins et al., Reference Jenkins, Hoste, Meyer and Blissett2011; Keating et al., Reference Keating, Moodie, Richardson and Swinburn2011, Reference Keating, Peeters, Swinburn, Magliano and Moodie2013; Ágh et al., Reference Ágh, Kovács, Supina, Pawaskar, Herman, Vokó and Sheehan2016). Furthermore, the prevalence of obesity and binge eating has been increasing significantly during the last 20 years (Da Luz et al., Reference Da Luz, Sainsbury, Mannan, Touyz, Mitchison and Hay2017). Further research studies should evaluate the dual-effect of living with a high BMI and ED prevention on a broad range of eating and other problems (Le et al., Reference Le, Barendregt, Hay and Mihalopoulos2017).
Strengths of this study include the population-based sample and the use of a commonly used generic HRQoL instrument, the SF-12, that was used to generate the SF-6D and assess the HSUVs across the different ED diagnoses (based on the most recent diagnostic criteria) and ED-specific symptoms. This may help to increase the comparability of cost-effectiveness studies (Mihalopoulos et al., Reference Mihalopoulos, Engel, Le, Magnus, Harris and Chatterton2018). It is worth noting that the SF-12 is not an ED-specific QoL instrument and therefore some impacts of ED may not have been captured (Jenkins et al., Reference Jenkins, Hoste, Meyer and Blissett2011). However, the SF-12 has been demonstrated to be a valid and sensitive measure of HRQoL impairment in people with an ED (Mitchison et al., Reference Mitchison, Hay, Engel, Crosby, Le Grange, Lacey, Mond, Slewa-Younan and Touyz2013). The current study used the UK tariff to estimate the SF-6D utility scores given that an Australian value set is only available using discreet choice experimental design and not the standard gamble which was originally used to value the health states for the SF-6D. It is important to note that a recent study demonstrated that differences in national tariffs between culturally similar countries may be too small or subtle to affect the utility scores estimated from existing MAUIs (Khan and Richardson, Reference Khan and Richardson2019). Causal directions in the relationship between EDs and HSUVs could not be determined given the cross-sectional rather than longitudinal in design of the data. Finally, we used a listwise deletion strategy for dealing with missing data given that the proportion of missing data was under 5%. This procedure may have introduced bias in the estimation of the parameters if the assumption of missing completely at random is not satisfied. Furthermore, we were constrained by relatively small sample sizes in some groups (e.g. AN broad, ARFID, OSFED-BN or OSFED-BED, people with underweight). Therefore, analyses based on these sub-groups may have been underpowered.
Conclusion
Our findings suggested that EDs and binge-eating are associated with the impairment of HSUVs. These results provide insights into the HRQoL burden associated with EDs, which are at least comparable to that of other mental disorders. This study also presents reliable and representative community based mean SF-6D estimates for HSUVs across a broad range of EDs that can be used in cost-effectiveness modelling.
Acknowledgements
The authors acknowledge Miss Jessica Bucholc for proof read of the manuscript.
Financial support
This study was conducted without financial support.
Conflict of interest
Stephen Touyz receives royalties for written work from McGraw Hill, Hogrefe and Huber and Routledge. He has received honoraria from Shire for commissioned reports. He is the chair of their Australian BED Advisory Board and has received travel and research grants. He is a consultant to Weight Watchers (WW) and is a mental health adviser to the Commonwealth Department of Veteran Affairs. Other authors report no conflict of interest.