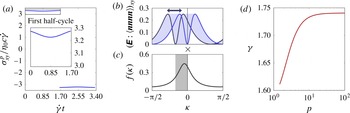
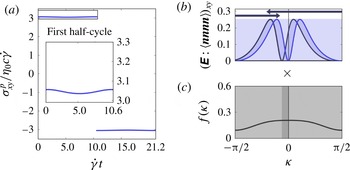
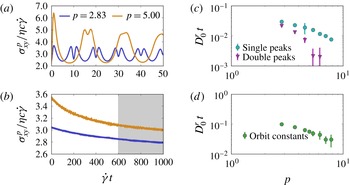
1. Introduction
Stir a solution and the solute will mix faster than when the solution is left quiescent. This mixing is enhanced even at low Reynolds numbers due to the coupling of random Brownian motion and spatially-varying fluid velocities. Brownian motion causes solute particles to access different fluid streamlines, which in turn differentially advect the solute particles. On long times, this combination of diffusion and advection looks the same as an enhanced translational diffusion. This mechanism, known as Taylor dispersion, occurs in a wide variety of natural and industrial processes ranging from drug delivery in the bloodstream (Fallon, Howell & Chauhan Reference Fallon, Howell and Chauhan2009) to microfluidic lab-on-a-chip setups (Datta & Ghosal Reference Datta and Ghosal2009), with high Reynolds number analogues even determining mixing in streams and rivers (Fischer Reference Fischer1973). Taylor dispersion is only one example of the broader coupling that occurs between advection and diffusion that is used to manipulate mass transport across many scales, ranging from chaotic mixing in microchannels (Stroock et al. Reference Stroock, Dertinger, Ajdari, Mezić, Stone and Whitesides2002) to particle clustering in turbulent fluids (Balkovsky, Falkovich & Fouxon Reference Balkovsky, Falkovich and Fouxon2001).
Anisotropic particles allow for more complex coupling between diffusion and convection, due to the additional orientational degrees of freedom they possess. Under shear, an isolated ellipsoid’s orientation is not constant, but instead rotates with the flow in an unsteady motion known as a Jeffery orbit (Jeffery Reference Jeffery1922). In colloidal suspensions, rotational Brownian motion also changes the particles’ orientations, creating the possibility of a coupling between the Jeffery orbit and rotational diffusion. Recently, through experiments and simulations Leahy et al. (Reference Leahy, Cheng, Ong, Liddell-Watson and Cohen2013) observed an enhancement of the rotational diffusion for colloidal dimers under shear, suggesting that such a coupling does exist. However, little is known about this coupling compared to its translational counterparts.
In this paper, we take the first steps towards calculating analytically the effects of rotary diffusion coupled with Jeffery orbits. In the rest of § 1, we first review previous work on the effects of rotational diffusion coupled with Jeffery orbits. In § 2, we find the time-dependent orientation distribution for a dilute suspension of axisymmetric particles subjected to continuous shear. To make the analysis tractable, we examine the limit where the shear rate is large (i.e.
 $\mathit{Pe}\gg 1$
, where the Péclet number
 $\mathit{Pe}\equiv \dot{{\it\gamma}}/D_{0}^{r}$
is the ratio of the shear rate to the zero-shear rotary diffusion constant), and we restrict the particle orientations to reside in the flow–gradient plane, which is a representative Jeffery orbit. Remarkably, we find that the complicated convection–diffusion equation describing the particle’s orientations maps to a simple diffusion equation in a new coordinate with an enhanced diffusion constant. In § 3, we generalize these results to derive the time-dependent evolution of non-spherical particle orientations under oscillatory shear. Even in the limit of large shear rates, the oscillatory shear distributions and diffusive dynamics differ considerably from the continuous shear distributions. In § 4, we examine particular solutions of the oscillatory shear equations, taking triangle-wave shear as an analytically tractable example. In § 5, we use our results to explore how rotational diffusion affects the rheology of a suspension of non-spherical particles at large shear rates. Finally, in § 6, we close by comparing our results to traditional Taylor dispersion and demonstrating their relevance to real three-dimensional particle orientations.
While Jeffery explained the rotation of an ellipsoid, his solution does not address particles of other shapes. However, symmetry and group theory arguments can be used to ascertain how a general particle rotates (Happel & Brenner Reference Happel and Brenner1983). For an axisymmetric particle, the orientation is completely specified by a unit normal
 $\boldsymbol{n}$
. As shown by Bretherton (Reference Bretherton1962), any axisymmetric particle in Stokes flow rotates in a Jeffery orbit as:
 $$\begin{eqnarray}\frac{\text{d}\boldsymbol{n}}{\text{d}t}=\boldsymbol{n}\boldsymbol{\cdot }{\it\bf\Omega}+{\it\lambda}[\unicode[STIX]{x1D640}\boldsymbol{\cdot }\boldsymbol{n}-\boldsymbol{n}\left(\boldsymbol{n}\boldsymbol{\cdot }\unicode[STIX]{x1D640}\boldsymbol{\cdot }\boldsymbol{n}\right)].\end{eqnarray}$$
Here
 ${\it\bf\Omega}$
and
 $\unicode[STIX]{x1D640}$
are the fluid vorticity and rate-of-strain tensors,
 ${\it\Omega}_{ij}\equiv (\partial _{i}u_{j}-\partial _{j}u_{i})/2$
and
 $\unicode[STIX]{x1D60C}_{ij}\equiv (\partial _{i}u_{j}+\partial _{j}u_{i})/2$
. The coefficient
 ${\it\lambda}$
is a scalar constant which depends on the particle geometry and can be found from solving the full Stokes equations. Jeffery (Reference Jeffery1922) showed for an ellipsoid of revolution that
 ${\it\lambda}\equiv (p^{2}-1)/(p^{2}+1)$
, where
 $p$
is the particle aspect ratio. For simple, continuous shear with strain rate
 $\dot{{\it\gamma}}$
, (1.1) simplifies considerably. If
 $|{\it\lambda}|<1$
, which is usually the case, then the magnitude of the second term is always less than the first term, and the particle rotates indefinitely. Denoting
 ${\it\theta}$
as the polar angle measured from the vorticity direction and
 ${\it\phi}$
as the azimuthal angle from the gradient direction in the flow–gradient plane, (1.1) admits the solution
 $$\begin{eqnarray}\displaystyle \left.\begin{array}{@{}l@{}}\displaystyle \tan {\it\phi}=p\tan \left(\frac{\dot{{\it\gamma}}t}{p+1/p}+{\it\kappa}\right),\\ \displaystyle \tan {\it\theta}=C\left(p\cos ^{2}{\it\phi}+\frac{1}{p}\sin ^{2}{\it\phi}\right)^{-1/2},\end{array}\right\} & & \displaystyle\end{eqnarray}$$
where
 $p$
is an effective aspect ratio and the phase angle
 ${\it\kappa}$
and orbit constant
 $C$
capture the particle’s initial orientation. Equations (1.1) and (1.2) show a symmetry under the transformation
 $p\rightarrow 1/p,{\it\phi}\rightarrow {\it\phi}+{\rm\pi}/2$
; thus, the motion of disc-like and rod-like particles is the same up to a change of axes. Note that (1.2) employs a different definition of
 $C$
than usual in the literature to emphasize the
 $p\rightarrow 1/p$
symmetry. The particle rotates in one of an infinite number of Jeffery orbits, each of which is described by an orbit constant
 $C$
determined by the particle’s initial orientation. Since the orbits are periodic, there is no mechanism to select a unique long-time distribution of orientations.
In colloids, rotational diffusion also affects the particles’ orientations. The probability distribution
 ${\it\rho}$
of finding a rod at orientation
 $({\it\theta},{\it\phi})$
is given by a Fokker–Planck equation:
 $$\begin{eqnarray}\displaystyle & \displaystyle \frac{\partial {\it\rho}}{\partial t}=D_{0}^{r}{\rm\nabla}^{2}{\it\rho}-\boldsymbol{{\rm\nabla}}\boldsymbol{\cdot }({\it\rho}\boldsymbol{u}), & \displaystyle\end{eqnarray}$$
 $$\begin{eqnarray}\displaystyle & \displaystyle \boldsymbol{u}=\hat{{\bf\phi}}\frac{\dot{{\it\gamma}}}{p+1/p}\left(p\cos ^{2}{\it\phi}+\frac{1}{p}\sin ^{2}{\it\phi}\right)\sin {\it\theta}+\hat{{\bf\theta}}\frac{\dot{{\it\gamma}}(p^{2}-1)}{4(p^{2}+1)}\sin 2{\it\phi}\sin 2{\it\theta}. & \displaystyle\end{eqnarray}$$
 $t$
is the time,
 $D_{0}^{r}$
is the rotary diffusion constant,
 $\boldsymbol{u}$
is the Jeffery orbit’s rotary velocity field from (1.1),
 $\hat{{\bf\phi}}$
and
 $\hat{{\bf\theta}}$
are unit vectors in the
 ${\it\phi}$
and
 ${\it\theta}$
directions, and the divergence and Laplacian operators act in orientation space
 $({\it\theta},{\it\phi})$
. The relative strength of the diffusive term
 $D_{0}^{r}{\rm\nabla}^{2}{\it\rho}$
to the advective term
 $\boldsymbol{{\rm\nabla}}\boldsymbol{\cdot }({\it\rho}\boldsymbol{u})$
is quantified by a rotary Péclet number
 $\mathit{Pe}=\dot{{\it\gamma}}/D_{0}^{r}$
. While ordinarily the diffusion in (1.3) is due to Brownian motion, (1.3) has also been used to capture the effects of random hydrodynamic interactions in non-Brownian fibre suspensions at finite concentrations (Folgar & Tucker Reference Folgar and Tucker1984; Rahnama, Koch & Shaqfeh Reference Rahnama, Koch and Shaqfeh1995). As a result, (1.3) has been analysed in many different limiting values of the Péclet number, which we now describe.
Low shear rates,
 $\mathit{Pe}\ll 1$
. When there is no shear, (1.3) reduces to a simple diffusion equation, and the particle orientations become isotropically distributed on times longer than
 $1/D_{0}^{r}$
. When
 $\mathit{Pe}$
is small but non-zero, the distribution can be found through a straightforward perturbation approach. If the particle is elongated (
 $p>1$
), to first order in
 $\mathit{Pe}$
the steady-state orientation distribution is enhanced along the flow’s extensional axis, where the Jeffery orbit has a negative divergence, and the distribution is suppressed along the flow’s compressive axis, where the Jeffery orbit has a positive divergence. This perturbation expansion can be extended to yield a power series in
 $\mathit{Pe}=\dot{{\it\gamma}}/D_{0}^{r}$
(Peterlin Reference Peterlin1938; Stasiak & Cohen Reference Stasiak and Cohen1987; Strand, Kim & Karrila Reference Strand, Kim and Karrila1987) and has been evaluated numerically up to many orders in
 $\mathit{Pe}$
. However, the series does not converge for
 $\mathit{Pe}\gtrsim 1$
, and other methods must be used to find the distribution for such flows (Kim & Fan Reference Kim and Fan1984).
High shear rates,
 $\mathit{Pe}\gg 1$
. Early attempts to calculate the distributions in the limit of weak diffusion simply looked for a steady-state solution to (1.3) with
 $D_{0}^{r}=0$
. However, this procedure produces an apparent indeterminacy in
 ${\it\rho}$
, since without diffusion there is no mechanism to select a steady-state distribution of orbit constants. Leal and Hinch realized that weak diffusion primarily acts to select a distribution of the particles’ phase angles
 ${\it\kappa}$
and orbit constants
 $C$
(Leal & Hinch Reference Leal and Hinch1971; Hinch & Leal Reference Hinch and Leal1972). When
 $p\gg 1$
the mode of the steady-state distribution has an orbit constant
 $C\approx \sqrt{p/8}$
, corresponding to an orbit that bends strongly towards the flow direction when
 ${\it\phi}={\rm\pi}/2$
but returns to a moderate distance away from the gradient direction when
 ${\it\phi}=0$
. Diffusion also randomizes
 ${\it\kappa}$
and orients most particles near the flow direction, where the orbit’s rotational velocity is slow. As a result, the steady-state distribution is strongly aligned with the flow for large
 $p$
.
Intermediate shear rates,
 $1\ll Pe\ll (p+1/p)^{3}$
. When the particle aspect ratio is large
 $p\gg 1$
, (1.4) shows that the particle rotates extremely slowly when oriented near the flow direction. As a result, for large
 $p$
it is possible for the Jeffery orbit to be dominant compared to diffusion over most of the orbit, but for diffusion to be important in a small orientational boundary layer of size
 ${\sim}1/p$
near
 ${\it\phi}={\rm\pi}/2$
. Hinch & Leal (Reference Hinch and Leal1972) showed that in this intermediate regime (
 $1\ll \mathit{Pe}\ll p^{3}$
), the fraction of particles oriented away from the flow direction decreases as
 ${\sim}1/\mathit{Pe}^{1/3}$
. These predictions at high and intermediate
 $\mathit{Pe}$
have been verified experimentally, both quantitatively (Vadas et al.
Reference Vadas, Cox, Goldsmith and Mason1976) and qualitatively (Frattini & Fuller Reference Frattini and Fuller1986; Gason, Boger & Dunstan Reference Gason, Boger and Dunstan1999; Jogun & Zukoski Reference Jogun and Zukoski1999; Brown et al.
Reference Brown, Clarke, Convert and Rennie2000; Pujari et al.
Reference Pujari2009; Leahy et al.
Reference Leahy, Cheng, Ong, Liddell-Watson and Cohen2013).
Dynamics. The time evolution of
 ${\it\rho}$
is of interest since it determines the startup rheology of a suspension of rod-like particles. At low
 $\mathit{Pe}$
, the time dynamics are determined by rotational diffusion, and there is only one time scale of interest. At
 $\mathit{Pe}=0$
, the evolution of the particle orientations is described by a simple diffusion equation, which has been studied extensively (Furry Reference Furry1957; Hubbard Reference Hubbard1972; Valiev & Ivanov Reference Valiev and Ivanov1973). At low but non-zero
 $\mathit{Pe}$
, the dynamics of (1.3) have been studied since Peterlin (Reference Peterlin1938) through series expansions in
 $\mathit{Pe}$
, partly as a model of polymeric solutions under startup flows. At second order and higher in
 $\mathit{Pe}$
, the orientation transients in a suspension cause a stress overshoot, followed by an undershoot (Bird, Warner & Evans Reference Bird, Warner and Evans1971; Stasiak & Cohen Reference Stasiak and Cohen1987; Strand et al.
Reference Strand, Kim and Karrila1987).
At high
 $\mathit{Pe}$
the time variation due to the Jeffery orbit becomes important. However, since the rotation is periodic, the Jeffery orbit by itself does not lead to a steady-state distribution. The distribution in (1.3) instead approaches steady state due to diffusion, which occurs on a longer time scale. Thus, in contrast to the low
 $\mathit{Pe}$
case, at high
 $\mathit{Pe}$
there are two time scales which determine the evolution of
 ${\it\rho}$
. The time-dependence of
 ${\it\rho}$
due to the Jeffery orbit at high
 $\mathit{Pe}$
has been well-studied. At short times, the Jeffery orbit causes oscillations in
 ${\it\rho}$
, which have been observed experimentally through direct imaging (Okagawa, Cox & Mason Reference Okagawa, Cox and Mason1973; Okagawa & Mason Reference Okagawa and Mason1973), flow dichroism (Frattini & Fuller Reference Frattini and Fuller1986; Krishna Reddy et al.
Reference Krishna Reddy, Pérez-Juste, Pastoriza-Santos, Lang, Dhont, Liz-Marzán and Vermant2011), and suspension rheology (Ivanov, van de Ven & Mason Reference Ivanov, van de Ven and Mason1982).
Comparatively less work has focused on the approach of
 ${\it\rho}$
to steady state due to diffusion. Hinch & Leal (Reference Hinch and Leal1973) attempted to solve (1.3) exactly by separation of variables. While they were not able to obtain an exact solution, they made scaling arguments based on the orthogonality of the eigenfunctions of the convection–diffusion operator to qualitatively understand the time evolution of
 ${\it\rho}$
, arguing that at high
 $\mathit{Pe}$
there were two diffusive time scales in the rheology. Recently, through a combination of experiments and simulation Leahy et al. (Reference Leahy, Cheng, Ong, Liddell-Watson and Cohen2013) showed that oscillatory shear at high
 $\mathit{Pe}$
enhances rotational diffusion, as measured from the orientational correlations. This enhancement was attributed to a mechanism where rotational diffusion allows different particles to access regions of different rotational velocity, leading to an enhanced effective diffusion. An analytical solution of the rotational dynamics under shear would provide additional insight into the effect of shear on rotational diffusion.
2. Orientation dynamics under continuous shear
A full time-dependent solution to (1.3) has not been found for over seventy years. Even in the limit of large shear rates (
 $\mathit{Pe}\gg 1$
), a uniformly valid time-dependent solution does not exist. Rather than attempt to solve (1.3) exactly, then, we examine the case where the particle is restricted to the most extreme Jeffery orbit along the flow–gradient plane (i.e.
 ${\it\theta}={\rm\pi}/2$
). Equation (1.3) then simplifies to
 $$\begin{eqnarray}\displaystyle \left.\begin{array}{@{}c@{}}\displaystyle \frac{\partial {\it\rho}}{\partial t}=D_{0}^{r}\frac{\partial ^{2}{\it\rho}}{\partial {\it\phi}^{2}}-\frac{\partial }{\partial {\it\phi}}[{\it\rho}u({\it\phi})],\\ \displaystyle u({\it\phi})=\frac{\dot{{\it\gamma}}}{p+1/p}\left(p\cos ^{2}{\it\phi}+\frac{1}{p}\sin ^{2}{\it\phi}\right).\end{array}\right\} & & \displaystyle\end{eqnarray}$$
Since this Jeffery orbit has the largest variation in angular velocities and is representative of the Jeffery orbit’s
 ${\it\phi}$
dynamics, we expect that it captures the essence of the orientation dynamics along the Jeffery orbits in three dimensions; we defer a discussion of three-dimensional orientation dynamics to § 6.
At high
 $\mathit{Pe}$
, the complicated advective term is dominant, while the much simpler diffusive term is weak. The reverse case would be easier to treat: if the advective term were simple and the diffusion term complicated, we could hope to solve the dominant advective portion exactly and to treat the weak diffusion with a singular perturbation scheme. When written in the
 ${\it\phi}$
-coordinate, the advective term is complicated due to the rotation of the Jeffery orbit. This suggests that we parameterize the particle’s orientation by a coordinate that does not change due to the Jeffery orbit. We define new coordinates
 $({\it\kappa},t^{\prime })$
such that
 $$\begin{eqnarray}\displaystyle \left.\begin{array}{@{}ll@{}}\displaystyle \frac{\partial {\it\kappa}}{\partial {\it\phi}}=\frac{\bar{u}}{u({\it\phi})}, & \displaystyle \frac{\partial {\it\kappa}}{\partial t}=-\bar{u},\\ \displaystyle \frac{\partial t^{\prime }}{\partial {\it\phi}}=0, & \displaystyle \frac{\partial t^{\prime }}{\partial t}=1,\end{array}\right\} & & \displaystyle\end{eqnarray}$$
where
 $\bar{u}$
is the mean velocity over an entire Jeffery orbit, i.e.
 $\bar{u}\equiv {\rm\Delta}{\it\phi}/T_{JO}=\dot{{\it\gamma}}/(p+1/p)$
where
 ${\rm\Delta}{\it\phi}=2{\rm\pi}$
and
 $T_{JO}$
is the Jeffery orbit period from (1.2). The constant
 $\bar{u}$
non-dimensionalizes the velocity; the reason for this choice is discussed in § 3. For a Jeffery orbit, the new coordinates are the same as the phase angle defined in (1.2):
 $$\begin{eqnarray}\displaystyle & p\tan (\bar{u}t^{\prime }+{\it\kappa})\equiv \tan {\it\phi}, & \displaystyle\end{eqnarray}$$
 $$\begin{eqnarray}\displaystyle & t^{\prime }\equiv t; & \displaystyle\end{eqnarray}$$
 ${\it\kappa}$
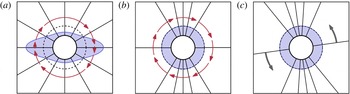
for arbitrary rotary velocity fields. These coordinates are illustrated schematically in figure 1. Under the angular portion of the coordinate change, lines spaced by constant
 ${\it\phi}$
(figure 1
a) get bunched in
 ${\it\kappa}$
(figure 1
b) to reflect the velocity differences along the orbit, causing the particles’ motion (red arrows) to look like a uniform rotation. This angular portion of the coordinate change is the coordinate space used by Leal & Hinch (Reference Leal and Hinch1971) to determine the steady-state distributions under continuous shear. The
 $t$
dependence of
 ${\it\kappa}$
in (2.2) removes this uniform rotation (figure 1
c).
The continuous-shear distributions
 ${\it\rho}({\it\phi})$
from (2.14) for a particle with aspect ratio
 $p\approx 2.83$
. (a)
 ${\it\rho}({\it\phi})$
in steady state. Here the value of
 ${\it\rho}$
is shown by the distance from the central black ring; the dotted black line shows the zero-shear equilibrium distribution (
 ${\it\rho}=1/2{\rm\pi}$
). The solid black lines correspond to 12 equally-spaced angles at
 ${\it\phi}=n{\rm\pi}/6$
. The red arrows indicate the Jeffery orbit velocity (1.1). (b,c) The ancillary distribution
 $f$
in the stretched space. The angular portion of (2.3), shown in (b), stretches the space significantly, visible from the bunched
 ${\it\phi}$
gridlines, and turns the Jeffery orbit into a uniform rotation. By transforming to a rotating reference frame (c), the uniform rotation in (b) is removed.

In this new phase-angle coordinate
 ${\it\kappa}$
, advection due to the Jeffery orbit is completely removed. The probability of finding a particle with a phase angle in
 $({\it\kappa},{\it\kappa}+\text{d}{\it\kappa})$
evolves solely due to diffusion. Thus, instead of writing (2.1) with the distribution
 ${\it\rho}({\it\phi})$
, we recast (2.1) in terms of an ancillary distribution
 $f({\it\kappa})$
that describes the probability of finding a particle in the region
 $({\it\kappa},{\it\kappa}+\text{d}{\it\kappa})$
:
 $$\begin{eqnarray}f({\it\kappa})\equiv {\it\rho}\frac{\partial {\it\phi}}{\partial {\it\kappa}}={\it\rho}\frac{u}{\bar{u}}.\end{eqnarray}$$
With the new coordinates
 $({\it\kappa},t^{\prime })$
and the ancillary distribution
 $f$
, (2.1) can be recast into a simpler form. Direct substitution of the definition of
 $f$
into (2.1) gives
 $$\begin{eqnarray}\frac{\bar{u}}{u({\it\phi})}\frac{\partial f}{\partial t}=D_{0}^{r}\frac{\partial ^{2}}{\partial {\it\phi}^{2}}\left(\frac{\bar{u}}{u({\it\phi})}f\right)-\bar{u}\frac{\partial f}{\partial {\it\phi}}.\end{eqnarray}$$
Transforming the derivatives to the new coordinates, (2.6) can be written after some simple rearrangements as
 $$\begin{eqnarray}\displaystyle \left.\begin{array}{@{}c@{}}\displaystyle \frac{\partial f}{\partial t^{\prime }}=D_{0}^{r}\frac{\partial }{\partial {\it\kappa}}\left[\frac{\bar{u}}{u}\frac{\partial }{\partial {\it\kappa}}\left(\frac{\bar{u}}{u}f\right)\right],\quad \text{where}\\ \displaystyle \frac{\bar{u}}{u({\it\phi})}=\left[p\cos ^{2}{\it\phi}+\frac{1}{p}\sin ^{2}{\it\phi}\right]^{-1}=\frac{1}{p}\cos ^{2}({\it\kappa}+\bar{u}t)+p\sin ^{2}({\it\kappa}+\bar{u}t).\end{array}\right\} & & \displaystyle\end{eqnarray}$$
This construction of
 ${\it\kappa}$
and
 $f({\it\kappa})$
results in an ancillary distribution
 $f$
that does not move with the Jeffery orbit; all the time evolution of
 $f({\it\kappa})$
arises from diffusion, as visible from (2.7). The initial equation (2.1) is a complicated partial differential equation in simple coordinates. By making the coordinate change
 ${\it\phi}\rightarrow {\it\kappa}$
, (2.1) has been transformed into a more tractable partial differential equation in complicated coordinates. Since the coordinate change is straightforward, we can analyse (2.7) in the stretched coordinates to understand the rod’s dynamics, and easily transform back to
 ${\it\phi}$
afterward.
Equation (2.7) is exact, describing both the significant long-time diffusion of the particle orientations and the small, less important short-time changes due to coupling between the Jeffery orbits and diffusion. To understand the orientation distribution when diffusion is small, we introduce a dimensionless advective time
 $\mathfrak{t}=\bar{u}t^{\prime }$
and the dimensionless diffusion or inverse Péclet number
 ${\it\epsilon}\equiv D_{0}^{r}/\bar{u}$
. In dimensionless form, (2.7) then becomes
 $$\begin{eqnarray}\frac{\partial f}{\partial \mathfrak{t}}={\it\epsilon}\frac{\partial }{\partial {\it\kappa}}\left[\frac{\bar{u}}{u}\frac{\partial }{\partial {\it\kappa}}\!\left(\frac{\bar{u}}{u}f\right)\right].\end{eqnarray}$$
We wish to understand the evolution of
 $f$
on long times
 $\mathfrak{t}\gtrsim 1/{\it\epsilon}$
, in the limit
 ${\it\epsilon}\rightarrow 0$
. To isolate the long-time behaviour, we find the net change of
 $f$
after a full Jeffery orbit by integrating (2.7) over a period of a Jeffery orbit,
 $\bar{u}T_{JO}=2{\rm\pi}$
. Expanding the derivatives in (2.8) and integrating gives
 $$\begin{eqnarray}\displaystyle f({\it\kappa},\mathfrak{t}+2{\rm\pi}) & = & \displaystyle f({\it\kappa},\mathfrak{t})+{\it\epsilon}\left\{\int _{\mathfrak{t}}^{\mathfrak{t}+2{\rm\pi}}\left(\frac{\bar{u}}{u({\it\phi}({\it\kappa},{\it\tau}))}\right)^{2}\frac{\partial ^{2}f}{\partial {\it\kappa}^{2}}\,\text{d}{\it\tau}\right.\nonumber\\ \displaystyle & & \displaystyle +\,\frac{3}{2}\int _{\mathfrak{t}}^{\mathfrak{t}+2{\rm\pi}}\frac{\partial }{\partial {\it\kappa}}\left(\frac{\bar{u}}{u({\it\phi}({\it\kappa},{\it\tau}))}\right)^{2}\frac{\partial f}{\partial {\it\kappa}}\,\text{d}{\it\tau}\nonumber\\ \displaystyle & & \displaystyle \left.+\,\frac{1}{2}\int _{\mathfrak{t}}^{\mathfrak{t}+2{\rm\pi}}\frac{\partial ^{2}}{\partial {\it\kappa}^{2}}\left(\frac{\bar{u}}{u({\it\phi}({\it\kappa},{\it\tau}))}\right)^{2}f\,\text{d}{\it\tau}\right\},\end{eqnarray}$$
where
 ${\it\tau}$
is a dummy variable of the integration.
By assuming that the diffusion is weak (i.e. the dimensionless diffusion
 ${\it\epsilon}\equiv D_{0}^{r}/\bar{u}\ll 1$
), these integrals can be simplified considerably. Since
 $f$
changes slowly with time, cf. (2.8),
 $f$
and its derivatives in
 ${\it\kappa}$
can be Taylor expanded in
 $\mathfrak{t}$
about
 $\mathfrak{t}=0:f({\it\kappa},\mathfrak{t})=f({\it\kappa},0)+\mathfrak{t}\partial f/\partial \mathfrak{t}(t=0)+O(\mathfrak{t}^{2})$
. But by construction
 $\partial f/\partial \mathfrak{t}=O({\it\epsilon})$
, so
 $f({\it\kappa},\mathfrak{t})$
can be approximated by
 $f({\it\kappa},0)$
, with a correction to (2.9) of
 $O({\it\epsilon}^{2})$
. In contrast, the function
 $u({\it\kappa}+\mathfrak{t})$
cannot be approximated by
 $u({\it\kappa})$
, since
 $\partial u/\partial \mathfrak{t}$
is
 $O(1)$
. Thus, to first order in
 ${\it\epsilon}$
, (2.9) can be written as
 $$\begin{eqnarray}\displaystyle f({\it\kappa},\mathfrak{t}+2{\rm\pi})-f({\it\kappa},{\it\tau}) & = & \displaystyle {\it\epsilon}\left\{\frac{\partial ^{2}f}{\partial {\it\kappa}^{2}}\int _{\mathfrak{t}}^{\mathfrak{t}+2{\rm\pi}}\left(\frac{\bar{u}}{u({\it\kappa}+{\it\tau})}\right)^{2}\text{d}{\it\tau}\right.\nonumber\\ \displaystyle & & \displaystyle +\,\frac{3}{2}\frac{\partial f}{\partial {\it\kappa}}\int _{\mathfrak{t}}^{\mathfrak{t}+2{\rm\pi}}\frac{\partial }{\partial {\it\kappa}}\left(\frac{\bar{u}}{u({\it\kappa}+{\it\tau})}\right)^{2}\text{d}{\it\tau}\nonumber\\ \displaystyle & & \displaystyle \left.+\,\frac{1}{2}\;f\frac{\partial ^{2}}{\partial {\it\kappa}^{2}}\int _{\mathfrak{t}}^{\mathfrak{t}+2{\rm\pi}}\left(\frac{\bar{u}}{u({\it\kappa}+{\it\tau})}\right)^{2}\text{d}{\it\tau}\right\}+O({\it\epsilon}^{2}).\end{eqnarray}$$
This finite-time update equation can be recast as a differential equation in the limit
 ${\it\epsilon}\rightarrow 0$
. Define a new dimensionless time
 ${\it\tau}\equiv {\it\epsilon}\mathfrak{t}\equiv D_{0}^{r}t$
. Rewriting the integrals in (2.10) as averages gives
 $$\begin{eqnarray}\displaystyle \frac{f({\it\kappa},{\it\tau}+2{\rm\pi}{\it\epsilon})-f({\it\kappa},{\it\tau})}{2{\rm\pi}{\it\epsilon}}=\left\langle \left(\frac{\bar{u}}{u}\right)^{2}\right\rangle \frac{\partial ^{2}f}{\partial {\it\kappa}^{2}}+\frac{3}{2}\frac{\partial }{\partial {\it\kappa}}\left\langle \left(\frac{\bar{u}}{u}\right)^{2}\right\rangle \frac{\partial f}{\partial {\it\kappa}}+\frac{1}{2}\frac{\partial ^{2}}{\partial {\it\kappa}^{2}}\left\langle \left(\frac{\bar{u}}{u}\right)^{2}\right\rangle f & & \displaystyle \nonumber\\ \displaystyle & & \displaystyle\end{eqnarray}$$
where
 $\langle \cdot \rangle$
denotes the average over a Jeffery orbit period. In the limit of large shear rates
 ${\it\epsilon}\rightarrow 0$
, and this update equation becomes a differential equation. Re-casting back to the dimensional
 $({\it\kappa},t^{\prime })$
coordinates, (2.10) can be written as the differential equation
 $$\begin{eqnarray}\displaystyle \frac{\partial f}{\partial t^{\prime }}=D_{0}^{r}\left[\left\langle \left(\frac{\bar{u}}{u}\right)^{2}\right\rangle \frac{\partial ^{2}f}{\partial {\it\kappa}^{2}}+\frac{3}{2}\left\langle \frac{\partial }{\partial {\it\kappa}}\left(\frac{\bar{u}}{u}\right)^{2}\right\rangle \frac{\partial f}{\partial {\it\kappa}}+\frac{1}{2}\left\langle \frac{\partial ^{2}}{\partial {\it\kappa}^{2}}\left(\frac{\bar{u}}{u}\right)^{2}\right\rangle f+O({\it\epsilon})\right]. & & \displaystyle \nonumber\\ \displaystyle & & \displaystyle\end{eqnarray}$$
In addition, the second and third integrals on the right-hand side of (2.12) can be simplified. Since the rotation rate
 $u$
is a function of
 ${\it\kappa}+\bar{u}t^{\prime }$
only, cf. (2.7), the derivatives of
 $u$
can be rewritten as
 $\partial u/\partial {\it\kappa}=\bar{u}\partial u/\partial t^{\prime }$
. Consequently, the second and third terms become integrals of a derivative, and vanish since
 $u$
and its derivative are periodic. As a result, only the first of the three integrals in (2.12) is non-zero.
Remarkably, in the limit
 ${\it\epsilon}\rightarrow 0$
these manipulations transform the complex orientation dynamics in (2.1) into a simple diffusion equation with a uniform diffusion constant:
 $$\begin{eqnarray}\frac{\partial f}{\partial t^{\prime }}=D_{0}^{r}\left\langle \left(\frac{\bar{u}}{u}\right)^{2}\right\rangle \frac{\partial ^{2}f}{\partial {\it\kappa}^{2}},\end{eqnarray}$$
where the angle brackets denote a time-average over one orbit. On long times, the rod’s orientation moves diffusively in the stretched space with an effective diffusion constant
 $D_{eff}^{r}=D_{0}^{r}\langle (\bar{u}/u)^{2}\rangle$
. When diffusion is small, it acts to randomize the phase angle
 ${\it\kappa}$
of the rod’s Jeffery orbit. While the randomizing kicks of diffusion coupled to the Jeffery orbit do not produce diffusive behaviour in real
 ${\it\phi}$
-space, their combined effect results in an emergent simple diffusion in the stretched
 ${\it\kappa}$
-space.
Up to this point, none of the results depend on the specific form of the Jeffery orbit. All that is required to proceed up to (2.13) is a rotary velocity field
 $u({\it\phi})$
that is non-zero and gives rise to periodic orbits, allowing for an appropriate coordinate change. The details of the Jeffery orbit only enter into the value of the effective diffusion constant
 $D_{eff}^{r}$
and in the definition of
 ${\it\kappa}$
and
 $f({\it\kappa})$
. At long times,
 $f({\it\kappa})=1/2{\rm\pi}$
and
 ${\it\kappa}$
is completely randomized, giving a steady-state distribution
 $$\begin{eqnarray}{\it\rho}({\it\phi})=\frac{1}{2{\rm\pi}}[p\cos ^{2}{\it\phi}+1/p\sin ^{2}{\it\phi}]^{-1},\end{eqnarray}$$
i.e. rods with
 $p>1$
mostly orient along the flow direction (
 ${\it\phi}\approx {\rm\pi}/2$
), where the Jeffery orbit velocity is slowest, cf. figure 1. This long-time distribution is the two-dimensional version of Leal and Hinch’s solution.
More importantly, our derivation also allows us to calculate an analytical solution for the orientation dynamics. Evaluating the average
 $\langle (\bar{u}/u)^{2}\rangle$
we find a simple form for the effective diffusion constant
 $D_{eff}^{r}$
:
 $$\begin{eqnarray}D_{eff}^{r}/D_{0}^{r}={\textstyle \frac{3}{8}}(p-1/p)^{2}+1.\end{eqnarray}$$
Equation (2.15) states that the effective diffusion of rod-like particles is enhanced under shear, in agreement with experiments in three dimensions (Leahy et al.
Reference Leahy, Cheng, Ong, Liddell-Watson and Cohen2013). The effective diffusion constant
 $D_{eff}^{r}$
is symmetric with respect to
 $p\rightarrow 1/p$
, respecting the symmetry of the Jeffery orbits. For spherical particles, which have
 $p=1$
and undergo uniform rotation, the rotational diffusion is not enhanced:
 $D_{eff}^{r}(p=1)/D_{0}^{r}=1$
. Just as Taylor dispersion requires non-uniform translational velocities to enhance the diffusion, a non-uniform Jeffery orbit is required to enhance the rotational diffusion.
The
 ${\sim}p^{2}$
enhancement of the diffusion for
 $p\gg 1$
can be understood from the structure of the Jeffery orbit. As can be seen from (2.1), for most of the rod’s possible orientations the Jeffery orbit’s rotation scales as
 $u\sim \dot{{\it\gamma}}$
, independent of aspect ratio. Thus, over most of the Jeffery orbit, the relative effect of diffusion compared to advection is
 $D_{0}^{r}/u\sim D_{0}^{r}/\dot{{\it\gamma}}$
. However, when the particle is aligned with the flow (
 ${\it\phi}\approx {\rm\pi}/2$
), the particle’s rotation is considerably slower, of order
 ${\sim}\dot{{\it\gamma}}/p^{2}$
when
 $p$
is large. Thus, near the flow direction, the relative effect of diffusion is
 $D_{0}^{r}/u\sim D_{0}^{r}p^{2}/\dot{{\it\gamma}}$
, larger by a factor of
 $p^{2}$
. This
 $p^{2}$
enhancement of the effect of diffusion produces the
 $p^{2}$
scaling of the effective diffusion in (2.15).
Since (2.13) is a simple diffusion equation in the phase-angle coordinate
 ${\it\kappa}$
, a solution for
 $f({\it\kappa},t^{\prime })$
is easy to obtain by separation of variables. For a particle with phase angle
 ${\it\kappa}_{0}$
at time
 $t^{\prime }=0$
, the ancillary distribution
 $f$
evolves as
 $$\begin{eqnarray}f({\it\kappa},t^{\prime })=\frac{1}{2{\rm\pi}}+\frac{1}{{\rm\pi}}\mathop{\sum }_{m=1}^{\infty }\cos [m({\it\kappa}-{\it\kappa}_{0})]\text{exp}\left(-m^{2}D_{eff}^{r}t^{\prime }\right).\end{eqnarray}$$
In practice, however, the orientation dynamics in the original
 ${\it\phi}$
-space are of interest, not the dynamics in
 ${\it\kappa}$
-space. In principle, the dynamics of any distribution in
 ${\it\phi}$
-space can be calculated by substituting the relation between
 ${\it\kappa}$
and
 ${\it\phi}$
, given in (2.3), into a solution of (2.13) such as (2.16). Alternatively, the evolution of a rod’s orientation in
 ${\it\kappa}$
-space can be measured instead. Correlations in
 ${\it\kappa}$
, such as
 $\langle \cos m({\it\kappa}-{\it\kappa}_{0})\rangle =\text{exp}(-m^{2}D_{eff}^{r}t)$
suggested by (2.16), provide direct information about the enhanced diffusion constant. Additionally, any function of
 ${\it\phi}$
also can be written in terms of
 ${\it\kappa}$
and
 $t^{\prime }$
, allowing for any expectation value to be evaluated in
 ${\it\kappa}$
-space.
Nevertheless, even without this substitution, many details of the orientation dynamics in
 ${\it\phi}$
can be gleaned from the solutions for
 $f({\it\kappa})$
in (2.16). In particular, the distributions
 ${\it\rho}$
or
 $f$
relax to their steady-state values with a spectrum of exponential decays superimposed on the Jeffery orbit’s oscillation. The spectrum of decay times for these exponentials is
 $1/m^{2}D_{eff}^{r}$
for integer
 $m$
, the same decay times as the zero-shear diffusion equation but with an enhanced diffusion constant
 $D_{eff}^{r}$
instead of
 $D_{0}^{r}$
. The slowest of these time scales,
 $1/D_{eff}^{r}$
, will determine how fast a generic expectation value relaxes to its steady state, including the correlations determining the rheology discussed in § 5.
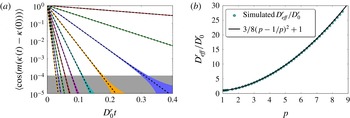
To test our solution (2.15) for the orientation dynamics, we simulated (2.1) over a large range of aspect ratios at a large Péclet number of
 $\mathit{Pe}\equiv \dot{{\it\gamma}}/D_{0}^{r}=10^{4}$
, as described in appendix A. The
 ${\it\phi}$
correlations
 $\langle \cos m({\it\phi}-{\it\phi}_{0})\rangle$
are not diffusive but instead exhibit oscillations with complicated damping and orientational dependence. In contrast, the theory described above predicts that the correlations in
 ${\it\kappa}$
-space follow a diffusive behaviour with correlations that decay as simple exponentials. We test this prediction by fitting the
 ${\it\kappa}$
correlations in our simulations to the exponential decay
 $\langle \cos [m({\it\kappa}(t)-{\it\kappa}(0))]\rangle =\text{exp}(-m^{2}D_{eff}^{r}t)$
suggested by (2.16), as shown in figure 2. We find excellent agreement over a wide range of particle aspect ratios, with diffusion constants given by (2.15).
Rotational diffusion under continuous shear in the stretched
 ${\it\kappa}$
-space. (a) Semi-log plot of the correlations
 $\langle \cos (m{\rm\Delta}{\it\kappa})\rangle$
versus time for an aspect ratio
 $p\approx 2.83$
and
 $\mathit{Pe}=10^{4}$
. The black dotted lines correspond to diffusive correlations with the diffusion constant from (2.15); the coloured lines correspond to the simulated correlations. There is excellent agreement with no adjustable parameters. At long times, higher-order corrections in
 $1/\mathit{Pe}$
are visible as the broadening into bands when the correlations decrease below
 ${\approx}10^{-4}$
(grey shaded region). (b) The diffusion constant
 $D_{eff}^{r}$
, extracted from simulated
 $m=1$
correlations, plotted versus aspect ratio (cyan circles), alongside the prediction from (2.15) (black line).

Equation (2.7) only describes the singular contribution of diffusion to the distribution and is not correct to
 $O({\it\epsilon})$
at long times. Indeed, the steady-state solution
 ${\it\rho}\propto 1/u$
in (2.14) only satisfies the
 $\boldsymbol{{\rm\nabla}}\boldsymbol{\cdot }({\it\rho}\boldsymbol{u})$
portion of (2.1); the
 ${\it\epsilon}{\rm\nabla}^{2}{\it\rho}$
term remains. Thus our solution is not a full solution to
 $O({\it\epsilon})$
but only captures the cumulative effects of the small diffusion that accrue over long times. It is this
 $O({\it\epsilon})$
discrepancy which appears as the broadening of the bands in figure 2(a). The true steady-state distribution
 ${\it\rho}({\it\phi})$
can be written as
 ${\it\rho}({\it\phi})={\it\rho}_{0}({\it\phi})+{\it\epsilon}{\it\rho}_{1}({\it\phi})$
, where
 ${\it\rho}_{0}({\it\phi})$
is the solution given in (2.14). After long times, the correlations
 $\langle \cos m{\rm\Delta}{\it\kappa}\rangle$
are then
 $$\begin{eqnarray}\langle \cos m{\rm\Delta}{\it\kappa}\rangle =\int _{0}^{2{\rm\pi}}\cos (m{\rm\Delta}{\it\kappa}){\it\rho}_{0}\,\text{d}{\it\phi}+{\it\epsilon}\int _{0}^{2{\rm\pi}}\cos (m{\rm\Delta}{\it\kappa}){\it\rho}_{1}\,\text{d}{\it\phi}.\end{eqnarray}$$
While the first term is zero by construction of
 ${\it\kappa}$
, in general the second term is non-zero and gives an
 $O({\it\epsilon})$
correction to the correlations at long times. Since
 ${\it\phi}={\it\phi}({\it\kappa}+\bar{u}t)$
, the function
 $\cos m{\rm\Delta}{\it\kappa}$
oscillates in time, in turn creating a residual
 $O({\it\epsilon})$
long-time oscillation in the correlations. This oscillation is visible in figure 2 at correlation values below
 ${\sim}1/\mathit{Pe}$
, appearing as solid bands due to the many Jeffery orbits spanned by the
 $x$
-axis.
3. Oscillatory shear equations
The success of (2.13) and (2.15) at accurately describing the dynamics of rod-like particles subjected to continuous shear suggests that we use a similar framework to examine the dynamics of rods in intrinsically unsteady flows. To this end, we derive an equation analogous to (2.13) that describes the distribution’s evolution under an arbitrary oscillatory shear waveform. We show a general method for its solution, which we then implement in § 4.
To find the distributions under oscillatory shear, we follow the spirit of the derivation in § 2 for continuous shear. Under oscillatory shear, the distribution
 ${\it\rho}$
is described by a convection–diffusion equation similar to (2.1), except that the magnitude of the rotational velocity changes with time. If
 $\dot{{\it\Gamma}}(t)$
is the dimensionless waveform describing the oscillatory shear, such that the instantaneous shear rate is
 $\dot{{\it\Gamma}}(t)\dot{{\it\gamma}}$
, then the convection–diffusion equation for the particle’s orientation takes the form
 $$\begin{eqnarray}\frac{\partial {\it\rho}}{\partial t}=D_{0}^{r}\frac{\partial ^{2}{\it\rho}}{\partial {\it\phi}^{2}}-\frac{\partial }{\partial {\it\phi}}[{\it\rho}\dot{{\it\Gamma}}(t)u({\it\phi})].\end{eqnarray}$$
When written in the coordinate
 ${\it\phi}$
, the advective portion is exceptionally complicated since the rotational velocity field itself oscillates with the flow through
 $\dot{{\it\Gamma}}(t)$
, in addition to the change of
 ${\it\phi}$
with time. Like the case for continuous shear, the advective term will be considerably simpler when written in terms of the phase angle
 ${\it\kappa}$
. Thus, we define new coordinates
 $({\it\kappa},t^{\prime })$
such that
 ${\it\kappa}$
changes only due to diffusion:
 $$\begin{eqnarray}\displaystyle \left.\begin{array}{@{}ll@{}}\displaystyle \frac{\partial {\it\kappa}}{\partial {\it\phi}}=\frac{\bar{u}}{u({\it\phi})}, & \displaystyle \frac{\partial {\it\kappa}}{\partial t}=-\dot{{\it\Gamma}}(t)\bar{u,}\\ \displaystyle \frac{\partial t^{\prime }}{\partial {\it\phi}}=0, & \displaystyle \frac{\partial t^{\prime }}{\partial t}=1,\end{array}\right\} & & \displaystyle\end{eqnarray}$$
where
 $\bar{u}$
and
 $u({\it\phi})$
are defined as before. These coordinates are defined the same way as for continuous shear, except that there is an additional factor of
 $\dot{{\it\Gamma}}(t)$
in
 $\partial {\it\kappa}/\partial t$
to capture the shear flow’s oscillation. Continuing to follow the continuous shear derivation, we recast (3.1) in terms of the ancillary distribution
 $f$
. Since the angular part of the coordinate change
 $\partial {\it\kappa}/\partial {\it\phi}$
remains the same as for continuous shear,
 $f({\it\kappa})$
again takes the form (2.5).
With the new oscillatory shear coordinates
 $({\it\kappa},t^{\prime })$
and the ancillary distribution
 $f$
, (3.1) can be cast into a simpler differential equation, following the continuous shear argument. Direct substitution of the definition of
 $f$
gives
 $$\begin{eqnarray}\frac{\bar{u}}{u({\it\phi})}\frac{\partial f}{\partial t}=D_{0}^{r}\frac{\partial ^{2}}{\partial {\it\phi}^{2}}\left(\frac{\bar{u}}{u({\it\phi})}f\right)-\dot{{\it\Gamma}}(t)\bar{u}\frac{\partial f}{\partial {\it\phi}}.\end{eqnarray}$$
By transforming the derivatives to the new coordinates, (3.3) can be written as
 $$\begin{eqnarray}\frac{\partial f}{\partial t^{\prime }}=D_{0}^{r}\frac{\partial }{\partial {\it\kappa}}\left[\frac{\bar{u}}{u}\frac{\partial }{\partial {\it\kappa}}\left(\frac{\bar{u}}{u}f\right)\right].\end{eqnarray}$$
Once again, the construction of
 ${\it\kappa}$
and
 $f({\it\kappa})$
results in an ancillary distribution
 $f$
that only evolves due to diffusion. Equation (3.4) exactly describes this evolution in the new coordinates for all
 $\mathit{Pe}$
.
Equation (3.4) is the same form as (2.7) for continuous shear, but it has a hidden difference in the value of
 $u({\it\phi}({\it\kappa},t^{\prime }))$
which we now elucidate. Rearranging the coordinate derivatives (3.2) to find
 $\partial {\it\phi}/\partial t^{\prime }$
and
 $\partial {\it\phi}/\partial {\it\kappa}$
gives an equation for
 ${\it\phi}$
in terms of
 ${\it\kappa}$
and
 $t^{\prime }$
:
 $$\begin{eqnarray}\frac{\partial {\it\phi}}{\partial t^{\prime }}=\dot{{\it\Gamma}}(t)\bar{u}\frac{\partial {\it\phi}}{\partial {\it\kappa}}.\end{eqnarray}$$
Thus,
 ${\it\phi}$
is a function of
 ${\it\kappa}+\bar{u}{\it\Gamma}(t^{\prime })$
, where
 ${\it\Gamma}(t^{\prime })$
is the antiderivative of
 $\dot{{\it\Gamma}}(t^{\prime })$
. In comparison, under continuous shear
 ${\it\phi}$
has a simpler dependence on
 ${\it\kappa}+\bar{u}t^{\prime }$
, without the complication due to the functional form of
 ${\it\Gamma}(t^{\prime })$
. For the particular case of a Jeffery orbit,
 $\bar{u}/u$
is
 $$\begin{eqnarray}\frac{\bar{u}}{u({\it\phi})}=\left[p\cos ^{2}{\it\phi}+\frac{1}{p}\sin ^{2}{\it\phi}\right]^{-1}=\frac{1}{p}\cos ^{2}[{\it\kappa}+\bar{u}{\it\Gamma}(t^{\prime })]+p\sin ^{2}[{\it\kappa}+\bar{u}{\it\Gamma}(t^{\prime })],\end{eqnarray}$$
which is similar to (2.7) for continuous shear but contains a different
 $t^{\prime }$
dependence.
Since (3.4) is the same form as its continuous shear counterpart (2.7), it can be analysed in the same manner in the limit of large
 $\mathit{Pe}$
. In particular, we can find the change in
 $f$
after one cycle of oscillatory shear, instead of after one Jeffery orbit, by following the steps in (2.8)–(2.10). An update equation similar to (2.10) can be obtained by writing (3.4) with dimensionless variables
 ${\it\epsilon}\equiv D_{0}^{r}/\bar{u}$
and
 $\mathfrak{t}\equiv \bar{u}t$
and integrating over the period of one oscillation
 $(\mathfrak{t},\mathfrak{t}+\bar{u}T_{cyc})$
, where
 $T_{cyc}$
is the period of the oscillatory shear waveform
 ${\it\Gamma}(t)$
. The same argument as in (2.11) and (2.12) then recasts this update equation into a differential equation for the time evolution of
 $f$
, valid in the limit that
 $f$
does not change significantly over a cycle
 ${\it\epsilon}\bar{u}T_{cyc}\rightarrow 0$
:
 $$\begin{eqnarray}\displaystyle & \displaystyle \frac{\partial f}{\partial t^{\prime }}=\mathfrak{D}({\it\kappa})\frac{\partial ^{2}f}{\partial {\it\kappa}^{2}}+\frac{3}{2}\frac{\partial \mathfrak{D}}{\partial {\it\kappa}}\frac{\partial f}{\partial {\it\kappa}}+\frac{1}{2}\frac{\partial ^{2}\mathfrak{D}}{\partial {\it\kappa}^{2}}f,\quad \text{where} & \displaystyle\end{eqnarray}$$
 $$\begin{eqnarray}\displaystyle & \displaystyle \mathfrak{D}({\it\kappa})/D_{0}^{r}\equiv \left\langle \left(\frac{\bar{u}}{u({\it\kappa}+\bar{u}{\it\Gamma}({\it\tau}))}\right)^{2}\right\rangle \equiv \frac{1}{T_{cyc}}\int _{0}^{T_{cyc}}\left(\frac{\bar{u}}{u({\it\kappa}+\bar{u}{\it\Gamma}({\it\tau}))}\right)^{2}\text{d}{\it\tau}. & \displaystyle\end{eqnarray}$$
 $\mathfrak{D}({\it\kappa})$
. For continuous shear, the effective diffusion constant arises from averaging the rotary velocity field over the entire Jeffery orbit. Since the Jeffery orbit is periodic, after a fixed time a particle at any initial orientation has sampled the entire rotary velocity field, leading to an effective diffusion which is independent of starting orientation. For oscillatory shear, a particle does not in general sample an entire Jeffery orbit. The particle’s effective diffusion instead results from an average over the portions of the orbit which the particle does sample, and particles at different orientations experience an angularly varying diffusion coefficient
 $\mathfrak{D}({\it\kappa})$
.
There are salient differences between the oscillatory shear equation (3.7) and the continuous shear equation (2.13). Equation (3.7) is not a simple diffusion equation in the
 ${\it\kappa}$
-coordinate: terms proportional to both
 $f$
and
 $\partial f/\partial {\it\kappa}$
appear, and the coefficient
 $\mathfrak{D}({\it\kappa})$
of the second-derivative term
 $\partial ^{2}f/\partial {\it\kappa}^{2}$
is not constant. Even more striking, the long-time solution to (3.7) is not constant in
 ${\it\kappa}$
, evidently depending on the effective diffusivity
 $\mathfrak{D}({\it\kappa})$
. The variation of
 $\mathfrak{D}({\it\kappa})$
with orientation causes particles to drift away from an isotropic distribution in
 ${\it\kappa}$
, similar to the mechanisms driving concentration gradients induced by turbophoresis (Reeks Reference Reeks1983; Balkovsky et al.
Reference Balkovsky, Falkovich and Fouxon2001), orientation gradients of rods flowing through a fixed bed (Shaqfeh & Koch Reference Shaqfeh and Koch1988), or the creation of absorbing states observed in dense suspensions of non-Brownian spheres and rods under oscillatory shear (Corté et al.
Reference Corté, Chaikin, Gollub and Pine2008; Franceschini et al.
Reference Franceschini, Filippidi, Guazzelli and Pine2011; Keim, Paulsen & Nagel Reference Keim, Paulsen and Nagel2013).
The difference between the oscillatory shear and the continuous shear distributions arises from diffusion. While the continuous shear distribution in the limit
 $D_{0}^{r}/\bar{u}=0$
is the same for forward and backward shear, there are higher-order corrections in
 $D_{0}^{r}/\bar{u}$
to the distribution that break this symmetry (Hinch & Leal Reference Hinch and Leal1972). Under oscillatory shear at large strain rates, these small corrections to the distribution oscillate with the flow, building up after many cycles to create a long-time distribution that differs from the continuous shear distribution, even in the limit of infinitesimal diffusion.
Rearranging (3.7) provides additional insights into the oscillatory shear distributions’ evolution. Writing (3.7) in the form
 $\partial f/\partial t^{\prime }=-\partial J/\partial {\it\kappa}$
, where
 $J$
is a probability flux, explicitly shows the conservation of probability:
 $$\begin{eqnarray}\frac{\partial f}{\partial t^{\prime }}=-\frac{\partial }{\partial {\it\kappa}}\left[-\mathfrak{D}\frac{\partial f}{\partial {\it\kappa}}-\frac{1}{2}\frac{\partial \mathfrak{D}}{\partial {\it\kappa}}f\right].\end{eqnarray}$$
Here the flux
 $J$
consists of two terms: one reminiscent of a diffusive term with a diffusion constant
 $\mathfrak{D}$
and one reminiscent of a drift term with a drift velocity
 $-{\textstyle \frac{1}{2}}\partial \mathfrak{D}/\partial {\it\kappa}$
. It is this latter effective drift velocity, arising from the spatially-varying diffusion in (3.8), that causes the particle orientations to drift away from the continuous shear steady-state distribution. Setting
 $\partial f/\partial t^{\prime }=0$
gives the distribution at long times as
 $$\begin{eqnarray}f({\it\kappa})\propto (\mathfrak{D}/D_{0}^{r})^{-1/2},\quad {\it\rho}({\it\phi})\propto \frac{\bar{u}}{u}(\mathfrak{D}/D_{0}^{r})^{-1/2}.\end{eqnarray}$$
To obtain a simple description of the dynamics of the orientation distribution, we follow a procedure similar to that in § 2 and transform into a coordinate
 $z$
yielding a simple diffusion equation. First, we define another ancillary distribution
 $g(z)$
such that the probability of finding a particle in the region
 $(z,z+\text{d}z)$
is
 $g(z)\,\text{d}z$
, in analogy with the original definition of
 $f$
:
 $$\begin{eqnarray}g(z)=f({\it\kappa}(z))\frac{\partial {\it\kappa}}{\partial z}.\end{eqnarray}$$
Next, we choose the coordinate
 $z$
such that
 $g(z)$
is constant at long times. Rearranging (3.11) and steady-state
 $f$
in (3.10) immediately gives one possible definition of
 $z$
as
 $$\begin{eqnarray}\frac{\partial z}{\partial {\it\kappa}}=(\mathfrak{D}/D_{0}^{r})^{-1/2}.\end{eqnarray}$$
When these definitions of
 $z$
and
 $g(z)$
are substituted into (3.9), the factors of
 $\mathfrak{D}$
in the diffusive term and
 $\partial \mathfrak{D}/\partial {\it\kappa}$
in the diffusive drift velocity term are cancelled, resulting in a simple diffusion equation for
 $g$
:
 $$\begin{eqnarray}\frac{\partial g}{\partial t^{\prime }}=D_{0}^{r}\frac{\partial ^{2}g}{\partial z^{2}}.\end{eqnarray}$$
Interestingly, recasting (3.9) into a simple diffusion equation requires the relationship between the diffusive flux term and the diffusive drift velocity term to be what it is in (3.9). In general, a convection–diffusion equation with a drift velocity that is not related to a spatially-varying diffusion constant cannot be recast into a simple diffusion equation via the line of reasoning presented here.
While the coordinate change specified by (3.12) recasts (3.7) into a diffusion equation, any other coordinate
 $\tilde{z}$
related to
 $z$
by
 $\tilde{z}\equiv {\it\alpha}z$
will also do so, with a different diffusion constant
 $\tilde{D}=D_{0}^{r}/{\it\alpha}^{2}$
; indeed, this is simply a restatement of the scaling symmetries in a diffusion equation. However, while changing coordinates can produce any numerical value of
 $\tilde{D}$
, the physical spectrum of time scales will be independent of these coordinate changes. To find the effective diffusion constant, we return to the specific case of diffusion on a circle. Equation (3.13) can then be solved by separation of variables to give
 $$\begin{eqnarray}g(z,t)=\mathop{\sum }_{m}a_{m}\exp (\text{i}mz-D_{0}^{r}m^{2}t^{\prime }).\end{eqnarray}$$
Imposing a single-valuedness condition on
 $g$
,
 $g(z({\it\kappa}))=g(z({\it\kappa}+2{\rm\pi}))$
, constrains
 $m$
such that
 $mz({\it\kappa}=2{\rm\pi})=2{\rm\pi}n$
, where
 $n$
is an integer, or
 $m=2{\rm\pi}n/z({\it\kappa}=2{\rm\pi})$
. With this constraint, (3.14) becomes
 $$\begin{eqnarray}g(z,t^{\prime })=\mathop{\sum }_{n\in Z}A_{n}\text{exp}(-D_{0}^{r}n^{2}t^{\prime }[2{\rm\pi}/z({\it\kappa}=2{\rm\pi})]+\text{i}nz[2{\rm\pi}/z({\it\kappa}=2{\rm\pi})]).\end{eqnarray}$$
This solution has the same form as the solution to a diffusion equation on a circle, in a new coordinate
 $\tilde{z}\equiv z\times 2{\rm\pi}/z({\it\kappa}=2{\rm\pi})$
. In particular, the spectrum of the decay times is the same as that for diffusion on a circle with diffusion constant:
 $$\begin{eqnarray}D_{eff}^{r}/D_{0}^{r}=\left(\frac{2{\rm\pi}}{z({\it\kappa}=2{\rm\pi})}\right)^{2}.\end{eqnarray}$$
Incidentally, this same argument provides the reason for choosing the factor of
 $\bar{u}$
in the definition of the continuous shear
 ${\it\kappa}$
in (2.2), since it is the factor of
 $\bar{u}$
that sets
 ${\it\kappa}({\it\phi}=2{\rm\pi},t=0)=2{\rm\pi}$
and gives the correct spectrum of time scales.
Making this coordinate change
 ${\it\kappa}\rightarrow z$
transforms (3.7) into a simple diffusion equation in a more complicated coordinate system. The recast form allows for an exact solution if the new coordinate
 $z$
is known and provides additional intuition into the evolution of the orientation distribution. In general, the new coordinate
 $z({\it\kappa})$
is difficult to find analytically. However, the coordinate change is simpler to solve numerically than the full partial differential equation, and (3.8), (3.10) and (3.16) allow for a direct calculation of the effective diffusion constant and the long-time distributions without a full determination of
 $z({\it\kappa})$
. Moreover, for certain strain amplitudes and oscillatory waveforms the distribution and effective diffusion can be solved for analytically. We provide the results of these solutions for triangle-wave shear in the next section.
4. Triangle-wave oscillatory shear solutions
As visible from (3.12)–(3.16), the strain amplitude affects both the dynamics and the distributions under oscillatory shear. To gain intuition for the role played by oscillatory strain amplitude, we examine analytically-tractable triangle-wave shear. We solve for three limiting cases, namely low amplitudes, large amplitudes, and intermediate resonant amplitudes, and compare the calculations with simulations. Finally, we compare numerical solutions for
 $D_{eff}^{r}$
and
 ${\it\rho}$
at arbitrary amplitudes with the results from our simulation before discussing similarities between changing the strain amplitude and changing the shear rate. We find that changing the strain amplitude allows for significant control over both the particle orientations and diffusion.
4.1. Triangle-wave oscillatory shear
 $\mathfrak{D}$

The solutions of (3.12)–(3.16) depend on the particular waveform
 $\dot{{\it\Gamma}}(t)$
through
 $\mathfrak{D}({\it\kappa})$
. To gain intuition for the distributions under oscillatory shear, we solve for the simplest possible waveform: triangle-wave oscillatory shear. Here the waveform is
 $\dot{{\it\Gamma}}(t)=1$
for the first half of a cycle,
 $0<t<T_{cyc}/2$
, and is
 $\dot{{\it\Gamma}}(t)=-1$
for the second half,
 $T_{cyc}/2<t<T_{cyc}$
. If the peak-to-peak strain amplitude is
 ${\it\gamma}$
, then
 $T_{cyc}={\it\gamma}/\dot{{\it\gamma}}$
and
 $\mathfrak{D}$
from (3.8) can be written as
 $$\begin{eqnarray}\mathfrak{D}({\it\kappa})/D_{0}^{r}=\frac{\dot{{\it\gamma}}}{{\it\gamma}}\int _{0}^{{\it\gamma}/\dot{{\it\gamma}}}\left(\frac{\bar{u}}{u({\it\kappa}+\bar{u}{\it\tau})}\right)^{2}\text{d}{\it\tau}.\end{eqnarray}$$
Since
 $\dot{{\it\Gamma}}(t)$
has the same form for the first and second half of each cycle, the contribution to
 $\mathfrak{D}$
from shearing forward is the same as from shearing backward, and
 $\mathfrak{D}$
takes the simple form given above. For the particular rotational velocity field
 $u({\it\phi})$
from a Jeffery orbit,
 $\mathfrak{D}$
for triangle-wave shear can be solved exactly using (3.6):
 $$\begin{eqnarray}\displaystyle \mathfrak{D}({\it\kappa})/D_{0}^{r} & = & \displaystyle \frac{3}{8}(p-1/p)^{2}+1+\frac{1}{4{\it\gamma}}(p^{2}-1/p^{2})\nonumber\\ \displaystyle & & \displaystyle \times \left\{\frac{1}{8}(p-1/p)\left[\sin 4\left({\it\kappa}+\frac{{\it\gamma}}{p+1/p}\right)-\sin 4{\it\kappa}\right]\right.\nonumber\\ \displaystyle & & \displaystyle -\left.(p+1/p)\left[\sin 2\left({\it\kappa}+\frac{{\it\gamma}}{p+1/p}\right)-\sin 2{\it\kappa}\right]\right\};\end{eqnarray}$$
however, in what follows we will not need to use the complete form of
 $\mathfrak{D}$
.
4.2. Small strain amplitudes
We begin by solving (3.12)–(3.16) for both the distributions and the diffusion in the limit of small strain amplitudes
 ${\it\gamma}\ll 1$
, while the strain rate is still large (
 $\mathit{Pe}\gg 1$
). By Taylor expanding the integrands in (4.1) about
 ${\it\tau}=0$
and integrating, the coordinate change
 $\partial z/\partial {\it\kappa}=\sqrt{D_{0}^{r}/\mathfrak{D}({\it\kappa})}$
can be written as
 $$\begin{eqnarray}\frac{\partial z}{\partial {\it\kappa}}=\frac{u}{\bar{u}}\left[1+\frac{{\it\gamma}}{2\dot{{\it\gamma}}}\frac{\bar{u}}{u}\frac{\partial u}{\partial {\it\kappa}}+O({\it\gamma}^{2})\right],\end{eqnarray}$$
where we have also Taylor expanded the inverse square root and truncated both Taylor series to
 $O({\it\gamma}^{2})$
. Following (3.10) and (3.16) above, we use this coordinate transformation
 $\partial z/\partial {\it\kappa}$
to find both the distributions and the effective diffusion.
To find the distribution
 ${\it\rho}({\it\phi})$
, we substitute
 $(\mathfrak{D}/D_{0}^{r})^{-1/2}$
from (4.3) above into (3.10):
 $$\begin{eqnarray}{\it\rho}({\it\phi})\propto 1+\frac{{\it\gamma}}{2\dot{{\it\gamma}}}\frac{\bar{u}}{u}\frac{\partial u}{\partial {\it\kappa}}+O({\it\gamma}^{2}).\end{eqnarray}$$
Further manipulation can eliminate the
 ${\it\kappa}$
dependence in this equation. The derivative
 $\bar{u}/u\times \partial u/\partial {\it\kappa}$
can be written in terms of the divergence of the velocity by writing
 $\partial u/\partial {\it\kappa}=\partial u/\partial {\it\phi}\times \partial {\it\phi}/\partial {\it\kappa}$
and using
 $\partial {\it\phi}/\partial {\it\kappa}=u/\bar{u}$
, cf. (3.2). Since
 $\partial u/\partial {\it\phi}=\boldsymbol{{\rm\nabla}}\boldsymbol{\cdot }\boldsymbol{u}$
, this substitution with the appropriate normalization constant gives
 ${\it\rho}$
at the start of a cycle as
 $$\begin{eqnarray}{\it\rho}({\it\phi})=\frac{1}{2{\rm\pi}}\left[1+\frac{{\it\gamma}}{2\dot{{\it\gamma}}}\boldsymbol{{\rm\nabla}}\boldsymbol{\cdot }\boldsymbol{u}\right]=\frac{1}{2{\rm\pi}}\left[1-\frac{{\it\gamma}}{2}\frac{p^{2}-1}{p^{2}+1}\sin 2{\it\phi}\right]+O({\it\gamma}^{2}),\end{eqnarray}$$
where we have used the definition of
 $u$
from the Jeffery orbit, (2.1).
To find the effective diffusion, we first find
 $z({\it\kappa}=2{\rm\pi})$
by integrating (4.3) over
 ${\it\kappa}=(0,2{\rm\pi})$
. The
 $O(1)$
term in
 $z(2{\rm\pi})$
is simply
 $2{\rm\pi}$
, since the integral of
 $u$
over a period is
 $2{\rm\pi}\bar{u}$
by definition. For the
 $O({\it\gamma})$
correction to
 $z(2{\rm\pi})$
from (4.3) and (3.16), the additional integral is
 $\propto \!\int _{0}^{2{\rm\pi}}(\partial u/\partial {\it\kappa})\,\text{d}{\it\kappa}$
, which is zero since
 $u$
is periodic in
 ${\it\kappa}$
. Substituting these values of
 $z({\it\kappa}=2{\rm\pi})$
into (3.16) shows that to
 $O({\it\gamma})$
, the diffusion is not enhanced:
 $$\begin{eqnarray}D_{eff}^{r}=D_{0}^{r}+O({\it\gamma}^{2}).\end{eqnarray}$$
In the limit of
 ${\it\gamma}\rightarrow 0$
, both the distributions and the diffusion remain unchanged from their zero-shear value, despite the strain rate dominating over diffusion (
 $\dot{{\it\gamma}}\gg D_{0}^{r}$
). In this limit, the frequency of the shear is large compared to the rotary diffusion. The distribution remains isotropic because the flow oscillates so rapidly that diffusion cannot alter the distribution at all over a cycle. Similarly, since the portion of the Jeffery orbit traversed by a given particle is so small, over one cycle the particle does not explore the varying rotary velocities needed to enhance the diffusion. As a result, the diffusion remains at its equilibrium value and is not enhanced.
As
 ${\it\gamma}$
is increased, the particles start to sample more of the Jeffery orbit. At these larger amplitudes, enough of the Jeffery orbit is traversed where it can interact with diffusion. This interplay results in an
 $O({\it\gamma})$
correction to the distribution, (4.5). Physically, the form of the distribution arises because the Jeffery orbit starts to align the distribution. Since the flow oscillates too fast for the distribution to align completely, the result is a partial alignment along the extensional axis, where the stretching due to the Jeffery orbit is largest. Interestingly, this
 $\propto \sin 2{\it\phi}$
correction to the distributions for large
 $\mathit{Pe}$
and low
 ${\it\gamma}$
is the same form as the correction to the continuous shear distribution at low
 $\mathit{Pe}$
and large
 ${\it\gamma}$
, cf. Peterlin (Reference Peterlin1938), Kim & Fan (Reference Kim and Fan1984), Stasiak & Cohen (Reference Stasiak and Cohen1987) and Strand et al. (Reference Strand, Kim and Karrila1987). However, this similarity is somewhat coincidental as it depends on the form of
 $\boldsymbol{u}$
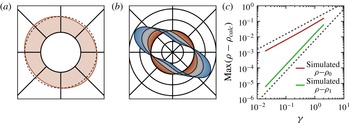
. There is excellent agreement between the predictions for the distributions and our simulations, as shown in figure 3.
Small-amplitude oscillatory shear orientation distributions, for particles with aspect ratio
 $p=2.83$
at
 $\mathit{Pe}=10^{4}$
. (a) The distribution
 ${\it\rho}({\it\phi})$
from simulation at a strain amplitude of
 ${\it\gamma}=0.3$
. (b) The corrections to the distribution
 ${\it\delta}{\it\rho}\equiv {\it\rho}({\it\phi})-1/2{\rm\pi}$
as measured from simulation, for strain amplitudes ranging from
 ${\it\gamma}=0.02$
(innermost red curve) to
 ${\it\gamma}=2.0$
(outermost blue curve), with four curves equally spaced in
 ${\it\gamma}$
highlighted in black. At amplitudes near
 ${\it\gamma}=2$
, higher-order corrections cause the distribution to move away from 45° extensional axes. The circular gridlines are spaced at separations of
 ${\it\delta}{\it\rho}=0.5/2{\rm\pi}$
, with the second gridline corresponding to
 ${\it\delta}{\it\rho}=0$
; the radial gridlines are equally spaced in
 ${\it\phi}$
. (c) Log–log plot showing the maximal deviation
 ${\it\rho}{-}{\it\rho}_{0}$
of the simulated distributions from the zero-amplitude distribution (upper red curve) and the maximal deviation
 ${\it\rho}{-}{\it\rho}_{1}$
from the first-order correction (lower green curve), as a function of
 ${\it\gamma}$
. The second-order corrections are about 20 % of the first-order correction at
 ${\it\gamma}=1$
.

In contrast, due to symmetry the diffusion constant is only enhanced at
 $O({\it\gamma}^{2})$
, cf. (4.6). The diffusion constant
 $D_{eff}^{r}$
describes the long-time orientation dynamics; thus
 $D_{eff}^{r}$
must be symmetric under a reversal in the flow direction. Since reversing the flow direction corresponds to changing
 ${\it\gamma}\rightarrow -{\it\gamma}$
and
 ${\it\phi}\rightarrow -{\it\phi}$
,
 $D_{eff}^{r}$
cannot be enhanced at
 $O({\it\gamma})$
; the quadratic increase of
 $D_{eff}^{r}$
with
 ${\it\gamma}$
is shown in the inset to figure 5(a). The distributions, on the other hand, depend on both
 ${\it\gamma}$
and
 ${\it\phi}$
and therefore can have an
 $O({\it\gamma})$
correction while still respecting this symmetry.
4.3. Intermediate resonant amplitudes
By noting other symmetries of oscillatory shear and the Jeffery orbits, we can find another solution to the oscillatory shear equations. The Jeffery rotary velocity field repeats itself after half an orbit, as visible from (1.1) and figure 1. Thus, a particle starting at a given orientation samples the same velocities whether it is sheared forwards or backwards for half an orbit. This symmetry is reflected in the triangle-wave
 $\mathfrak{D}({\it\kappa})$
in (4.2): at resonant strain amplitudes
 ${\it\gamma}_{r}\equiv n{\rm\pi}(p+1/p)$
corresponding to half a Jeffery orbit,
 $\mathfrak{D}({\it\kappa})$
takes its constant continuous shear value. As a result, at half-integer Jeffery orbit amplitudes, triangle-wave oscillatory shear is exactly the same as continuous shear, with the same distributions and diffusion constant.
Since (3.7) and (4.1) are considerably simplified at resonance under triangle-wave shear, they allow for a perturbative treatment near
 ${\it\gamma}_{r}$
. The procedure is similar to the low-amplitude strain treatment outlined above, except here the small parameter is the difference
 ${\it\delta}{\it\gamma}$
from a resonant strain amplitude
 ${\it\gamma}_{r}$
; i.e.
 ${\it\gamma}={\it\gamma}_{r}+{\it\delta}{\it\gamma}$
. Since resonant amplitude shear is similar to continuous shear, the distribution is simplest in the continuous shear coordinate
 ${\it\kappa}$
. To first order in
 ${\it\delta}{\it\gamma}$
, the ancillary distribution
 $f({\it\kappa})$
and the diffusion are
 $$\begin{eqnarray}\displaystyle & \displaystyle f({\it\kappa})=\frac{1}{2{\rm\pi}}\left\{1+\frac{{\it\delta}{\it\gamma}}{{\it\gamma}_{r}}\left[\frac{{\it\lambda}}{1+{\it\lambda}^{2}/2}\cos (2{\it\kappa})-\frac{{\it\lambda}^{2}}{4(1+{\it\lambda}^{2}/2)}\cos (4{\it\kappa})\right]\right\}+O({\it\delta}{\it\gamma}^{2}), & \displaystyle\end{eqnarray}$$
 $$\begin{eqnarray}\displaystyle & D_{eff}^{r}/D_{0}^{r}=\frac{3}{8}(p-1/p)^{2}+1+O({\it\delta}{\it\gamma}^{2}). & \displaystyle\end{eqnarray}$$
 ${\it\delta}{\it\gamma}$
, and the diffusion does not change until
 $O({\it\delta}{\it\gamma}^{2})$
. However, unlike the low-amplitude case, the correction to the distribution is not a single harmonic, but it is composed of two harmonics in the stretched
 ${\it\kappa}$
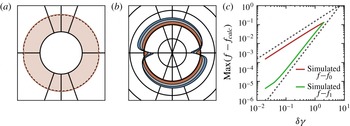
-space. These predictions are compared against simulation results in figure 4 for the distributions and figure 5(a) for the diffusion. While figure 4 only compares the simulated and predicted distributions near the first resonant peak for a single aspect ratio, we find good agreement between (4.7) and (4.8) and the simulation over a range of both aspect ratios and resonant amplitudes.
Oscillatory shear orientation distributions for particles with aspect ratio
 $p=2.83$
(i.e. Jeffery orbit period
 $\dot{{\it\gamma}}T_{JO}=20$
) at
 $\mathit{Pe}=10^{4}$
and a strain amplitude near the first resonance. (a) The ancillary distribution
 $f({\it\kappa})$
from simulation at a strain amplitude of
 ${\it\gamma}=10.6$
; note the small bias away from the flow direction. (b) The difference between the continuous shear
 $f$
and that measured from simulation, for positive distances from resonance
 ${\it\delta}{\it\gamma}=0$
(innermost red curve) to
 ${\it\delta}{\it\gamma}=1.0$
(outermost blue curve), with four curves equally spaced in
 ${\it\delta}{\it\gamma}$
highlighted in black. The circular gridlines are spaced at intervals of
 ${\it\delta}f=0.15/2{\rm\pi}$
, with the second gridline corresponding to
 ${\it\delta}f=0$
. The radial gridlines are equally-spaced in
 ${\it\phi}$
(not
 ${\it\kappa}$
). (c) Log–log plot showing the maximal deviation
 $f{-}f_{0}$
of the ancillary distribution from the continuous shear
 $f$
(upper red curve) and the maximal deviation
 $f{-}f_{1}$
from the first-order correction (lower green curve), as a function of
 ${\it\delta}{\it\gamma}$
. The second-order corrections are about 20 % of the first-order correction at
 ${\it\delta}{\it\gamma}=0.4$
.

(a) Oscillatory shear diffusion
 $D_{eff}^{r}$
versus
 ${\it\gamma}$
for particles with aspect ratio
 $p\approx 2.83$
, as calculated from (3.16) (green line) and as measured from simulation at
 $\mathit{Pe}=10^{4}$
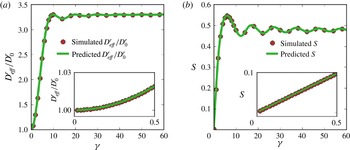
(red circles). The results from simulation and from (3.16) are the same to the resolution of the plot. The oscillations in the diffusion constant with increasing strain amplitude are clearly visible. Inset:
 $D_{eff}^{r}/D_{0}^{r}$
at low amplitudes. (b) The liquid crystal order parameter
 $S$
versus
 ${\it\gamma}$
at the start of a shear cycle for particles
 $p\approx 2.83$
, as predicted from (3.10), green line, and measured from simulation at
 $\mathit{Pe}=10^{4}$
, red dots. At zero strain amplitude the distribution is randomly aligned (
 $S=0$
); with increasing strain amplitude the distribution becomes more aligned, with maximum alignment at
 ${\it\gamma}=6$
. Inset:
 $S$
at low amplitudes. In the main panels of both (a) and (b) only 1 % of the simulated points are plotted to avoid overcrowding.

4.4. Very large amplitudes
Since continuous shear can be thought of as triangle-wave oscillatory shear with infinite strain amplitude, we expect that at very large amplitudes the distributions only vary slightly from the continuous shear distributions. This approach to continuous shear can be seen directly from (4.1) and (4.2). The function
 $\mathfrak{D}({\it\kappa};{\it\gamma})$
, which determines both
 $D_{eff}^{r}$
and
 ${\it\rho}$
, is an average value of a periodic function where the strain amplitude
 ${\it\gamma}$
sets the range of the integration. As
 ${\it\gamma}$
is increased, more and more periods of the integrand are averaged over, and
 $\mathfrak{D}({\it\kappa})$
approaches its infinite-period average value of the continuous shear
 $D_{eff}^{r}$
from (2.15). In the limit of infinite amplitude, the oscillatory shear equation (3.7) becomes the continuous shear equation (2.13). Examining the many-cycle averages in (3.8) shows that the difference between
 $\mathfrak{D}({\it\kappa};{\it\gamma})$
and the continuous shear limit decreases as
 ${\sim}1/{\it\gamma}$
, which is echoed by the distributions near resonance in (4.7). Both empirically and by analytically evaluating the many-cycle averages, we find that
 $D_{eff}^{r}$
approaches its continuous shear value like
 ${\sim}1/{\it\gamma}^{2}$
, faster than the distributions do.
4.5. Arbitrary amplitudes
The oscillatory shear equations (3.12)–(3.16) give predictions for
 $D_{eff}^{r}$
and the distributions at all amplitudes, not just at the ones treated perturbatively above. We find the effective diffusion and distributions at arbitrary amplitudes by evaluating (3.10) and (3.16) numerically for triangle-wave shear. Since oscillatory shear can also be used to control the alignment of colloidal rods, we quantify
 ${\it\rho}$
via the liquid crystal scalar order parameter
 $S$
which captures the degree of total alignment irrespective of the direction. The order parameter
 $S$
is defined as the largest eigenvalue of the traceless orientation tensor
 $\unicode[STIX]{x1D64C}$
; in two dimensions
 $\unicode[STIX]{x1D64C}$
is defined as
 $\unicode[STIX]{x1D64C}=2\langle \boldsymbol{n}\boldsymbol{n}\rangle -{\bf\delta}$
, where
 ${\bf\delta}$
is the identity tensor and
 $\boldsymbol{n}$
the orientation unit normal. For an isotropic distribution,
 $S=0$
; for a perfectly aligned distribution,
 $S=1$
. Figure 5 compares these predicted values (green lines) of
 $D_{eff}^{r}$
, (a), and
 $S$
, (b), versus
 ${\it\gamma}$
against those measured from simulation (red dots). We find excellent agreement between this semi-analytic theory and full numerical simulations for both the diffusion coefficients and distributions, both for the aspect ratio
 $p=2.83$
shown in figure 5 and over a range of aspect ratios (not shown). The diffusion increases gradually from its zero-amplitude value
 $D_{eff}^{r}/D_{0}^{r}=1$
, reaching the continuous shear value at the resonant amplitude
 ${\it\gamma}_{r}$
. At higher amplitudes, the diffusion undergoes damped oscillations with
 ${\it\gamma}$
, asymptotically approaching its continuous shear value at large strains. In contrast, the order parameter
 $S$
increases from 0 linearly with
 ${\it\gamma}$
when
 ${\it\gamma}$
is small. Moreover,
 $S$
is not maximal at the resonant amplitudes, but is instead maximal at an amplitude slightly below the first resonance. The order parameter then decreases slightly to its continuous shear value, with damped oscillations at larger
 ${\it\gamma}$
.
5. Rheology
The orientation distribution of axisymmetric particles affects the suspension rheology. In the dilute limit, the additional deviatoric stress
 ${\bf\sigma}^{p}$
due to the particles is
 $$\begin{eqnarray}\displaystyle {\bf\sigma}^{p} & = & \displaystyle 2{\it\eta}c\left\{2A_{H}\left(\unicode[STIX]{x1D640}:\langle \boldsymbol{n}\boldsymbol{n}\boldsymbol{n}\boldsymbol{n}\rangle -{\bf\delta}\unicode[STIX]{x1D640}:\langle \boldsymbol{n}\boldsymbol{n}\rangle \right)\right.\nonumber\\ \displaystyle & & \displaystyle +\,2B_{H}\left(\unicode[STIX]{x1D640}\boldsymbol{\cdot }\langle \boldsymbol{n}\boldsymbol{n}\rangle +\langle \boldsymbol{n}\boldsymbol{n}\rangle \boldsymbol{\cdot }\unicode[STIX]{x1D640}-{\textstyle \frac{2}{3}}{\bf\delta}\unicode[STIX]{x1D640}:\langle \boldsymbol{n}\boldsymbol{n}\rangle \right)\nonumber\\ \displaystyle & & \displaystyle +\left.C_{H}\unicode[STIX]{x1D640}+F_{H}D_{0}^{r}\left(\langle \boldsymbol{n}\boldsymbol{n}\rangle -{\textstyle \frac{1}{3}}{\bf\delta}\right)\right\}\end{eqnarray}$$
where
 ${\it\eta}$
is the solvent viscosity,
 $c$
is the volume fraction of particles,
 $\unicode[STIX]{x1D640}$
is the far-field rate-of-strain tensor of the fluid,
 ${\bf\delta}$
is the identity tensor, and
 $A_{H},B_{H},C_{H}~\text{and}~F_{H}$
are hydrodynamic coefficients (Jeffery Reference Jeffery1922; Batchelor Reference Batchelor1970; Hinch & Leal Reference Hinch and Leal1972; Brenner Reference Brenner1974; Shaqfeh & Fredrickson Reference Shaqfeh and Fredrickson1990; Kim & Karrila Reference Kim and Karrila2005). The terms
 $\propto \unicode[STIX]{x1D640}$
result from the additional hydrodynamic resistance due to the particles, which depends on the particles’ specific orientations through the average tensors
 $\langle \boldsymbol{n}\boldsymbol{n}\rangle$
and
 $\langle \boldsymbol{n}\boldsymbol{n}\boldsymbol{n}\boldsymbol{n}\rangle$
. The final term
 $\propto F_{H}D_{0}^{r}$
is an additional stress due to Brownian rotations of the rods. If the distribution of rods is not isotropic, these Brownian rotations result in a net stress. As the particle orientations and thus the tensors
 $\langle \boldsymbol{n}\boldsymbol{n}\rangle$
and
 $\langle \boldsymbol{n}\boldsymbol{n}\boldsymbol{n}\boldsymbol{n}\rangle$
couple to the flow, even a dilute suspension of elongated particles has a non-Newtonian rheology. Since
 $\langle \boldsymbol{n}\boldsymbol{n}\rangle$
and
 $\langle \boldsymbol{n}\boldsymbol{n}\boldsymbol{n}\boldsymbol{n}\rangle$
are in general not multiples of the identity, (5.1) generically predicts normal stresses. Moreover, both the normal stresses and shear stresses display transients before reaching their steady-state values, which in turn depend on the shear rate.
These effects have been well-studied for steady-state distributions, over a range of Péclet numbers and particle aspect ratios from theory (Peterlin Reference Peterlin1938; Leal & Hinch Reference Leal and Hinch1971; Hinch & Leal Reference Hinch and Leal1972; Leal & Hinch Reference Leal and Hinch1972; Hinch & Leal Reference Hinch and Leal1976; Stasiak & Cohen Reference Stasiak and Cohen1987; Strand et al.
Reference Strand, Kim and Karrila1987), experiments (Bibbo, Dinh & Armstrong Reference Bibbo, Dinh and Armstrong1985; Jogun & Zukoski Reference Jogun and Zukoski1999; Brown et al.
Reference Brown, Clarke, Convert and Rennie2000; Petrich, Cohen & Koch Reference Petrich, Cohen and Koch2000; Chaouche & Koch Reference Chaouche and Koch2001), and simulations (Scheraga Reference Scheraga1955; Stewart & Sorensen Reference Stewart and Sorensen1972; Strand et al.
Reference Strand, Kim and Karrila1987). Less is known about the rheology of rod suspensions in time-dependent flows at high
 $\mathit{Pe}$
. Hinch & Leal (Reference Hinch and Leal1973) made qualitative arguments describing the stress oscillations with time in a rod suspension; there have also been several simulations of the time-dependent orientation distributions, e.g. Férec et al. (Reference Férec, Heniche, Heuzey, Ausias and Carreau2008) and Eberle et al. (Reference Eberle, Vélez García, Baird and Wapperom2010), that also examined transient stresses. Our theory of rod dynamics builds on these results by providing a quantitative physical picture of the unsteady rheology of a suspension of rods at high
 $\mathit{Pe}$
, albeit with orientations confined to the flow–gradient plane.
5.1. Rheological transients during startup shear
From (2.13) and (5.1) we calculate the shear stress of the suspension of ellipsoidal particles during the startup of shear, for two suspensions with aspect ratios
 $p=2.83$
and
 $p=5.00$
at
 $\mathit{Pe}=10^{4}$
. The orientation distribution starts out isotropically oriented. When the flow starts, the ellipsoids start to tumble in periodic Jeffery orbits, resulting in the large-scale periodic oscillations in the shear stress (figure 6
a). These oscillations slowly damp out with time as the enhanced rotational diffusion brings the orientation distribution to steady state. Since the diffusion is enhanced
 ${\sim}p^{2}$
for large
 $p$
, the oscillating stress for
 $p=5.00$
damps faster than the oscillating stress for
 $p=2.83$
. At very short times, two additional small peaks in the stress are visible in these oscillations. However, this stress feature decays extremely rapidly: even at a large
 $\mathit{Pe}=10^{4}$
, it disappears before half a Jeffery orbit for
 $p=5.00$
.
(a) The additional suspension stress
 ${\it\sigma}_{xy}^{p}/{\it\eta}c\dot{{\it\gamma}}$
under continuous shear, normalized by the solvent viscosity, shear rate magnitude, and aspect ratio, as a function of dimensionless time
 $\dot{{\it\gamma}}t$
. The stress for two suspensions at
 $\mathit{Pe}=10^{4}$
are shown: with aspect ratios
 $p=2.83$
(blue) and
 $p=5.00$
(orange). (b) The orientation-dependent stress term
 $(1-\cos 4{\it\phi})/8$
as a function of
 ${\it\kappa}$
for
 $p=5.00$
. The stress term translates with time, as shown by the centred bright orange curve at
 $\bar{u}t=0$
and the shifted drab orange curve at
 $\bar{u}t=0.4{\rm\pi}$
. The double-peaks in the stress term are separated in
 ${\it\kappa}$
by a distance that scales as
 ${\sim}1/p$
when
 $p$
is large. (c) The ancillary distribution
 $f({\it\kappa})$
, at two times: immediately after startup (black line) and at a time slightly after the double peaks have disappeared (grey line). (d) The times for the double peaks (magenta) and single peaks (cyan) to decay, as a function of aspect ratio. The decay times follow the
 ${\sim}1/D_{0}^{r}p^{4}$
and
 ${\sim}1/D_{0}^{r}p^{2}$
large-
 $p$
scalings, respectively, shown in the dotted lines.

To understand the origins of these two types of temporal oscillations in the shear stress shown in figure 6(a), we examine (5.1) term by term. For large shear rates, the last term
 $\propto D_{0}^{r}$
is negligible compared to the other terms
 $\propto \unicode[STIX]{x1D640}$
, being smaller by a factor of
 $1/\mathit{Pe}$
. The third term
 $C_{H}\unicode[STIX]{x1D640}$
is independent of time, since the strain rate
 $\unicode[STIX]{x1D640}$
is fixed. For orientations confined to the flow–gradient plane, the second term’s contribution to the shear stress is also independent of time, since
 $2(\unicode[STIX]{x1D640}\boldsymbol{\cdot }\langle \boldsymbol{n}\boldsymbol{n}\rangle +\langle \boldsymbol{n}\boldsymbol{n}\rangle \boldsymbol{\cdot }\unicode[STIX]{x1D640})_{xy}=\langle n_{x}^{2}+n_{y}^{2}\rangle =1$
. Thus, at high
 $\mathit{Pe}$
, only the first term
 $\propto \unicode[STIX]{x1D640}:\langle \boldsymbol{n}\boldsymbol{n}\boldsymbol{n}\boldsymbol{n}\rangle$
in (5.1) contributes significantly to the time-dependent shear stress. This term provides an additional shear stress
 $(\langle \boldsymbol{n}\boldsymbol{n}\boldsymbol{n}\boldsymbol{n}\rangle :\unicode[STIX]{x1D640})_{xy}=\langle 1-\cos 4{\it\phi}\rangle /8$
that is largest at the four orientations along the principle strain axes,
 ${\it\phi}=(n/2+1/4){\rm\pi}$
. Likewise, the stress term is minimal at four orientations that occur when the particle is either aligned with the flow or perpendicular to the flow,
 ${\it\phi}=n{\rm\pi}/2$
. Thus the time-varying suspension stress arises from the interplay between the time-varying distributions and the orientation-dependent stress term
 $(1-\cos 4{\it\phi})/8$
.
As discussed in § 2, the evolution of the orientations is simplest in the stretched coordinate
 ${\it\kappa}$
. In this coordinate space, the orientation-dependent stress term
 $(1-\cos 4{\it\phi})/8$
is bunched in
 ${\it\kappa}$
and moves with a constant velocity
 $\bar{u}=\dot{{\it\gamma}}/(p+1/p)$
. The four maximal stress orientations
 ${\it\phi}=(n/2+1/4){\rm\pi}$
are mapped to
 ${\it\kappa}+\bar{u}t=\tan (\pm 1/p)$
and
 $\tan (\pm 1/p)+{\rm\pi}$
, creating a double-peak in the stress term whose separation decreases as
 $1/p$
when
 $p$
is large, cf. (2.2) and figure 6(b). For an initially isotropic suspension, the ancillary distribution
 $f({\it\kappa})$
starts out tightly peaked and evolves diffusively to a constant value, figure 6(c). The resulting suspension stress arises from the average of the product of the
 ${\it\kappa}$
- and
 $t$
-dependent stress term and the time-dependent distribution
 $f({\it\kappa})$
.
On short times, the ancillary distribution
 $f$
remains essentially constant while the stress term translates in
 ${\it\kappa}$
. At time
 $t=0$
, the double peaks in the stress term are centred around the highly peaked initial distribution, which creates a relatively high stress as illustrated by figure 6(a–c). After a short time
 ${\sim}1/\dot{{\it\gamma}}$
, the stress term has moved to the left by the small amount
 ${\sim}1/p$
, and
 $f$
centres on one peak of the stress term. This large overlap produces the short-lived increase in the suspension stress occurring immediately after startup in figure 6(a). At a slightly later time
 ${\sim}p/\dot{{\it\gamma}}$
, the stress term progresses further to the left by an amount
 ${\sim}O(1)$
, as shown by the drab orange curves, and the troughs in the stress term align with the peaks of
 $f({\it\kappa})$
, giving rise to the large single troughs in the suspension stress. As the shear continues, the double peak of the stress term moves half a period and realigns with
 $f({\it\kappa})$
. This realignment produces the observed double peaks in the stress, and the cycle repeats.
(a) The normalized additional suspension shear stress
 ${\it\sigma}_{xy}^{p}/{\it\eta}c\dot{{\it\gamma}}$
as a function of time for triangle-wave oscillatory shear at amplitude
 ${\it\gamma}=5.0$
. We define the effective viscosity
 $[{\it\eta}_{eff}]$
as the average of this varying stress over one cycle (dashed black line in inset); the additional variation in the stress we quantify by range of the normalized stress over one half-cycle (grey band in inset). (b) The oscillatory shear effective viscosity
 $[{\it\eta}_{eff}]$
as a function of
 ${\it\gamma}$
. (c) The range of the normalized suspension stress as a function of
 ${\it\gamma}$
; it is always small compared to
 $[{\it\eta}_{eff}]$
.

On longer time scales, the enhanced diffusion starts to broaden the ancillary distribution. As
 $f({\it\kappa})$
broadens, it simultaneously samples multiple regions of the orientation-dependent stress term, and features in
 ${\it\sigma}_{xy}^{p}(t)$
start to disappear. The first to disappear is the double-peak in the suspension stress. When
 $f$
has broadened by the
 ${\sim}1/p$
separation between the double-peaks in the stress term, figure 6(c), both the double peaks and the single trough between them are sampled simultaneously, and the double-peaks in
 ${\it\sigma}_{xy}^{p}(t)$
become blurred into a single peak. Diffusion broadens
 $f({\it\kappa})$
by this
 ${\sim}1/p$
amount after a time
 ${\sim}(1/p)^{2}/D_{eff}^{r}\sim 1/D_{0}^{r}p^{4}$
for large
 $p$
. Even with moderate aspect ratios at high
 $\mathit{Pe}$
, the decay of the double-peaks in the suspension stress onsets extremely quickly: at
 $\mathit{Pe}=10^{4}$
and
 $p=5.0$
in figure 6(a), the peaks have disappeared before the first half Jeffery orbit. Beyond this time scale, the suspension stress continues to oscillate but only with a single-peaked structure. These single peaks in turn disappear after
 $f({\it\kappa})$
broadens by an
 $O(1)$
amount and samples the entirety of the stress term simultaneously. This
 $O(1)$
broadening only occurs after a much longer time
 ${\sim}1/D_{eff}^{r}\sim 1/D_{0}^{r}p^{2}$
for large
 $p$
.
The aspect ratio dependence of these two decay times is shown in figure 6(d). To verify the predicted large aspect ratio scaling, we evaluated the stress from (5.1) using the distributions predicted by the continuous shear theory, (2.13) and § 2. We define the double-peak disappearance time as the time when the stress at a half-integer Jeffery orbit switches from a local minimum to a local maximum, and we define the single-peak disappearance time as the time when the amplitude of the double-peaks decays to
 $1/\text{e}$
of its initial value, as described in detail in appendix B. We find good agreement between the simulated time scales and those predicted from the scaling argument above (figure 6
d). These two time scales
 ${\sim}1/D_{0}^{r}p^{4}$
and
 ${\sim}1/D_{0}^{r}p^{2}$
, first noticed by Hinch & Leal (Reference Hinch and Leal1973), both arise from the mixing of the phase angle in the Jeffery orbit. For orientations in three dimensions, there will be additional time scales associated with the relaxation of the orbit constants.
5.2. Overview of triangle-wave oscillatory shear rheology at long times
$t\gg 1/D_{eff}^{r}$

A representative shear stress signal during one cycle of oscillatory shear is plotted in figure 7(a), for spheroids with aspect ratio
 $p=2.83$
and peak-to-peak strain amplitude
 ${\it\gamma}=5$
, after
 $f({\it\kappa})$
has reached steady state. Although the transients of the orientation distribution have decayed,
 ${\it\rho}$
still oscillates with the period of one cycle. This oscillation in
 ${\it\rho}$
modulates the stress over one half-cycle (figure 7
a inset), and strictly there is no effective viscosity for a rod-like suspension under oscillatory shear. Nevertheless, since the variations in the stress are small, it is convenient to describe the stress response under oscillatory shear with its value averaged over a half-cycle. To this end, we define the ‘effective intrinsic viscosity’
 $[{\it\eta}_{eff}]$
of the suspension as the additional shear stress due to the ellipsoids normalized by the solvent viscosity, particle volume fraction, and shear rate,
 ${\it\sigma}_{xy}^{p}/({\it\eta}c\dot{{\it\gamma}})$
, and averaged over a half-cycle. The slight variation of the suspension stress we quantify by the range of the normalized stress over one-half cycle, shown in figure 7(c).
As is the case for continuous shear, the interplay between the orientation distribution and the stress term
 $(\unicode[STIX]{x1D640}:\boldsymbol{n}\boldsymbol{n}\boldsymbol{n}\boldsymbol{n})_{xy}=(1-\cos 4{\it\phi})/8$
determines the oscillatory shear rheology. However, there are a few differences between the procedure for understanding the suspension stress under oscillatory shear and under continuous shear. First, the stresses in the first and second half-cycle have the same magnitude, so we only examine the stress during the first half-cycle. Second, since diffusion is weak (
 $D_{eff}^{r}{\it\gamma}/\dot{{\it\gamma}}\ll 1$
),
 $f({\it\kappa})$
is constant throughout a cycle, and only the motion in
 ${\it\kappa}$
of the stress term produces a time-dependent suspension stress. Third, the change in the long-time
 $f({\it\kappa})$
with strain amplitude effects a change in the suspension stress with
 ${\it\gamma}$
. Fourth, due to its amplitude-dependent displacement
 $\bar{u}{\it\gamma}/\dot{{\it\gamma}}$
the motion of the stress term
 $(1-\cos 4{\it\phi})/8$
produces an additional
 ${\it\gamma}$
dependence in the suspension stress. By examining in this way the overlap between the ancillary distribution
 $f({\it\kappa})$
and the orientation-dependent stress term
 $(\unicode[STIX]{x1D640}:\boldsymbol{n}\boldsymbol{n}\boldsymbol{n}\boldsymbol{n})_{xy}({\it\kappa}+\bar{u}t)$
, we can reconstruct the suspension stress during one cycle of triangle-wave oscillatory shear and understand the oscillatory shear rheology shown in figure 7. Rather than laboriously examine each amplitude in the figure, we now examine three salient amplitude regions of interest: (i) low amplitudes
 ${\it\gamma}\ll 1$
, (ii) the strain amplitude with the maximal viscosity
 ${\it\gamma}\approx 1.7$
, and (iii) amplitudes near resonance
 ${\it\gamma}\approx {\it\gamma}_{r}$
.
5.3. Low amplitude
$[{\it\eta}_{eff}]$

For
 ${\it\gamma}\rightarrow 0$
, the orientation distribution is isotropic, cf. (4.5), and
 ${\bf\sigma}^{p}(t)$
is the same as in an isotropic distribution at shear startup. For finite but low amplitudes, the suspension stress is constant during each half-cycle at
 $O({\it\gamma})$
, figure 8(a). During each half-cycle of shear, the stress term moves by a small displacement
 $\bar{u}t=\bar{u}{\it\gamma}/\dot{{\it\gamma}}$
, as shown in figure 8(b). In addition,
 $f({\it\kappa})$
shifts from its zero-amplitude value (vertical line) as
 ${\it\gamma}$
increases, figure 8(c). This shift can be seen from (3.10) and (4.3):
 $f$
at small amplitudes is the first-order term in a Taylor series in
 ${\it\gamma}$
of an initially isotropic distribution
 $f_{0}({\it\kappa})$
shifted in
 ${\it\kappa}$
by half the displacement of the stress term:
 $$\begin{eqnarray}f({\it\kappa})=f_{0}\left({\it\kappa}+\frac{{\it\gamma}\bar{u}}{2\dot{{\it\gamma}}}\right)+O({\it\gamma}^{2}).\end{eqnarray}$$
Thus, to first order in
 ${\it\gamma}$
the centre of the stress term oscillates about the centre of
 $f$
. Since both
 $f$
and the stress term are constant to first order in
 ${\it\kappa}$
about their centres,
 ${\bf\sigma}^{p}(t)$
changes from its zero-amplitude value only at
 $O({\it\gamma}^{2})$
during the cycle. The displacement of
 $f$
in
 ${\it\kappa}$
-space corresponds to a distribution
 ${\it\rho}({\it\phi})$
at the start of a cycle that is larger along the flow’s compressional axis and is smaller along the extensional axis, reversing as the flow oscillates, cf. figure 3. The increase in the stress from orienting particles along the extensional axis at
 ${\it\phi}={\rm\pi}/4$
is exactly cancelled by the particle reorientation away from the compressional axis.
Low-amplitude
 ${\it\gamma}=0.3$
oscillatory shear rheology for a dilute suspension of particles with aspect ratio
 $p=2.83$
confined to the flow–gradient plane. (a) The normalized additional suspension stress
 ${\it\sigma}_{xy}^{p}/{\it\eta}_{0}c\dot{{\it\gamma}}$
as a function of dimensionless time
 $\dot{{\it\gamma}}t$
throughout one cycle of oscillatory shear, with a closeup of the stress during the first half cycle in the inset. (b) The orientation-dependent stress term
 $(\unicode[STIX]{x1D640}:\boldsymbol{n}\boldsymbol{n}\boldsymbol{n}\boldsymbol{n})_{xy}$
as a function of
 ${\it\kappa}$
. The stress term starts with its minimum centred at
 ${\it\kappa}=0$
, shown as the centred (right) curve in light blue. During the cycle, the Jeffery orbit advects the stress term through the lightly shaded region. At the end of the half-cycle, the stress term reaches its final position, shown as the shifted (left) curve in dark blue. (c) The ancillary distribution
 $f({\it\kappa})$
. The shaded region denotes the area swept out by the centre of the stress term. The peak of
 $f({\it\kappa})$
is shifted from
 ${\it\kappa}=0$
to the centre of the region that the stress term sweeps out during a cycle.

5.4. Amplitude resulting in maximal
$[{\it\eta}_{eff}]$

Despite the lack of an exact analytical solution for the distributions at arbitrary amplitudes, we can qualitatively understand the existence of a maximum in
 $[{\it\eta}_{eff}]$
. As shown above, for small amplitudes
 $f({\it\kappa})$
shifts as
 ${\it\gamma}$
increases but is otherwise unchanged. This shift suggests a mechanism for the maximal
 $[{\it\eta}_{eff}]$
. As
 $f({\it\kappa})$
is shifted by a larger amount, eventually its peak is centred on one peak in the stress term, producing a large suspension stress at the cycle’s start. During the cycle, the stress term translates until its trough and then second peak overlap with
 $f$
, creating first a slightly lower stress before another large stress again at the end of the half-cycle, similar to the double-peaks in the stress under continuous shear. This translation of
 $f$
corresponds to a distribution
 ${\it\rho}({\it\phi})$
that is isotropic at the centre of the cycle, but is nonlinearly distorted by the Jeffery orbit to orient more particles along the flow’s extensional axis than are removed from the compressional axis, cf. the
 ${\it\gamma}\approx 2$
contours in figure 3. This double-peak structure in the suspension stress and the shifted
 $f({\it\kappa})$
are borne out in figure 9(a,b). Since
 ${\bf\sigma}^{p}(t)$
increases at the ends of the cycle,
 $[{\it\eta}_{eff}]$
increases from its zero-amplitude value, and the range of the stress is non-zero. While the argument captures the essence of the occurrence of a maximal viscosity, there are higher-order corrections in
 ${\it\gamma}$
to
 $f$
that cause the suspension stress to deviate slightly from the expected results.
Oscillatory shear rheology at the strain amplitude
 ${\it\gamma}=1.67$
resulting in maximal viscosity for a dilute suspension of particles with aspect ratio
 $p=2.83$
. (a) The additional suspension stress as a function of dimensionless time
 $\dot{{\it\gamma}}t$
throughout the cycle. (b) The stress term
 $(\unicode[STIX]{x1D640}:\boldsymbol{n}\boldsymbol{n}\boldsymbol{n}\boldsymbol{n})_{xy}$
as a function of
 ${\it\kappa}$
. The stress term starts with its minimum centred at
 ${\it\kappa}=0$
, shown as the centred (right) curve in light blue. During the first half-cycle, the Jeffery orbit advects the stress term through the lightly shaded region until it reaches final position, shown as the shifted (left) curve in dark blue. (c) The ancillary distribution
 $f({\it\kappa})$
; the shaded region denotes the area swept out by the centre of the stress term. (d) Semi-log plot of the strain amplitude resulting in the maximal viscosity versus
 $p$
.

The argument above suggests a scaling with aspect ratio for the strain amplitude resulting in a maximal viscosity. As visible from the definition of
 ${\it\kappa}$
in (2.3), the separation between the double-peaks in the stress term scales as
 ${\sim}1/p$
for large
 $p$
. From (5.2), the small-amplitude correction to the ancillary distribution shifts
 $f$
by an amount
 ${\sim}{\it\gamma}/p$
, since
 $\bar{u}/\dot{{\it\gamma}}=1/(p+1/p)$
. Thus, at a strain amplitude
 ${\it\gamma}\sim 1$
independent of
 $p$
, the peak of
 $f$
is roughly centred on one of the peaks in the stress term. As a result, the amplitude producing the maximal viscosity should be independent of the particle aspect ratio
 $p$
. This prediction is verified in figure 9(d). The amplitude resulting in the maximal viscosity is practically constant with
 $p$
, varying by less than 10 % from
 ${\it\gamma}\approx 1.6$
at an aspect ratio
 $p=2$
to its asymptotic value
 ${\it\gamma}\approx 1.74$
at
 $p=100$
.
5.5. Resonant amplitude
$[{\it\eta}_{eff}]$

For resonant amplitudes
 ${\it\gamma}={\it\gamma}_{r}$
corresponding to half a Jeffery orbit period, the ancillary distribution does not vary with
 ${\it\kappa}$
:
 $f({\it\kappa})=1/2{\rm\pi}$
. As the stress term moves during the cycle, its overlap with the constant
 $f$
does not change, and the suspension stress remains constant during the cycle. A constant
 $f({\it\kappa})$
corresponds to a distribution
 ${\it\rho}({\it\phi})$
that does not change with time due to the Jeffery orbit, resulting in a suspension stress that is constant during a cycle. Thus, the resonant
 $f({\it\kappa})$
yields the same suspension stress and
 $[{\it\eta}_{eff}]$
as for continuous shear at long times.
For amplitudes slightly away from resonance
 ${\it\gamma}={\it\gamma}_{r}+{\it\delta}{\it\gamma}$
, the suspension stress changes at
 $O({\it\delta}{\it\gamma})$
, as shown in figure 10. The first-order correction to
 $f({\it\kappa})$
indicates that additional particles are oriented along the maximal stress directions. As a result, the suspension stress at the start of a cycle for amplitudes near resonance is
 $O({\it\delta}{\it\gamma})$
larger than the suspension stress at resonant amplitudes
 ${\it\gamma}_{r}$
. As the stress term moves, at the centre of the cycle it centres on regions where
 $f({\it\kappa})$
is less than its resonant-amplitude value, which decreases the suspension stress. Thus, the range of the stress increases linearly with
 ${\it\delta}{\it\gamma}$
, figure 7(c). However, since the effective intrinsic viscosity
 $[{\it\eta}_{eff}]$
is an average of the suspension stress, the oscillations during one half-cycle cancel out, and
 $[{\it\eta}_{eff}]$
remains the same as at resonance, as shown by the smooth minima in figure 7(b).
Oscillatory shear rheology for an aspect ratio
 $p=2.83$
and an amplitude
 ${\it\gamma}=10.6$
slightly above resonance. (a) The normalized additional suspension stress
 ${\it\sigma}_{xy}^{p}/{\it\eta}_{0}c\dot{{\it\gamma}}$
as a function of dimensionless time
 $\dot{{\it\gamma}}t$
throughout one cycle of oscillatory shear. (b)
 $(\unicode[STIX]{x1D640}:\boldsymbol{n}\boldsymbol{n}\boldsymbol{n}\boldsymbol{n})_{xy}$
as a function of
 ${\it\kappa}$
. The stress term starts with its minimum centred at
 ${\it\kappa}=0$
, shown as the centred (right) curve in light blue, and is advected by the Jeffery orbit through the lightly shaded region. Since
 ${\it\gamma}=10.6$
is slightly above resonance, the stress term translates by more than half a period and ends at the final position shown as the shifted (left) curve in dark blue. (c) The ancillary distribution
 $f({\it\kappa})$
. The shaded region denotes the area swept out by the centre of the stress term, with the darkly shaded region illustrating the regions where the minimum in the stress term has traversed twice.

6. Conclusion and discussion
In the preceding pages, we have solved for the time-dependent orientation distribution of rod-like particles under shear. Under continuous shear, the convection–diffusion equation is greatly simplified by a change of coordinates
 ${\it\phi}\rightarrow {\it\kappa}$
that removes the rotation of the Jeffery orbit. This coordinate transformation complicates the diffusion term, but allows it to be treated perturbatively with a method of averages, similar to that used for certain nonlinear ordinary differential equations (Sanders, Verhulst & Murdock Reference Sanders, Verhulst and Murdock2000) or for homogenization methods for effective medium properties (Bakhvalov & Panasenko Reference Bakhvalov and Panasenko1989; Cioranescu & Donato Reference Cioranescu and Donato1999). The convection–diffusion equation cleanly maps to a simple diffusion equation in the new coordinate, with an enhanced diffusion that depends on averages of the rotational velocity field:
 $D_{eff}^{r}=D_{0}^{r}\langle (\bar{u}/u)^{2}\rangle$
. For particles rotating in a Jeffery orbit, the diffusion under continuous shear is enhanced as
 ${\sim}p^{2}$
when
 $p$
is large. Since the orientation dynamics are an exact diffusion equation in the stretched
 ${\it\kappa}$
-coordinate at high
 $\mathit{Pe}$
, a complete solution for any initial distribution can be easily constructed, and all initial distributions relax to a constant ancillary distribution in the
 ${\it\kappa}$
-coordinate. This steady-state ancillary distribution is the two-dimensional analogue of the three-dimensional steady-state solution found by Leal & Hinch (Reference Leal and Hinch1971).
Under oscillatory shear, a particle does not sample all orientations during each cycle. As a result, the effective diffusion in the
 ${\it\kappa}$
-coordinate is an average over the regions the particle does sample, instead of an average over the entire Jeffery orbit. Since different particles sample different regions during a cycle, the effective diffusion changes with orientation
 ${\it\kappa}$
. This varying diffusion causes particles to drift away from the continuous shear distribution, changing
 $f$
from its continuous shear form. As a result of the orientationally-dependent diffusion, the orientation dynamics in
 ${\it\kappa}$
-space become complicated. However, it is always possible to map the
 ${\it\kappa}$
-dynamics under oscillatory shear to a simple diffusion equation in a new coordinate
 $z$
. Once this mapping is known, a full time-dependent solution for the distributions under oscillatory shear is easily constructed. While the coordinate change
 ${\it\kappa}\rightarrow z$
cannot in general be solved analytically, it can be treated perturbatively at certain amplitudes, particularly for triangle-wave shear, or solved numerically. The solutions for triangle-wave shear show that, for small strain amplitudes
 ${\it\gamma}\ll 1$
, the orientation distribution remains isotropic and the rotational diffusion is not enhanced. Moreover, the distributions when
 ${\it\gamma}\ll 1$
at large
 $\mathit{Pe}$
take the same form as the distributions when
 $\mathit{Pe}\ll 1$
at large
 ${\it\gamma}$
. At resonant amplitudes corresponding to half-integer Jeffery orbits, the orientation dynamics map exactly to the continuous shear orientation dynamics, providing the same effective diffusion constant and orientation distribution.
Since the moments of the orientation distribution determine the suspension rheology, the solutions for the orientation distributions allow for a detailed understanding of the suspension shear stresses. Examining the time evolution of the overlap between the orientation-dependent stress term
 $\unicode[STIX]{x1D640}:\boldsymbol{n}\boldsymbol{n}\boldsymbol{n}\boldsymbol{n}$
and the ancillary distribution
 $f({\it\kappa})$
quantitatively explains all the features in both the continuous and oscillatory shear suspension rheology. In particular, our formalism demonstrates the existence of two diffusive time scales in the continuous shear rheology, and predicts an amplitude-dependent effective intrinsic viscosity under oscillatory shear.
6.1. Comparison to Taylor dispersion
Our approach of mapping the rod dynamics to an effective diffusion equation is reminiscent of Taylor dispersion. The canonical Taylor dispersion was calculated by Taylor for Poiseuille flow in a circular pipe (Taylor Reference Taylor1953, Reference Taylor1954). As the non-uniform flow in the pipe moves different solute parcels at different speeds, the solute spreads out along the axial direction while diffusion erases the flow-induced radial inhomogeneity. Taylor realized that this combination of diffusion and differential advection maps to a simple diffusion equation along the pipe’s axis, with a greatly enhanced effective diffusion constant. This result is reminiscent of the rotational dynamics discussed above: the combination of diffusion and differential rotation due to the Jeffery orbit maps to a simple diffusion equation. A natural question to ask is whether the enhanced rotational diffusion is simply a modified Taylor dispersion, or whether it is only similar.
The most general formulation of Taylor dispersion was realized by Howard Brenner and others in the 1980s (Frankel & Brenner Reference Frankel and Brenner1989). He viewed the essence of Taylor’s method as examining long times where the distribution is equilibrated in a small subspace
 $\boldsymbol{q}$
(e.g. the cross-section of the pipe) to allow for simple calculations of behaviour in other, larger subspaces
 $\boldsymbol{Q}$
(e.g. along the axis of the pipe). This abstraction of Taylor dispersion to arbitrary spaces allows for a rigorous, clean calculation of long-time behaviours. In addition to describing the original Taylor dispersion problem, Brenner and others used this insight to understand the dynamics of seemingly disparate systems, such as the sedimentation velocity of a non-spherical particle (Brenner Reference Brenner1979) or of a cluster of particles (Brenner, Nadim & Haber Reference Brenner, Nadim and Haber1987), as well as for more intractable problems such as Brownian motion of particles under shear flow (Leighton Reference Leighton1989; Frankel & Brenner Reference Frankel and Brenner1991, Reference Frankel and Brenner1993).
However, the orientation dynamics described in the current paper do not fit simply into the canonical generalized Taylor dispersion picture. In the generalized Taylor dispersion picture, there are two separate positional subspaces
 $\boldsymbol{q}$
and
 $\boldsymbol{Q}$
. In the rotational dynamics calculated in this paper, there is only one positional subspace, corresponding to the angular coordinate
 ${\it\phi}$
or
 ${\it\kappa}$
. Thus, Brenner’s approach will not work for the problem of rotational diffusion. In part, this limitation arises from the nature of the rotary velocity field and the diffusion. In Taylor dispersion, the enhanced diffusion arises from Brownian motion perpendicular to the rotary velocity field. In the enhanced rotational diffusion calculated here, the enhancement arises from Brownian motion parallel to the rotary velocity field, and the varying velocity along the streamline enhances the rotational diffusion. In contrast, in traditional Taylor dispersion diffusion parallel to streamlines does not enhance dispersion, since the fluid flow is presumed incompressible.
While our analysis for the evolution of the orientation distribution equations does not fit neatly into Brenner’s generalized Taylor dispersion, there are still some mathematical similarities between the two. Instead of integrating over a small positional subspace
 $\boldsymbol{q}$
, the analysis in this paper proceeds by integrating over a short time, either one period of a Jeffery orbit or one oscillatory cycle. It is this step that allows for a mapping to a diffusion equation, as it is the small subspace step that allows generalized Taylor dispersion to map complicated dynamics to simpler equations.
6.2. Applicability to particle orientations in three dimensions
The analysis presented above is for particle orientations confined to the flow–gradient plane. A natural question to ask is how relevant these results are for real particle orientations in three dimensions. Previous work by Hinch & Leal (Reference Hinch and Leal1973) has investigated theoretically how the orientation dynamics of a suspension of rod-like particles changes due to shear. While the analysis of the full three-dimensional problem proved intractable, they were able to make scaling arguments based on generic properties of the orthogonal eigenfunctions of the convection–diffusion operator. From these arguments, they surmised that there were two time scales in the orientation dynamics: a
 ${\sim}1/D_{0}^{r}p^{2}$
time for the orbit constant relaxation and a
 ${\sim}1/D_{0}^{r}p^{4}$
time for the phase-angle relaxation. In § 5, we find the same two time scales for the orientation dynamics in the continuous shear rheology but strictly for the phase-angle relaxation, as the orbit constant is fixed for particles in the flow–gradient plane. There is one time scale,
 ${\sim}1/D_{0}^{r}p^{2}$
, for the phase angle to relax over the full range of the
 ${\it\kappa}$
-coordinate. However, a secondary time scale
 ${\sim}1/D_{0}^{r}p^{4}$
is produced since the
 ${\it\kappa}$
-coordinate stretches the
 ${\it\phi}$
-coordinate by an amount
 ${\sim}p$
near the flow direction. Thus, our solution shows there are two time scales in the phase-angle dynamics, instead of the one suggested by Hinch & Leal (Reference Hinch and Leal1973). This nuance in the two-dimensional dynamics suggests that a full solution for freely rotating particles would provide additional insight into the orientation dynamics.
When the orientations are not confined to the flow–gradient plane, diffusion randomizes both the Jeffery orbit’s phase angle and its orbit constant. If the orbit constant is fixed, diffusion randomizes the phase angle via the same mechanism described in this paper for particles confined to the flow–gradient plane. Indeed, simply substituting the Jeffery orbit velocity
 $u$
for a fixed orbit constant into (2.13) provides an effective phase-angle diffusion for any Jeffery orbit. It might be hoped that a full three-dimensional solution could be created by combining this enhanced phase-angle diffusion with a diffusive mixing among orbit constants. However, (1.2) shows that, for large
 $p$
, the distance between two Jeffery orbits decreases near the flow direction by a factor
 ${\sim}1/p$
compared with their distance near the gradient direction. This bunching of orbit constants results in an enhanced orbit constant diffusion that increases with
 $p$
, creating an additional set of time scales for diffusion across orbits. Moreover, the diffusion across orbit constants could be coupled to the diffusion along an orbit, preventing a simple piecewise analysis.
To test the relevance of our predictions to three-dimensional orientations, we have explored the suspension rheology through a Langevin simulation of three-dimensional particle orientations under continuous shear. As discussed above, there should be two sets of time scales in the suspension rheology: one set for the phase-angle relaxation, discussed in § 5, and a second set of time scales for the orbit constant relaxation. To discern the origins of the simulated rheology time scales, we ran two sets of Langevin simulations with initial particle orientations
 $({\it\theta},{\it\phi})$
drawn from two separate distributions.
The first set of simulations consists of particles drawn from an initial distribution with an equilibrated orbit constant, but with a single phase angle in the flow–vorticity plane (i.e. from the steady-state distribution in Leal & Hinch Reference Leal and Hinch1971 with
 ${\it\phi}$
restricted to
 ${\rm\pi}/2$
). Since the orbit constants start completely relaxed, any change in the suspension rheology arises solely from the phase-angle dynamics. The suspension rheology for this initial distribution is shown for two aspect ratios
 $p=2.83$
and
 $p=5.00$
at
 $\mathit{Pe}=10^{4}$
in figure 11(a). The qualitative features of the suspension shear stress are the same as for the two-dimensional continuous shear rheology in figure 6(a). There is a distinct double-peak structure in the suspension stress for both aspect ratios at short times. At slightly longer times, the double-peaks fade into single peaks with a period of one-half a Jeffery orbit. These single peaks appear to decay more slowly. Note that, since the initial distribution starts from a single phase angle, the double-peaks in the suspension stress start more pronounced than for the initially isotropic distribution in figure 6(a).
Rheology of a suspension of rod-like particles with orientations allowed to rotate freely in three dimensions, for particle aspect ratios
 $p=2.83$
and
 $p=5.00$
and
 $\mathit{Pe}=10^{4}$
, drawn from two separate initial distributions: (a) equilibrated orbit constant but a single phase angle, and (b) equilibrated phase angle but single orbit constant. Note the difference in scale for both axes. (c) The decay times of the single- and double-peak structures in the suspension stress, from simulations over a range of aspect ratios. Since the double-peak structure decays extremely rapidly, our simulation cannot resolve the double-peak decay time for the last two aspect ratios
 $p\approx 7$
and
 $p\approx 8$
. (d) The decay time of the suspension stress at intermediate times due to the orbit constant relaxation, as a fit over the shaded time window in (b).

The second set of simulations consists of particles drawn from an initial distribution with an equilibrated phase angle, but with a single orbit constant in the flow–gradient plane (i.e.
 ${\it\theta}={\rm\pi}/2$
but
 ${\it\phi}$
drawn from the continuous shear distribution in (2.14)). Since the phase angle starts completely relaxed, any change in the suspension rheology arises solely from the diffusive relaxation of the orbit constant. The suspension rheology for this initial distribution is shown for two aspect ratios
 $p=2.83$
and
 $p=5.00$
at
 $\mathit{Pe}=10^{4}$
in figure 11(b). Since the phase angle starts completely relaxed, the suspension rheology does not change on the time scale of the Jeffery orbit. Instead, the suspension stress only changes on the much longer diffusive time for the orbit constant relaxation, decaying monotonically to its steady-state value.
These time scales for the rheology are shown over a range of aspect ratios in figure 11(c,d). The time scales are extracted from Langevin simulations of 4000 particles at
 $\mathit{Pe}=10^{4}$
, as described in appendix B. The two phase-angle time scales are defined similarly to those in § 5. The orbit constant time scales shown are defined by fitting the stress at intermediate times to an exponential decay. If the picture for phase-angle dynamics laid out in this paper is relevant for three dimensions, then for large
 $p$
the double-peak should decay quickly on a time scale of
 ${\sim}1/D_{0}^{r}p^{4}$
while the single peak should decay more slowly on a time scale of
 ${\sim}1/D_{0}^{r}p^{2}$
. To check for this dependence we plot these two time scales for the phase-angle relaxation as a function of aspect ratio on a log–log scale in figure 11(c). There are clearly two separate aspect ratio dependences for the two phase-angle time scales, which seem to be consistent over the limited range with the
 ${\sim}1/D_{0}^{r}p^{4}$
and
 ${\sim}1/D_{0}^{r}p^{2}$
scaling for particles confined to the flow–gradient plane. Thus the two-dimensional analysis presented in this paper captures much of the three-dimensional orientation dynamics. The decay of the stress due to the orbit constants also shows a time scale that scales with
 $p$
. By fitting the simulated suspension stress to an exponential decay, we find that the orbit constant relaxation time scale is consistent with the
 $1/D_{0}^{r}p^{2}$
scale argued by Hinch & Leal (Reference Hinch and Leal1973). These orbit constant time scales are similar in magnitude to the phase-angle time scales, suggesting that the distribution’s for freely-rotating particles is strongly affected by diffusion both along and across orbits.
Under oscillatory shear, we also expect qualitative features of the two-dimensional solutions to be present in three dimensions. As shown by Leahy et al. (Reference Leahy, Cheng, Ong, Liddell-Watson and Cohen2013), in three dimensions the orientation distributions change with strain amplitude under oscillatory shear in a manner similar to the two-dimensional oscillatory shear distributions in § 4. The oscillatory shear diffusion
 $D_{eff}^{r}$
as measured from correlations in three dimensions also showed oscillations at the resonant Jeffery orbit amplitudes. Thus, the qualitative features of orientation dynamics for particles confined to the flow–gradient plane are present for the full three-dimensional dynamics under oscillatory shear.
6.3. Proposed experiments and possible applications
The results presented above suggest several experiments that are possible with current particle synthesis techniques. The detailed predictions in this manuscript could be tested by confining particles to rotate in a single Jeffery orbits, preferably in the flow–gradient plane. This confinement could be accomplished either via a magnetic field (Almog & Frankel Reference Almog and Frankel1995) or by shearing particles adsorbed to a liquid–liquid interface (Stancik et al.
Reference Stancik, Gavranovic, Widenbrant, Laschitsch, Vermant and Fuller2003). Moreover, as discussed in § 6.2 many of the scalings and qualitative predictions of this paper should be relevant for particles rotating in three dimensions. Precise single-particle measurements via confocal or holographic microscopy of
 $D_{eff}^{r}$
over a range of aspect ratios and strain amplitudes could further verify the orientation dynamics described above. Alternatively, the average degree of alignment of an anisotropic particle suspension under oscillatory shear could be measured with flow dichroism or a similar technique. Our rheological predictions could be most easily checked for
 $[{\it\eta}_{eff}]$
as a function of
 ${\it\gamma}$
, as this measurement allows averaging the stress signal over many cycles to reduce noise. Moreover, the strain amplitude at which
 $[{\it\eta}_{eff}]$
is maximal is roughly independent of
 $p$
and thus will be robust to a suspension with aspect ratio polydispersity.
Our results could also be extended to other regimes and applications. Since the analysis in §§ 2 and 3 does not depend on the details of the Jeffery orbit, it could be easily extended to velocity fields other than a Jeffery orbit, such as for weakly inertial particles (Subramanian & Koch Reference Subramanian and Koch2005) or for particles in weakly non-Newtonian suspending fluids (Leal Reference Leal1975, Reference Leal1980; Stover & Cohen Reference Stover and Cohen1990; Iso, Cohen & Koch Reference Iso, Cohen and Koch1996a ,Reference Iso, Cohen and Koch b ). On a practical level, oscillatory shear could be used to align rod suspensions for colloidal self-assembly or for three-dimensional printed inks with fibres embedded in them (Shofner et al. Reference Shofner, Lozano, Rodríguez-Macías and Barrera2003; Compton & Lewis Reference Compton and Lewis2014). As shown in figure 5(b), the maximal orientational alignment is not obtained under continuous shear but is at a resonant amplitude that depends on the aspect ratio. By using the arbitrary-waveform oscillatory shear equations (3.7) and (3.8), it might be possible to design a specific waveform for a desired degree of particle alignment. Over ninety years after Jeffery’s solution for particle rotations in a viscous fluid, rod-like particles still have intellectually interesting and practically applicable features worthy of discovery.
Acknowledgements
We would like to thank L. Bartell, T. Beatus, and J. Sethna for useful discussions. We acknowledge support from the National Science Foundation (CBET-1435013) (D.L.K.), from the US Department of Energy, Office of Basic Energy Sciences, Division of Materials Science and Engineering under Award No. ER46517 (I.C.), and from National Defense Science and Engineering Graduate (NDSEG) Fellowship 32 CFR 168a (B.D.L.).
Appendix A. Continuous and oscillatory shear numerical solutions
A.1. Continuous shear simulation
We numerically solved the Fokker–Planck equation for the distribution’s time evolution (2.1) by expanding the distribution
 ${\it\rho}$
in Fourier space and transforming (2.1) into a sparse matrix equation. For our simulations, we truncated the Fourier series to the first 301 terms (i.e.
 $m\in [-150,150]$
for basis functions
 $\text{e}^{\text{i}m{\it\phi}}$
); the resulting coupled ordinary differential equations were solved with a fourth-order Runge–Kutta integration scheme with a time step of
 $\text{d}t=5\times 10^{-4}/\dot{{\it\gamma}}$
. Either increasing or decreasing the number of terms or the time step had little effect on the simulation results. Rather than simulate a specific set of initial conditions, we evolve 301 separate initial conditions corresponding to
 ${\it\rho}_{m}({\it\phi},t=0)=\text{e}^{\text{i}m{\it\phi}}$
. Using the linearity of (2.1), we can then reconstruct an arbitrary distribution from this set of initial distributions. We can also use these simulation results to rapidly numerically solve for triangle-wave oscillatory shear, as described below.
A.2. Construction of oscillatory shear propagators
Rather than numerically integrate (3.1) for triangle-wave oscillatory shear at each strain amplitude, we instead opted to numerically create a set of oscillatory shear propagators and find the oscillatory distribution from these propagators. The propagators can be constructed rapidly from the continuous shear solutions and allow for rapid evaluation of the oscillatory shear distributions after an arbitrary time.
To find these propagators, we first find the change in
 ${\it\rho}$
after one full cycle from the continuous shear simulations. One cycle of triangle-wave oscillatory shear can be viewed as two separate pieces: continuous shear going forward for a time
 ${\it\gamma}/\dot{{\it\gamma}}$
, followed by continuous shear going backward for the same time. Let the probability distribution
 ${\it\rho}_{F}={\it\rho}_{F}({\it\phi},t\mid {\it\phi}_{0})$
be the probability density of finding a particle with orientation
 ${\it\phi}$
after undergoing forward shear for a time
 $t$
, given that the particle started at an orientation
 ${\it\phi}_{0}$
. Similarly, let
 ${\it\rho}_{B}({\it\phi},t\mid {\it\phi}_{0})$
be the probability density of finding a particle at orientation
 ${\it\phi}$
after undergoing backward shear for a time
 $t$
. The orientation of the particle
 ${\it\phi}$
after a full cycle is a two-step process: after the first half of a cycle, the particle rotates to an intermediate orientation
 ${\it\phi}_{1/2}$
with some probability
 ${\it\rho}_{F}({\it\phi}_{1/2},t=T_{cyc}/2\mid {\it\phi}_{0})$
, then rotates during the second half of the cycle from
 ${\it\phi}_{1/2}$
to its final orientation
 ${\it\phi}_{1}$
with some other probability
 ${\it\rho}_{B}({\it\phi}_{1},t\mid {\it\phi}_{1/2})$
. We integrate over
 ${\it\phi}_{1/2}$
to find the conditional probability distribution
 ${\it\rho}({\it\phi}_{1},t=T_{cyc}\mid {\it\phi}_{0})$
of the particle’s final orientation after a full cycle:
 $$\begin{eqnarray}{\it\rho}({\it\phi}_{1},T_{cyc}\mid {\it\phi}_{0})=\int \!{\it\rho}_{F}({\it\phi}_{1/2},T_{cyc}/2\mid {\it\phi}_{0}){\it\rho}_{B}({\it\phi}_{1},T_{cyc}/2\mid {\it\phi}_{1/2})\,\text{d}{\it\phi}_{1/2}.\end{eqnarray}$$
Now, we Fourier expand
 ${\it\rho}_{F}({\it\phi}_{1/2},T_{cyc}/2\mid {\it\phi}_{0})$
in both
 ${\it\phi}_{1/2}$
and
 ${\it\phi}_{0}$
, and similarly for
 ${\it\rho}_{B}$
:
 $$\begin{eqnarray}\displaystyle & \displaystyle {\it\rho}_{F}({\it\phi}_{1/2},T_{cyc}/2\mid {\it\phi}_{0})=\mathop{\sum }_{kl}A_{kl}^{F}\text{e}^{\text{i}k{\it\phi}_{1/2}}\text{e}^{\text{i}l{\it\phi}_{0}}, & \displaystyle\end{eqnarray}$$
 $$\begin{eqnarray}\displaystyle & \displaystyle {\it\rho}_{B}({\it\phi}_{1},T_{cyc}/2\mid {\it\phi}_{1/2})=\mathop{\sum }_{mn}A_{mn}^{B}\text{e}^{\text{i}m{\it\phi}_{1}}\text{e}^{\text{i}n{\it\phi}_{1/2}}. & \displaystyle\end{eqnarray}$$
 ${\it\rho}({\it\phi}_{1},T_{cyc}\mid {\it\phi}_{0})$
as
 $$\begin{eqnarray}\displaystyle \left.\begin{array}{@{}l@{}}\displaystyle {\it\rho}({\it\phi}_{1},T_{cyc}\mid {\it\phi}_{0})=\mathop{\sum }_{ml}B_{ml}^{1}\text{e}^{\text{i}m{\it\phi}_{1}}\text{e}^{\text{i}l{\it\phi}_{0}},\\ \displaystyle \text{where }B_{ml}^{1}\equiv 2{\rm\pi}\mathop{\sum }_{n}A_{-n,l}^{F}\,A_{mn}^{B}.\end{array}\right\} & & \displaystyle\end{eqnarray}$$
Thus, we can calculate the distribution after one cycle of triangle-wave oscillatory shear from the continuous shear distributions by using matrix multiplication. In contrast, most other waveforms require a full numerical solution for
 ${\it\rho}$
at each strain amplitude.
To find the distribution after
 $N+1$
cycles, we follow a similar argument. We can view the probability of finding the particle at an orientation
 ${\it\phi}_{N+1}$
after
 $N+1$
cycles as a two-step process: the particle started at
 ${\it\phi}_{0}$
and rotated to
 ${\it\phi}_{N}$
after
 $N$
cycles with some probability
 ${\it\rho}({\it\phi}_{N},NT_{cyc}\mid {\it\phi}_{0})$
, followed by a rotation from
 ${\it\phi}_{N}$
to
 ${\it\phi}_{N+1}$
with probability
 ${\it\rho}({\it\phi}_{N+1},T_{cyc}\mid {\it\phi}_{N})$
after the final cycle. Following the same argument as above, the distribution
 ${\it\rho}({\it\phi}_{N+1},(N+1)T_{cyc}\mid {\it\phi}_{0})$
can be written as
 $$\begin{eqnarray}\displaystyle \left.\begin{array}{@{}c@{}}\displaystyle {\it\rho}({\it\phi}_{N+1},(N+1)T_{cyc}\mid {\it\phi}_{0})=\mathop{\sum }_{lm}B_{ml}^{N+1}\text{e}^{\text{i}m{\it\phi}_{N+1}}\text{e}^{\text{i}l{\it\phi}_{0}},\\ \displaystyle \text{where }B_{ml}^{N+1}\equiv 2{\rm\pi}\mathop{\sum }_{n}B_{-n,l}^{N}B_{mn}^{1}.\end{array}\right\} & & \displaystyle\end{eqnarray}$$
Thus the distribution after an arbitrary number of triangle-wave oscillation cycles can be reconstructed from the simulated forward and backward probability distributions, once the coefficients
 $A_{kl}^{F},A_{mn}^{B}$
are known.
The coefficient matrices
 $A_{kl}^{F},A_{mn}^{B}$
can in turn be calculated from the continuous shear solutions. Let
 $$\begin{eqnarray}{\it\rho}_{k}({\it\phi},t)=\mathop{\sum }_{l}a_{kl}(t)\text{e}^{\text{i}l{\it\phi}}\end{eqnarray}$$
be the continuous shear solution of (2.1) subject to the initial condition
 ${\it\rho}_{k}({\it\phi},0)=\text{e}^{\text{i}k{\it\phi}}$
, i.e.
 $a_{kl}(0)={\it\delta}_{kl}$
. Due to linearity, any distribution
 ${\it\rho}({\it\phi},t)$
can be written as a sum over the
 ${\it\rho}_{k}$
. In particular, we can write
 ${\it\rho}_{F}({\it\phi},t\mid {\it\phi}_{0})$
in this way:
 $$\begin{eqnarray}{\it\rho}_{F}({\it\phi},t\mid {\it\phi}_{0})=\mathop{\sum }_{k}q_{k}({\it\phi}_{0}){\it\rho}_{k}({\it\phi},T_{cyc}/2),\end{eqnarray}$$
where
 $q_{k}({\it\phi}_{0})$
are the coefficients of the Fourier expansion whose values depend on
 ${\it\phi}_{0}$
. Substituting the definition of
 ${\it\rho}_{k}\equiv \sum _{k}a_{kl}\text{e}^{\text{i}l{\it\phi}}$
, we can write this as
 $$\begin{eqnarray}\displaystyle {\it\rho}_{F}({\it\phi},t\mid {\it\phi}_{0}) & = & \displaystyle \mathop{\sum }_{k}q_{k}({\it\phi}_{0})\mathop{\sum }_{l}a_{kl}(t)\text{e}^{\text{i}l{\it\phi}}\nonumber\\ \displaystyle & = & \displaystyle \mathop{\sum }_{kl}q_{k}({\it\phi}_{0})a_{kl}(t)\text{e}^{\text{i}l{\it\phi}}.\end{eqnarray}$$
The distribution
 ${\it\rho}({\it\phi},t\mid {\it\phi}_{0})$
is defined such that
 ${\it\rho}({\it\phi},0\mid {\it\phi}_{0})={\it\delta}({\it\phi}-{\it\phi}_{0})\equiv (1/2{\rm\pi})\sum _{k}\!\exp (\text{i}k({\it\phi}-{\it\phi}_{0}))$
. Substituting this into (A 8) at
 $t=0$
and using the definition of
 $A_{kl}^{F}$
from (A 2), the forward shear propagator
 $A_{kl}^{F}$
and the continuous shear coefficients
 $a_{kl}$
can be related as
 $$\begin{eqnarray}A_{kl}^{F}=\frac{1}{2{\rm\pi}}a_{-l,k}(T_{cyc}/2).\end{eqnarray}$$
To obtain the coefficients for backward shear
 $A_{kl}^{B}$
, we note that shearing backwards is the same as taking
 ${\it\phi}\rightarrow -{\it\phi},{\it\phi}_{0}\rightarrow -{\it\phi}_{0}$
, as visible from (2.1). This is in turn the same as switching the signs of the indices, so the backward shear propagator
 $A_{kl}^{B}$
is
 $$\begin{eqnarray}A_{kl}^{B}=\frac{1}{2{\rm\pi}}a_{l,-k}.\end{eqnarray}$$
Thus, from our simulation for continuous shear in one direction only, we can quickly recreate the time-dependent distribution
 ${\it\rho}$
under triangle-wave oscillatory shear for strains of arbitrary amplitude. This same procedure can be used to solve the convection–diffusion equation after a time
 $t$
in
 $O(\ln t)$
steps instead of the normal
 $O(t)$
steps needed for direct numerical integration; we use this procedure to rapidly find the long-time distributions under oscillatory shear. We used this fast method to find both
 ${\it\rho}$
and
 $D_{eff}^{r}$
numerically at
 ${\approx}3000$
separate amplitudes, equally spaced from
 ${\it\gamma}=0.02$
to 60.00.
A.3. Extracting diffusion constants from simulation
For continuous shear, the diffusion coefficients shown in figure 2 were calculated by fitting exponentials to correlations
 $\langle \cos m({\it\kappa}-{\it\kappa}_{0})\rangle$
from 20 separate initial orientations
 ${\it\kappa}_{0}$
which were sampled from the steady-state distributions. As mentioned in the text, the fitted correlations in
 ${\it\kappa}$
-space are independent of the starting orientation, while the correlations in the unstretched
 ${\it\phi}$
-space do depend on the starting orientation.
For oscillatory shear, the situation is slightly more complicated since the orientations are diffusive in a new, stretched
 $z$
-space. Rather than fitting correlations in the new
 $z$
-coordinate, which must be computed for each strain amplitude, we examine the long-time decay of an arbitrary correlation. Since the ancillary distribution
 $g(z)$
evolves according to a diffusion equation in
 $z$
-space with an effective diffusion
 $D_{eff}^{r}$
, any correlation
 $C({\rm\Delta}t)$
will decay as a sum of exponentials:
 $$\begin{eqnarray}C({\rm\Delta}t)=\mathop{\sum }_{m}C_{m}\text{exp}(-m^{2}D_{eff}^{r}{\rm\Delta}t).\end{eqnarray}$$
At long times
 $D_{eff}^{r}{\rm\Delta}t\gg 1$
, only the term with the smallest
 $m\,(m=1)$
remains; the others have decayed. To find the effective diffusion under oscillatory shear, we examine the decay of a correlation
 $C$
after a long time such that
 $C(t)\sim 10^{-3}$
. For diffusive correlations, the further decay is entirely due to the
 $m=1$
term; the terms
 $m=2$
and higher are exponentially smaller, approximately
 $C^{4}\sim 10^{-12}$
as can be seen from (A 11), and do not contribute to the decay. From these long time decays of the correlation
 $C$
, we extract the oscillatory shear diffusion constant
 $D_{eff}^{r}$
. To check the robustness of this technique, we evaluate two separate correlations,
 $\langle \cos {\rm\Delta}{\it\phi}\rangle$
and
 $\langle \cos {\rm\Delta}{\it\kappa}\rangle$
, for 20 separate initial orientations sampled from the long-time distribution. Empirically, the value of
 $D_{eff}^{r}$
obtained from the long-time correlations is independent of either the particle’s starting orientation or the type of correlation fitted. In contrast, at short and intermediate times the extracted
 $D_{eff}^{r}$
varies with both the initial particle orientation and the type of correlation fitted. This difference at short times arises because the orientation is in general not diffusive in either the original
 ${\it\phi}$
-space or the continuous shear stretched
 ${\it\kappa}$
-space, but is diffusive in the (uncalculated)
 $z$
-space for oscillatory shear.
Appendix B. Rheology calculations and rheological time scale definitions
Calculating the rheology. To calculate the suspension rheology for the two-dimensional particle orientations under continuous shear, we used the theory of two-dimensional rod dynamics presented in § 2 to find the time-dependent ancillary distribution
 $f({\it\kappa},t)$
at
 $\mathit{Pe}=10^{4}$
. Once the ancillary distribution is known, the suspension stress can be calculated from (5.1). To find the rheology for orientations in three dimensions, we numerically integrated a Langevin equation for 4000 separate initial particle orientations at
 $\mathit{Pe}=10^{4}$
, by integrating (1.1) with an additional noise term using an Euler method. The time step size
 $\text{d}t=5\times 10^{-4}/\dot{{\it\gamma}}$
gives an integration error after each time step that is 10−3 that of the random motion. The orientation moment tensors
 $\langle \boldsymbol{n}\boldsymbol{n}\rangle$
and
 $\langle \boldsymbol{n}\boldsymbol{n}\boldsymbol{n}\boldsymbol{n}\rangle$
are evaluated from direct averages of the particle orientations.
To calculate the triangle-wave oscillatory shear rheology for two-dimensional particle orientations, we first obtained the oscillatory shear distributions at long times. The ancillary distribution
 $f({\it\kappa})$
can be found from (3.10). While the coordinate derivative
 $\partial z/\partial {\it\kappa}$
and thus the functional form of
 $f$
can be exactly evaluated analytically, the distribution’s normalization must be evaluated numerically. Alternatively, the distribution
 ${\it\rho}$
can be found from the simulations at
 $\mathit{Pe}=10^{4}$
; we find that both procedures produce the same rheology to within
 ${\approx}1/\mathit{Pe}$
. To find the stress during one half-cycle, we evolved the distributions in the limit of no diffusion for the duration of the half-cycle; since our theory describes the limit of large strain rates the ancillary distribution does not diffusively evolve during a cycle. The maximal
 $[{\it\eta}_{eff}]$
amplitudes are found only from (3.10) which is orders of magnitude faster than simulating the orientation distributions; we use a Nelder–Mead simplex algorithm to find the maximal
 $[{\it\eta}_{eff}]$
amplitudes for the 1000 aspect ratios logarithmically spaced from
 $p=1.5$
to 100.0 shown in figure 9(c).
Definitions of rheological time scales. The double-peak decay time scale in figure 6(c) is defined as the time when the suspension stress at half-integer Jeffery orbits switches from a local minimum to a local maximum. To find this time scale, we examined the second derivative of the suspension stress via our analytical solution after a fixed time corresponding to 200 half-integer Jeffery orbits and varied the rotary diffusion
 $D_{0}^{r}$
. Examining the stress after these long times prevents the decaying envelope of the suspension stress from biasing the second derivative. Traces of the single peaks are always present, in contrast to the double-peaks which completely disappear after a well-defined time. To minimize short-time transients in the single peak decay time, we looked for the time when the magnitude of the single peaks decayed to 1 % of their initial value, by examining the stress at a fixed time corresponding to the first trough after 200 half-integer Jeffery orbits (i.e.
 $\dot{{\it\gamma}}t=200.5{\rm\pi}(p+1/p)$
) and varying
 $D_{0}^{r}$
. Since the double-peak structure obscures the height of the suspension stress’s initial peak at
 $t=0$
, we examine the decay of the minimum of the troughs in the stress, occurring every
 $(n+1/2)/2$
Jeffery orbits. We then rescaled this time to give the corresponding
 $1/\text{e}$
decay time of the single peaks.
We extracted the double-peak and single-peak decay times for the three-dimensional suspension rheology in a similar manner. However, since there is no closed-form solution for three-dimensional rod orientations, we looked at a single set of simulations at
 $\mathit{Pe}=10^{4}$
for each aspect ratio and initial distribution. The double-peak decay time shown in figure 11(c) is the time at which the (smoothed) second derivative of the stress at each half-integer Jeffery orbit is zero, interpolated between half-integer Jeffery orbits to improve temporal resolution. For all but the lowest aspect ratios, this zero occurs after only a few half Jeffery orbits. The single-peak decay times are measured from the same set of simulations. To minimize the effects of noise inherent in a Langevin simulation, we calculated the
 $1/\text{e}$
decay time for the three-dimensional orientations from when the troughs in the stress decayed to 10 % of their initial value, instead of 1 %.
The orbit constant decay times shown in figure 11(d) are also taken from a single set of simulations for each aspect ratio at
 $\mathit{Pe}=10^{4}$
. We defined the time scale for the orbit constant decay by fitting the shear stress at times
 $0.06<D_{0}^{r}t<0.1$
to an exponential decay, after subtracting off the steady-state shear stress. To minimize the effects of noise inherent in the Langevin simulation, we smoothed the simulated shear stress by convolving with a boxcar filter with a width of half a Jeffery orbit; the data shown in figure 11(b) are not smoothed. While there are some transients in the suspension stress at shorter times, empirically we find that the suspension stress is well-described by an exponential decay for all the aspect ratios measured, within the limited resolution of our simulations.