Implications
An improved computer vision technology for continuous surveillance of pigs’ behaviour in the pen is described in this paper. The technology has the potential of improving animal welfare by automatic detection of signs of abnormal behaviour. For example, monitoring the location of pigs in the pen is suggested to be a novel way of controlling ventilation, or other aspects affecting the climate where heat stress of the animals can be avoided and animal hygiene can be improved. Further applications may involve general health monitoring by changes in behaviour and location of animals within the group.
Introduction
Climate control in pig houses is essential for the welfare of pigs. As pigs lack sweat glands, their thermal regulation in warm temperatures relies on their behaviour of wallowing in mud in order to enhance cooling evaporation and also conduction is increased from the body surface (Ekesbo, Reference Ekesbo2011). The microclimate in the animal occupied zone is important for animal welfare and production, and the temperature is the most important factor. Local temperatures in the pig house and pen will fluctuate depending on ventilation, the heat produced by the animals and external temperatures (Hoff et al., Reference Hoff, Janni and Jacobson1992; Van Wagenberg et al., Reference Van Wagenberg, Aerts, Van Brecht, Vranken, Leroy and Berckmans2005).
Normally, pigs have separate areas for dunging and feeding/resting. In Sweden, pens for pigs have a solid resting area, in contrast to most European countries where fully slatted floor pens are allowed (Mul et al., Reference Mul, Vermeij, Hindle and Spoolder2010). Defecation and urination will normally not occur in the resting area (Wechsler, Reference Wechsler1996; Horsted et al., Reference Horsted, Kongsted, Jørgensen and Sørensen2012) as animals prefer a warm lying area and a cooler area for dunging during normal and cold temperatures (Hacker et al., Reference Hacker, Ogilvie, Morrison and Kains1994). However, at warmer temperatures, pigs spend more time in cooler places in the pen, which is usually the dunging area (Botermans and Andersson, Reference Botermans and Andersson1995). They will then in contrast use the lying area for excretion of dung and urine (Ekesbo, Reference Ekesbo2011), which results is increased fouling of the pen (Aarnink et al., Reference Aarnink, Schrama, Heetkamp, Stefanowska and Huynh2006) and an impaired animal hygiene. The response of the pigs to the thermal environment and microclimate changes on location in the pen, especially during warm weather, could be used to monitor and control thermal features, for example, heated flooring, and climate in the pig pen according to the principles of precision livestock farming (Berckmans, Reference Berckmans2004). This work investigates possibilities to extract the ratio of pigs in different areas of a pen by the use of video image analysis and discussing the potential of application of such new technology.
Material and methods
Equipment and video data
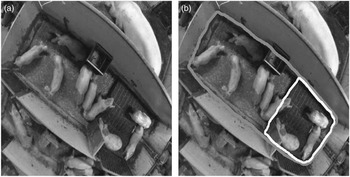
Growing pigs in a pen of the Experimental farm at Odarslöv in the southern part of Sweden was the recording site. Nine young pigs in one pen were filmed in a top–down view by mounting an Axis M3006 camera (Axis Communications AB, Lund, Sweden) producing a 640×480 colour mjpeg video (Figure 1a). Three 10-min sessions were recorded. Two recordings were made in normal artificial fluorescent lamp lighting but the third recording was discarded due to poor light conditions, being the day light from windows. A manually marked region of interest (ROI) capturing the pen and the dunging area was used (Figure 1b).
(a) Top–down view of pigs in a pen as observed by an overhead camera. (b) Manually marked region of interest for whole pen (lighter grey) and for the dunging area (white).

Approach and method
In order to estimate the ratio of pigs in the dunging area (white boundary; Figure 1b) and the whole pen area (grey boundary; Figure 1b), as a key indicator, a segmenting approach would be a natural step. Initial attempts were made to explore Otsu’s method for segmentation, since this has previously been successful in some pig pen scenarios (Otsu, Reference Otsu1979; Kashiha et al., Reference Kashiha, Bahr, Ott, Moons, Niewold, Tuyttens and Berckmans2014; Ott et al., Reference Ott, Moons, Kashiha, Bahr, Tuyttens, Berckmans and Niewold2014).
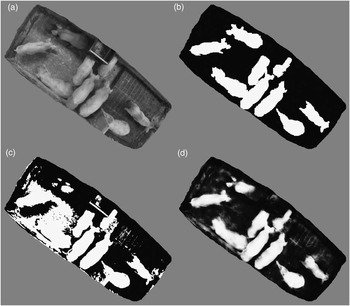
However, we found it to fall short of the intended scenario (Figure 2c) as some part of the background was wrongly segmented. Reasons for this might be that previous scenarios involved a fairly dark background and bright target pixels (i.e. pig), and that the setup addressed here had brighter non-pig pixels (e.g. straw). This decreased the contrast between pig and background and more shadows appeared. In addition, getting probability at each pixel, rather than a hard decision could be beneficial and this leads to seeking for a learning based approach for segmentation. Key parts, and the main result, of the learning based approach will be highlighted in the next section; the interested reader can find further technical details of this segmentation approach in the work by Nilsson et al. (Reference Nilsson, Ardö, Åström, Herlin, Bergsten and Guzhva2014).
(a) The region of interest (ROI) extracted from a video image. (b) Manual segmentation showing in white the pixels displaying pigs and in black the pixels displaying floor. (c) Otsu segmentation, which is a previous work trying to automatically produce the manual segmentation in (b). (d) The results from the proposed learning based segmentation. It gives a probabilistic result where pixels close to white/black indicate that the system is fairly certain it displays pigs/floor and grey pixels indicate that the system is uncertain.

Learning based segmentation and indicator
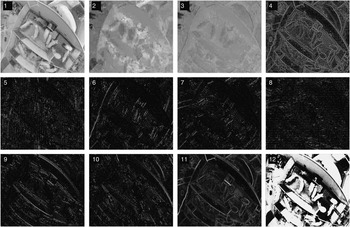
The learning based approach utilizes 10 channels of features (Dollár et al., Reference Dollár, Belongie and Perona2010 and Reference Dollár, Appel, Belongie and Perona2014) plus two additional channels (Nilsson et al., Reference Nilsson, Ardö, Åström, Herlin, Bergsten and Guzhva2014; Figure 3). The first 10 are values for describing CEI-LUV colour space (CIE-LUV colour space is a standardized way of describing colours using three coordinates (L,u,v); three channels), normalized gradient magnitude (one channel) and oriented gradients (six channels). The additional two channels are a soft Otsu channel and a maximum–minimum filter. The soft Otsu channel will enable the learning framework to use the Otsu result when suitable. The maximum–minimum filter is a complement to the gradient magnitude, and helps with getting information about small (spatial) textures with edges (i.e. straws and other similar backgrounds).
Graphical representation of the channel features used by the proposed learning based system for identifying pixels showing pigs as opposed to showing floor. From left to right and top to bottom are CIE-LUV colour space (channels 1 to 3), gradient magnitude (channel 4), six oriented gradients (channels 5 to 10), maximum–minimum filter result (channel 11) and soft Otsu (channel 12).

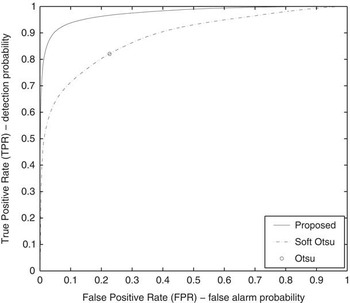
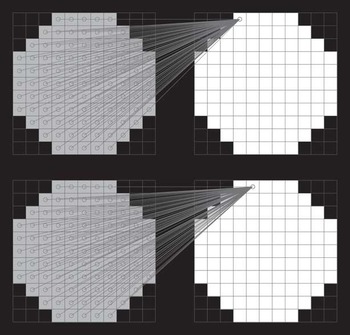
A learning based framework is applied to these features. A circular area is set with A pixels and all features in this area are used to produce segmentation information. The learning framework utilizes elastic net regularized logistic regression as its main learning component (Nilsson, Reference Nilsson2014). The method is employing a structured prediction approach and maps every area to a new output area of probabilities. This is repeated for every pixel (Figure 4). This approach was found to give better results than the commonly applied Otsu method. Receiver operation characteristics curves for the task of pig segmentation were produced by comparing the results of the different methods with manually segmented ground truth (Nilsson et al., Reference Nilsson, Ardö, Åström, Herlin, Bergsten and Guzhva2014; Figure 4).
Receive operation characteristic (ROC) curve for the learning based method used in this paper to detect pig pixels together with soft Otsu and the operation point for Otsu.

The final result from the learning based approach are probabilities (Figure 2d) for each pixel in the ROI (the marked area, Figure 1b). Note that the dunging area is a subset of the total pen area. Let p i,j (t) be the output probability image, where t is a frame/time index and i,j is a pixel position (Figure 5). Two sums, S dunging(t), and S pen(t), can be formed over the dunging ROI R dunging, and pen ROI R pen.
 $$\eqalignno{ S_{{{\rm dunging}}} (t)= & \mathop \sum\limits_{i,\,j\in R_{{{\rm dunging}}} } p_{{i,\,j}} (t) \cr S_{{{\rm pen}}} (t)= & \mathop \sum\limits_{i,\,j\in R_{{{\rm pen}}} } p_{{i,\,j}} (t) $$
The ratio indicator of interest, here denoted r(t), can now be found as
 $$r(t)={{S_{{{\rm dunging}}} (t)} \over {S_{{{\rm pen}}} (t)}}$$
In situations where the number of pigs in the pen is known and constant, an estimate of the number of pigs in the dunging area, S dunging(t), can be found by multiplying the ratio above, r, with the total number of pigs, n total
 $$n_{{{\rm dunging}}} (t)=n_{{{\rm total}}} r(t)$$
Due to the various noise factors in the estimate of the number of pigs in the dunging area and additional calibration step is further proposed. The estimate n dunging(t) is found for some selected frames, with obvious cases, and a manually selected number of pigs in the dunging area is used as ground truth. Given these number of estimates, that is n dunging(t) for some t, the corresponding ground truth are used in the calibration. A simple linear model using a gain, g, and bias, b, is applied to find a new calibrated number of pigs in the dunging area estimate as ñ dunging(t)=gn dunging(t)+b. The gain and bias are found by least squares minimization.
Left is input and right is output. In left, the light grey position indicates a vector containing all values of the channels for each pixel. White, indicate a single output value for each pixel which will be a probability. Note how one input patch give rise to outputs equal to the size of the area A. This is a general structure for learning segmentation algorithms that in this paper is applied to segment pigs.

Results and discussion
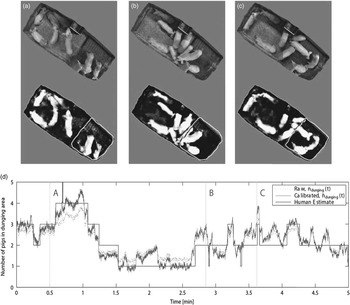
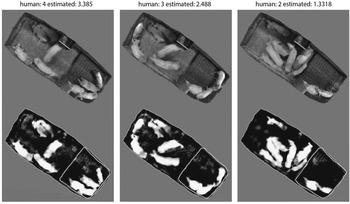
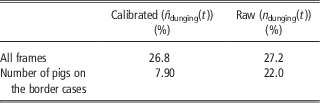
Utilizing only video, and two manually placed ROIs, a ratio can be found using learning based segmentation. In this way, an automatic estimation of the pigs’ locations in different areas of the pen can be continuously estimated as is presented in Figure 6a–c. The figure shows a plot of the continuous estimate of the number of pigs in the dunging area during 5 min (Figure 6d), together with three frames within the sequence (Figure 6a–c). Note that Figure 6d also contains a plot of the number of pigs in the dunging area as estimated by a human observer from the video. A pig was defined to be in the dunging area if more than half of the body was there. In some situations a pig was standing for quite some time on the border between the areas (Figure 6b and c). In such a situation the proposed automated system gives a continuous estimate, while a human observer gives an integer estimation. The human selected number is therefore somewhat ambiguous in these ‘pig on the border’ cases. However, this means that the discrepancy between the human estimate and the automated response is expected to be less than a half (rounding the number gives the same estimate) when the system is performing perfectly in accordance to the human estimate. The evaluation considers the raw estimate and the calibrated case, as well as an evaluation using all frames and another avoiding ‘pig on the border cases’ (Table 1). Note that the calibration shows this effect more clearly when the border cases are omitted. Some of the failure cases for the calibrated and no border case are shown in Figure 7. Note that a typical failure case for the 7.90% error is due to two factors; occlusions by the small wall and when pigs occlude each other to some degree.
Overview of result from running the proposed automated analytics on a 5-min video clip with the objective of estimating the number of pigs in the dunging area. (d) The raw and calibrated results together with manually produced human estimate. (a–c) Presents three of the frames from the video clip and their segmentations.

Three examples of typical failure cases of the proposed algorithm for estimating the number of pigs in the dunging area. The calibrated estimate, ñ dunging(t), is used and no clear pig on the border case. Note that in typical failure cases, the pigs get occluded by the small wall as well as they occlude each other, leading to missing one pig in the dunging area.

Errors in % using both raw and calibrated metrics of the proposed automated algorithm for estimating the number of pigs in the dunging area

Two cases considered whole sequence and sequence with border cases omitted since they are ambiguous for human inspection.
The learning based method could reliably find the ratio of pigs in the ROI. The method also overcame problems in previous greyscale methods where disturbances in the environment as straw and shadows caused problems to produce a reasonable segmentation. An estimate of the number of pigs in the pen was derived using the segmentation as a base. The direct and continuous tracking of the number of pigs in different parts of the pen could be an important feature to monitor and controlling the heating system, based on observed pig behaviour, as it has been earlier suggested by Shao and Xin (Reference Shao and Xin2008) and for the use of an early warning system for poultry (Kashiha et al., Reference Kashiha, Pluk, Bahr, Vranken and Berckmans2013). A further development could be to identify individual pigs with altered behaviour, or to identify their location in the box, which may indicate inferior health or acute illness. In earlier studies (Shao and Xin, Reference Shao and Xin2008; Kashiha et al., Reference Kashiha, Pluk, Bahr, Vranken and Berckmans2013; Oczak et al., Reference Oczak, Ismayilova, Costa, Viazzi, Thays Sonoda, Fels, Bahr, Hartung, Guarino, Berckmans and Vranken2013), segmentation presumed the flooring being uniform due to the lack of bedding material that compromized the earlier segmentation technologies. Therefore, in studies and applications in less constrained types of animal environments, with varying backgrounds, the approach used in this paper should be beneficial. Thus, the proposed method is promising and could be robust, working in many kinds of environments.
Conclusions
This study has shown that it is possible, with a learning based segmentation, to extract the proportion of pigs in specific areas of the pen. This is a promising development since this proportion is a measure to indicate altered pig behaviour, which could be used as a feature for controlling ventilation. Learning based segmentation is not an exact measurement because it is influenced by how many pixels each pig consists of, which varies with the size of the pig as well as with its posture and orientation. This variation can be mitigated by placing the camera as high as possible and as close as possible to the centre of the pen. However, to get an accurate count of the number of pigs a more local analysis is needed. This could be achieved either by identifying which pixels belongs to which pig or by using a detector that find the centre of each pig. This will be the focus of future work. The next step to develop the technology for a robust use would be method evaluation and development for dotted pig breeds, dirty animals and studies on more sites, recordings from several pens in a barn, and recordings for longer periods. Furthermore, the segmentation and ratio extraction framework here described could certainly be applied for other species in animal production.
Acknowledgement
The Swedish Research Council for Environment, Agricultural Sciences and Spatial Planning (FORMAS) is acknowledged for the funding of the project.