INTRODUCTION
An extensive literature links economic growth to increases in technical knowledge. Although such models of ideas-based growth are theoretically appealing, empirical work tends not to support a significant role for R&D in the growth process. First, the link between measures of knowledge and productivity is weak. Second, estimates point to the presence of constant or even increasing returns to the production of ideas, which has the counterfactual implication that rates of economic growth should increase with the population size.1
This paper proposes that a quantitatively important role for ideas in the process of economic growth is easily reconciled with these empirical “puzzles” if ideas are investment-specific. In this case, ideas contribute to economic growth through the factor accumulation process, and do not enter TFP directly. Measured TFP may then display only a weak relationship to indicators of new knowledge, even if technical knowledge were the predominant factor of economic growth.
Several authors identify investment-specific technical change using the relative price of capital, which has declined steeply since 1947.2
If ideas lead to growth through investment-specific technical change, this price is itself an indicator of the of quantity economically relevant knowledge in use. I use price data to construct an implicit series for the knowledge stock, and compare it with a measure derived from a more traditional indicator: patent activity. The two series do indeed co-move.3Also in support of this account, Wilson (2002) finds cross-sectional evidence linking measured industry-level capital price declines to accumulated R&D in upstream capital goods.
Section 2 lays out the empirical findings that the model will gaddress. Section 3 describes the model framework, and Section 4 studies the relationship between patent data and the relative price of capital. Section 5 discusses the empirical “puzzles,” and Section 6 concludes with a discussion of the robustness of the results.
EMPIRICAL CONTEXT
Empirical work to identify the macroeconomic relationship between research and growth has focused on linking measures of research activity either to total factor productivity or to long-run patterns of economic growth. This work typically begins by identifying a measure of technical knowledge. Let qt be the measure of new knowledge in period t. The stock of knowledge Tt then evolves according to the equation

where δT is the rate at which ideas “depreciate.”4
Ideas may be superseded by others; certain avenues of research may be exhausted so that they cease to be important for the production of new ideas and goods; or they may simply be forgotten. That this occurs empirically is seen in that patent maintenance fees are not always paid—see Griliches (1990).
The key to ideas-based growth models is that Tt is an important determinant of macroeconomic variables, and that it changes over time as the result of volitional research activity by agents. Thus, the aggregate behavior of the economy is given by two production functions. First, the production function of aggregate output yt depends upon Tt, in addition to aggregate capital kt and labor nt

where Tt is a factor of TFP, and zt is a productivity residual. Second, the quantity of new knowledge is given by an ideas production function

where xt indicates the input of resources into research, and st is a residual analogous to zt. Empirically, the variable st captures the fact that measures of the input into research display far less low-frequency variation than measures of the output. It grows on average by a factor γs.
Estimates of the parameters of equations (2) and (3) tend to yield results that are challenging for ideas-based growth models. First, using patent applications as an indicator of knowledge Tt, Porter and Stern (2000) and Abdih and Joutz (2006) find that the contribution of ideas to total factor productivity is small. Point estimates of θ lie in the range [0.05, 0.2], and often lack statistical significance.
The second challenge concerns the parameter ϕ. A value of ϕ>0 implies that past ideas are useful for the production of new ones, whereas a value of ϕ<0 suggests that research uncovers the ideas that are easiest to find, so that discovery becomes progressively more difficult. These effects are known respectively as “standing on shoulders” and “fishing-out.” Endogenous growth models of this class are typically constructed so that ϕ=1: for example, this is true of the model in Romer (1990), in which increases in capital variety drive growth, and of Krusell (1998), in which ideas lead to growth through investment-specific technical change as here. However, if ϕ=1, then the growth rate depends on the population size (or, more generally, the size of the economy). Jones (1995) strongly rejects any empirical growth-population link in postwar U.S. data: population rises monotonically, whereas growth rates display no upward trend, implying that ϕ < 1. Greenwood and Jovanovic (2001) argue that this constitutes a key empirical shortcoming of ideas-based growth models.5
The implication was that ideas-based growth models should have weaker policy implications, because taxation or subsidy schemes could not affect growth rates, although in a richer framework Howitt (1999) demonstrates that this need not be the case. Independently of this debate, Jones (1995) argues that the extent of returns remains an important determinant of other model properties, such as transition dynamics.
A third empirical puzzle also regards equation (3). Estimates of the ideas' production function generally detect a downward trend in st. This decline is robust to a diversity of approaches. For example, Caballero and Jaffe (1993) use a selection of citation-weighted patent grants. Porter and Stern (2000) use aggregate patent application data, also identifying the effects of international patenting. Abdih and Joutz (2006) also use patent application data, simultaneously estimating the aggregate production and ideas' production functions. The downward trend is perplexing, as it lacks a theoretical basis. For example, if it is the case that “easy” ideas are discovered first, so that ideas become progressively harder to uncover, this is precisely the “fishing out” hypothesis, which should be reflected in a negative value of ϕ: it should depend on the number of ideas that have already been uncovered, not on the date.
To sum up, the empirical evidence on ideas-based growth models is puzzling, and has difficulty preserving a central role for the production of knowledge in the process of economic growth. The remainder of this paper asks whether these findings can in fact be reconciled with such a role within the context of a simple aggregate model.6
Of course, one interpretation of the results is that patent data do not accurately reflect the aggregate quantity of technical knowledge. I defer a discussion of such measurement questions until Section 5.
THEORETICAL FRAMEWORK
Consider now an aggregate framework with the same structure as (1), (2), and (3). The difference is that technical knowledge Tt does not enter the production function directly. Hence, the production function for output is

where output may be used for consumption ct, investment7
The term “investment” here refers to foregone consumption goods that are used to make new capital goods.

Instead, technical knowledge leads to economic growth through investment-specific technical change. Thus, it appears in the capital accumulation equation:

where δk is the rate of physical depreciation.
Investment-specific technical change is a feature of many macroeconomic models—for example, Greenwood et al. (1997). The hallmark of such models is that the price of capital relative to final output (denoted pt) is the inverse of the extent of technical knowledge dedicated solely to the production of capital:

Krusell (1998) develops a model in which investment-specific technical change is the endogenous result of R&D activity, so that it is the accumulation of new knowledge that is responsible for the observed decline in pt in postwar U.S. data.
In the remainder of the paper, I refer to the class of ideas-based growth models in which new knowledge leads to growth through equation (6) rather than through equation (2) as the embodied knowledge growth frame work, or the EKG framework.8
Although the Krusell (1998) model articulates the key EKG relationships (7) and (6), it does not aggregate to the empirical equations (1) and (3). The Appendix describes a generalization of the Krusell (1998) model, which satisfies this property.
If, as suggested by equation (7), investment-specific technical change is the endogenous result of R&D activity, the dynamics of the relative price of capital pt and the stock of economically useful knowledge Tt should be related.
The long-run properties of the EKG framework are as follows. Let γχ be the growth factor for any variable χ. Equation (7) implies that, on a balanced growth path,

Combining (4) and (6), the relationship between ideas, TFP, population and output growth is given by

as, from (5), investment and R&D input must grow at the same rate as output along a balanced growth path.
Independently, (3) yields an expression for the growth rate of ideas itself, in terms of other factors.

Eliminating γT using (9) and (10), the growth rate of final output in terms of the exogenous variables is

Although (11) may appear complicated, it captures the notion that the production of ideas is an important channel of growth—although ultimately, as in Jones (1995), long-run growth is driven by exogenous factors such as population change.
A necessary condition for balanced growth assuming that γz≥1, γs≥1 and γn≥1 is that

which will be satisfied if either of αk, ψ or ϕ is sufficiently small. In this event, there exists a sufficient degree of concavity that the feedback from ideas production back into output production is limited. Notably, it does not hold as ϕ→1, which is the Romer (1990) model. This result is analogous to that of Jones (1995): if there is population growth then no balanced growth path exists in an ideas-based growth model without decreasing returns. Nonetheless, large values of ϕ may still be consistent with balanced growth, provided that γz<1 and/or γs<1. Greenwood et al. (1997) do in fact argue that, at least since the 1970s, γz<1, whereas Griliches (1990), Porter and Stern (2000), and Abdih and Joutz (2006) find that γs<1. Hence, the structure of the model is agnostic as to the value of ϕ.
QUANTITATIVE ANALYSIS
The key trait of the EKG framework is that changes in the relative price of capital pt reflect the implementation of economically useful ideas. In this case, equation (7) suggests that there should be an observable empirical relationship between the relative price of capital pt and indicators of the quantity of economically useful knowledge.
To put it another way, the model suggests two ways to construct an index of the quantity of economically useful ideas:
- using a direct measure of knowledge, such as patent applications,9as in the related literature;
See Appendix B for further comments on the use of patent data.
- using the inverse of the relative price of capital, pt1.
Constructing the patent-based series for the stock of knowledge uses equation (3), which requires a value for the depreciation rate for ideas δT. We will examine different values of this parameter, and ask whether the patent-based series and the price-based series co-move appreciably. If they do, this supports the EKG framework—provided they do so for reasonable parameter values. Wilson (2002) finds support in industry cross-section for the identification of capital-embodied R&D with investment-specific technical change: finding such a link in aggregate time-series would be significant.
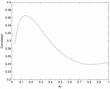
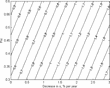
There are two ways in which the data lend support to the EKG framework. First, equation (8) suggests that the values of γT and γp−1 should be identical. This is indeed the case. As measured by patent applications at the USPTO (1947–2000) γT = 1.0261. By contrast, as measured by the relative price of capital in Cummins and Violante (2002) over the same time period, γp−1=1.0262. Second, the two time series are positively correlated regardless of δT—see Figure 1. Notably, this co-movement is the strongest at empirically reasonable values of δT—Nadiri and Prucha (1996) find that δT = 12%, and Pakes and Schankerman (1984) find values up to δT = 26%. The correlation is maximized at δT = 14.5%, which is in the middle of this range. In what follows, we shall assume that δT = 12%: results are robust to reasonable variations in this value.

Correlation between the growth rates of the two constructed measures of the knowledge stock, for different values of δT. Data are from the USPTO and Cummins and Violante (2002).
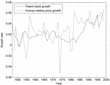
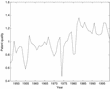
Figure 2 displays the growth rates of the two series. The price-based series is more volatile: this is at least partly because of known sources of measurement error,10
In particular, the sharp dip in 1974 is related to price controls at the time—see Cummins and Violante (2002).
See, for example, Griliches (1990), Hall, Jaffe, and Trajtenberg (2000), Harhoff et al. (2003), and Leiva (2004).

Patent stock growth and growth in the (inverse) relative price of capital. Correlation: 35%. Data are from the USPTO and Cummins and Violante (2002).

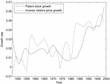
Patent stock growth and growth in the (inverse) relative price of capital, Hodrick-Prescott filtered growth rates with smoothing parameter λ=1. Correlation: 57%. Data are from the USPTO and Cummins and Violante (2002).

Patent stock growth and growth in the (inverse) relative price of capital, Hodrick-Prescott filtered growth rates with smoothing parameter λ=10. Correlation:71%. Data are from the USPTO and Cummins and Violante (2002).
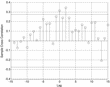
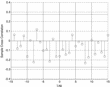
Figure 5 displays the cross-correlogram of the growth rate of the two knowledge stocks. There is some co-movement between the patent-based series and the price-based series, contemporaneously and with a two-year lag. This suggests that innovation leads to implementation fairly quickly, as found by Caballero and Jaffe (1993).

Cross-correllogram for growth in the patent-based knowledge stock Tt and in the price-based stock $p_t^{-1}$. Horizontal lines represent 95% confidence bounds underthe hypothesis that the two series are uncorrelated. Data are from the USPTO and Cummins and Violante (2002).
ON THE EMPIRICS OF IDEAS-BASED GROWTH
This section addresses the empirical “puzzles” described at the beginning of this paper, and their relationship to the EKG framework.
Knowledge and Productivity
The first challenge confronted by ideas-based models is that the empirical literature generally finds a weak link between the knowledge stock and TFP. In the EKG framework, however, this may not be surprising—even if the entirety of economic growth is driven by the knowledge channel.
Let Tt be a measure of the knowledge stock. Several authors estimate the following specification:

which, defining
, is equivalent to the production function (2). Typically, estimates of θ are very low, ranging from 0.05 to 0.2 and sometimes lacking statistical significance.12
See Griliches (1990) for a survey of microeconomic estimates, and Porter and Stern (2000) and Abdih and Joutz (2006) for macroeconomic estimates.
Assume that the EKG framework is a correct representation of the world. Consider an economist who ignores the presence of investment-specific technical change, and who wishes to identify TFP using a standard aggregate model. The aggregate production function and law of motion for capital in such a model will be:


where
is the capital stock derived according to (15),
equals economic depreciation and
is a residual. If economic depreciation is correctly measured, then the following are the relationships between the aggregates of the standard model and those of the present framework:13

Let us refer to
as “measured TFP.” These changes of variables are an equivalent manner in which to write down the present model, so long as the relationships between
, zt and pt are kept in mind. By contrast, (16) is the accounting link that misattributes investment-specific to neutral technical change if investment-specificity is ignored. To see this, using equation (7), the relationship between knowledge Tt and measured TFP
becomes

Thus, in the current framework, there are several reasons why the empirical link between ideas and aggregate TFP should be weak. First, there could be lags between inspiration and implementation, aside from the one-period lag14
Aware of this, empirical work often assumes such a lag. For example, Porter and Stern (2000) assume a three-year lag between patent applications and TFP. As for the empirical consistency of the assumed lag, in related models that also satisfy equation (16), Greenwood et al. (2000) and Fisher (2006) find that 30% of business cycle fluctuations and 50% of time-series variation in labor productivity can be attributed to variations in pt, respectively.
In fact, the contribution of research to economic growth through investment-specific technical change can be assessed using standard growth-accounting techniques. Equation (9) and Table 1 imply that, through investment-specific technical change, the production of knowledge can account for about 55% of U.S. economic growth over the postwar era. This is very close to the contribution of investment-specific technical change to growth found by Greenwood et al. (1997) via growth accounting using only equipment price data, and by Cummins and Violante (2002) using structures also but with a different methodology.15
Interestingly, in a calibrated model of the establishment life-cycle, Samaniego (2006) finds a broadly similar value for plant-embodied technical change.

The Production of Knowledge and Measurement Bias
The second challenge confronted by ideas-based growth models is that the empirical literature generally estimates large values of ϕ, something that contradicts the absence of observable “scale effects.” This puzzle can be resolved on the basis that these estimates are likely to be biased as a result of the use of patent data.
Let qt be the true flow of new ideas as before, and let bt equal the flow of new patent applications. Then, qt can be decomposed according to

where mt is a factor that relates the number of patents to the number of ideas, and captures the extent of measurement error inherent in using patent data as an indicator of new knowledge. Denote mt as average “patent quality.” It cannot be distinguished whether a given change in mt is due to patents being of higher or lower informativeness, or due to changes in the fraction of ideas that are in fact patented. However, in either case, any variation in mt implies that knowledge has grown by more (or by less) than is indicated by patent data.
Let γm be the trend in mt. If γm=1, then patents should serve as a reasonable index of ideas and mt merely represents noise. There is, however, evidence that mt may have increased over time. Recall that papers that estimate the ideas' production function typically use patent applications as an indicator of new ideas, including a time trend among their regressors. They estimate variants of the following equation:

Griliches (1990) and Abdih and Joutz (2006) both find a significant negative time trend, with μ ranging between −1% and −2.3%. Porter and Stern (2000) also find a negative time trend for many of their specifications, averaging about −3%.16
Porter and Stern (2000) find annual trends between +3% to −10%, depending on the exact method and time period of analysis. I adopt a value of −3%, which is around the middle of the range and that is not very different from the values found by other authors.
Equation (19) is equivalent to the present setup, net of a relabeling of the variables. In the ideas production function (3), set qt=mtbt. Taking logarithms, this becomes simply

Combining (19) and (20) yields
so that

Thus, the measured time trend μ cannot distinguish between two factors: changes in the effectiveness of research over time γs, and changes in patent quality γm. In particular, if γs≈1, then the time trend reflects not a downward trend in the ideas' production function but, instead, an upward tendency in patent quality.
If it is true that the patent stock underestimates growth in the stock of ideas (γm>1), then estimates of ϕ using patent data will be biased upward. To see this, recall that the ideas' production function and the ideas' accumulation equation can be written:


Observe that mt appears in (22) as a time trend, and also in (23) as a “correction” to measuring the quantity of new ideas using patents.
By contrast, the empirical implementation of these equations is


Here Bt is the patent stock, and
is the estimate of ϕ obtained when using patent data as an indicator of ideas.
Writing the long-run forms of equations (22) and (24) and equating their right-hand sides yields

since μ=log γs−log γm. Finally, γT = γbγm. Hence, the “true” value of ϕ underlying their estimates is:

If γm>1, then
is biased upward.
Table 2A displays patent growth and the measured time trend over the periods for which each paper uses data, as well as the value of ϕ that is consistent with their estimates after being “corrected” with equation (26). The point estimates turn out to be consistent with values of ϕ that are well below unity.

Table 2B repeats the same exercise, this time replacing the patent stock measure with the (inverse) relative price of capital. This implements the premise that underlies the EKG framework: that the relative price of capital is an indicator of the quantity of economically useful ideas. Remarkably, the “corrected” values of ϕ turn out to be very close to those obtained using patent data in Table 2A—and all are below unity.

Another way to assess the sensitivity of estimates of the ideas production function to the measurement issues just raised is to use the growth accounting relationships (10) and (11) to obtain bounds on ϕ that are consistent with the estimates. Equation (10) does not impose the identification of ideas with investment-specific technical change, whereas equation (11) does.
First, on a balanced growth path γq=γT, so the long-run version of the ideas production function (10) can be rewritten:

Given ψ, suppose that the patent stock is indeed an accurate index for the ideas stock—as does the empirical literature. In this case, over the long run, γm=1, γT = γb and γs=eμ<1. Applying equation (27) delivers a value for ϕ that assumes that the measured trend represents decreases in st. Denote this value ϕmax.
On the other extreme, suppose that the entire time trend is attributable to measurement error, so that γT = γbγm, γs=1 and γm=γ−μ. This delivers a lower bound on ϕ that is consistent with the estimates, denoted ϕmin.
The microeconomic estimates of ψ surveyed by Griliches (1990) range from 0.3 to 0.6, which turns out to be consistent with the estimates of other authors based on aggregate data.17
It is simple to show that the model of ideas' production is equivalent to one in which each sector uses labor and capital rather than the numeraire. The corresponding specification is:

for the special case in which η=αkψ and λ=(1−αk)ψ, this restriction being consistent with the absence of a trend in factor shares. Abdih and Joutz (2006) estimate an equation of the form
, estimating λ=0.21. Setting
implies that ψ=0.3. Porter and Stern (2000) obtain values of λ between 0.21 and 0.45 when there is a year control present, which corresponds to the range ψ∈[0.3, 0.64].
Results are reported in Table 3A. Again, the column for ϕmax lists the values that the model predicts the authors will find by taking the negative time trend at face value. These values are all larger than one. By contrast, if patent data systematically underestimate growth in the stock of ideas, the resulting values are all below unity.18
Growth in reported R&D spending has amounted to over 4% per year: if this is replaced for γy in equation (27) then the values of ϕ obtained are even lower.

Table 3B repeats the same exercise, this time replacing the patent stock measure with the relative price of capital. There is a striking similarity between the results of Table 3A and Table 3B, the difference being that when the relative price of capital is used the estimates are consistent with values of ϕ that are even lower than when patent data are used.

Second, the same procedure can be applied to equation (11), the long-run relationship between parameters and aggregates under the EKG framework. It can be rearranged as follows:

Values of ϕ that are consistent with this equation are displayed graphically in Figure 6. Once more, when the measured trend is attributed to decreases in st, the model predicts that measures of ϕ will be large and exceed unity—exactly as in the empirical literature. By contrast, when the trend is attributed to measurement error, the value of ϕ falls in the range [0.23, 0.62]. Interestingly, this is close to the range of “corrected” estimates in Tables 2A and 2B.

Values of ϕ consistent with the estimates, given assumptions upon ψ andγs. Based on equation (28) and on data from the NIPA, the USPTO, and Cumminsand Violante (2002), and on parameter values from Porter and Stern (2000) and Abdih and Joutz (2006).
Aside from the values themselves, the following results should be emphasized. First, both the estimates and growth accounting point to values of ϕ>0. This is consistent with the “standing on shoulders” effect that prior art is useful for the generation of current art, whereas the “fishing out” hypothesis is not substantiated. Second, growth accounting suggests that there are likely to be decreasing returns in the ideas' production function: ϕ<1. The framework is in fact consistent with values of ϕ that exceed unity: however, this hinges on the presence of a decreasing time trend in the ideas production function. Although such a trend has been detected, there are several reasons to interpret it as an indicator of bias. Third, the empirical estimates themselves are also consistent with decreasing returns once allowance is made for this bias. Clearly, further quantitative work is desirable to obtain more reliable point estimates. However, “quality bias” appears to be as important an issue for the measurement of ideas as it is for the measurement of capital. This paper shows how taking this into consideration points to values of ϕ that tally much better with theory, and that growth accounting within the EKG framework is consistent with this interpretation.
DISCUSSION
Trend or Mismeasurement?
Does the literature offer any guidance as to whether the measured time trends μ are best attributed to measurement error or to changes in the ideas' production function? To begin, the concern that aggregate patent data may not adequately proxy for the quantity of ideas has been raised in the literature previously. For example, Griliches (1990) points out that a potential problem with the use of patent data is that patents may vary over time in terms of quality. The results of Hall, Jaffe, and Trajtenberg (2000) suggest that patent quality varies substantially in cross-section, in that citation-weighted patents are more closely related to the market value of firms than are “raw” patents. Empirical work using the sum of large numbers of patents as an indicator assumes implicitly that aggregation will eliminate the influence of such heterogeneity: however, the distribution of patent quality (as measured by future citations or other measures of value) is so highly skewed that this aggregation result may not always hold—see Griliches (1990), Harhoff et al. (2003), and Leiva (2004). As a result, several authors conclude that there may be discrepancies between the stock of economically useful knowledge and the patent stock over time as well as in cross-section.
Second, it is difficult to see a theoretical basis for the existence of a downward time trend in the ideas production function. One might propose that a downward trend reflects the fact that R&D digs up ideas that are progressively more difficult to find. However, in this event, the volume of new ideas should depend on the quantity of ideas that have already been discovered, not on the date: this is precisely the “fishing out” hypothesis, and should be reflected in a negative estimate of ϕ, not in a time trend.
Third, empirically, a downward trend in the ideas production function seems at odds with the evidence of Kortum and Lerner (1998), who argue that innovativeness has increased over time, particularly since the 1980s. It is also at odds with Griliches (1986) and (1990), who finds no evidence of a decline in the returns to R&D. Cohen et al. (2000) find that there has been a tendency away from patenting and toward secrecy as a means of protecting intellectual property among U.S. manufacturing firms. Lanjouw and Schankerman (1999) find that adjusting patent data for forward citations and other measures of “quality” eliminates the apparent downward trend in the productivity of research spending. All of this points to the interpretation of μ as reflecting not changes in the productivity of ideas as such but, rather, changes in the empirical link between patents and ideas.
Finally, the EKG framework can be used to derive a series for the discrepancy between patents and new ideas mt. From equations (1) and (18), it follows that

Iterating on (29) with bt as new patent applications yields the desired series, which is displayed in Figure 7. Patent quality is highly variable and does indeed display an upward trend, increasing on average by 1.0% each year. This provides further support for the interpretation of a time trends μ as the extent of measurement error underlying the use of patent data.

Patent quality mt, as derived from equation (29). δT=0.12. Data arefrom the USPTO and Cummins and Violante (2002).
Ideas and Sector-Neutral Technical Change
The paper assumes that all ideas are investment-specific, and that none result in sector-neutral technical change. This contrasts with the empirical literature that assumes that all ideas result in neutral technical change. Nonetheless, it is reasonable to ask, what are the implications of assuming that only a fraction of knowledge is investment-specific?
Suppose in what follows that a fraction ζ of knowledge Tt is investment-specific, and that a fraction (1−ζ) leads to sector neutral technical change:
- Regarding the quantitative results of section 4, this simply multiplies the knowledge series by a constant, so that the results of the correlation analysis of growth rates that follows are not affected.
- The results concerning measurement bias in estimates of ϕ are not affected either, for the same reason and because most of those results are independent of whether Tt and are identified. Consequently, none of the above results in fact depend on whether all knowledge is investment-specific: they all continue to hold so long as part of knowledge is investment-specific.
- What of the puzzle regarding the link between TFP and ideas? Suppose there is a one-period lag between innovation and implementation as far as neutral technical change is concerned.19Then, equation (17) becomes
If there is no lag, results are essentially the same but more complicated to derive.
 where Z is a constant. In this case, a log regression of the measured residual on a lagged measure of knowledge Tt−1 will yield a coefficient θ+αk. If αk=0.3, the low empirical estimates of the relationship between ideas and TFP point to values of θ close to zero.


In any case, if neutral technical change is a channel through which knowledge affects growth, one would expect a correlation between the residual zt in equation (17) and the patent series Tt. Figure 8 does not display any significant correlation. This contrasts with Figure 5, which displays a clear correlation between Tt and
, as the EKG framework would suggest.

Cross-correllogram for growth in the patent-based knowledge stock Tt andin the residual zt+k. 95% confidence bounds under the hypothesis that the two seriesare uncorrelated. Data are from the USPTO, the NIPA, and Cummins and Violante (2002).
To sum up, the results are robust to allowing only part of the ideas stock to lead to growth through investment-specific technical change. In addition, the sector-neutral channel is not supported by the aggregate data presented herein.
Perhaps this is to be expected. If firms have a choice between performing neutral or investment-specific R&D, they might prefer to conduct the latter if it is more easily appropriable. Investment-specific knowledge should be embodied in the capital goods that it is used to produce, and this detectability may make patent enforcement easier. The decision of whether or not to embody knowledge could be an interesting avenue for future research.
Concluding Remarks
This paper proposes a view of economic growth that is consistent with several empirical paradoxes regarding the link between knowledge and TFP, while preserving the centrality of the accumulation of knowledge as a factor of economic growth. The key is to identify the implementation of economically useful knowledge with investment-specific technical change. In this case, the absence of a strong relationship between measures of knowledge and TFP is to be expected: instead, it is co-movement among measures of knowledge and measures of investment-specific technical change that provides evidence of a link between ideas and growth. This identification, in combination with the issues raised involving the measurement of ideas, suggest that there may be positive but decreasing returns to old knowledge in the production of new ideas.
APPENDIX A: DECENTRALIZED MODEL
This section describes a decentralized economy that fits within the EKG framework. As in Krusell (1998), in this framework the production of ideas generates economic growth through investment-specific technical change and, with some minor modifications, the Krusell (1998) model aggregates to a production function and law of motion for ideas that is the same as those estimated in the empirical literature—equations (1) and (3). The interested reader may refer to that paper for further theoretical analysis.
OUTPUT
Time is discrete. There are two sectors, one that produces the numeraire (final) good and another that produces new capital goods. Output yt is produced according to a Cobb-Douglas technology that uses labor nt and a continuum of different types of capital kjt, j∈[0, 1].

where sector-neutral technical change zt is stochastic, and grows by a factor γz on average each period.20
Henceforth, let γχ denote the average growth factor for any variable χt.
Output has three uses in this model. It may be used for household consumption (ct), as investment (ijt) for transformation into capital goods of any type j, or used as an input into R&D (xjt). The feasibility constraint is

RESEARCH AND INVESTMENT-SPECIFICITY
Each type of capital j is produced by a monopolist, who also may perform R&D in order to increase her productivity. Let Tjt denote the quantity of investment-specific ideas relevant for the production of capital type j. Capital is accumulated according to the equation

where δk is the rate of physical depreciation. Ideas evolve according to

Define Tt=∫Tjtdj to be the average level of knowledge across sectors, and let qjt be the quantity of new ideas generated in sector j in period t, which is given by a production function

Q depends on the quantity of ideas in sector j, as well as Tt and physical input xjt. Thus, there may be cross-industry spillovers. Krusell (1998) adopts the following functional form for Q:

The parameter σ indicates the extent of cross-sectoral spillovers, whereas ϕ and ψ govern the return to old ideas and to research input in the production of new knowledge. This formulation is a generalization of the function in Krusell (1998), which assumes that ϕ=1. As mentioned earlier, the value of ϕ has been the subject of much debate, and as a result the current model does not restrict it. Krusell (1998) also differs in that it sets δT = 1. To strengthen the connection of the model to the related empirical literature, the paper does not restrict δT either. The value of σ is interesting for theoretical reasons, but does not affect the long run growth properties of the model. A third generalization of the Krusell (1998) model concerns population growth: see later.
The monopolists earn profits from renting their capital to the final goods' sector. Hence, the first-order condition of the final goods firms with respect to capital
represents an inverse demand function for each investment firm. Let V be the value function of a monopolist, which depends on the idiosyncratic and aggregate state variables. Then,

subject to the production functions and laws of motion of capital and ideas.
The first-order condition of this problem with respect to investment is

Define the price of capital pjt as the marginal benefit of creating a new unit of capital, so that21
Alternatively, define the opportunity cost of new capital goods in terms of the numeraire to be pjt. Then, (7) emerges from this definition.

Then the first-order conditions can be reformulated in terms of pjt to yield the decentralized equivalent of (7):

HOUSEHOLDS
Closing the model requires a formulation of the household sector.
The population at date22
Positive population growth is necessary in order to address the question of scale-effects. the Krusell (1998) assumes that ϕ = 1 and does not have population growth: if there were, that model would not have a balanced growth path.

where lt is leisure and Λ is their time endowment. Consumption and labor are in per capita terms. Households own the capital stock and all firms. Their budget constraint is

where [prod ]t represents any dividends they earn from firms that they own.
SYMMETRIC EQUILIBRIMU
Let us focus on an equilibrium in which all capital types are treated equally, so that Tjt=Tt and kjt=kt ∀j. From inspection of (A.3) and (A.5), it is easy to show that the real sector and the knowledge sector aggregate to yield equations (2) and (3). Simply put, a recursive competitive equilibrium for this economy is a set of prices, allocations and decision rules that jointly satisfy the optimization, market-clearing, feasibility and rational expectations conditions at every date. The equilibrium definition is standard and is the same as in Krusell (1998), mutatis mutandis.
APPENDIX B: NOTES ON THE DATA
Patent data are from the United States Patent and Trademark Office (USPTO). Price pt is the quality-adjusted price of capital relative to consumption of Cummins and Violante (2002), which encompasses both equipment and structures. Output and investment data are from the National Income and Product Accounts. Labor hours are from the Bureau of Labor Statistics, and population data are from the United States Census Bureau. The years covered are 1947–2000: all series are annual.
There are two alternative measures of the output of research activity: patent grants, and patent applications. The paper uses patent applications for the following reasons. The “application-to-grant” lag is about two years but varies widely over time, sometimes taking considerably longer. In fact, grants are strongly correlated with the number of patent examiners at the USPTO—see Griliches (1990). As a result, they are inadequate as contemporaneous indicators of ideas' production activity. Moreover, at the point in time in which the patent is applied for, the applicant must have conceived of an innovation that, although possibly in need of further development and marketing, is close to the point of implementability. The model allows for a one-year lag at this stage.
Another option is R&D spending. The drawback is that it is a measure of the input into the ideas production function, not the output, and as such displays very little short-term variation. R&D spending may not constitute an accurate measure even of the input into the production of ideas: managers and other workers whose positions are not nominally connected with R&D may have patentable or otherwise economically useful ideas. Kortum and Lerner (1998) argue that there has been an acceleration of innovative activity in the United States in recent decades, attributed to increasingly active management of knowledge at the establishment level. A likely effect of such a change would be an increase in the proportion of business expenditures that are classified as R&D, as managers distinguish and target R&D activities. Hence, measured aggregate R&D growth may overestimate ideas growth.
Another alternative is the share of employment made up by scientists and engineers in R&D. Again, this is ameasure of the input into R&D—not the output—and will suffer from some of the same problems as R&D spending, such as the fact that managers and other nonscientists may have economically useful ideas. It, too, displays very little high-frequency variation.
To initialize the two knowledge stocks (Tt and
), I assume that the economy was on the balanced growth path in 1947: small deviations in this assumption do not affect results. Patent data are available as far back as the late 18th century: constructing patent data based on the entire series does not change results.
I would like to thank the Editor, the Associate Editor, and an anonymous referee for suggestions that substantially improved the paper. I am indebted to Gianluca Violante for providing me with data on the relative price of capital. I also am grateful to Anna Ilyina, Fred Joutz, and to participants at the 2004 Midwest Macro Meetings at Iowa State University; the 2004 Annual Meetings of the Society for Economic Dynamics at New York University, La Pietra; the 2004 Macro International Seminar at George Washington University; the 2004 Macroeconomics Seminar at Indiana University–loomington; and the 2005 Meetings of the Society for Computational Economics at GeorgeWashington University and the Board of Governors of the Federal Reserve, for suggestions and comments. All errors are the author's.