Introduction
The Minorcan horse is an autochthonous horse breed from Minorca Island in the Balearic archipelago (NW Mediterranean Sea). The Minorcan is a eumetric uniform jet-black horse with a sub-convex to straight profile. The minimum rise to the withers is 1.54 m in males and 1.51 m in females. An excellent riding horse for any type of rider, they have a great capacity to adapt to different styles and are easily broken in. They are suitable for refined riding techniques and graceful handling and also suitable for lightweight harnesses. A breeding program for the horse was accepted in the year 1989, when it was officially recognized. Its total census (2011) is about 3 500 animals. The conformation assessment for the Minorcan horse is very important to meet its standard racial requirements, whatever the final purpose of each animal. But these judgements are basically subjective, and therefore the implementation of objective methodologies assessing functional morphology is of major importance.
Traditionally, breed studies are based on linear and angular measures: Hevia and Quiles (Reference Hevia and Quiles1993) for the Thoroughbred, Batista et al. (Reference Batista, Queiroz, Raquel, Cezar, Coelho, Mauro and Corassa2008) for the Mangalarga, Cervantes et al. (Reference Cervantes, Baumung, Molina, Druml, Gutiérrez, Sölkner and Valera2009) for the Spanish Arab, Purzyc et al. (Reference Purzyc, Kobrynczuk and Bojarski2011) for the Hucul, and so on. These kinds of studies have a great value in the sense that they describe morpho-functional traits of the studied animals. But none are based on geometric morphometrics (GM).
GM is the statistical analysis of shape variation and its covariation with other variables (Bookstein, Reference Bookstein1991). These methods quantify variation in the shape of anatomical objects using the Cartesian coordinates of anatomical landmarks, after the effects of non-shape variation have been mathematically held constant. GM studies are accomplished through what can be called the Procrustes paradigm; an approach to shape analysis that emerged from the unification of a rigorous statistical theory for shape with analytical procedures for superimposing landmark configurations to obtain shape variables. In a typical morphometric analysis, the Procrustes paradigm is implemented as a series of operations. First, from each specimen, a set of the two-dimensional landmark coordinates is obtained, which record the relative positions anatomically definable locations. These landmarks can be considered “fixed points”, as they define the locations of particular anatomical traits representing discrete biological attributes. Next, a generalized Procrustes analysis is used to superimpose the configurations of landmarks in all specimens to a common coordinate system, and to generate a set of shape variables. This least-squares procedure translates all specimens to the origin, scales them to unit centroid size (CS), and rotates them to minimize the total sums-of-squares deviations of the landmark coordinates from all specimens to the average configuration. After superimposition, the aligned Procrustes shape coordinates describe the location of each specimen in a curved space related to Kendall's shape space (Slice, Reference Slice2001). These are typically projected orthogonally into a linear tangent space yielding Kendall's tangent space coordinates (Dryden and Mardia, Reference Dryden and Mardia1993), on which multivariate analyses of shape variation are then conducted. An extensive introduction to the theory of GM is provided in Adams et al. (2008).
Then, in this study, variations in the form of the landmark configurations were examined using these Procrustes-based GM, as the angle- and distance-based classical approach has less desirable statistical properties (Franklin et al., Reference Franklin, Cardini, O'Higgins, Oxnard and Dadour2008) and provides an efficient separation of size and shape components of form differences (Adams, Slice and Rohlf, Reference Adams, Slice and Rohlf2004).
Thus, although sexual dimorphism is declared for the Minorcan breed, it is based on analogical and subjective appreciations, with expressions such as “females are recognized as more stylized than the males, their heads and bodies being longer, as well as having more slender necks and a squarer croup”. So an objective degree of sexual dimorphism in the shape independently of size has never been studied for this breed.
Thus, the objective of this paper is to explore the nature of sexual dimorphism in this breed in relation to both form components (size and shape), avoiding subjective appreciations and basing this study not on profile (“silhouette” for the observer, as is normally done in judgements) but on functional points, which will be defined for this research using homologous landmarks.
Materials and methods
Material
Our data consisted of 38 registered adult Minorcan Horses (20 males and 18 females) within an age range from 3 to 14 years (average 7 years). The animals belonged to 24 different owners, and were kept in 8 different local farms and riding centres.
Data gathering
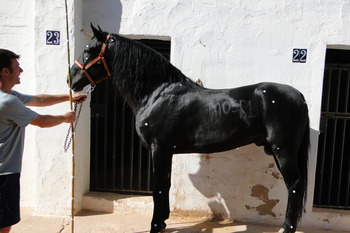
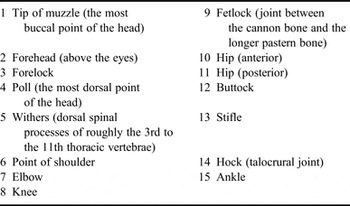
Images were collected by taking a photograph of each animal in direct view, at rest on a horizontal floor. Fifteen landmarks were indicated by white sticks placed on the lateral aspect of each animal before taking its picture. These landmarks were chosen to provide an adequate coverage of the body functionality (Table 1 and Figure 1), as they were located (except for those located on the head, which were extremal) at articulations. A scale (an stick of 200 cm) was put on each image. Withers height was also registered. The second author was responsible for landmarking all specimens and also took also pictures, using a Sony DSC-HX1 apparatus at high resolution (3 456 × 2 304 pixels), from a distance to ensure that the animal only occupied the central portion of focal space to avoid peripheral image distortion or parallax. The images were then digitized using TpsDig software version 2.16 (Rohlf, Reference Rohlf2010) to obtain the x, y coordinates of the landmarks. To ensure that the localization of the selected points, a Mantel test gave a R = 0.356, P = 0. So, the error for digitizing landmarks was considered negligible. To test whether the shape variation was small enough to permit the use of approximations in tangent space, a correlation between specimen distances in tangent space and Procrustes space was performed in TpsSmall (Rohlf, Reference Rohlf2003). The correlation was very high (r = 1), indicating that no significant distortion was introduced by tangent space approximations.
Landmarks digitized on the surface of the body. These 15 landmarks were chosen to provide an adequate coverage of the body functionality.

Explanation of landmarks used to derive the 15 coordinates used in the morphometric analyses.

The geometric morphometric method (GMM) requires the positions of landmarks, a finite number of points along the outline of the shape, instead of longitudinal or angular measurements. Landmark positions were converted to scaled x and y coordinates using CoordGen6f (Sheets, Reference Sheets2003), which was also used to translate and rotate images. CS, which was computed as the square root of the sum of squared distances of all landmarks from the centroid (Dryden and Mardia, Reference Dryden and Mardia1993), was used as a measurement independent of shape (Bookstein, Reference Bookstein1991). The natural log of CS was used as the size reference. The CS is the square root of the sum of squared distances of a set of landmarks from the mathematical centre (i.e., centroid) of a configuration of landmarks (Bookstein, Reference Bookstein1991). After that the configurations are rotated to minimize the squared differences between landmarks, and the aligned coordinates (consensus configuration) are obtained. CoordGen6f (Sheets, Reference Sheets2003) was used to rescale, translate and rotate images. The final “shape variables” were used for further statistical analysis.
Statistical analysis
To examine the amount of differences in sexual shape dimorphism we used Procrustes Non Parametric Anova (NPMANOVA) with 9 999 permutations and the Mann–Whitney test of log CS to assess differences in size. In addition, group assignment was cross-validated by a leave-one-out cross-validation (jackknifing) procedure. Principal component analysis (PCA) involves the linear transformation of correlated variables into pairwise uncorrelated variables and is often used as an exploratory method in which scores based on the first two or three variables are plotted to investigate or display structure in the data. Components with eigenvalues smaller than the Jolliffe cut-off may be considered insignificant, but this criterion should not be given too much weight. Statistical analyses were done with the PAST v. 2.12 (Hammer, Harper and Ryan, Reference Hammer, Harper and Ryan2001) and MorphoJ v. 1.03d (Klingenberg, Reference Klingenberg2011) packages.
Results and discussion
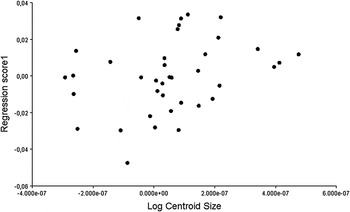
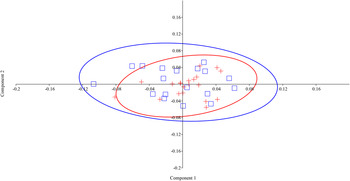
The Mann–Whitney test for size did not show significant differences between sexes (P = 0.872), so males and females can be considered of the same size. Size is not correlated with age (r s = −0.200, P = 0.228). Procrustes ANOVA for shape also showed no significant differences between sexes (P = 0.132), although males are more uniform. Variation in shape can be explained by size (F 30,7 = 0.945; P = 0.586) (Figure 2). The PCA plot for the symmetric component (individual variation) shows some differences between the populations analysed. The first two principal components (PCs) account for 64.01 percent (PC1 + PC2 = 38.14 + 25.87 percent) of the total shape variation and provide a reasonable approximation of the total amount of variation, while the other PC components each accounted for no more than 9.0 percent of the variation (Figure 3). Seven components presented eigenvalues smaller than the Jolliffe cut-off (8.271 × 10⁻⁵). In PC1, Procrustes 30 (corresponding to the ankle) had higher values on the positive axis, and in PC2, Procrustes 16 and 18 (corresponding to the knee and fetlock, respectively) presented higher values on the positive axis, but differences between sexes did not appear for any of these three Procrustes (P < 0.05). Discriminant function analysis based on the shape variables revealed no misclassification among individuals but in the alternative, more stringent jackknifing classification test, 17 specimens were misclassified (this test resulted in 81 percent misclassification between the two gender groups).
Relationship between log CS and size for all the specimens in this study, represented with shape scores as a function of log CS. Filled circles indicate specimens. F-test: F 30,7 = 0.945; P = 0.586.

PCA. The first two PCs accounted for 64.01 percent (PC1 + PC2 = 38.14 + 25.87 percent) of the total shape variation. Crosses indicate males; open squares indicate females.

Entin (cited in Van Damme et al., Reference Van Damme, Entin, Vanhooydonck and Herrel2008) analysed thoroughbred horses and found that sexual dimorphism was only 1.007 in the shorter races and 1.014 in the longer races. Similarly, for standard-bred horse races from American tracks, the sexual dimorphism amounted to 1.015 for trotters and less than 1.001 for pacers. Although the standard for the Minorcan horse recognizes some differences among sexes, the extent of sexual dimorphism in adult shape between them is merely 0.062.
The conclusions are those expected for the modern horse: sexual dimorphism is very low, with males and females of the same breed having almost equal body size (Olsen, Reference Olsen2003). According to shape, the Minorcan horse is a low sexual dimorphism equine breed, but levels of form dimorphism (visually assessed) are probably greater than morphometric dimorphism, at least in a functional plane.
The researcher must remember, however, that “size” and “shape” are defined a priori and may not pertain directly to the geometry of the forms under study (Jungers, Falsetti and Wall, Reference Jungers, Falsetti and Wall1995). So, for instance, one must be aware that GMMs are based on the study of CS, not total body size, so perhaps if other landmarks were selected, different results could be achieved as “size” would be estimated differently. As the amount of biological information associated with constructed landmarks is dependent on the rules used for their construction, and most of the landmarks have been based upon the relative locations of the chosen functional (anatomical) points rather than upon the shape of the outline, no information relating to the curvature of form between landmarks, and therefore general body curvature, was preserved. So, general and regional profiles (“silhouette”) can still be visually discriminative sexual traits for horse breeds. This is why expressions in an official description such as “crest is moderately lean in mares but inclined to be more full in stallions” have sense only for a morphological description based on silhouette. Another problem is that these are empiric definitions that are moreover implicitly meshed with colloquial meanings of the same terms. The result is an imprecise and ineffective description and unclear communication for comparative studies between sexes, subpopulations or other breeds.
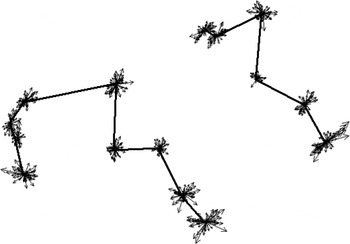
Vector plot. Straight lines show the consensus figure. See also Figure 1.

Acknowledgements
The authors are grateful for the great collaboration of the Minorcan horse owners who kindly allowed the sampling of their animals and provided us with all the required information. The authors declare no conflict of interest related to this work.