



1 Introduction
Flow-induced vibration (FIV) of bluff bodies is an important problem encountered in a variety of engineering applications, such as oil risers and offshore structures subject to ocean currents, high-rise buildings and bridges in winds, cooling arrays in nuclear plants, etc. There are two body oscillator phenomena typical of FIV, namely vortex-induced vibration (VIV) and galloping, which have motivated extensive research studies that have aimed to fundamentally characterise and provide insights into the excitation mechanisms. Comprehensive reviews on this subject have been given by Bearman (Reference Bearman1984), Blevins (Reference Blevins1990), Sarpkaya (Reference Sarpkaya2004), Williamson & Govardhan (Reference Williamson and Govardhan2004), Naudascher & Rockwell (Reference Naudascher and Rockwell2005) and Païdoussis, Price & De Langre (Reference Païdoussis, Price and De Langre2010), among others.
In the past half-century, VIV has been studied extensively through the use of circular cylinders. They provide an ideal reference model due to their rotational symmetry (e.g. Brooks Reference Brooks1960; Feng Reference Feng1968; Khalak & Williamson Reference Khalak and Williamson1996, Reference Khalak and Williamson1997, Reference Khalak and Williamson1999; Govardhan & Williamson Reference Govardhan and Williamson2000; Carberry, Sheridan & Rockwell Reference Carberry, Sheridan and Rockwell2001, Reference Carberry, Sheridan and Rockwell2005; Zhao et al.
Reference Zhao, Leontini, Lo Jacono and Sheridan2014a
). This symmetry prohibits the occurrence of FIV that derives from cross-sectional asymmetry, namely galloping. VIV occurs as vortices are shed from alternate sides of an elastic or elastically mounted bluff body. These vortices create a fluctuating pressure distribution on the body that can induce a resonant vibrational response over certain flow velocity ranges. On the other hand, a structure that lacks rotational symmetry can vibrate due to a motion-induced unstable aerodynamic force, which can result in galloping, as opposed to, or in combination with, VIV. Unlike VIV, which is associated with forces induced by vortex shedding and thus occurs with limited vibration amplitude (generally of the order of one body diameter) in discrete flow velocity ranges, galloping, as it is driven by unsteady aerodynamic force, is characterised typically by body oscillations with an amplitude increasing with flow velocity and the frequency much lower than that of the vortex shedding. Of interest to the current study is the transverse (or cross-flow) FIV of a D-section (closed semicircular) cylinder with low mass ratio (defined as the ratio of the total oscillating mass to the displaced fluid mass) placed at two particular flow incidence angles of
 $\unicode[STIX]{x1D6FC}=0^{\circ }$
(oriented with its flat surface facing upstream) and
 $180^{\circ }$
(oriented with its curved surface facing upstream). The former orientation, as has been shown in the literature, can exhibit VIV and galloping under certain flow conditions. More interestingly, on the other hand, the latter, as it has no afterbody (the section of the bluff body downstream of the flow separation points), raises the question of whether VIV relies on the existence of an afterbody, which has been suggested as essential for VIV to occur.
The D-section cylinder is a bluff body that has an afterbody when facing in one direction but no afterbody when facing in the opposite direction. When a D-section cylinder is oriented with its flat section facing upstream, then the afterbody is the whole semicircular cross-section, as the flow separates at the sharp leading edges. However, when the flat section is facing downstream, then there is no afterbody following the separation at the corners of the flat section. The rationale for the view that VIV requires an afterbody stems from the fact that the roll-up of shear layers occurs after separation, so while there will still be an oscillating pressure field associated with the alternately shed vortices, this pressure field will act on the vertical rear surface and thus cannot generate vertical oscillatory motion.
The D-section at zero incidence angle (
 $\unicode[STIX]{x1D6FC}=0^{\circ }$
) has been the focus of considerable past research. According to Païdoussis et al. (Reference Païdoussis, Price and De Langre2010), the first description of galloping with a D-section cylinder may have been provided by Lanchester (Reference Lanchester1907). Cheers (Reference Cheers1950) also measured the lift and drag curves for a fixed D-section cylinder at different angles of attack. In wind-tunnel experiments, Brooks (Reference Brooks1960) observed that a D-section exhibited a VIV response and was subject to galloping only when given a substantial initial amplitude. On the other hand, however, he reported on the reversed D-section case, as noted without an afterbody (
 $\unicode[STIX]{x1D6FC}=180^{\circ }$
), that ‘No motion other than random buffeting was observed over a range of air speeds from
 $V_{inf}=0$
to 50 frames per second. This section appears to be completely stable’. Later, Parkinson (Reference Parkinson1963) found that a D-section experienced VIV response excited from rest in the reduced velocity range
 $4.1<U^{\ast }<7.9$
, where
 $U^{\ast }=U/(f_{n}D)$
with
 $U$
the free-stream velocity,
 $f_{n}$
the natural frequency of the system (in quiescent fluid) and
 $D$
the cylinder diameter, and that the galloping amplitude response for
 $U^{\ast }>7.9$
could be more or less predicted by a quasi-steady approach, yet triggering was required to cause galloping.
Subsequently, Feng (Reference Feng1968) found that for a D-section cylinder, again of high mass-damping ratio in wind-tunnel experiments, the oscillation amplitudes were larger, and the wake velocity correlation lengths at near-maximum oscillation were also much larger than for a circular cylinder. The synchronisation range where the body oscillation and vortex shedding were locked fell between
 $78\,\%$
and
 $91\,\%$
of the natural oscillation frequency of the cylinder, with the maximum oscillation amplitude occurring near the end of this range. Note that, at least for a circular cylinder, the synchronisation regime has been shown to widen for decreasing mass ratio by Griffin & Koopman (Reference Griffin and Koopman1982); this effect has been demonstrated by Khalak & Williamson (Reference Khalak and Williamson1996, Reference Khalak and Williamson1997, Reference Khalak and Williamson1999) by comparing the results of Feng (Reference Feng1968) to those for a much lower mass ratio (
 ${\approx}3\,\%$
). Novak & Tanaka (Reference Novak and Tanaka1974) showed that flow turbulence had considerable effects on galloping with D-section and rectangular cylinders, and demonstrated that the quasi-steady theory was capable of successfully predicting these effects and the galloping response in smooth flow as well as in turbulent flow. Recently, Weaver & Veljkovic (Reference Weaver and Veljkovic2005) agreed with the findings of Novak & Tanaka (Reference Novak and Tanaka1974) that a D-section exhibited purely a very narrow regime of VIV resonance; however, galloping was induced when a significant disturbance from the body’s rest position was given. These previous studies conducted with high mass-damping ratios in wind tunnels have indicated that the D-section is susceptible to ‘hard’ galloping that requires an initial triggering amplitude.
Since the pioneering study of Brooks (Reference Brooks1960) having shown that the reversed D shape did not vibrate significantly due to the lack of an afterbody, many studies have appeared in the literature on the effect of an afterbody on VIV of bluff bodies. Bearman (Reference Bearman1984) states that ‘These results show that the shape of the afterbody, the region of a bluff body downstream of its separation points, plays an extremely important role in determining the response of the flow to body movements’. The review article of Parkinson (Reference Parkinson1989) references the finding of Brooks (Reference Brooks1960) that the D-section cylinder undergoes strong galloping and VIV when the flat surface faces upstream but undergoes neither when the curved surface is facing upstream because of the lack of an afterbody. This finding is repeated by Naudascher & Rockwell (Reference Naudascher and Rockwell2005, p. 207): ‘if the D-section is oriented with its curved surface facing upstream, it will neither gallop nor vibrate on account of vortex shedding, because it has no afterbody.’ Meneghini et al. (Reference Meneghini, Saltara, Fregonesi, Yamamoto and Chakrabarti2005) refer to the results of Bearman & Davies (Reference Bearman, Davies and Eaton1977): ‘Bearman and Davies
 $\ldots$
showed that the after-body shape plays an important role in the phase shift. Bodies with a large after-body, such as a square or rectangular cylinder, experience a phase shift that is most negative for frequencies of oscillation around the shedding frequency. Bodies with a small after-body are not subjected to VIV under normal conditions.’ Recent studies by Nemes et al. (Reference Nemes, Zhao, Lo Jacono and Sheridan2012) and Zhao et al. (Reference Zhao, Leontini, Lo Jacono and Sheridan2014b
) investigating the influence of angle of attack on the FIV response of a square cylinder with low mass-damping ratios in water flows showed that the FIV response was dominated by galloping for
 $0^{\circ }\leqslant \unicode[STIX]{x1D6FC}<10^{\circ }$
, by VIV for
 $22.5^{\circ }<\unicode[STIX]{x1D6FC}\leqslant 45^{\circ }$
, and by VIV–galloping interaction for the middle
 $\unicode[STIX]{x1D6FC}$
range. It was suggested that the afterbody and the flow separations at the sharp corners are the key factors in the mechanisms of fluid–structure interaction.
Nevertheless, the question whether an afterbody is essential for the occurrence of VIV still remains. In his concluding remarks, Bearman (Reference Bearman1984) writes that ‘A related unsettled question is the role of the afterbody shape in vortex-induced oscillations of bluff bodies. Shapes other than the circle need to be studied in detail; bodies with fixed separation and a significant afterbody, such as D-shape or a triangular section, could provide useful additional test data to prove prediction methods.’ Interestingly, in their pressure measurements on a triangular cross-sectional cylinder with a flat surface facing downstream, Twigge-Molecey & Baines (Reference Twigge-Molecey and Baines1974) found that a small transverse lift fluctuated at the vortex shedding frequency, suggesting in this case that VIV would be possible in the absence of an afterbody.
Clearly, in the literature over decades, there is still a lack of the information on characteristics of the FIV response of a D-section cylinder, including the amplitude and frequency responses, fluid forces and phases, and near-wake flow structures behind the body. This is particularly so for a system with low mass-damping ratio. In fact, previous studies of circular and square cylinders (e.g. Khalak & Williamson Reference Khalak and Williamson1996, Reference Khalak and Williamson1997; Govardhan & Williamson Reference Govardhan and Williamson2000; Nemes et al.
Reference Nemes, Zhao, Lo Jacono and Sheridan2012; Zhao et al.
Reference Zhao, Leontini, Lo Jacono and Sheridan2014b
) have demonstrated a significant effect of the mass and damping ratio on the structural response and the coupled wake structure. This study therefore aims to gain a deeper understanding of these aspects and the fluid–structure mechanisms of the D-section and its reversed case, by experimentally investigating the structural vibration response, fluid forces and vortex shedding modes in water free-stream flow over a wide
 $U^{\ast }$
range. In particular, the question whether an afterbody is essential for VIV will also be investigated.
The article proceeds by describing the fluid–structure system modelling and the experimental details in § 2. The results and discussion on the structural vibration response are presented in § 3. Finally, conclusions are drawn in § 4.
2 Experimental method
A schematic of the one-degree-of-freedom (1-DOF) transverse FIV of a D-section cylinder is given in figure 1, which shows key parameters of the fluid–structure system. The body dynamics is governed by the linear second-order oscillator equation,
 $$\begin{eqnarray}m\ddot{y} (t)+c{\dot{y}}(t)+ky(t)=F_{y}(t),\end{eqnarray}$$
where
 $m$
is the total oscillating mass of the system,
 $c$
the structural damping of the system,
 $k$
the spring constant,
 $y(t)$
the body displacement and
 $F_{y}(t)$
the transverse fluid force.
The experiments were conducted in the free-surface recirculating water channel of the Fluids Laboratory for Aeronautical and Industrial Research (FLAIR) at Monash University. The test section of the water channel has dimensions of 600 mm in width, 800 mm in depth and 4000 mm in length. In the present experiments, the free-stream turbulence level was less than
 $1\,\%$
. Details of the water channel facilities can be found in Nemes et al. (Reference Nemes, Zhao, Lo Jacono and Sheridan2012) and Zhao et al. (Reference Zhao, Leontini, Lo Jacono and Sheridan2014a
,Reference Zhao, Leontini, Lo Jacono and Sheridan
b
). The experimental set-up is shown in figure 2.
Schematic of the problem studied: a D-section cylinder with variable angle of attack
 $\unicode[STIX]{x1D6FC}$
, elastically mounted with low mass damping and constrained to oscillate transverse to the oncoming free stream. Here,
 $U$
is the free-stream velocity,
 $\unicode[STIX]{x1D6FC}$
the angle of attack,
 $H$
the frontal projected width of the body,
 $m$
the oscillating mass,
 $k$
the spring constant,
 $c$
the structural damping, and
 $F_{x}$
and
 $F_{y}$
represent the drag force and the transverse fluid (lift) force acting on the body.

The rigid D-section cylinder model used was manufactured from aluminium, using precision electrical discharge machining (EDM) to manufacture a hollow semicircular cross-sectional profile with an outer diameter of
 $D=25\pm 0.010~\text{mm}$
. The cylinder was hard anodised against water corrosion. The immersed length of the cylinder was
 $L=614~\text{mm}$
, giving an aspect ratio range of
 $AR=L/D=24.6$
. The total oscillating mass was
 $m=901.8~\text{g}$
, and the displaced mass of the fluid was
 $m_{d}=150.1~\text{g}$
, giving a mass ratio of
 $m^{\ast }=m/m_{d}=6.0$
. The cylinder was mounted vertically to a low-friction air-bearing rig, which was clamped above the top water surface of the water channel, and aligned to allow transverse oscillations. Further details of the air-bearing system are provided in Zhao et al. (Reference Zhao, Lo Jacono, Sheridan, Hourigan and Thompson2018). The opposite free end of the cylinder was positioned with a small clearance above a platform used to reduce end effects. The natural frequencies of the system were measured by conducting free-decay tests individually in air and in quiescent water. The natural frequencies of the system in air and in water were found to be
 $f_{na}=0.783~\text{Hz}$
and
 $f_{nw}=0.740~\text{Hz}$
, respectively, and the structural damping ratio with consideration of the added mass (
 $m_{A}$
) was determined by
 $\unicode[STIX]{x1D701}=c/2\sqrt{k(m+m_{A})}=1.51\times 10^{-3}$
, in which
 $m_{A}=((f_{na}/f_{nw})^{2}-1)m$
. The reduced velocity, defined by
 $U^{\ast }=U/(f_{nw}D)$
, was investigated over the range of
 $2.3\leqslant U^{\ast }\leqslant 20$
, encompassing the range in which VIV should be active. The corresponding Reynolds number range was
 $1080\leqslant Re\leqslant 9000$
, where
 $Re=UD/\unicode[STIX]{x1D708}$
with
 $\unicode[STIX]{x1D708}$
the kinematic viscosity of the fluid.
Schematic of the experimental set-up in the test section of the water channel in different views.

The body displacement was measured using a non-contact digital optical linear encoder (model RGH24; Renishaw, UK). This linear encoder had a resolution of
 $1~\unicode[STIX]{x03BC}\text{m}$
and a linear range of
 $\pm 200~\text{mm}$
available. While the drag force
 $(F_{x})$
was measured by employing a force balance based on semiconductor strain gauges, the transverse lift force (
 $F_{y}$
) acting on the vibrating cylinder was determined based on (2.1). The measurements were sampled at 100 Hz. More details of the data acquisition (DAQ) system and validation of the experimental method can be found in previous related studies by Wong et al. (Reference Wong, Zhao, Lo Jacono, Thompson and Sheridan2017, Reference Wong, Zhao, Lo Jacono, Thompson and Sheridan2018), Sareen et al. (Reference Sareen, Zhao, Logacono, Sheridon, Hourigan and Thompson2018) and Zhao et al. (Reference Zhao, Lo Jacono, Sheridan, Hourigan and Thompson2018).
In measurements of the transverse lift for a quasi-steady analysis, the angle of attack of the cylinder was varied and held still by using a rotation device driven by a micro-stepping motor (for details, see Wong et al. Reference Wong, Zhao, Lo Jacono, Thompson and Sheridan2017, Reference Wong, Zhao, Lo Jacono, Thompson and Sheridan2018; Zhao et al. Reference Zhao, Lo Jacono, Sheridan, Hourigan and Thompson2018). This allowed the alignment measurements to be precisely controlled and automated.
The flow structures in the near wake of the cylinder were measured using the particle image velocimetry (PIV) technique. The PIV system detailed in Zhao et al. (Reference Zhao, Lo Jacono, Sheridan, Hourigan and Thompson2018) was used for this purpose. The flow was seeded with hollow microspheres (model Sphericel 110P8; Potters Industries Inc.) having a normal diameter of
 $13~\unicode[STIX]{x03BC}\text{m}$
and a specific weight of
 $1.1~\text{kg}~\text{m}^{-3}$
. Illumination was provided by a continuous laser (model MLL-N-532-5W; CNI, China) that produced a 3 mm thick horizontal planar laser sheet. Imaging was performed using a high-speed camera (model Dimax S4; PCO AG, Germany) with a resolution of
 $2016~\text{pixel}\times 2016~\text{pixel}$
. This camera was equipped with a 50 mm lens (Nikon Corporation, Japan), giving a magnification of approximately
 $7.65~\text{pixel}~\text{mm}^{-1}$
for the field of view of interest. For each PIV measurement location, a set of
 $3100$
image pairs was recorded at a sampling rate of 10 Hz for analysis. To provide an insight into the evolution of the wake structures, images of each set were sorted into
 $24$
phases based on the cylinder’s displacement and velocity, yielding at least
 $120$
image pairs for averaging. The PIV data were processed using validated in-house software developed by Fouras, Lo Jacono & Hourigan (Reference Fouras, Lo Jacono and Hourigan2008), using
 $32~\text{pixel}\times 32~\text{pixel}$
interrogation windows in a grid layout with
 $50\,\%$
window overlap.
3 Results and discussion
3.1 VIV and galloping responses at
 $\unicode[STIX]{x1D6FC}=0^{\circ }$

3.1.1 Amplitude and frequency responses
Figure 3 presents an overview of the normalised cylinder vibration amplitude (
 $A_{10}^{\ast }$
) and the normalised frequency power spectral density (PSD) contours of the cylinder vibration (
 $f_{y}^{\ast }$
), the transverse lift
 $(f_{C_{y}}^{\ast })$
, the vortex force
 $(f_{C_{v}}^{\ast })$
and the drag force
 $(f_{C_{x}}^{\ast })$
as a function of reduced velocity for the D-section (
 $\unicode[STIX]{x1D6FC}=0^{\circ }$
). Note that the
 $A_{10}^{\ast }$
amplitude response represents the mean of the top
 $10\,\%$
amplitude peaks normalised by the frontal projected width
 $H=(1+|\cos \unicode[STIX]{x1D6FC}|)D/2$
, i.e.
 $H=D$
for both
 $\unicode[STIX]{x1D6FC}=0^{\circ }$
and
 $180^{\circ }$
. The frequency responses in figure 3(b–e) represent the frequency components normalised by the natural frequency
 $f_{nw}$
. Also, it should be noted that the drag coefficient used in this study is defined by
 $C_{x}=F_{x}/(\unicode[STIX]{x1D70C}U^{2}DL/2)$
, while the transverse lift and the vortex force coefficients are defined by
 $C_{y}=F_{y}/(\unicode[STIX]{x1D70C}U^{2}DL/2)$
and
 $C_{v}=F_{v}/(\unicode[STIX]{x1D70C}U^{2}DL/2)$
, respectively, where the vortex force is computed based on
 $F_{v}=F_{y}-F_{p}$
, with
 $F_{p}=-m_{A}\ddot{y} (t)$
, i.e. the potential force (see Govardhan & Williamson Reference Govardhan and Williamson2000; Morse & Williamson Reference Morse and Williamson2009; Zhao et al.
Reference Zhao, Leontini, Lo Jacono and Sheridan2014a
,Reference Zhao, Leontini, Lo Jacono and Sheridan
b
).
The amplitude response and the logarithmic-scale normalised frequency power spectral density (PSD) contours as a function of the reduced velocity for the case of
 $\unicode[STIX]{x1D6FC}=0^{\circ }$
. In (a): ▫, measurements with increasing
 $U^{\ast }$
; ▪, measurements with decreasing
 $U^{\ast }$
; the VIV-dominated, transition and galloping-dominated regimes are highlighted in light grey, light blue and dark grey, respectively. In (b–e): the vertical dashed lines represent the boundaries of the response regimes, and the horizontal dotted lines highlight the first and the third harmonics.

As can be seen from figure 3(a), three main flow regimes are observed, which are characterised by a VIV-dominated response for
 $U^{\ast }<10$
, a galloping-dominated response for
 $U^{\ast }>12.5$
, and a transition region between these two response types for
 $10<U^{\ast }<12.5$
. These regimes are categorised based on an overall examination of the cylinder vibration amplitude and frequency responses, the fluid forces and phases, and the vortex shedding modes. At low reduced velocities of
 $U^{\ast }<2.8$
, the vibration amplitude is extremely low (
 $A_{10}^{\ast }\approx 0$
). On the other hand, the corresponding frequency responses of
 $f_{y}^{\ast }$
,
 $f_{C_{y}}^{\ast }$
and
 $f_{C_{v}}^{\ast }$
exhibit two components: one being close to
 $f_{nw}$
(i.e.
 $f^{\ast }\approx 1$
) and the other following the trend of the Strouhal frequency (the vortex shedding frequency of a fixed body case). Note that the Strouhal number was found to be
 $St=f_{St}D/U\simeq 0.140$
(with
 $f_{St}$
the Strouhal frequency) for the fixed cylinder case, in good agreement with previous studies, e.g.
 $St=0.135$
(Brooks Reference Brooks1960) and
 $St=0.150$
(Weaver & Veljkovic Reference Weaver and Veljkovic2005). As the reduced velocity is increased to
 $U^{\ast }=3.0$
, the cylinder experiences a minor jump in the oscillation amplitude to
 $A_{10}^{\ast }=0.18$
, and simultaneously the oscillation frequency jumps close to, but lower than, the natural frequency of the system, indicating that the onset of ‘lock-in’ occurs. It is interesting to note that this onset reduced velocity of lock-in appears to be much lower than the theoretically expected value
 $U^{\ast }=1/St\simeq 7.1$
for resonance (i.e. the Strouhal frequency matches
 $f_{nw}$
), but similar to the study of Parkinson (Reference Parkinson1963) who observed that VIV from rest occurred in the range
 $4.1<U^{\ast }<7.9$
, with
 $1/St=7.4$
. This is significantly different from that of classic VIV of a circular cylinder, where the onset of lock-in normally occurs at
 $U^{\ast }\approx 5$
(
 $St\approx 0.21$
for a circular cylinder at moderate Reynolds number (see Zhao et al.
Reference Zhao, Leontini, Lo Jacono and Sheridan2014b
)) when the oscillation frequency locks onto a value equal to or higher than the system natural frequency, which depends on the mass ratio (see Govardhan & Williamson Reference Govardhan and Williamson2002). Further discussion on the onset of lock-in will be presented in § 3.2.3. At this point, the frequencies of the cylinder vibration, the lift and vortex forces synchronise (i.e.
 $f_{y}^{\ast }~\cong ~f_{C_{y}}^{\ast }~\cong ~f_{C_{v}}^{\ast }$
), while the frequency of the drag appears to be twice these frequencies. As a result, the body motion exhibits highly periodic oscillations.
Further increasing
 $U^{\ast }$
sees a rapid increase in the amplitude response and also a slight increasing trend in the frequency responses. Interestingly, when
 $U^{\ast }$
is increased to
 $4.0$
, the third harmonics of
 $f_{C_{y}}^{\ast }$
and
 $f_{C_{v}}^{\ast }$
appear with very weak power; however, their powers tend to increase with
 $U^{\ast }$
. It should also be noted that the second harmonics of
 $f_{C_{y}}^{\ast }$
and
 $f_{C_{v}}^{\ast }$
are observed over a narrow range of
 $5\lesssim U^{\ast }\lesssim 6$
, which is associated with changes in the total phase (the phase angle between the transverse lift and the cylinder displacement) and the vortex phase (the phase angle between the vortex force and the cylinder displacement) that will be further discussed in § 3.1.2. For the higher range
 $6<U^{\ast }<12.5$
, the monotonically increasing trend of
 $A_{10}^{\ast }$
persists across the transition regime (
 $10<U^{\ast }<12.5$
). While the transition regime cannot be revealed by the
 $A_{10}^{\ast }$
and
 $f_{y}^{\ast }$
responses, it is apparent in the fluid forcing frequency responses that the third harmonics of
 $f_{C_{y}}^{\ast }$
and
 $f_{C_{v}}^{\ast }$
gradually become stronger than their first harmonics in this regime, indicating that the vortex shedding frequency becomes higher than that of the body oscillation. Meanwhile, significant changes are also observed in the phases of the fluid forcing components and the wake mode, which will be detailed in § 3.1.2.
For higher reduced velocities of
 $U^{\ast }>12.5$
, the body oscillation becomes clearly dominated by a galloping response. In this regime, the
 $A_{10}^{\ast }$
amplitude response grows at a faster rate than seen in the VIV-dominated regime. The maximum
 $A_{10}^{\ast }$
value in the present study is observed to be
 $4.7$
at the highest reduced velocity tested (
 $U^{\ast }=20$
). Correspondingly, the transverse lift and the vortex force frequencies are dominated by their third harmonic, which are three times the body vibration frequency that remains consistently close to
 $f_{y}^{\ast }=1$
for the entire range. This body vibration frequency is much higher than that observed for transverse galloping of a square cylinder reported previously by Bearman et al. (Reference Bearman, Gartshore, Maull and Parkinson1987), Nemes et al. (Reference Nemes, Zhao, Lo Jacono and Sheridan2012) and Zhao et al. (Reference Zhao, Leontini, Lo Jacono and Sheridan2014b
). A further test with decreasing
 $U^{\ast }$
(see figure 3
a) shows that the amplitude response is identical to the increasing
 $U^{\ast }$
case, indicating that there is no hysteresis observed for this orientation. Again, this situation is significantly different from that observed for square cylinders, which have been reported to show a hysteretic response due to shear layer reattachment onto the body (see Luo, Chew & Ng Reference Luo, Chew and Ng2003). Thus, the difference could be attributable to the difference in the afterbody geometry. The overall response is also contrary to previous studies with high mass and damping ratios (e.g.
 $m^{\ast }\approx 620$
and
 $\unicode[STIX]{x1D701}\approx 0.01$
) by Weaver & Veljkovic (Reference Weaver and Veljkovic2005), who observed no galloping and only a very narrow VIV resonance regime with a peak amplitude of
 ${\approx}0.09D$
at
 $U^{\ast }\approx 1/St$
, consistent with the findings by Novak & Tanaka (Reference Novak and Tanaka1974). They concluded that a D-section cylinder was a ‘hard’ oscillator that would not gallop from rest, while the present results have clearly demonstrated that a D-section of low mass and damping ratios is a ‘soft’ oscillator that can gallop from rest. To further verify this, the cylinder was physically held and then released in the
 $U^{\ast }$
range corresponding to galloping, noting that cylinder oscillations quickly reached the amplitude shown in figure 3.
3.1.2 The fluid forces and wake modes
The fluid–structure interaction is further characterised by examining the fluid forces and the wake structure in this subsection. Figure 4 shows the variation of the root-mean-square (r.m.s.) coefficients of the fluid forces and also the fluid phasing, along with the
 $A_{10}^{\ast }$
response for reference. In addition, four wake mode regimes are identified based on spot PIV measurements.
The fluid forces and the fluid forcing phases (in degrees) as a function of the reduced velocity for
 $\unicode[STIX]{x1D6FC}=0^{\circ }$
. The
 $\times$
markers indicate the PIV measurement locations, and the boundaries of wake modes are designated by the vertical dashed lines.

Sample time traces of the cylinder vibration for
 $\unicode[STIX]{x1D6FC}=0^{\circ }$
at different reduced velocities: (a)
 $U^{\ast }=3.4$
, (b)
 $U^{\ast }=4.0$
, (c)
 $U^{\ast }=8.0$
and (d)
 $U^{\ast }=13.0$
. Note that
 $C_{v}$
and
 $\unicode[STIX]{x1D719}_{v}$
(in degrees) are indicated by dashed lines correspondingly in the plots. The horizontal axis shows time scaled by the natural system period, i.e.
 $\unicode[STIX]{x1D70F}=tf_{nw}$
.

Phase-averaged vorticity contours showing 2S patterns at
 $U^{\ast }=3.4$
and
 $4.0$
in columns (a) and (b), respectively, and 2P
 $_{o}$
pattern at
 $U^{\ast }=5.0$
in column
 $(c)$
, for
 $\unicode[STIX]{x1D6FC}=0^{\circ }$
. The normalised vorticity range shown here is
 $\unicode[STIX]{x1D714}^{\ast }\in [-4,4]$
. In each plot, the vertical line between two horizontal bars in grey represents the peak-to-peak vibration amplitude. For the full oscillation cycles, see supplementary movies 1–3, available at https://doi.org/10.1017/jfm.2018.501.

Phase-averaged vorticity contours showing 2T
 $_{o}$
mode observed at
 $U^{\ast }=6.0$
,
 $6.3$
and
 $8.0$
in columns (a), (b) and (c), respectively, for
 $\unicode[STIX]{x1D6FC}=0^{\circ }$
. See supplementary movies 4–6 for the full oscillation cycles. For more details, refer to the caption of figure 6.

There are a number of characteristics to note about the parametric variations. From figure 4(b), it is clear that, when the lock-in occurs at
 $U^{\ast }=3.0$
, both
 $C_{y}^{rms}$
and
 $C_{v}^{rms}$
start to increase rapidly to reach their peak value (
 $C_{y}^{rms}\simeq 1.70$
and
 $C_{v}^{rms}\simeq 1.15$
) at
 $U^{\ast }=4.0$
, and the fluid forcing phases,
 $\unicode[STIX]{x1D719}_{t}$
and
 $\unicode[STIX]{x1D719}_{v}$
, remain consistently at
 $0^{\circ }$
over this
 $U^{\ast }$
range. As expected, the fluid forcing is highly periodic, as demonstrated by sample time traces at
 $U^{\ast }=3.4$
and
 $U^{\ast }=4.0$
in figure 5(a,b). It should be noted that the time trace profiles of
 $C_{y}$
and
 $C_{v}$
are deformed slightly from a pure sinusoid (e.g. the body motion profile), which is indicative of the existence of a higher harmonic frequency component, consistent with the frequency response shown in figure 3(b,c). Correspondingly, the vortex shedding mode is found to be the 2S mode in this
 $U^{\ast }$
range, which consists of two opposite-signed single vortices shed per body oscillation cycle. To illustrate this wake mode, figure 6(a,b) presents two selected phase-averaged vorticity plots for these two
 $U^{\ast }$
values, showing that a positive (anticlockwise in red) vortex is shed in the first cycle as the body moves upwards towards its top position, and, symmetrically, a negative (clockwise in blue) vortex is shed near the body’s bottom position in the second half-cycle. Further increasing the reduced velocity sees a transition in the wake mode to the 2P
 $_{o}$
mode. This occurs in the narrow range of
 $5.0\leqslant U^{\ast }<5.6$
. As shown in figure 6(c), this wake mode consists of two pairs of opposite-signed vortices shed per cycle, in which one vortex appears to be relatively much weaker than the other of the pair (see Morse & Williamson Reference Morse and Williamson2009; Zhao et al.
Reference Zhao, Leontini, Lo Jacono and Sheridan2014a
). Associated with the appearance of this wake mode, while the total phase remains stable at
 $0^{\circ }$
, the vortex phase undergoes a transition from
 $0^{\circ }$
to
 $180^{\circ }$
.
Phase-averaged vorticity contours showing the evolution of the 2T mode at
 $U^{\ast }=12.0$
for
 $\unicode[STIX]{x1D6FC}=0^{\circ }$
. See supplementary movie
 $7$
for the full oscillation cycle. For more details, refer to the caption for figure 6.

The total phase jumps abruptly from
 $0^{\circ }$
to approximately
 $180^{\circ }$
at
 $U^{\ast }=6.0$
, and remains there up to
 $U^{\ast }=10.0$
. This is consistent with the phase relationships seen for the lower branch of VIV of a circular cylinder, indicating that this oscillation range remains VIV-dominated.
To demonstrate the vibrational dynamics, figure 5(c) shows sample time traces of the cylinder displacement and the fluid forcing components at
 $U^{\ast }=8.0$
. Clearly, both
 $C_{y}$
and
 $C_{v}$
are out of phase with the cylinder motion, despite exhibiting secondary peaks in their profiles due to the presence of harmonic frequencies. Interestingly, the wake mode in this regime is found to be a 2T
 $_{o}$
mode consisting of two triplets (T) of vortices shed per cycle. Note that two opposite-signed vortices in each triplet are relatively much weaker than the remaining one, which has led to this mode being named 2T
 $_{(o)}$
. To illustrate this, figure 7 presents the phase-averaged vorticity contours measured at
 $U^{\ast }=6.0$
,
 $6.3$
and
 $8.0$
in columns
 $(a{-}c)$
, respectively. As shown, at
 $U^{\ast }=6.0$
, two anticlockwise vortices (I and II) are shed around the equilibrium position as the cylinder moves upwards (figure 7
ai), and then one clockwise vortex (III in figure 7
aii) is being formed from the elongated upper shear during the cylinder’s movement towards its maximum position. On the other hand, the secondary (weak) vortex II merges quickly with the primary vortex I as it moves downstream. Symmetrically, in the second half of the cycle when the cylinder moves downwards, another triplet of vortices with opposite signs to those in the first half-cycle is shed. As
 $U^{\ast }$
is increased, the same-signed vortices (i.e. I and II, IV and V) tend to be separated due to the interaction with the opposite-signed shear layer in each half-cycle. This can be seen in the case of
 $U^{\ast }=8.0$
, where vortices I and II are clearly separated by the influence of the shear layer forming from the top of the cylinder, and then vortex I dissipates very quickly. From these results, the 2T
 $_{o}$
mode in this regime is in accordance with the frequency responses in figure 3 in the sense that the third harmonic frequency component in
 $f_{C_{y}}^{\ast }$
and
 $f_{C_{v}}^{\ast }$
can be attributed to the shedding of three vortices per half oscillation cycle.
When
 $U^{\ast }$
is further increased into the transition regime, the third harmonic of
 $f_{C_{y}}^{\ast }$
and
 $f_{C_{v}}^{\ast }$
tends to become stronger, resulting in a gradual decreasing trend in both
 $\unicode[STIX]{x1D719}_{t}$
and
 $\unicode[STIX]{x1D719}_{v}$
. Correspondingly, a well-defined 2T mode is observed in this regime. As illustrated by the phase-averaged vorticity measurements at
 $U^{\ast }=12.0$
shown in figure 8, a triplet of vortices is shed in the first half-cycle, noting that the two anticlockwise vortices I and III are clearly separated by the opposite-signed vortex II. Different from the 2T
 $_{o}$
mode, these vortices appear to be relatively even in strength, and also they are shed in a different order, i.e. the clockwise vortex is shed second.
After the transition regime, the most energetic frequency components of the total and vortex forces switch to their third harmonics at
 $3f_{nw}$
, while the cylinder oscillation frequency remains close to
 $f_{nw}$
. From sample time traces at
 $U^{\ast }=13.0$
shown in figure 4(d), it is evident that both
 $C_{y}$
and
 $C_{v}$
vary with the primary frequency much higher than that of the cylinder oscillation. As a result, the instantaneous phases exhibit ‘slipping’ behaviour periodically through
 $360^{\circ }$
as time varies. On the other hand, it is observed via spot PIV measurements that the wake mode still remains the main pattern of the 2T mode but with elongated shear layers breaking into coalescences of small vortices, as shown in figure 9 for
 $U^{\ast }=13.0$
. Thus, this mode is named 2T-C. Although both
 $f_{C_{y}}^{\ast }$
and
 $f_{C_{y}}^{\ast }$
exhibit harmonic lock-in, the vortex shedding no longer synchronises with the cylinder vibration. It therefore can be concluded that the vibration amplitude growth with increasing flow velocity in this regime is due to the galloping instability.
Phase-averaged vorticity contours showing the evolution of 2T-C mode at
 $U^{\ast }=13.0$
for
 $\unicode[STIX]{x1D6FC}=0^{\circ }$
. See supplementary movie
 $8$
for the full oscillation cycle. For more details, refer to the caption of figure 6.

The amplitude and the logarithmic-scale normalised frequency PSD contours as a function of the reduced velocity for the case of
 $\unicode[STIX]{x1D6FC}=180^{\circ }$
. In (a): ♢, measurements with increasing
 $U^{\ast }$
; ♦, measurements with decreasing
 $U^{\ast }$
. The lock-in region is highlighted by light grey area in (a), and bounded by vertical dashed lines in (b–e).

3.2 VIV response at
$\unicode[STIX]{x1D6FC}=180^{\circ }$

3.2.1 Amplitude and frequency responses
For
 $\unicode[STIX]{x1D6FC}=180^{\circ }$
, the reverse D-section configuration, in figure 10, the vibration response in general exhibits pure VIV features. At the low reduced velocities of
 $U^{\ast }<3.6$
, the oscillation amplitudes remain at extremely low values, and the dominant oscillation frequency follows the trend of the vortex shedding frequency. As the reduced velocity is further increased to
 $U^{\ast }=3.6$
, the onset of lock-in occurs, and the body oscillations become highly periodic, with the frequency matching the natural frequency of the system, namely
 $f_{y}^{\ast }=1$
. Associated with the onset of lock-in, the amplitude response experiences an initial jump to
 $A_{10}^{\ast }=0.17$
, and then a secondary sharp jump to
 $A_{10}^{\ast }=0.36$
at
 $U^{\ast }=3.8$
. As shown in figure 10(a), there exists minor hysteresis in these two jumps. As the reduced velocity is further increased, the amplitude response increases gradually to reach a peak value of
 $A^{\ast }=0.72$
at
 $U^{\ast }=5.9$
. After this, it drops abruptly to
 $A_{10}^{\ast }=0.65$
and then follows a gradual decreasing trend to
 $A_{10}^{\ast }=0.55$
at
 $U^{\ast }=6.5$
, prior to a sharp drop into a desynchronisation region for higher
 $U^{\ast }$
values. Notable hysteresis is observed in the transition between the lock-in and desynchronisation regions.
Interestingly, on the other hand, the frequency responses in figure 10(b,c) show that, while the
 $f_{y}^{\ast }$
response appears to be highly similar to that of a circular cylinder undergoing VIV (e.g. Zhao et al.
Reference Zhao, Leontini, Lo Jacono and Sheridan2014b
; Wong et al.
Reference Wong, Zhao, Lo Jacono, Thompson and Sheridan2017), the fluid force components exhibit considerable high harmonic frequency content in the lock-in region; this is significantly different from the circular cylinder case. However, the overall amplitude and frequency responses of the reverse D-section are consistent with previously observed VIV features for other geometries over the
 $U^{\ast }$
range tested.
The results presented here for the reverse D-section cylinder, showing a strong VIV response, are quite different from the non-response found by Brooks (Reference Brooks1960), which has been often cited since. A probable explanation might be the three orders of magnitude difference in mass ratios between the high-mass-ratio cylinder used in air by Brooks (Reference Brooks1960) and the relatively low-mass-ratio cylinder used in water in the current experiment.
Indeed, the influence of the mass-damping coefficient on the peak amplitude for VIV has been documented by a number of authors, including Griffin, Skop & Koopmann (Reference Griffin, Skop and Koopmann1973), Sarpkaya (Reference Sarpkaya2004), Govardhan & Williamson (Reference Govardhan and Williamson2006) and Soti et al. (Reference Soti, Zhao, Thompson, Sheridan and Bhardwaj2018), and is summarised by the modified Griffin plot of Govardhan & Williamson (Reference Govardhan and Williamson2006) (see their figure 14). This plots the peak VIV amplitude as a function of mass-damping ratio, and takes account of Reynolds-number variations as well. It shows that a universal collapse of different datasets, for different mass and damping ratios, and Reynolds numbers, is possible. Broadly, the fit shows that close to the peak amplitude is observed when the mass-damping parameter,
 $\unicode[STIX]{x1D709}=(m^{\ast }+C_{A})\unicode[STIX]{x1D701}$
, is less than 0.1, while the response amplitude drops to negligible values for
 $\unicode[STIX]{x1D709}\gtrsim 1$
. For the case here, the mass-damping ratio is approximately
 $10^{-2}$
, resulting in a peak amplitude close to the undamped result. On the other hand, increasing the mass ratio by two orders of magnitude while keeping the same damping would give a mass-damping ratio of
 ${\sim}1$
, so that the expected VIV oscillations should be negligible, as typically observed in experiments conducted with air as the working fluid.
3.2.2 The fluid forcing and wake structures
To further characterise the dynamic response of the reverse D-section, figure 11 shows the amplitude response, fluid forces and phases as a function of
 $U^{\ast }$
, overlapped with a direct comparison against a circular cylinder (
 $D=25~\text{mm}$
) with the same mass ratio and a similar damping ratio of
 $\unicode[STIX]{x1D701}=1.38\times 10^{-3}$
.
The amplitude response, fluid forces and phases as a function of the reduced velocity for
 $\unicode[STIX]{x1D6FC}=180^{\circ }$
compared against a circular cylinder with the same mass ratio. The
 $\times$
markers indicate the PIV measurement locations. Note that
 $\unicode[STIX]{x1D719}_{t}$
and
 $\unicode[STIX]{x1D719}_{v}$
are in degrees. The vertical lines represent the boundaries of the initial branch (IB), upper branch (UB), lower branch (LB) and desynchronisation regions of the circular cylinder case.
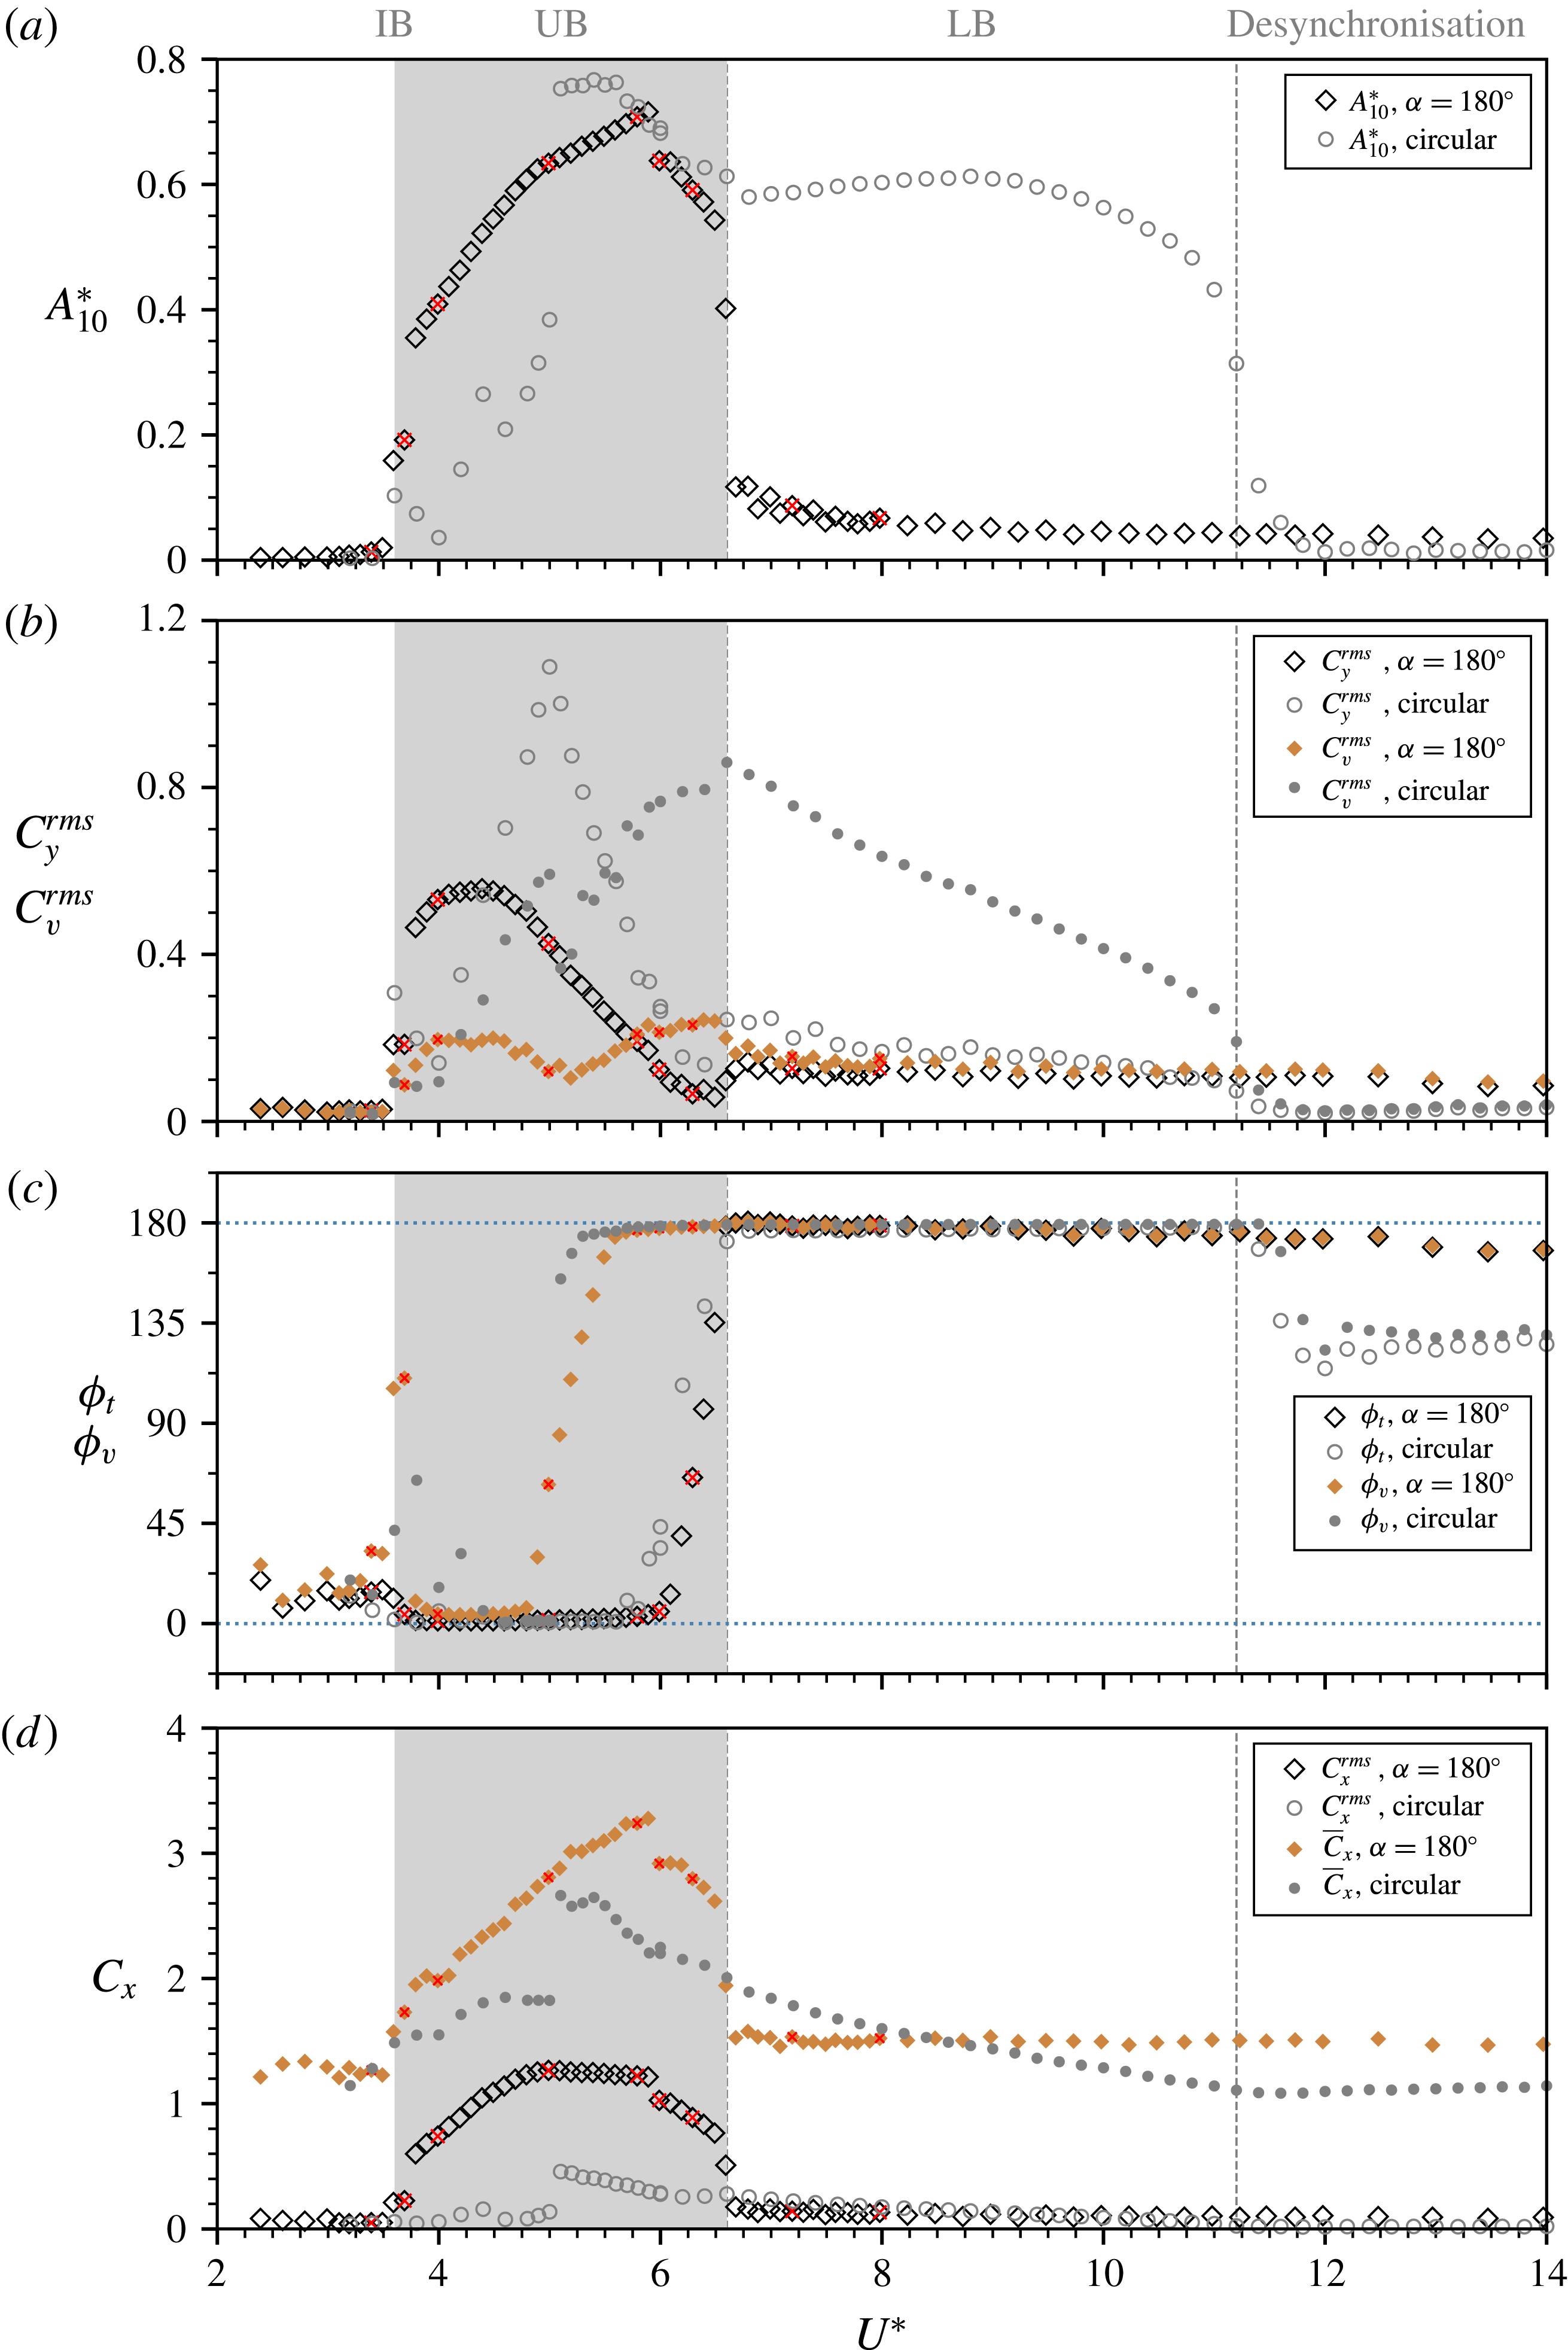
In this comparison, there are some remarkable similarities in several aspects between these two cases. At low reduced velocities, the onset of significant vibration occurs similarly from
 $U^{\ast }=3.6$
. Although lock-in occurs much earlier than the circular cylinder case, the reverse D-section sees its
 $A_{10}^{\ast }$
response in an increasing trend similar to that of the initial branch of the circular cylinder case for
 $3.6<U^{\ast }<5.0$
. The peak amplitude (
 $A_{10}^{\ast }\simeq 0.72$
) of the reverse D-section is found to be surprisingly comparable to that (
 $A_{10}^{\ast }\simeq 0.77$
) of the circular cylinder case, and they occur at similar reduced velocities near the middle of the upper branch (UB) of the circular cylinder case. Moreover, similar trends in variation with
 $U^{\ast }$
are seen in the fluid force coefficients (figure 11
b,d). Of further interest are the similar jumps from
 $0^{\circ }$
to
 $180^{\circ }$
in both
 $\unicode[STIX]{x1D719}_{t}$
(at
 $U^{\ast }\approx 5.0$
) and
 $\unicode[STIX]{x1D719}_{v}$
(at
 $U^{\ast }=6.6$
), which are indicative of pure VIV response. Furthermore, the dynamic response in the desynchronisation regime also appears to be highly similar to that of the circular cylinder case. From this comparison, it is evident that the reverse D-section can exhibit substantial vibration over a significant
 $U^{\ast }$
range where the initial and upper branches occur in the circular cylinder case. However, due to the lack of an afterbody, the vibration amplitude is attenuated by desynchronised fluid–structure interaction to very low values (
 $A_{10}^{\ast }<0.1$
) in the regime where the circular cylinder exhibits a lower branch; in other words, the lower branch of a circular cylinder is strongly related to its afterbody.
Perhaps surprisingly, the vortex shedding mode seen in all PIV measurements indicated in figure 11 was found to be 2S. This is unexpected, as previous studies on circular cylinders (e.g. Govardhan & Williamson Reference Govardhan and Williamson2000; Zhao et al.
Reference Zhao, Leontini, Lo Jacono and Sheridan2014a
) have shown that different wake mode transitions are associated with jumps in
 $\unicode[STIX]{x1D719}_{t}$
and
 $\unicode[STIX]{x1D719}_{v}$
from
 $0^{\circ }$
to
 $180^{\circ }$
. To clarify the present findings, figure 12 shows sample time traces at four selected locations from different vibration regimes:
 $(a)$
 $U^{\ast }=3.4$
, where extremely small vibration amplitude is observed and both
 $\unicode[STIX]{x1D719}_{t}$
and
 $\unicode[STIX]{x1D719}_{v}$
fluctuate around
 $0^{\circ }$
for most of the time duration;
 $(b)$
 $U^{\ast }=4.0$
in the early lock-in stage, where significant vibration is encountered, and with both
 $\unicode[STIX]{x1D719}_{t}$
and
 $\unicode[STIX]{x1D719}_{v}$
still remaining around
 $0^{\circ }$
;
 $(c)$
 $U^{\ast }=6.0$
, where large oscillations are encountered with
 $\unicode[STIX]{x1D719}_{t}$
fluctuating around
 $0^{\circ }$
and
 $\unicode[STIX]{x1D719}_{v}$
fluctuating around
 $180^{\circ }$
; and
 $(d)$
 $U^{\ast }=8.0$
in the desynchronisation region, where the vibration amplitude is attenuated to very low values with both
 $\unicode[STIX]{x1D719}_{t}$
and
 $\unicode[STIX]{x1D719}_{v}$
fluctuating slightly around
 $180^{\circ }$
. Figure 13 presents the observed 2S wake mode at selected reduced velocities
 $U^{\ast }=4.0$
,
 $6.0$
and
 $8.0$
. As can be seen, vortices are shed directly from the trailing edges of the D-section at both maximum and minimum positions (see corresponding supplementary movies for full vortex shedding cycles). These results suggest that the afterbody plays an important role affecting the wake structure. They show that the vortex shedding mode may not necessarily be related to
 $\unicode[STIX]{x1D719}_{t}$
and
 $\unicode[STIX]{x1D719}_{v}$
, as for VIV of circular and ‘diamond-shaped’ (square cross-section placed at
 $45^{\circ }$
flow incidence angle) cylinders that possess an afterbody (see Zhao et al.
Reference Zhao, Leontini, Lo Jacono and Sheridan2014a
,Reference Zhao, Leontini, Lo Jacono and Sheridan
b
).
Sample time traces of the cylinder vibration for
 $\unicode[STIX]{x1D6FC}=180^{\circ }$
at different reduced velocities: (a)
 $U^{\ast }=3.4$
, (b)
 $U^{\ast }=4.0$
, (c)
 $U^{\ast }=6.0$
and (d)
 $U^{\ast }=8.0$
. For more details, see the caption of figure 5.

Phase-averaged vorticity contours showing 2S patterns at
 $U^{\ast }=4.0$
,
 $6.0$
and
 $8.0$
in columns (a), (b) and (c), respectively, for
 $\unicode[STIX]{x1D6FC}=180^{\circ }$
. For more details, refer to the caption of figure 6. See supplementary movies 9–11 for the full oscillation cycles.

3.2.3 Analysis of galloping instability using quasi-steady approach
In this section, the potential for galloping based on quasi-steady theory is assessed for the two
 $\unicode[STIX]{x1D6FC}$
cases by evaluating the transverse lift force acting on the ‘static’ body with varying relative angle of attack (
 $\unicode[STIX]{x1D6FC}^{\prime }$
). This quasi-steady approach is based on the assumption that the fluid force is in phase with the body velocity and the instantaneous driving force acting on the moving body is nearly equal to the static force evaluated at the instantaneous angle of flow incidence (Naudascher & Rockwell Reference Naudascher and Rockwell2005).
The mean lift and drag coefficients as a function of the relative angle of attack in (a,b) and the
 $\unicode[STIX]{x1D6FD}$
variation in (c) for the orientation case of
 $\unicode[STIX]{x1D6FC}=0^{\circ }$
at
 $Re=4880$
. The solid lines in (a,b) represent the third-order polynomial fitting curves. In (c), the dashed line represents
 $|\unicode[STIX]{x2202}C_{L}/\unicode[STIX]{x2202}\unicode[STIX]{x1D6FC}^{\prime }|$
. Note that
 $\unicode[STIX]{x1D6FC}^{\prime }$
is increased in the clockwise direction.

The mean lift and drag coefficients as a function of the relative angle of attack in (a,b) and the
 $\unicode[STIX]{x1D6FD}$
variation in (c) for the orientation case of
 $\unicode[STIX]{x1D6FC}=0^{\circ }$
at
 $Re=4880$
. For more details, see the caption of figure 14.

Based on (2.1), the governing equation of the cylinder motion can be rewritten as
 $$\begin{eqnarray}m\ddot{y} +2m\unicode[STIX]{x1D701}_{n}\unicode[STIX]{x1D714}_{n}{\dot{y}}+m\unicode[STIX]{x1D714}_{n}^{2}y={\textstyle \frac{1}{2}}\unicode[STIX]{x1D70C}U^{2}DLC_{y},\end{eqnarray}$$
where
 $\unicode[STIX]{x1D701}_{n}$
is the structural damping ratio and
 $\unicode[STIX]{x1D714}_{n}=2\unicode[STIX]{x03C0}f_{n}$
the natural angular frequency of the system in vacuum. (Note that these parameters are assumed to be very nearly equal to those determined through free-decay test in air in the present study.) According to the quasi-steady theory developed by Parkinson & Smith (Reference Parkinson and Smith1964), the driving force can be expressed as
 $$\begin{eqnarray}C_{y}=\mathop{\sum }_{j=1}^{\infty }a_{j}\left(\frac{{\dot{y}}}{U}\right)^{j}=a_{1}\frac{{\dot{y}}}{U}+a_{2}\left(\frac{{\dot{y}}}{U}\right)^{2}+a_{3}\left(\frac{{\dot{y}}}{U}\right)^{3}+\cdots \,,\end{eqnarray}$$
where
 $a_{j}$
is the
 $j$
th polynomial coefficient. By considering only small-amplitude disturbances to the system (Blevins Reference Blevins1990; Naudascher & Rockwell Reference Naudascher and Rockwell2005), equation (3.1) can be approximated by
 $$\begin{eqnarray}C_{y}=a_{1}\frac{{\dot{y}}}{U}.\end{eqnarray}$$
Substituting (3.3) for (3.1) gives
 $$\begin{eqnarray}\ddot{y} +\left(2\unicode[STIX]{x1D701}_{n}\unicode[STIX]{x1D714}_{n}-\frac{1}{2m}\unicode[STIX]{x1D70C}UDLa_{1}\right){\dot{y}}+\unicode[STIX]{x1D714}_{n}^{2}y=0.\end{eqnarray}$$
The term in parentheses in this equation is the net damping factor as the sum of the structural and aerodynamic components. The system is stable if the net damping factor is larger than zero. Thus, the critical flow velocity for possible onset of galloping can be evaluated by
 $$\begin{eqnarray}U_{cr}=\frac{4m\unicode[STIX]{x1D701}_{n}\unicode[STIX]{x1D714}_{n}}{\unicode[STIX]{x1D70C}DLa_{1}}=\frac{4m\unicode[STIX]{x1D701}_{n}(2\unicode[STIX]{x03C0}f_{na})}{\unicode[STIX]{x1D70C}DLa_{1}},\end{eqnarray}$$
and the critical reduced velocity by
 $$\begin{eqnarray}U_{cr}^{\ast }=\frac{U_{cr}}{f_{nw}D}=\frac{4m\unicode[STIX]{x1D701}_{n}(2\unicode[STIX]{x03C0}f_{na})}{\unicode[STIX]{x1D70C}DLa_{1}(f_{nw}D)}=\frac{\unicode[STIX]{x03C0}^{2}m^{\ast }\unicode[STIX]{x1D701}_{n}}{a_{1}}\left(\frac{f_{na}}{f_{nw}}\right).\end{eqnarray}$$
According to the criterion of transverse galloping given by Den Hartog (Reference Den Hartog1932, Reference Den Hartog1956), a system with no structural damping is potentially unstable if
 $$\begin{eqnarray}\unicode[STIX]{x1D6FD}=\frac{\unicode[STIX]{x2202}C_{y}}{\unicode[STIX]{x2202}\unicode[STIX]{x1D6FC}^{\prime }}=-\frac{\unicode[STIX]{x2202}C_{L}}{\unicode[STIX]{x2202}\unicode[STIX]{x1D6FC}^{\prime }}-C_{D}>0,\end{eqnarray}$$
where
 $C_{L}$
is the lift coefficient acting perpendicularly to the relative flow (
 $U_{rel}=\sqrt{U^{2}+{\dot{y}}^{2}}$
) and
 $C_{D}$
is the drag coefficient parallel to the relative flow. Figures 14 and 15 show the mean lift (
 $\overline{C}_{L}$
) and drag (
 $\overline{C}_{D}$
) coefficients as a function of the relative angle of attack
 $\unicode[STIX]{x1D6FC}^{\prime }$
, together with the
 $\unicode[STIX]{x1D6FD}=\unicode[STIX]{x2202}C_{y}/\unicode[STIX]{x2202}\unicode[STIX]{x1D6FC}^{\prime }$
variation for the two orientation cases of
 $\unicode[STIX]{x1D6FC}=0^{\circ }$
and
 $180^{\circ }$
, respectively. Note that the measurements were conducted at a representative Reynolds number
 $Re=4880$
(corresponding to
 $U^{\ast }=10$
close to the middle of the
 $U^{\ast }$
range tested in the FIV cases). The polynomial coefficient
 $a_{1}$
in (3.2) is given by
 $a_{1}=\unicode[STIX]{x1D6FD}|_{\unicode[STIX]{x1D6FC}^{\prime }=0^{\circ }}$
. Thus, in theory,
 $U_{cr}^{\ast }$
can be determined using (3.6) for the two
 $\unicode[STIX]{x1D6FC}$
cases.
As can be seen from figure 14,
 $a_{1}=\unicode[STIX]{x1D6FD}|_{\unicode[STIX]{x1D6FC}^{\prime }=0^{\circ }}\simeq 0.13$
is slightly positive, which implies that the D-section is potentially susceptible to galloping with respect to soft excitation (from rest) in the present study, as has been confirmed by the structural vibration response shown in § 3.1. Note that there are some differences between measured values of
 $\unicode[STIX]{x1D6FD}|_{\unicode[STIX]{x1D6FC}^{\prime }=0^{\circ }}$
previously reported in the literature. For example, Harris (Reference Harris1948) found that the D-section was unstable, Cheers (Reference Cheers1950) found that
 $\unicode[STIX]{x1D6FD}$
was small and negative, while Brooks (Reference Brooks1960) reported that
 $\unicode[STIX]{x1D6FD}$
remained very close to zero for
 $\unicode[STIX]{x1D6FC}^{\prime }$
up to
 $25^{\circ }$
, suggesting that Den Hartog’s criterion was not satisfied and thus the D-section should not gallop from rest. The value of
 $\unicode[STIX]{x1D6FD}|_{\unicode[STIX]{x1D6FC}^{\prime }=0^{\circ }}$
is also slightly different from that of previous studies conducted at higher Reynolds numbers (e.g.
 $Re=9\times 10^{4}$
in Novak & Tanaka (Reference Novak and Tanaka1974), and
 $Re=8.2\times 10^{4}$
in Weaver & Veljkovic (Reference Weaver and Veljkovic2005)) where the
 $C_{y}$
versus
 $\unicode[STIX]{x1D6FC}^{\prime }$
curve exhibited a zero or very small value with a negative slope at
 $\unicode[STIX]{x1D6FC}^{\prime }=0^{\circ }$
, and an initial amplitude was thereby required to trigger a hard galloping response. These discrepancies are thus likely to be mostly attributable to a difference in
 $Re$
, although other factors (e.g. the flow turbulence level) may also play a role. In any case,
 $\unicode[STIX]{x1D6FD}$
is a small difference between two relatively much larger terms: the lift curve slope (
 ${\sim}-2.7$
) and the damping due to drag (
 ${\sim}2.6$
). Thus, small variations in either of these terms will alter whether soft galloping will occur according to the Den Hartog criterion.
On the other hand, given
 $a_{1}\simeq 0.13$
from figure 14, the (critical) onset reduced velocity for galloping response is evaluated using (3.6) to be
 $U_{cr}^{\ast }\simeq 0.73$
. Apparently, this
 $U_{cr}^{\ast }$
value is much lower than the reduced velocity expected for VIV resonance,
 $U_{r}^{\ast }=1/St\simeq 7.1$
. In fact, negligible structural vibration is observed prior to the VIV resonance occurring at
 $U^{\ast }=3.0$
(or
 $0.42U_{r}^{\ast }$
) in the present experiments. This phenomenon seems to be due to the so-called ‘quenching effect’ of the vortex system on the galloping instability as explained by Corless & Parkinson (Reference Corless and Parkinson1988). However, the galloping-dominated response observed in the experiments occurs at reduced velocities higher than
 $1.76U_{r}^{\ast }$
. Of course, at very low
 $U^{\ast }$
, the vortex shedding period is very long compared with the natural system oscillation period, so the use of the mean lift variation with incidence angle derived from averaging the effect of shedding over many cycles is not a reasonable approximation. One would expect that this approximation should only become reasonable well beyond the resonant reduced velocity of
 $U^{\ast }=1/St=7.1$
. Interestingly, in this case, the lift curve slope remains strongly negative to high incidence angles, which is also qualitatively consistent with large galloping oscillations.
For a particular
 $U^{\ast }$
, assuming that the body is oscillating at the natural frequency, the amplitude variation can be approximated as a sinusoidal variation, i.e.
 $$\begin{eqnarray}y/D=(A/D)\sin (2\unicode[STIX]{x03C0}f_{nw}t).\end{eqnarray}$$
Differentiating this gives
 $$\begin{eqnarray}\frac{{\dot{y}}}{U}~(=\tan \unicode[STIX]{x1D6FC}^{\prime })=\frac{2\unicode[STIX]{x03C0}(A/D)Df_{nw}}{U}\cos (2\unicode[STIX]{x03C0}f_{nw}t)\quad \Rightarrow \quad \unicode[STIX]{x1D6FC}_{max}^{\prime }=\tan ^{-1}\left(\frac{2\unicode[STIX]{x03C0}A^{\ast }}{U^{\ast }}\right).\end{eqnarray}$$
Taking the value of
 $A/D=4.7$
at
 $U^{\ast }=20$
, where the body is still undergoing strong galloping, gives
 $\unicode[STIX]{x1D6FC}_{max}^{\prime }\simeq 55^{\circ }$
, i.e. as the body moves past its equilibrium position, the flow incidence angle seen by the body is
 $55^{\circ }$
. This indicates that galloping does occur over a wide range of angles of attack, extending a long way from
 $\unicode[STIX]{x1D6FC}^{\prime }=0^{\circ }$
.
For the reversed-D case of
 $\unicode[STIX]{x1D6FC}=180^{\circ }$
shown in figure 15,
 $\unicode[STIX]{x1D6FD}$
is found to be
 $-1.81$
at
 $\unicode[STIX]{x1D6FC}^{\prime }=0$
, which is considerably lower than the reported value of
 $-1.15$
for high-
 $Re$
wind-tunnel experiments (Cheers Reference Cheers1950), and it remains significantly negative over the
 $\unicode[STIX]{x1D6FC}^{\prime }$
range tested. Both the lift slope and the drag contribute to damping in this case. This implies that the reversed D-section is not susceptible to a soft galloping instability, which is consistent with the observed response over the entire reduced velocity range investigated.
In summary, the quasi-steady theory predicts that soft galloping will occur for the D-section but not the reversed D-section, consistent with the experimental results. Perhaps also of interest is that the critical reduced velocity for galloping is proportional to
 $m^{\ast }$
through (3.6), hence the onset values for galloping in air will typically be very much greater than the calculated values here (for water), placing the onset of galloping beyond the
 $U^{\ast }$
range for VIV. This may result in cleaner physical behaviour with a greater separation between the underlying physical processes causing the different forms of FIV.
4 Conclusions
The transverse flow-induced vibration of a D-section cylinder with low mass and damping ratios has been experimentally investigated at two different angles of attack,
 $\unicode[STIX]{x1D6FC}=0^{\circ }$
and
 $180^{\circ }$
, corresponding to forward- and reverse-facing D-sections, over a reduced velocity range of
 $2\leqslant U^{\ast }\leqslant 20$
.
At
 $\unicode[STIX]{x1D6FC}=0^{\circ }$
, the structural vibration response is dominated by VIV for
 $U^{\ast }\leqslant 10.0$
, while after a transition regime over
 $10<U^{\ast }<12.5$
it becomes galloping-dominated at higher
 $U^{\ast }$
values. The onset of VIV lock-in was observed to occur at
 $U^{\ast }=3.0$
, which was much lower than
 $U^{\ast }=1/St\simeq 7.1$
expected for the vortex shedding resonance. Interestingly, while the body oscillation frequency remained close to
 $f_{nw}$
, the exciting fluid forces
 $F_{y}$
and
 $F_{v}$
exhibited a third harmonic (
 $3f_{nw}$
), which tended to become stronger gradually as
 $U^{\ast }$
was increased in the VIV-dominated regime. Also, in this regime, the vortex shedding mode was found to undergo a transition from 2S to 2P
 $_{o}$
at
 $U^{\ast }=5.0$
, which was associated with a transition in
 $\unicode[STIX]{x1D719}_{v}$
from
 $0^{\circ }$
to
 $180^{\circ }$
, and then another transition from 2P
 $_{o}$
to 2T
 $_{o}$
at
 $U^{\ast }=5.6$
, which was associated with a transition in
 $\unicode[STIX]{x1D719}_{t}$
from
 $0^{\circ }$
to
 $180^{\circ }$
. As the body movement is opposed by the exciting fluid forces with
 $\unicode[STIX]{x1D719}_{t}$
and
 $\unicode[STIX]{x1D719}_{v}$
remaining at
 $180^{\circ }$
up to
 $U^{\ast }=10$
, galloping is prohibited and the FIV response is characterised as VIV over this
 $U^{\ast }$
range. In the VIV-galloping transition regime, the third harmonic frequency component of the transverse lift and the vortex force gradually overwhelmed their fundamental frequency components. As a result, both
 $\unicode[STIX]{x1D719}_{t}$
and
 $\unicode[STIX]{x1D719}_{v}$
were found to decrease gradually from
 $180^{\circ }$
. Strikingly, the vortex shedding was found to be in a clear 2T mode, consisting of two well-defined triplets of vortices shed per cycle.
In the galloping-dominated regime at higher reduced velocities, it was found that the dominant frequency content of the transverse lift and the vortex force switch to their third harmonics at
 $3f_{nw}$
, while the body oscillation frequency still remains at
 $f_{nw}$
. Meanwhile, the amplitude response growth with increasing
 $U^{\ast }$
is found to be faster than that in the VIV-dominated and transition regimes, noting that the peak amplitude observed is
 $A_{10}^{\ast }=4.7$
at the highest reduced velocity tested (
 $U^{\ast }=20$
). A further test with decreasing
 $U^{\ast }$
showed that there is no hysteresis in the vibration response, which is different from that previously reported for square cylinders, which exhibit a hysteretic amplitude response due to flow reattachment to their afterbodies. Furthermore, both measurements with increasing and decreasing
 $U^{\ast }$
revealed that the galloping response can be softly excited from rest, which is distinctly different from the hard galloping often reported in the literature that requires an initial triggering amplitude to occur at much higher Reynolds numbers and mass ratios.
For the reverse-facing D-section, with
 $\unicode[STIX]{x1D6FC}=180^{\circ }$
, the vibration response exhibits pure VIV features. By comparing directly against circular cylinder VIV with the same
 $m^{\ast }$
and a similar
 $\unicode[STIX]{x1D701}$
, it was found that the onset of significant vibration in the reverse D-section case occurs at a similar reduced velocity
 $U^{\ast }=3.6$
; the peak amplitude was observed to be
 $A_{10}^{\ast }=0.72$
, only approximately
 $6\,\%$
lower than that observed for the circular cylinder; also observed were remarkable similarities in the jumps of
 $\unicode[STIX]{x1D719}_{t}$
and
 $\unicode[STIX]{x1D719}_{v}$
from
 $0^{\circ }$
to
 $180^{\circ }$
. However, these jumps are not necessarily correlated with clear wake mode transitions, as variants of the 2S mode were found to persist across the entire
 $U^{\ast }$
range tested. This is different from the different modes observed for circular and diamond-shaped cylinders that possess an afterbody. Furthermore, the lock-in regime is somewhat narrower, only covering the reduced velocity range
 $3.6\leqslant U^{\ast }\leqslant 6.6$
, which corresponds to that covering the initial and upper branches of the circular cylinder case. This suggests that the lower branch of circular cylinder VIV is dependent on its afterbody. Of most significance, nevertheless, our study shows that an afterbody is not essential for the occurrence of significant-amplitude VIV, although it can play an important role affecting characteristics of the wake flow structure and the structural vibration response.
In terms of the flow physics for the VIV of a reverse D-section, the findings imply that, even though the oscillatory pressure forcing associated with the alternate shedding of vortices cannot contribute to the fluctuating lift through the straight surface of the reverse D-section, nevertheless, the longer-range pressure variation acting on the cross-stream-facing surfaces of the body (i.e. adjacent to the separation points) is still sufficient to cause VIV. It would be of further interest to investigate this aspect through numerical simulations and extended experiments.
The present results indicate that there exists a transition to a VIV–galloping response with variation of the angle of attack. This warrants further work to characterise the fluid–structure mechanisms and categorise FIV response regimes in the
 $U^{\ast }$
–
 $\unicode[STIX]{x1D6FC}$
parameter space.
Acknowledgements
The support from the Australian Research Council Discovery Project Grants DP150102879 and DP170100275 is gratefully acknowledged.
Supplementary movies
Supplementary movies are available at https://doi.org/10.1017/jfm.2018.501.



