Implications
The aim of this study was to assess the mitogenomic phylogeny and copy number in Chinese sheep. Although genetic diversity of domestic animals has been determined by the hypervariable region of mitogenome, these findings of our study will be helpful to understand the genetic diversity and mtDNA content in sheep.
Introduction
As one of the earliest domesticated animals, sheep (Ovis aries) play important roles in agriculture, economy, culture and even religion, and have been dispersed around the globe following patterns of human migration. Modern sheep are thought to descend from the Asian mouflon (Ovis orientalis), which was first domesticated in the Fertile Crescent ~8 to 11 000 years ago (Mason, Reference Mason1984). Ancient biological evidence based on demographic parameters suggests that the earliest domestication of cattle, sheep, goats and pigs occurred in the area spanning from Central Anatolia to north of the Zagros Mountains (Zeder, Reference Zeder2008). Later evidence suggests that the Mongolian Plateau region was acted as a ‘transportation hub’ for sheep migration in Asia (Lv et al., Reference Lv, Peng, Yang, Zhao, Li, Liu, Ma, Zhao, Yang, Wang, Li, Liu, Shen, Zhao, Hehua, Gorkhali, Farhad Vahidi, Muladno, Naqvi, Tabell, Iso-Touru, Bruford, Kantanen, Han and Li2015). Worldwide, as many as 1400 sheep breeds have been developed from their wild ancestors as a result of long-term natural and intense artificial selection.
Five maternal sheep lineages (A, B, C, D and E) have been identified through mitochondrial DNA (mtDNA) sequence analyses. Lineages A and B are the most common worldwide, while lineage C is distributed in Asia, the Fertile Crescent, Caucasus, and the Iberian Peninsula (Pedrosa et al., Reference Pedrosa, Uzun, Arranz, Gutierrez-Gil, San Primitivo and Bayon2005; Meadows et al., Reference Meadows, Cemal, Karaca, Gootwine and Kijas2007). To date, lineages D and E, which have only recently been identified, have only been found in sheep from Caucasus and Turkey (Meadows et al., Reference Meadows, Cemal, Karaca, Gootwine and Kijas2007). Previous studies have shown that the divergence times of the five major maternal lineages are much earlier than the domestication period that suggested by the ancient biological evidence (Zeder, Reference Zeder2008). For example, a recent study based on 12 protein-coding genes reported divergence times of about 0.590±0.17 Ma between lineages A and B and 0.26±0.09 Ma between lineages C and E (Meadows et al., Reference Meadows, Hiendleder and Kijas2011). Several other regions of the mitogenome have also been used to infer the evolutionary process of sheep, including partial segments of the control region and the cytochrome B gene (Pedrosa et al., Reference Pedrosa, Uzun, Arranz, Gutierrez-Gil, San Primitivo and Bayon2005).
Cytochrome c oxidase (COX, or complex IV) plays an important role in the mitochondrial respiratory chain, converting molecular oxygen into water molecules and storing energy in the inner cell membrane by establishing a transmembrane difference in electrochemical potential (Ferguson-Miller and Babcock, Reference Ferguson-Miller and Babcock1996). Mitochondrial ATP synthase, or complex V, uses the proton gradient provided by the activity of respiratory chain complexes I, III and IV for ATP synthesis, thereby generating over 95% of cellular ATP (Sperl et al., Reference Sperl, Jesina, Zeman, Mayr, Demeirleir, VanCoster, Pickova, Hansikova, Houst’kova, Krejcik, Koch, Smet, Muss, Holme and Houstek2006). Two of the ATP synthase genes, ATP6 and ATP8, encoding F 0 subunits, a (or subunit 6) and A6L (or subunit 8), respectively, are located in the mtDNA (Anderson et al., Reference Anderson, Bankier, Barrell, de Bruijn, Coulson, Drouin, Eperon, Nierlich, Roe, Sanger, Schreier, Smith, Staden and Young1981). Protons pass from the intermembrane space to the matrix through F 0, which transfers the energy generated by the proton electrochemical gradient to F 1, where ADP is phosphorylated to ATP (Nijtmans et al., Reference Nijtmans, Klement, Houstek and van den Bogert1995). Several genes located in the mtDNA have been associated with physiological activities, including adaptation to high altitude (Wang et al., Reference Wang, Shen, Feng, Zhao, Song, Zhang, Yang and He2016), male fertility (Camus et al., Reference Camus, Wolf, Morrow and Dowling2015), and even disease (Rak et al., Reference Rak, Benit, Chretien, Bouchereau, Schiff, El-Khoury, Tzagoloff and Rustin2016).
There are very few reports on the geographical distribution of sheep lineages based on protein-coding genes in the mtDNA, and little is known about the mtDNA content in different sheep populations at various altitudes. Thus, the purpose of this study was to assess the relationship between the phylogenesis of maternal lineages and mtDNA copy number using the mitochondrial COX and ATP genes to identify differences in mitochondrial function in 11 sheep breeds that around china according to altitude difference, which are suitable for environmental suitability study. Sishui Fur sheep (SF), Small-tailed Han Sheep (SH), Poll Dorset (PD), Dorper sheep (DO) and Suffolk sheep (SU) are inhabited in eastern China. Except PD, all of them are dual-purpose breeds of meat and wool. The other investigated breeds are mainly used for meat. Our study supported the hypothesis that maternal lineages and mtDNA copy number had a close connection with environmental adaptability.
Material and methods
Sampling strategy and DNA extraction
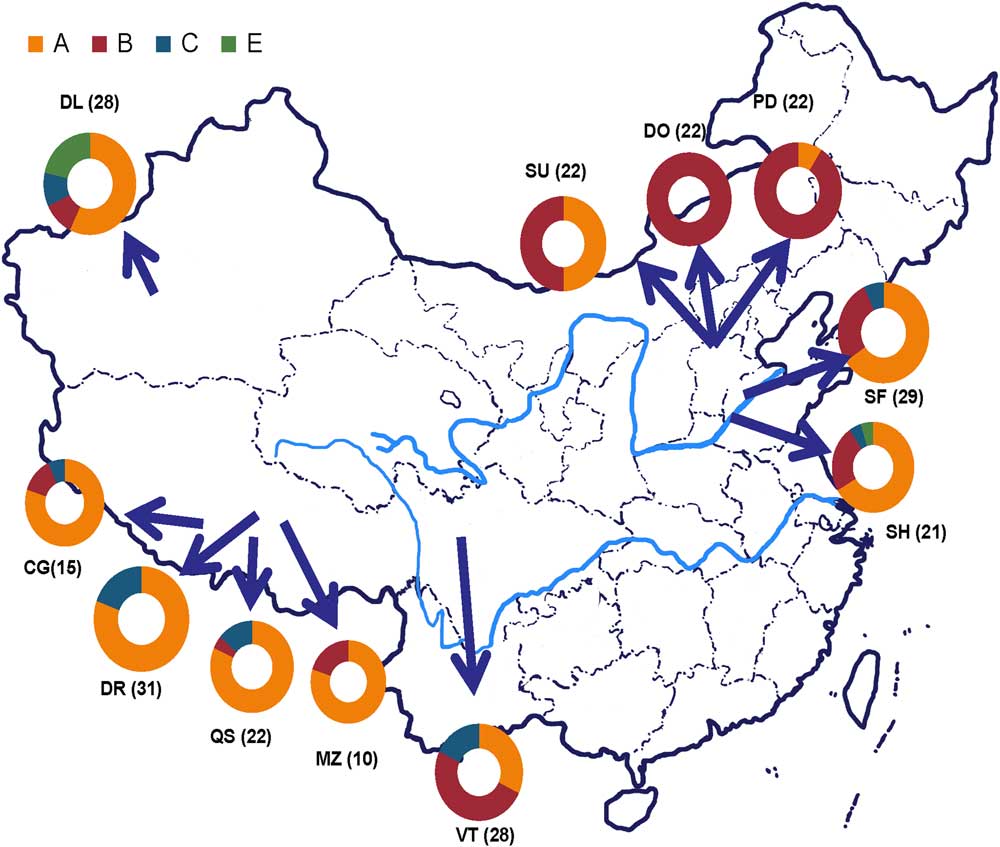
Peripheral blood samples were collected from the jugular vein of 250 genetically unrelated individuals. All samples represented six high altitude sheep breeds (Valley-type Tibetan sheep (VT), Mozhu sheep (MZ), Chengguan sheep (CG), Qushui sheep (QS), Dingri sheep (DR) and Duolang sheep (DL)) and five low altitude breeds (Sishui Fur sheep (SF), Small-tailed Han Sheep (SH), Poll Dorset (PD), Dorper sheep (DO) and Suffolk sheep (SU), Figure 1 and Table 1). DNA was extracted from blood samples using TIANamp DNA Blood Mini Kit (TIANGEN, Beijing, China) according to the instructions and thequantity and quality of extracted DNA have been certified by Thermo Scientific Nanodrop 2000 Spectrophotometer.
Geographical and haplotype distribution of the 11 investigated sheep populations. DL=Duolang sheep; SU=Suffolk sheep; DO=Dorper sheep; PD=Poll Dorset; SF=Sishui Fur sheep; SH=Small-tailed Han Sheep; VT=Valley-type Tibetan sheep; MZ=Mozhu sheep; QS=Qushui sheep; DR=Dingri sheep; CG=Chengguan sheep.

Sampling location and sample size, genetic parameters and lineage distribution of the 11 sheep breeds

1 Indicated the haplotype number.
2 Indicated the haplotype diversity.
3 Indicated nucleotide diversity.
Amplification and sequencing of mitocondrial DNA protein-coding genes
Four primer pairs (Supplementary Material Table S1) were designed using the Primer Premier 5 to amply the whole coding regions of COX1, COX2, ATP8, ATP6 and COX3 genes. The PCR systems volume of 30 μl, containing 2 μl DNA (60 to 90 ng), 1.2 mM of each primer, 10 μl ddH2O, and 15 μl 2× Taq PCR Master Mix (TIANGEN, Beijing, China), using the standard PCR program in C1000TM Thermal Cycler (Bio-Rad Laboratories, Santa Clarita City, CA, USA). Polymerase chain reaction products were sequenced by the TSINGKE Biological Technology Corporation. All sequences were deposited into GenBank with the accession number KY452457 to KY453706.
Detection of mitocondrial DNA copy number
To determine the mtDNA content, quantitative real-time PCR (qPCR) was conducted using five single-copy protein-coding genes (COX1, COX2, ATP8, ATP6 and COX3). The expression of each of the genes was measured relative to that of nuclear gene GCG (Supplementary Material Table S1), which is present in a single copy and is highly conserved in mammals (Ballester et al., Reference Ballester, Castello, Ibanez, Sanchez and Folch2004). Reactions were performed using a CFX96 Real-Time PCR System (Bio-Rad), with a following thermal cycler parameters: 95°C for 30 s, followed by 39 cycles of 95°C for 10 s, and 30 s at the Tm indicated in Supplementary Material Table S1. Melting curve analysis was performed from 65°C to 95°C at increments of 0.5°C. Six samples were randomly selected from each breed, and each sample was assayed in triplicate.
Data analyses
The number of haplotypes, haplotype diversity (hd) and nucleotide diversity (pi) was analyzed by dnasp5.10 (Rozas, Reference Rozas2009). The neighbor-joining tree was constructed using MEGA5.0 (Tamura et al., Reference Tamura, Peterson, Peterson, Stecher, Nei and Kumar2011). The lineage was determined according to the previously defined samples (A1a, KF938326, A1b, KF938321, A2, KF938334, B1a, KF938328, B1b, KF938333, B2, KF938336, C, KF938320, E, HM236182, outgroup, HM236186). Wright’s F-statistics of subpopulation within total (Fst) and neutrality tests (Ewens-Watterson test, Tajima’s D test) were calculated by Arlequin 3.5 (Excoffier and Lischer, Reference Excoffier and Lischer2010), Gene flow (N m=(1/Fst−1)/2) was mentioned to represent the gene exchange degree, which had inverse proportional relationship with Fst value. A median-joining network was drew using the program Network 4.6.14 (Bandelt et al., Reference Bandelt, Forster and Rohl1999).
Results
Polymorphisms and diversity of mitochondrial DNA protein-coding genes
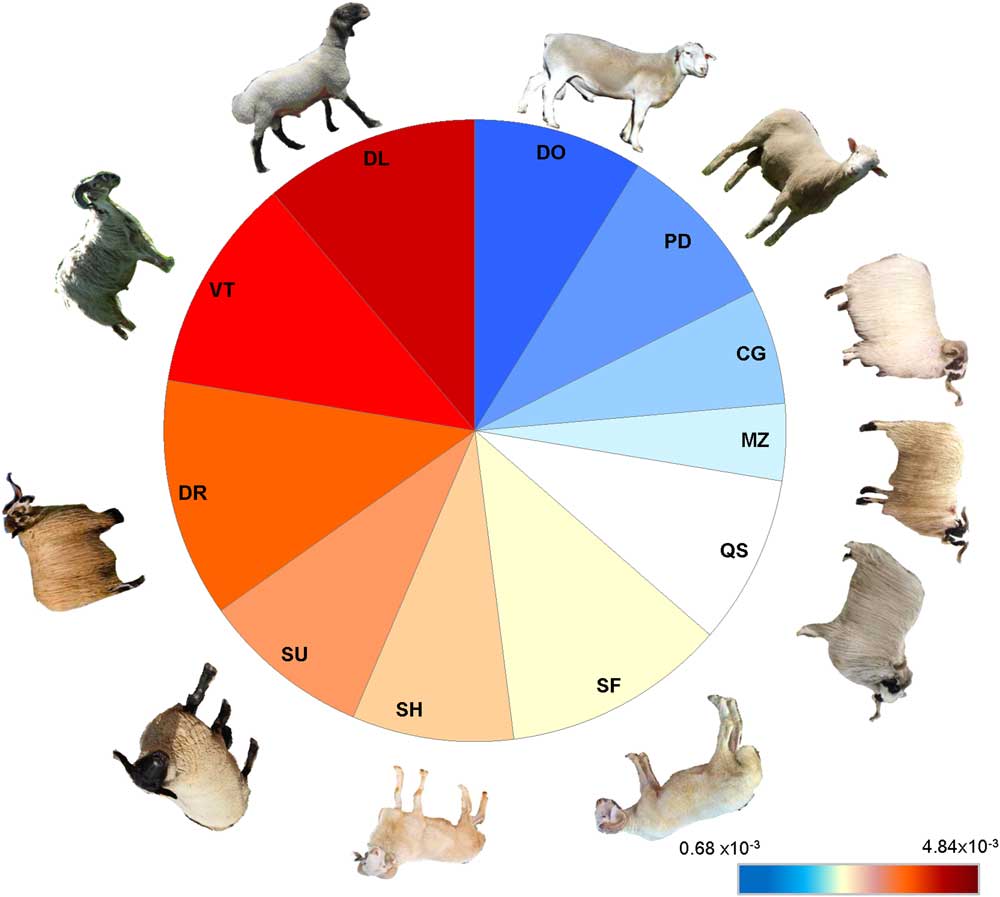
Alignment of all the 250 samples identified 72 single-nucleotide polymorphisms (SNPs) in COX1, including eight missense mutations (Supplementary Material Table S2). COX2 contained 26 SNPs, including three missense mutations, while ATP8 had 11 SNPs and six missense mutations. In ATP6, 44 SNPs were detected, 15 of which were missense mutations, and COX3 had 43 SNPs and 10 missense mutations. Nucleotide diversity (pi), haplotype number, and haplotype diversity (hd) within the 11 sheep populations were assessed based on the 4068 bp of assembled sequence from the five protein-coding genes from each sample (Table 1). Dorper sheep had the lowest nucleotide diversity (0.00068), while DL sheep showed the highest nucleotide diversity (0.00484). Likewise, DO sheep had the lowest haplotype diversity (0.779), with DL sheep showing the highest diversity (0.997). A color gradient map demonstrating the differences in nucleotide diversity between the 11 populations was generated (Figure 2).
Gradient map of nucleotide diversity among the 11 sheep populations. DL=Duolang sheep; DO=Dorper sheep; PD=Poll Dorset; CG=Chengguan sheep; MZ=Mozhu sheep; QS=Qushui sheep; SF=Sishui Fur sheep; SH=Small-tailed Han Sheep; SU=Suffolk sheep; DR=Dingri sheep; VT=Valley-type Tibetan sheep.

Lineage distribution and phylogenetic relationship
Lineage distribution analysis using the five assembled protein-coding genes showed that indigenous breeds SF and SH from Eastern China had similar distribution patterns. Overall, lineage A was the most abundantly represented lineage in the SF and SH populations (65.5% and 66.7%, respectively), while lineage B represented 27.6% and 23.8% of the lineage diversity in the two populations, respectively. Only a small proportion of samples were identified as lineage C, which accounted for 6.9% and 4.8% of the samples, respectively (Figure 1). In addition, 4.8% of SH samples were classified as lineage E. Interestingly, we found that the VT population had a different lineage distribution to those of other populations in the Tibet Autonomous Region, which is close to the Ngawa Tibetan Qiang Autonomous Region. In general, VT had a higher proportion of lineage B samples (50%) than the other four Tibetan sheep populations (0% to 20%), in which lineage A in predominant (80% to 81.8%). In contrast, lineage B was most common in introduced breeds (SU, PD and DO). Investigation of the genetic distances using D-loop data also showed that VT is more closely related to the introduced breed SU than to the other indigenous breeds (Supplementary Material Figure S1).
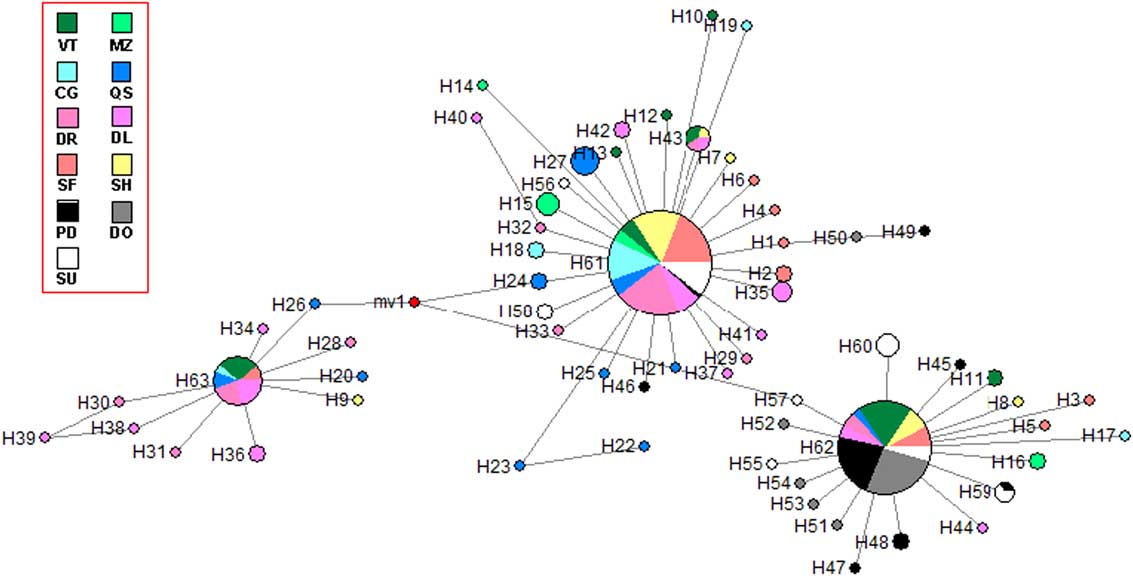
The phylogenetic relationships between the 11 breeds were assessed using COX1 sequence data. In the network of mtDNA COX1 (Figure 3), which is based on the polymorphism and haplotype distribution analyses, the majority of the 63 COX1 haplotypes were found to cluster into three groups, centered around haplotypes H61, H62 and H63. Analysis showed that 42.9% of VT samples, 63.6% of PD samples, and 77.3% of DO samples were classified as H62. Interestingly, the H61 individuals were found to belong to lineage A, with 51.7% of SF, 57.1% of SH, 66.7% of CG, and 51.6% of DR samples being classified as H61. In contrast, H63, which clustered away from the other haplotypes, contained lineage C samples, accounting for 17.9% of VT, 13.0% of DR and 14.3% of DL samples. More detailed haplotype distribution data pertaining to the remaining four coding genes is shown in Supplementary Material Table S3.
Median-joining network of mtDNA COX1 gene within 11 breeds. VT=Valley-type Tibetan sheep; CG=Chengguan sheep; DR=Dingri sheep; SF=Sishui Fur sheep; PD=Poll Dorset; SU=Suffolk sheep; MZ=Mozhu sheep; QS=Qushui sheep; DL=Duolang sheep; SH=Small-tailed Han Sheep; DO=Dorper sheep.

Genetic differentiation and population expansion
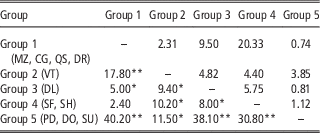
Geographic distribution analysis classified the 11 populations into five groups (Table 2). Based on the pairwise fixation index (Fst), group 1 had normal differentiation from group 2 (17.8%), slight differentiation from group 3 (5.0%), no differentiation from group 4 (2.4%), and was strongly differentiated from group 5 (40.2%). Group 2 showed slight differentiation from groups 3 (9.4%), 4 (10.2%), and 5 (11.5%), and while only a slight differentiation was observed between groups 3 and 4 (8.0%), a more significant differentiation was identified between groups 3 and 5 (38.1%). A large differentiation was also observed between groups 4 and 5 (30.8%). The highest level of gene flow (N m) was detected between groups 1 and 4 (20.3), while the lowest gene flow was observed between groups 1 and 5 (0.74). The average pairwise Fst values (%) for each of the five genes are shown in Supplementary Material Table S4.
Pairwise Fst (%) and gene flow N m between the five groups

MZ=Mozhu sheep; CG=Chengguan sheep; QS=Qushui sheep; DR=Dingri sheep; VT=Valley-type Tibetan sheep; DL=Duolang sheep; SF=Sishui Fur sheep; SH=Small-tailed Han Sheep; PD=Poll Dorset; DO=Dorper sheep; SU=Suffolk sheep.
Fst (Wright’s F-statistics of a subpopulation within total population) estimates are below the diagonal. *Indicated slight differentiation (5~15%), **indicated normal differentiation (15~25%). Gene flow N m (the grade to interflow of hereditary material between two populations) are above the diagonal.
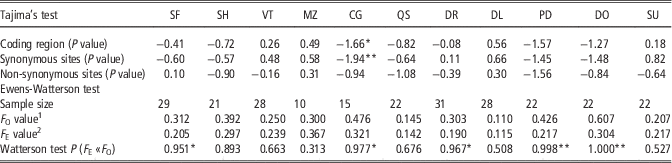
Neutrality tests were conducted to identify population expansion and gene selection. Tajima’s test (Table 3) indicated significant selection within both the coding regions (−1.66, P<0.1) and synonymous sites (−1.94, P<0.05) in the GC population using the five assembled protein-coding genes, indicating population expansion. No significant selection was observed among the other 10 breeds. Using the Ewens-Watterson homozygosity test (Table 3), all of the observed F values (F O) were greater than the expected F values (F E), except in the MZ, DL, and SU populations in COX1. The SF, CG, DR, PD, and DO populations had significant or extremely significant P-values using this test, suggesting some selection among these breeds. The results of other four protein-coding genes can be found in Supplementary Material Table S5.
Population expansion estimated by the Tajima’s test and the Ewens-Watterson test of COX1

SF=Sishui Fur sheep; SH=Small-tailed Han Sheep; VT=Valley-type Tibetan sheep; MZ=Mozhu sheep; CG=Chengguan sheep; QS=Qushui sheep; DR=Dingri sheep; DL=Duolang sheep; PD=Poll Dorset; DO=Dorper sheep; SU=Suffolk sheep.
1 Indicated observed value of Ewens-Watterson test.
2 Indicated expected value of Ewens-Watterson test.
*Means significant at P<0.05; **means significant at P<0.01.
Divergence time of each confirmed haplotype
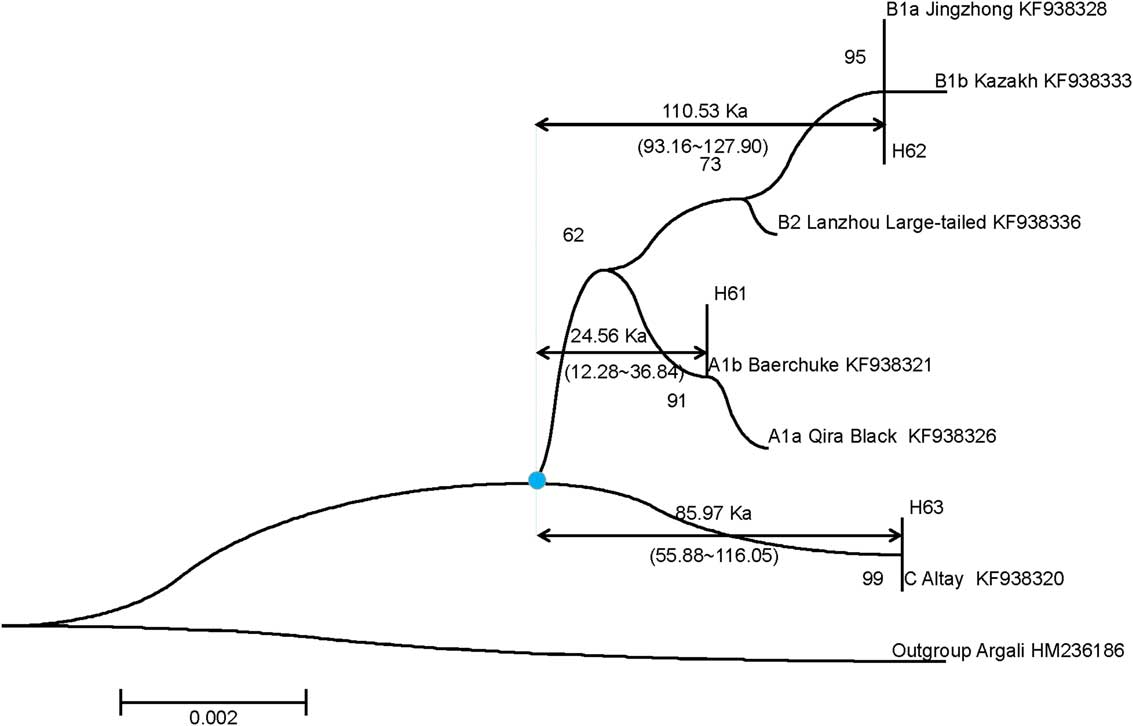
In this study, the mutation rate was based on that of cytb (0.49×10⁻⁸ per nucleotide/year). For the COX1 haplotypes (Figure 4), the mutations indicative of H63 (lineage C) indicated a divergence time from the median vector (blue point, Figure 4) of ~85 967 years ago (standard deviation (σ), 2.4495 years; standard deviation in years, 30 082.2). The two mutations found in H61 (lineage A) correlated to a divergence time of ~24 562 years ago (standard deviation in years, 12 281), while H62 (lineage B), which has nine mutations, diverged ~110 529 years ago (σ, 17 367.96 years). The divergence data for the other four protein-coding genes is shown in Supplementary Material Figure S2.
A reduced neighbor-joining tree of the main haplotypes of COX1.

Mitochondrial DNA copy number and non-synonymous mutations
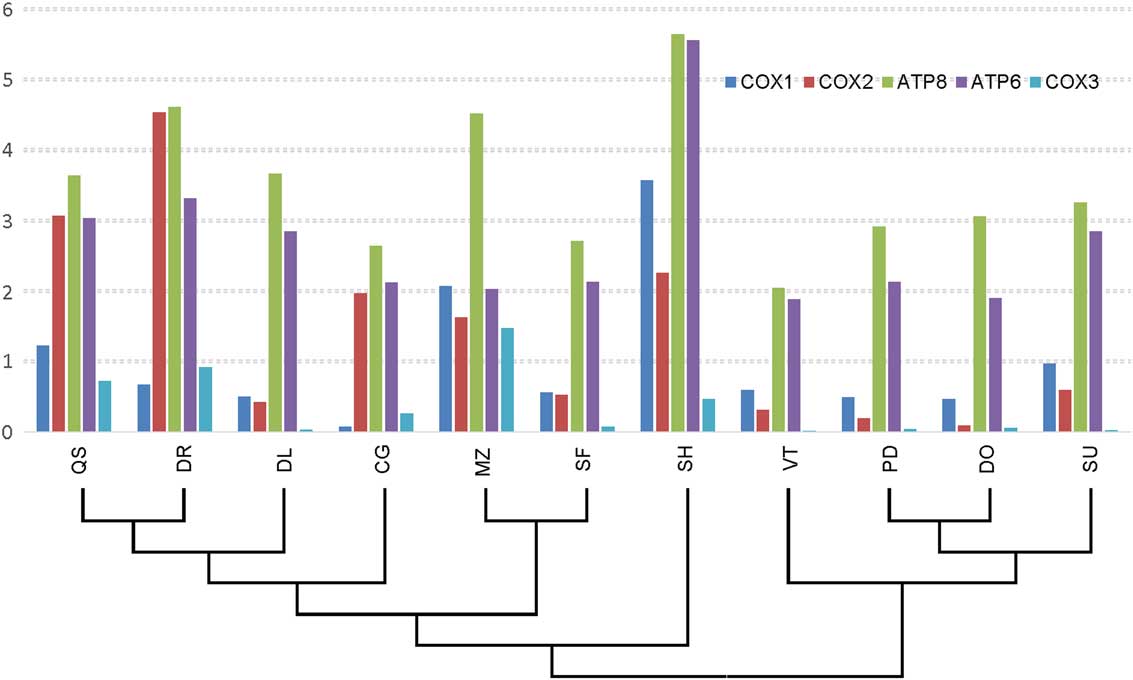
Like the mitochondrial phylogenies, the mtDNA copy number showed a slight correlation with genetic distances for the 11 populations (Figure 5). Sishui Fur sheep and DL clustered closely together, and both populations had low mtDNA copy numbers based on the COX1 and COX2 sequences. We found that VT clustered with the other three introduced breeds, PD, DO and SU, and that all four breeds had low mtDNA copy numbers. In contrast, SH had a high copy number.
Correlation between genetic distance and mtDNA copy number. QS=Qushui sheep; DR=Dingri sheep; DL=Duolang sheep; CG=Chengguan sheep; MZ=Mozhu sheep; SF=Sishui Fur sheep; SH=Small-tailed Han Sheep; VT=Valley-type Tibetan sheep; PD=Poll Dorset; DO=Dorper sheep; SU=Suffolk sheep.

Based on the mtDNA copy number, we then selected several typical populations to determine whether non-synonymous mutations were associated with haplotypes. We used SF, VT and PD as low value group, and SH, DR and DL as high value group. We selected the COX2 and ATP6 genes (Supplementary Material Table S6) for the analysis as both had enough populations with either high or low copy numbers to identify significant differences in amino acid substitutions between the two groups. A Ser>Arg substitution was observed in ATP6 in all selected populations. Based on the copy number results for the ATP6 fragment, we divided six breeds into the high (or low) copy number group as we mentioned previously. We used hypothesis test for the percentage of two samples, three low value populations (SF, VT, PD) were corresponded with other three high value populations (SH, DR, DL), so we carried out nine hypothesis tests in total. The SF population was not significantly different to the three high copy number populations (ST=0.2177, DR=0.4511 and DL=0.3771), while VT differed significantly from DR and SH (DR: μ c=2.9758, P<0.01; SH: μ c=2.1072, P<0.05;). PD showed a significant difference to all three high copy number populations (SH: μ c=3.5888, P<0.01; DR: μ c=4.3990, P<0.01; DL: μ c=3.2170, P<0.01). Interestingly, using the COX2 sequence, no significant difference was observed between the SF, SH, VT, DR, and DL populations, despite the presence of a Val>Ile substitution.
Discussion
Several studies have investigated the impact of domestication and migration on sheep (Lv et al., Reference Lv, Peng, Yang, Zhao, Li, Liu, Ma, Zhao, Yang, Wang, Li, Liu, Shen, Zhao, Hehua, Gorkhali, Farhad Vahidi, Muladno, Naqvi, Tabell, Iso-Touru, Bruford, Kantanen, Han and Li2015; Resende et al., Reference Resende, Goncalves, Muigai and Pereira2016) and goats (Kibegwa et al., Reference Kibegwa, Githui, Jung’a, Badamana and Nyamu2016) phylogenies. The Middle East and the Mongolian Plateau are recognized as the center of dispersal for these two sheep migratory waves, respectively, which occurred during the great migration (Lv et al., Reference Lv, Peng, Yang, Zhao, Li, Liu, Ma, Zhao, Yang, Wang, Li, Liu, Shen, Zhao, Hehua, Gorkhali, Farhad Vahidi, Muladno, Naqvi, Tabell, Iso-Touru, Bruford, Kantanen, Han and Li2015). The effects of haplotypes on mtDNA copy number have been studied in Drosophila melanogaster (Camus et al., Reference Camus, Wolf, Morrow and Dowling2015), while some variations in nuclear DNA are potentially associated with maternal mtDNA copy number in humans (Workalemahu et al., Reference Workalemahu, Enquobahrie, Tadesse, Hevner, Gelaye, Sanchez and Williams2017). To date, a few studies have investigated the relationship between maternal genetic distance and mtDNA copy number.
Genetic diversity studies, including those based on protein-coding genes (COX1, COX2, ATP8, ATP6, COX3), have suggested that differences in genome sequences, particularly mitochondrial genomes, can have implications for evolution, breeding and disease (Kersten et al., Reference Kersten, Faivre Rampant, Mader, Le Paslier, Bounon, Berard, Vettori, Schroeder, Leple and Fladung2016), and can even indicate temporal fluctuations (Niemi et al., Reference Niemi, Blauer, Iso-Touru, Harjula, Nystrom Edmark, Rannamae, Lougas, Sajantila, Liden and Taavitsainen2015). ATP6 and ATP8, as components of ATP synthase, transport protons back into the matrix, which is coupled to ATP synthesis from ADP and inorganic phosphates. Cytochrome oxidase is a ubiquitous mitochondrial membrane protein that is responsible for the final step in the electron transfer chain, catalyzing electron transfer to oxygen. Compared with the COX genes, ATP8 and ATP6 had relative highly non-synonymous mutation rates in our study (54.5% and 34.1%, respectively). The high rate of amino acid substitution in the ATP synthase components may be related to the adaptability of the different regions, while cytochrome oxidase genes are more conserved. Several studies have demonstrated that missense mutations in mitochondrial genes affect cell migration and invasion, and can result in asthenospermia (Yuan et al., Reference Yuan, Wang, Li, Yu, Tao, Huang and Zeng2015).
Lineage distributions within the 11 Chinese sheep populations examined in this study, including indigenous and introduced breeds, had distinct regional differences. In particular, the distribution of lineages A and B had significant regional differences. For example, all individuals belonging to the DO breed, which originated in South Africa, were identified as lineage B. In contrast, indigenous Chinese sheep breed DR did not contain any individuals belonging to lineage B in our study. The VT and SU breeds were uniformly composed of lineage B individuals (50%). Our results showed that lineage C is only present in indigenous Chinese breeds. Some studies have suggested that because people deliberately mated domestic ewes with wild rams in Central Asia and North China (Lv et al., Reference Lv, Peng, Yang, Zhao, Li, Liu, Ma, Zhao, Yang, Wang, Li, Liu, Shen, Zhao, Hehua, Gorkhali, Farhad Vahidi, Muladno, Naqvi, Tabell, Iso-Touru, Bruford, Kantanen, Han and Li2015), the formation of lineage C was not the result of a long evolutionary process, but was caused by the exchange of genes between domestic and wild sheep. As such, lineage C could be used as an indicator of domestication (Chen et al., Reference Chen, Duan, Sha, Xiangyu, Wu and Zhang2006). This is likely to be true of the SH and DL breeds, each of which contained a relatively low frequency of lineage C (4.8% and 21.4%, respectively). Unlike the coding regions of the mtDNA, the D-loop can be used to optimally characterize interspecific genetic diversity (Ramadan and El-Hefnawi, Reference Ramadan and El-Hefnawi2008). We also used the control region of five populations. Interestingly, we determined that there was a smaller mean distance between VT and SU (0.022) than between VT and MZ (0.025), CG (0.024), and QS (0.024), despite the fact that VT, MZ, CG, and QS originate from the same ancestral sheep breeds in China. This may be the result of the long period of geographical isolation between the breeds.
The pairwise fixation index is used as a measure of population differentiation to explain geographical structuring between species (Behera et al., Reference Behera, Kunal, Paria, Das, Meena, Pakrashi, Sahoo, Panda, Jena and Sharma2015; Joy et al., Reference Joy, Mohitha, Divya, Gopalakrishnan, Basheer and Jena2016; Mahami-Oskouei et al., Reference Mahami-Oskouei, Kaseb-Yazdanparast, Spotin, Shahbazi, Adibpour, Ahmadpour and Ghabouli-Mehrabani2016). Differentiation analysis divided the 11 breeds into five geographic groups, amongst which, the Tibetan Sheep breed VT was strongly differentiated from the other breeds. We found that group 1 and group 5 had the maximum Fst value and minimum N m value in our analysis, which is very reasonable with geographical distribution. VT clustered independently in group 2 and had low gene flow and a relatively high Fst value with group 1 (17.8%) and low gene flow (2.31), despite the close geographic relationship between the two groups and the fact that the populations originated from the same ancestral sheep breed. Group 5 contained introduced populations only, and showed strong genetic differentiation from the other groups, except group 2 (Fst=11.5%, N m=3.85). These results indicated that VT is more closely related to group 5 populations than to those making up groups 1, 3 and 4. In our previous study (Niu et al., Reference Niu, Chen, Xiao, Zhao, Zhou, Hu, Sun, Guo, Li, Wang, Zhang and Zhong2016), we proposed that Tibetan sheep in both plateau and mountain-valley areas had a natural selection-derived element that contributed to their domestication. Adaptation to the terrain (plateau and mountain-valley) may influence a specific lineage becoming the dominant lineage of that area.
Population expansions and selection can be reflected in the demographic history of a population, and can influence the molecular evolutionary rate (Delrieu-Trottin et al., Reference Delrieu-Trottin, Mona, Maynard, Neglia, Veuille and Planes2017). Tajima’s test failed to identify any significant selection within any of the populations examined, except for CG, which showed significantly negative values for both coding regions (Tajima’s D=−1.66, 0.10>P>0.05) and synonymous sites (Tajima’s D=−1.94, P<0.05). This indicated that the remaining 10 populations had only low levels of high or low frequency polymorphism. Using the Ewens-Watterson test, the observed value was significantly larger than the expected value in the SF, CG, DR, PD and DO populations, indicating positive selection in these populations. The non-significant results for the remaining six breeds imply that the populations have evolved in a random gene drift mode. Network and NJ tree analyses based on each of the individual protein-coding genes grouped the 11 populations into three distinct clusters, except ATP8-based analysis, which only identified two clusters. (Supplementary Material Figure S3). ATP8 is only 201 bp in length, and there is no significant difference between lineages A and B (Supplementary Material Figure S3). Some studies have shown closely related populations may share the same circles or be present in the same clusters, purporting they have a closer phylogenetic relationship (Carneiro et al., Reference Carneiro, Afonso, Geraldes, Garreau, Bolet, Boucher, Tircazes, Queney, Nachman and Ferrand2011).
Previous studies have shown that sequence variation in the mitochondrial genome can cause changes in mtDNA copy number (Workalemahu et al., Reference Workalemahu, Enquobahrie, Tadesse, Hevner, Gelaye, Sanchez and Williams2017). Several significant differences in mtDNA copy number between populations were observed in our study. Combined with the mean distances between populations, the mtDNA copy number analysis using the five mitochondrial genes identified two different expression clusters, which was strikingly similar to the genetic distance analysis (Figure 5). As there is an association between phylogenesis and genome copy number (Camus et al., Reference Camus, Wolf, Morrow and Dowling2015; Jiang et al., Reference Jiang, Zhang, Dong, Chen, Feng, Peng, Mahboob, Al-Ghanim and Xu2016), we presumed that the differences in mtDNA copy number were related to the genetic distances, especially the amino acid alterations among populations. As previously reported, diet can influence the mtDNA copy number (Liao et al., Reference Liao, Yan, Mai and Ai2016), and a decline in mtDNA copy number influences aging in short-lived fish species (Hartmann et al., Reference Hartmann, Reichwald, Wittig, Drose, Schmeisser, Luck, Hahn, Graf, Gausmann, Terzibasi, Cellerino, Ristow, Brandt, Platzer and Englert2011). We logically inferred that the change in relative copy number of each breed with different divergence was associated with environmental adaptability, and the mtDNA content might be a new aspect of environmental adaptation analyses in evolutionary genetics.
Conclusion
Overall, we successfully examined the phylogeny of 11 sheep breeds in China, including eight indigenous breeds and three introduced breeds. ATP8 and ATP6 had high rates of non-synonymous mutation, while the cytochrome oxidase genes were relatively conserved among the different populations. Among the indigenous Chinese breeds, VT was the most closely related to the introduced breeds. Importantly, mtDNA copy number was significantly associated with genetic distances, and the populations could be divided into high and low copy number groups.
Acknowledgments
This work was supported by the Chinese Domestic Animal Germplasm Resources Infrastructure and the grants from National Natural Science Foundation of China (31501936).
Authors’ Contributions: Ping Xiao and Li-Li Niu contributed equally.
Supplementary material
To view supplementary material for this article, please visit https://doi.org/10.1017/S175173111700297X