



1. Introduction
Magnetohydrodynamic (MHD) effects commonly occur in the flows of electrically conductive fluids subjected to magnetic fields, such as plasmas and liquid metals. Research on MHD turbulence is essential for elucidating geophysical and astrophysical phenomena, designing liquid-metal cooling circuits in magnetic confinement environments (e.g. the blanket cooling systems in nuclear fusion tokamaks) and advancing applications in electromagnetic metallurgy. The Lorentz force
 $\boldsymbol{F} = \boldsymbol{j} \times \boldsymbol{B}$
, where
 $\boldsymbol{j}$
is the current density and
 $\boldsymbol{B}$
the magnetic field, distinguishes MHD from hydrodynamic turbulence. This force acts on the conductive fluid as a body force, leading to two physical effects: vortex elongation and Joule dissipation (Knaepen & Moreau Reference Knaepen and Moreau2008). Furthermore, these effects can be investigated through the free decay of turbulence in a conductive fluid under a uniform magnetic field.
The effects of Lorentz force on the decay and anisotropy evolution in MHD turbulence have been extensively investigated. Moffatt (Reference Moffatt1967) described the ‘preferential damping’ process that occurs when homogeneous isotropic turbulence (HIT) in a conducting fluid is suddenly subjected to a uniform magnetic field. He derived a decay power law
 $u^2 \sim t^{-1/2}$
for
 $\tau \lt t \lt T$
when the interaction parameter
 $N = T/\tau \gg 1$
, where
 $\tau =\rho / \sigma B^2$
denotes the magnetic damping time,
 $T=l/u$
is the eddy turnover time,
 $u$
and
 $l$
are the integral scales of the turbulent motion,
 $\rho$
is the fluid density and
 $\sigma$
is the electrical conductivity. This theory plays a significant role in modelling the decay of quasi-static MHD turbulence, but still lacks experimental evidence. Furthermore, a theoretical derivation by Davidson (Reference Davidson1995, Reference Davidson1997) based on angular momentum considerations validated the scaling law derived by Moffatt (Reference Moffatt1967), and obtained that the integral scale parallel to
 $\boldsymbol{B}$
follows a power law
 $l_\parallel \sim t^{1/2}$
. Subsequent numerical simulations have validated this model and further examined the energy and scale characteristics of the decaying process (Knaepen & Moin Reference Knaepen and Moin2004; Burattini et al. Reference Burattini, Zikanov and Knaepen2010; Okamoto et al. Reference Okamoto, Davidson and Kaneda2010; Fan et al. Reference Fan, Chen and Ni2025). Simulations of decaying MHD turbulence in large computational domains by Okamoto et al. (Reference Okamoto, Davidson and Kaneda2010) confirmed that vortices stretch along the direction parallel to
 $\boldsymbol{B}$
following the law of Davidson (Reference Davidson1995, Reference Davidson1997), and suggested that the background magnetic field drives the two-dimensionalisation of MHD turbulence (Kolesnikov & Tsinober Reference Kolesnikov and Tsinober1974; Sommeria & Moreau Reference Sommeria and Moreau1982; Zikanov & Thess Reference Zikanov and Thess1998; Vorobev et al. Reference Vorobev, Zikanov, Davidson and Knaepen2005; Alexakis Reference Alexakis2011). Burattini et al. (Reference Burattini, Zikanov and Knaepen2010) further examined the anisotropy evolution of velocity components induced by Joule dissipation during the decay process, highlighting the tendency of the magnetic field to erode the energy of wavenumber vectors parallel to it (Burattini et al. Reference Burattini, Kinet, Carati and Knaepen2008; Knaepen & Moreau Reference Knaepen and Moreau2008; Favier et al. Reference Favier, Godeferd, Cambon and Delache2010; Moreau Reference Moreau2013).
Moreover, unlike viscous dissipation, which primarily occurs at small scales (Pope Reference Pope2000), Joule dissipation acts across all scales (Burattini et al. Reference Burattini, Zikanov and Knaepen2010). According to the quasi-equilibrium model proposed by Alemany et al. (Reference Alemany, Moreau, Sulem and Frisch1979), a spectral slope of
 $\varPhi _\parallel (k_\parallel) \sim k_\parallel ^{-3}$
emerges when viscous dissipation is much smaller than Joule dissipation, where
 $\varPhi _\parallel$
represents the spectral tensor component parallel to the magnetic field. Eckert et al. (Reference Eckert, Gerbeth, Witke and Langenbrunner2001) then offered an extensive experimental study of spectral dependence on the interaction parameter
 $N$
, concluding that the spectral slope becomes steeper monotonically with growing
 $N$
. Since
 $N$
increases during the decay of MHD turbulence, a similar steepening of the energy spectrum has likewise been observed in studies of the decay process (Knaepen & Moin Reference Knaepen and Moin2004; Burattini et al. Reference Burattini, Zikanov and Knaepen2010; Reddy et al. Reference Reddy, Kumar and Verma2014; Verma Reference Verma2017; Fan et al. Reference Fan, Chen and Ni2025). Furthermore, Fan et al. (Reference Fan, Chen and Ni2025) explained the steepening of the spectrum during the decay of MHD HIT from the perspective of energy transfer and confirmed bidirectional energy transfer perpendicular to the magnetic field during decay – a topic of recent interest in MHD turbulence studies (Klein & Pothérat Reference Klein and Pothérat2010; Pothérat & Klein Reference Pothérat and Klein2014; Baker et al. Reference Baker, Pothérat and Davoust2015; Pothérat & Kornet Reference Pothérat and Kornet2015; Baker et al. Reference Baker, Pothérat, Davoust and Debray2018; Chen et al. Reference Chen, Pothérat, Ni and Moreau2021; Fan et al. Reference Fan, Chen and Ni2025).
A series of studies following Moffatt (Reference Moffatt1967) have thoroughly investigated the preferential damping, vortex elongation and spectra deviation of decaying MHD HIT. However, the conditions governing the onset of the
 $u^2 \sim t^{-1/2}$
stage remain insufficiently understood. Previous studies have generally focused on a broad regime characterised only by
 $N \gg 1$
. Although Alemany et al. (Reference Alemany, Moreau, Sulem and Frisch1979) conducted experiments on grid-generated turbulence decaying in a mercury tank at
 $N \sim 1$
and showed an early tendency towards preferential damping of kinetic energy, further analysis was limited by measurement techniques for opaque mercury. Meanwhile, studies by Sreenivasan & Alboussiere (Reference Sreenivasan and Alboussiere2002) and Wang et al. (Reference Wang, Chen, Cao, Ke, Yang and Ni2023) on the decay of a single vortex under a magnetic field parallel to its axis suggest that the ‘preferential damping’ process may occur at relatively low
 $N$
(
 $N=1.4$
). But findings from single-vortex studies do not necessarily fully generalise to MHD HIT. Numerical simulations by Burattini et al. (Reference Burattini, Zikanov and Knaepen2010) and Fan et al. (Reference Fan, Chen and Ni2025) mainly focus on when
 $N \gg 1$
and do not support the presence of a
 $u^2 \sim t^{-1/2}$
stage at
 $N \sim 1$
, but MHD turbulence evolution is highly sensitive to the flow state at the instant the magnetic field is imposed (Sukoriansky et al. Reference Sukoriansky, Zilberman and Branover1986; Zikanov et al. Reference Zikanov, Krasnov, Boeck and Sukoriansky2019). This sensitivity may account for discrepancies between numerical and experimental results at the critical parameter
 $N \sim 1$
, arising from differences in initial turbulent field generation methods. In summary, the lack of targeted investigations limits the applicability of Moffatt’s law in turbulence modelling, especially in regimes with interaction parameters of the order of
 $N \sim 1$
. Therefore, experimental studies into the decay of MHD HIT at
 $N \sim 1$
are warranted.
Methods for generating HIT using grids (Kolesnikov & Tsinober Reference Kolesnikov and Tsinober1974; Alemany et al. Reference Alemany, Moreau, Sulem and Frisch1979; Sukoriansky et al. Reference Sukoriansky, Zilberman and Branover1986; Krogstad & Davidson Reference Krogstad and Davidson2011; Valente & Vassilicos Reference Valente and Vassilicos2011), shear flows (Cortet et al. Reference Cortet, Chiffaudel, Daviaud and Dubrulle2010; Zhang & Xi Reference Zhang and Xi2022) and synthetic jets (Hwang & Eaton Reference Hwang and Eaton2004; Zimmermann et al. Reference Zimmermann2010; Sabban & van Hout Reference Sabban and van Hout2011; Tan et al. Reference Tan, Xu, Qi and Ni2023) have been widely employed in numerous experimental studies. Among these, the synthetic jet method has gained widespread adoption due to its flexibility and capacity to produce turbulence with good isotropy (Zimmermann et al. Reference Zimmermann2010; Nezami et al. Reference Nezami, Byron and Johnson2023). Unfortunately, MHD experiments are constrained by strong magnetic field environments and limited magnet bore space, and the imposed magnetic field inherently disrupts turbulence isotropy, leading to the exclusive use of grid methods for generating MHD HIT to date (Kolesnikov & Tsinober Reference Kolesnikov and Tsinober1974; Alemany et al. Reference Alemany, Moreau, Sulem and Frisch1979; Sukoriansky et al. Reference Sukoriansky, Zilberman and Branover1986; Kljukin & Kolesnikov Reference Kljukin and Kolesnikov1989). Since the planar forcing provided by grids ensures only two-dimensional homogeneity and isotropy (Huang et al. Reference Huang, Lv, Chen, Song, Yin and Wang2024), and different decay power laws have been reported in decaying turbulence experiments employing grids of varying shapes (Krogstad & Davidson Reference Krogstad and Davidson2011; Valente & Vassilicos Reference Valente and Vassilicos2011), the synthetic jet method may offer a better alternative for investigating the decay of MHD HIT. Furthermore, for forced MHD turbulence at
 $N \sim 1$
, due to continuous isotropic energy injection, the disruption of isotropy by the magnetic field is limited (Moreau Reference Moreau2013), rendering the application of the synthetic jet method feasible for MHD HIT.
Thus, this paper focuses on the decay of MHD HIT at
 $N \sim 1$
and magnetic Reynolds number
 $R_m =\sigma \mu u l \ll 1$
, where
 $\mu$
denotes the magnetic permeability, and develops an MHD HIT experimental system based on synthetic jets. The paper is organised as follows. Section 2 introduces a synthetic jet system capable of generating HIT in a strong magnetic field and assesses its homogeneity and isotropy. The main properties of freely decaying MHD HIT are then described and discussed in § 3, including the decay power laws and the contributions of various factors to the decay process. Section 4 further investigates the anisotropic evolution of the integral kinetic energy component and the two-dimensional energy spectrum. Sections 5 and 6 complement this analysis by examining the anisotropic evolution from the perspectives of energy transfer and vortex structure evolution, respectively. Finally, the conclusions are summarised in § 7.
2. Experimental set-up
2.1. Design of the HIT-generating system
Generating HIT requires strictly isotropic energy injection. Therefore, the arrangement of the injectors is crucial. A synthetic jet method employing eight nozzles to produce jets of equal intensity that collide in the centre is developed. These jets are designed with strict spatial symmetry, with the nozzles positioned at the corners of a cubic container with a side length of
 $L_0 = 180$
mm and oriented toward its centre, as illustrated in figure 1(a). As the jets collide and mix, the mean flow cancels out in the vicinity of the collision point. This produces a turbulent region devoid of mean flow at the container’s centre, satisfying the criteria for HIT as outlined by McComb (Reference McComb2024). The nozzles were fabricated from acrylic plastic, with a spout diameter of
 $d_0 = 5$
mm.
Design of the HIT-generation system. (a) Conceptual design of the jet synthesising programme. (b) The experimental system is composed of a linear displacement platform, pistons, a jet box and an expansion tank.

Uniform jet intensities are ensured by a drive system comprising eight pistons (each with a 29 mm inner diameter), actuated by a linear displacement platform. This platform features a stroke of 450 mm and operates at stable speeds ranging from 2 to 40 mm s−1, producing jet velocities at spouts
 $u_{\textit{jet}} \in [0.135, 1.345]$
m s−1. The platform speed is precisely controlled using MATLAB. A schematic diagram of the system is shown in figure 1(a). During operation, the displacement platform drives the pistons, forcing fluid through the nozzles to form jets. Simultaneously, fluid within the container is pumped into an expansion tank via outlets located at the midpoints of the container’s edges. Additionally, the displacement platform can retract to draw fluid back into the pistons for subsequent experiments. The overall configuration of the experimental system is shown in figure 1(b).
In the present study, to visualise the flows, sulphuric acid at 30 % mass was used as the working fluid owing to its transparency and electrical conductivity (kinematic viscosity
 $\nu = 1.3 \times 10^{-6}\,\textrm {m}^2\,\textrm {s}^{-1}$
, density
 $\rho = 1.3 \times 10^{3}\,{\textrm {kg}\,\textrm {m}^{-3}}$
, electrical conductivity
 $\sigma \approx 83\,\rm {S\,m}^{-1}$
at
 $27^{\circ }\textrm {C}$
; Darling Reference Darling1964; Pothérat et al. Reference Pothérat, Aujogue and Debray2024). To evaluate the impact of temperature variations on the physical properties of the sulphuric acid solution during the experiment, thermocouples were installed in the expansion tank. The temperature of the solution was maintained at
 $27\pm 2^{\circ }\textrm {C}$
throughout the experiment. Compared to liquid metals, which are typically used in MHD experiments, the conductivity of 30 % sulphuric acid is approximately
 $10^{4}$
times lower (Morley et al. Reference Morley, Burris, Cadwallader and Nornberg2008; Plevachuk et al. Reference Plevachuk, Sklyarchuk, Eckert, Gerbeth and Novakovic2014; Pothérat et al. Reference Pothérat, Aujogue and Debray2024). Therefore, a sufficiently large magnetic field is required to ensure
 $N \gt 1$
. A superconducting solenoid magnet, which generates a uniform magnetic field with a maximum strength of
 $B_0=3$
T within a cylindrical region 300 mm in diameter and 300 mm in height, was used in the experiment to ensure the maximum
 $N$
achieves 1.28. Meanwhile, the jet Reynolds number at the nozzle, defined based on the jet velocity
 $u_{\textit{jet}}$
and the characteristic length scale
 $d_0$
, falls within the range
 $\textit{Re}_{\textit{jet}} = u_{\textit{jet}} d_0 / \nu \in [415, 4153]$
.
2.2. Particle image velocimetry system in a superconducting solenoid magnet
Particle image velocimetry (PIV) is used to visualise the flows. As shown in figure 2(a), two-dimensional and two-component digital (2D-2C) PIV measures the velocity field at the container’s centre within a superconducting solenoid magnet. A high-speed camera (Phantom VEO-340S), with a resolution of
 $2560 \times 1600$
pixels, was mounted outside the magnet to capture images along its axial direction. Additionally, through a right-angle reflecting prism, the camera could capture images along the radial direction of the magnet, perpendicular to the container’s sidewall. Illumination was provided by a 10 W, 532 nm Nd:YAG laser coupled with a
 $30^\circ$
Powell lens, which produced a vertical laser sheet approximately 0.5 mm thick. This sheet was positioned along the axial direction of the magnet, at the centre of the container, and perpendicular to the camera’s field of view. Figure 2(b) further illustrates the experimental set-up of the PIV system in the laboratory.
Imaging set-up for the PIV measurement. (a) Schematic of the experimental system. (b) Photo of the experimental system. (c) Definitions of plane
 $\mathcal{P}$
(
 $y{-}z$
plane, parallel to the magnetic field) and plane
 $\mathcal{V}$
(
 $x{-}z$
plane, perpendicular to the magnetic field).

Although the laser operates continuously, the camera was configured in double-frame mode with a frame separation of 1 ms, capturing 100 image pairs per second (100 Hz). Silver-plated hollow glass beads (diameter
 $\sim 10$
μm, density of
 $1.6\,{\textrm {g}\,\textrm {cm}^{-3}}$
) were used as tracer particles to follow the flow. Based on the particle seeding density and the maximum particle displacement, an interrogation window of
 $16 \times 16$
pixels with 50 % overlap was employed, yielding a vector spacing of 0.3 mm. The velocity fields were computed using the open-source MATLAB application PIVlab 3.00 (Thielicke & Sonntag Reference Thielicke and Sonntag2021).
By interchanging the positions of the camera and the laser, with the laser redirected via a right-angle reflecting prism, particle images can also be captured in a plane perpendicular to the magnetic field. As shown in figure 2(c), the plane parallel to the magnetic field direction (along the
 $y$
axis) is denoted as plane
 $\mathcal{P}$
, while the plane perpendicular to the magnetic field is denoted as plane
 $\mathcal{V}$
. The MHD-induced anisotropy manifests in plane
 $\mathcal{P}$
(Sukoriansky et al. Reference Sukoriansky, Zilberman and Branover1986; Knaepen & Moreau Reference Knaepen and Moreau2008; Burattini et al. Reference Burattini, Zikanov and Knaepen2010; Moreau Reference Moreau2013; Reddy et al. Reference Reddy, Kumar and Verma2014; Fan et al. Reference Fan, Chen and Ni2025). Therefore, the following analysis primarily focuses on the velocity components
 $u_{\!y}$
and
 $u_z$
in plane
 $\mathcal{P}$
. Results obtained in plane
 $\mathcal{V}$
serve as a control for comparisons with plane
 $\mathcal{P}$
and the non-magnetic-field case. Finally, although no magnetic field direction exists in the non-magnetic-field experiment, a consistent coordinate system
 $(y{-}z)$
in plane
 $\mathcal{P}$
is adopted for all such cases.
2.3. Homogeneity and isotropy
Before the experiments, the homogeneity and isotropy of the turbulence generated by the system were assessed both without and with the magnetic field. Outside the magnet, a photograph of plane
 $\mathcal{P}$
covering the full extent of the container in the
 $y$
direction is used to characterise the flow field within the container. Figure 3 illustrates the distribution of the root-mean-square (RMS) velocity fluctuations
 $u'_{\textit{rms}}=(u-\overline {u})_{\textit{rms}}$
in this region, where the overbar denotes the time average, while arrows indicate the magnitude and direction of the time-averaged velocity
 $\overline {u}$
. There exists an approximately square region of strong
 $u'_{\textit{rms}}$
in the central area of the plane. The mean flow converges towards the centre from the four corners of this region and, after mixing, diverges outward through its four sides. In contrast to the distribution of
 $u'_{\textit{rms}}$
, regions of strong mean velocity
 $u$
are located around the periphery of the high-
 $u'_{\textit{rms}}$
zone, whereas
 $\overline {u}$
is approximately zero at the centre of the plane. This low-mean-flow region is roughly circular (marked by dashed lines in figure 3, consistent with the criteria for HIT as outlined by McComb (Reference McComb2024)). Therefore, it can be conjectured that the HIT region is a circular area centred within the plane.
Overall flow field in the central plane of the container at
 $\textit{Re}_{\textit{jet}} = 4153$
. Arrows indicate the direction and magnitude of the time-averaged velocity
 $\overline {u}$
, and the contour shows the RMS velocity fluctuations
 $u'_\textit{rms}$
.

To determine the extent of the HIT region, the origin
 $P(0)$
is defined at the centre of the plane, and the mean squared velocity difference,
 $d(r,\theta )=\overline {[u(r,\theta )-u(0)]^2}$
, between
 $P(0)$
and all other points in the plane is then calculated, where
 $r$
and
 $\theta$
denote the magnitude of the position vector from
 $P(0)$
to a given point and the angle relative to the positive y axis, respectively. As shown in figure 4(a), contours of
 $d(r,\theta )$
exhibit an approximately concentric distribution near the centre of the plane, suggesting that the velocity statistics in this region possess a certain characteristic of isotropy. Furthermore, eight values of
 $\theta$
were fixed within the interval
 $[0,2\pi )$
at increments of
 $\pi /4$
, and samples were taken along the radial direction
 $r$
. The sampling directions and corresponding labels for each
 $\theta$
are shown in figure 4(a), while the evolution of
 $d(r,\theta )$
is presented in figure 4(b). For different values of
 $\theta$
,
 $d(r,\theta )$
exhibits nearly identical trends at small
 $r$
, consistent with the approximately concentric contours observed in figure 4(a). Using the criterion that the deviation of
 $d(r,\theta )$
at a given r does not exceed
 $10\,\%$
, the maximum radius can be defined as
 $r_{\textit{max}}=32.3$
mm. Considering the limited space available inside the magnet for image acquisition, the HIT region is preliminarily identified as a circular region with a radius of 30 mm centred in the plane. In the following, the uniformity and isotropy of the velocity field within this region will be further examined.
Mean squared velocity difference between the centre point
 $P(0)$
and any other points
 $P(r,\theta )$
in the plane
 $d(r,\theta )=\overline {[u(r,\theta )-u(0)]^2}$
at
 $\textit{Re}_{\textit{jet}} = 4153$
. (a) Contours of
 $d(r,\theta )$
. (b) Radial distribution of
 $d(r,\theta )$
under different
 $\theta$
, the sampling directions and corresponding labels for each
 $\theta$
being shown in (a).

Homogeneity can be assessed based on the spatial variation of RMS velocity
 $u_{\textit{rms}}$
(Hwang & Eaton Reference Hwang and Eaton2004; Huang et al. Reference Huang, Lv, Chen, Song, Yin and Wang2024). As shown in figure 5(a),
 $u_{\textit{rms}}$
is distributed within
 $\pm 7\,\%$
of the spatial average
 $\langle u_{\textit{rms}} \rangle$
, where
 $\langle \boldsymbol{\cdot }\rangle$
denotes the spatial average. These results indicate that the turbulent field within the HIT region exhibits approximate homogeneity. Meanwhile, figure 3 shows that the strong
 $u'_{\textit{rms}}$
region extends beyond the HIT region, while regions of strong mean flow are separated from the HIT region by the surrounding strong
 $u'_{ { rms}}$
region. Furthermore, figure 5(b) indicates that the mean flow
 $\overline {u}$
is an order of magnitude smaller than the RMS velocity
 $u_{\textit{rms}}$
in this region. Therefore, the injection of large-scale anisotropies and the influence of boundary layers during the decay process can be mitigated to some extent.
The spatial distribution of relative RMS velocity in the HIT area at
 $\textit{Re}_{\textit{jet}} = u_{\!\textit{jet}} d_0 / \nu = 4153$
: (a)
 $u_{\textit{rms}}/\langle u_{\textit{rms}} \rangle$
; (b)
 $\overline {u}/u_{\textit{rms}}$
.

Within this region, the RMS values and correlation functions
 $\overline {u_{\!y} u_z}$
of the velocity components were examined. Figure 6(a) shows that the RMS values of each velocity component follow similar growth trends, with inter-component differences below 3 %. Furthermore,
 $\sqrt {\langle \overline {u_{\!y} u_z}\rangle }$
also shown in figure 6(a), is less than 10 % of the RMS velocity components, indicating that the velocity components are uncorrelated. Therefore, the Reynolds stress tensor
 $\tau _{ij}$
can be approximated as a scalar multiple of the identity matrix:
 \begin{equation} \tau _{ij}=-\rho \ \overline {u_i u_{\!j}}\simeq \mathcal{C} \boldsymbol{I}, \end{equation}
where
 $\mathcal{C}$
is a constant,
 $\boldsymbol{I}$
is the identity matrix and
 $i,j \in \{y,z\}$
. This isotropic form of the Reynolds stress tensor provides strong evidence for the isotropy of the turbulence in the HIT region (De Karman & Howarth Reference De Karman and Howarth1938). Meanwhile, figure 6(b) presents the probability density functions (PDFs) of the velocity components at
 $\textit{Re}_{\textit{jet}} = 4153$
for all experimental conditions. The PDFs of the normalised components are nearly identical and follow a standard Gaussian distribution, further indicating the isotropy of the turbulence. Moreover, to examine isotropy across different turbulence scales, the contour of two-dimensional spectrum tensor,
 $\boldsymbol \varPhi (\boldsymbol{k}) = \hat {u}_i(\boldsymbol{k}) \hat {u}_i^*(\boldsymbol{k})$
(with the hat denoting the Fourier transform and the asterisk the complex conjugate,
 $\boldsymbol{k}$
being the wavevector in Fourier space), of the HIT region is shown in figure 6(c). Owing to spatial symmetry,
 $\boldsymbol \varPhi (\boldsymbol{k})$
is mirror-averaged about zero frequency. The contours of
 $\boldsymbol \varPhi (\boldsymbol{k})$
exhibit an approximately circular-arc distribution, indicating that, for any wavenumber magnitudes
 $k=|\boldsymbol{k}|$
, the energy remains nearly independent of the angle between
 $\boldsymbol{k}$
and the
 $y$
axis,
 $\varphi (\boldsymbol{k},\boldsymbol{y})$
. This suggests that isotropy is preserved across all resolved scales (Burattini et al. Reference Burattini, Zikanov and Knaepen2010).
Statistical values of velocity components within the HIT area. (a) The RMS and correlation function. (b) The PDF at
 $\textit{Re}_{\textit{jet}} = 4153$
. (c) Contour of two-dimensional spectrum tensor,
 $\boldsymbol \varPhi (\boldsymbol{k})$
;
 $\varphi (\boldsymbol{k},\boldsymbol{y})$
is the angle between the wavevector
 $\boldsymbol{k}$
and the y axis, and
 $k=|\boldsymbol{k}|$
.

Since
 $\textit{Re}_{\textit{jet}}$
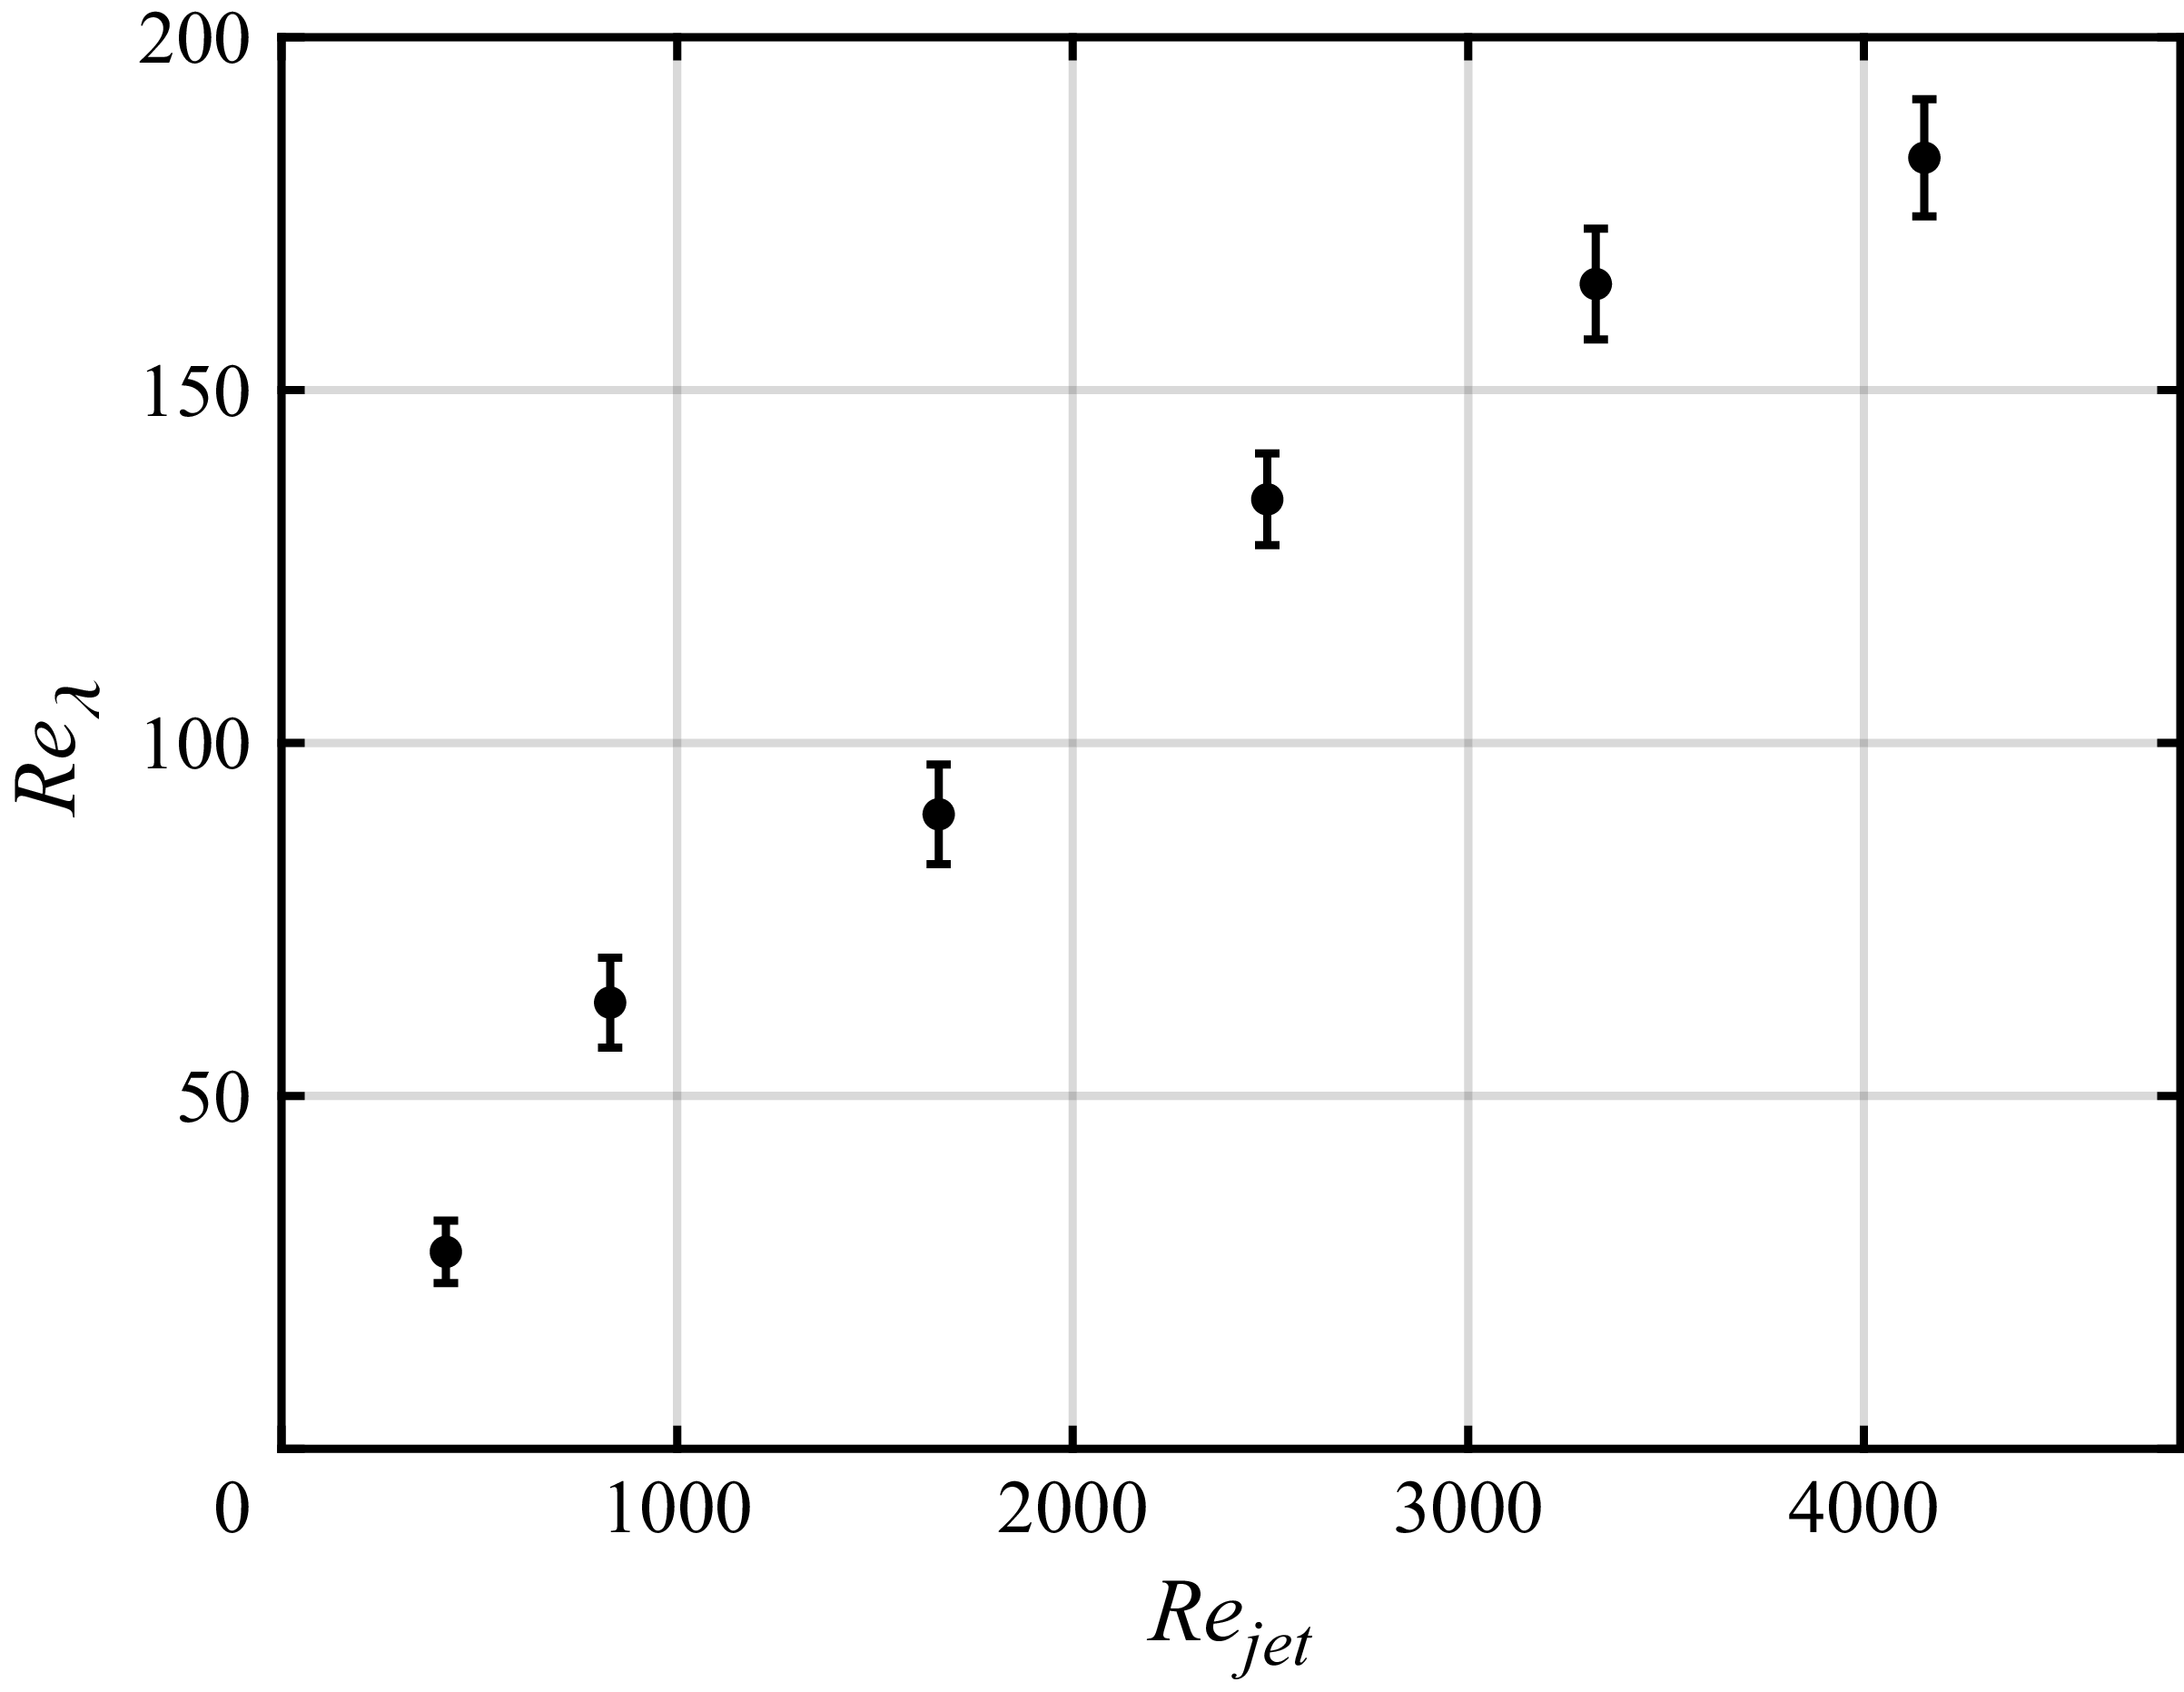
characterises the Reynolds number of the jet at the nozzle located at the corner of the container, it cannot fully represent the flow state after jet mixing in the central region of the container. Therefore, the Taylor microscale Reynolds number,
 $\textit{Re}_\lambda = \lambda u_{\textit{rms}} / \nu$
, in the HIT region is further evaluated and shown in figure 7. Here
 $\lambda = \sqrt {15 \nu u_{\textit{rms}}^2 / \varepsilon }$
is the Taylor microscale,
 $\varepsilon = 2\nu \langle s_{ij} s_{ij} \rangle$
is the turbulence dissipation rate, with
 $s_{ij} =( {1}/{2}) (\partial _{\!j} u_i + \partial _i u_{\!j})$
the strain-rate tensor. To account for the smallest dissipative eddies unresolved by the measurements, an approach analogous to large-eddy simulation was employed, in which the subgrid-scale (SGS) dissipation,
 $\varepsilon _{\textit{SGS}}=\langle 2 \nu _t s_{ij} s_{ij}\rangle$
, was modelled using the dynamic Smagorinsky model (Smagorinsky Reference Smagorinsky1963; Germano et al. Reference Germano, Piomelli, Moin and Cabot1991; Sheng et al. Reference Sheng, Meng and Fox2000). Here,
 $\nu _t= C_d \varDelta _g^2 (2 s_{ji}s_{ij})^{1/2}$
is the eddy viscosity and
 $\varDelta _g$
is the size of grids, where
 $\varDelta _g=\varDelta =0.3$
mm. The specific procedure used to calculate the dynamic coefficient
 $C_d$
from the experimentally obtained two-dimensional velocity field, as well as the convergence of the dynamic model in the present study, are discussed in detail in Appendix A. The corrected turbulent dissipation rate is then given by
 \begin{equation} \varepsilon = 2\nu \langle s_{ij} s_{ij} \rangle + \varepsilon _{\textit{SGS}}. \end{equation}
Under all experimental conditions,
 $\textit{Re}_\lambda$
increases with
 $\textit{Re}_{\textit{jet}}$
and falls within the range
 $\textit{Re}_\lambda \in [28, 183]$
.
Taylor microscale Reynolds number
 $\textit{Re}_{\lambda }$
in the HIT area.

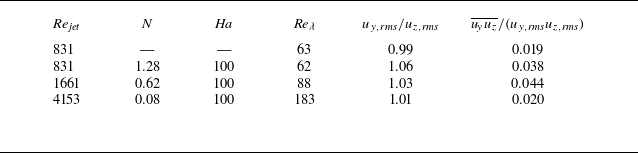
Under a strong magnetic field, the MHD effect introduces anisotropy into the driven turbulence, which serves as the initial condition for the decay problem and may influence the decay process. To assess this effect, experiments involving continuously driven turbulence under magnetic fields were conducted. Three representative conditions – high
 $N$
(
 $N=1.28$
), medium
 $N$
(
 $N=0.62$
) and low
 $N$
(
 $N=0.08$
) – were selected as initial fields for the decay studies. To control the effects of large-scale viscosity, the Hartmann number was fixed at
 $Ha = BL_0\sqrt {\sigma /\rho \nu } \approx 100$
. An experiment without a magnetic field was also conducted. The detailed parameters for these conditions are given in table 1. As shown in table 1, for each
 $N$
, the difference between
 $u_{y,\textit{rms}}$
and
 $u_{z,\textit{rms}}$
is less than 6 %, and the correlation functions normalised by
 $(u_{y,\textit{rms}}u_{z,\textit{rms}})$
are all less than 0.05. Thus, the anisotropy induced by the MHD effect does not significantly affect the isotropy of the initial field (Hwang & Eaton Reference Hwang and Eaton2004; Tan et al. Reference Tan, Xu, Qi and Ni2023; Gorce & Falcon Reference Gorce and Falcon2024).
Parameters for the experimental conditions at different
 $N$
.

Table 1. Long description
A table with six rows and seven columns comparing parameters for different experimental conditions. The columns are labeled Re_jet, N, Ha, Re_lambda, u_y,rms/u_z,rms, and u_y,u_z/(u_y,rms,u_z,rms). The rows present the following data: Row 1: Re_jet, 831; N, —; Ha, —; Re_lambda, 63; u_y,rms/u_z,rms, 0.99; u_y,u_z/(u_y,rms,u_z,rms), 0.019. Row 2: Re_jet, 831; N, 1.28; Ha, 100; Re_lambda, 62; u_y,rms/u_z,rms, 1.06; u_y,u_z/(u_y,rms,u_z,rms), 0.038. Row 3: Re_jet, 1661; N, 0.62; Ha, 100; Re_lambda, 88; u_y,rms/u_z,rms, 1.03; u_y,u_z/(u_y,rms,u_z,rms), 0.044. Row 4: Re_jet, 4153; N, 0.08; Ha, 100; Re_lambda, 183; u_y,rms/u_z,rms, 1.01; u_y,u_z/(u_y,rms,u_z,rms), 0.020.
Finally, to ensure the repeatability of the observations and reduce the influence of potential random errors, all decay experiments were repeated 10 times. The time-resolved results shown below are obtained by averaging over the 10 repeated experiments.
3. Decay of kinetic energy
Under the conditions listed in table 1, the turbulence was continuously driven for at least
 $30\,\mathrm{s}$
to ensure that the flow reached a statistically steady state (in a series of time windows before the jet was stopped, the turbulent kinetic energy and various homogeneity and isotropy indicators mentioned in § 2.3 within the HIT region showed no significant variation). Subsequently, the jets were shut down, and the decay process in the HIT region was recorded. The decay of integral turbulent kinetic energy
 $K=\langle u_iu_i \rangle /2 = \langle u_{\!y}^2 + 2u_z^2 \rangle /2$
for different values of
 $N$
is depicted in figure 8(a). Here, we assume
 $\langle u_z \rangle =\langle u_x \rangle$
, since the magnetic field does not induce anisotropy within the plane parallel to plane
 $\mathcal{V}$
. This assumption is further supported by the temporal evolution of the two-dimensional energy spectrum in plane
 $\mathcal{V}$
, shown in figure 10(b). The dimensionless time
 $t^*$
is normalised by the initial eddy turnover time
 $T = l_0 / u_0$
(Moffatt Reference Moffatt1967; Fan et al. Reference Fan, Chen and Ni2025). Portions of the curves in figure 8(a) exhibit approximately linear stages on a log–log plot, indicating power-law behaviour of the form
 \begin{equation} K \sim u^2 \sim (t^*)^{-m}, \end{equation}
where
 $m \gt 0$
is the decay exponent. Nonlinear regression analysis of these approximately linear stages suggests that for
 $N=1.28$
, two distinct power laws exist:
 $K / K_0 \sim {t}^{-0.52}$
, followed by
 $K / K_0 \sim {t}^{-1.53}$
, where
 $K_0$
represents
 $K$
at
 $t^* =0$
, the transition occurring around
 $t^* = 1$
. These exponents are close to those of Moffatt’s linear model
 $K \sim t^{-1/2}$
(Moffatt Reference Moffatt1967; Burattini et al. Reference Burattini, Zikanov and Knaepen2010; Fan et al. Reference Fan, Chen and Ni2025) and the decay power law for Saffman turbulence
 $K \sim t^{-3/2}$
(Saffman Reference Saffman1967; Gorce & Falcon Reference Gorce and Falcon2024). Notably, the
 $K \sim t^{-1/2}$
stage begins at
 $t^* \simeq 0.35$
, earlier than the dimensionless magnetic damping time
 $\tau ^* = \tau / T = 1/N \simeq 0.78$
. As for the non-magnetic case with similar
 $\textit{Re}_\lambda$
also shown in figure 8(a), only a
 $K / K_0 \sim {t}^{-1.58} \sim t^{-3/2}$
stage appears after
 $t^* \gtrsim 1$
. These results provide experimental evidence for the existence of the
 $-1/2$
scaling and suggest its association with the magnetic field. For
 $N=0.62$
, there is a stage with
 $K / K_0 \sim {t}^{-0.59}$
around
 $t^* \in (0.35,1)$
. Just like when
 $N=1.28$
, this stage still resembles
 $K \sim t^{-1/2}$
, albeit less distinctly. This is followed by a
 $K / K_0 \sim {t}^{-1.55} \sim t^{-3/2}$
stage after
 $t^* \gtrsim 1$
. For
 $N=0.08$
, similar to the situation without magnetic field, the decay process is largely consistent with Saffman turbulence (Saffman Reference Saffman1967; Gorce & Falcon Reference Gorce and Falcon2024), with
 $K / K_0 \sim {t}^{-1.56}\sim t^{-3/2}$
after
 $t^* \gtrsim 1$
.
(a) Decay of the kinetic energy for different interaction numbers (normalised by the initial kinetic energy). The power laws of Moffatt’s theory (
 $t^{-1/2}$
) and Saffman’s theory (
 $t^{-3/2}$
) are indicated by dashed lines. (b–d) Proportions of Joule dissipation
 $D_J$
, viscous dissipation
 $D_\varepsilon$
and boundary energy flux
 $\varPi _E$
in the decay process at
 $N=$
1.28, 0.62 and 0.08, respectively.

Furthermore, to explain the early onset of the
 $K \sim t^{-1/2}$
regime at
 $N \gt 1$
and its persistence when
 $N \sim 1$
, an energy budget analysis was conducted to disentangle the contributions of Joule dissipation and small-scale viscous dissipation. The total dissipation rate
 $D_{\textit{all}}$
in plane
 $\mathcal{P}$
was decomposed into contributions from Joule dissipation
 $D_J$
, viscous dissipation
 $D_\varepsilon$
and boundary energy flux
 $\varPi _E$
:
 \begin{equation} D_{\textit{all}}=D_J+D_\varepsilon +\varPi _E, \end{equation}
where a negative value of
 $\varPi _E$
indicates energy transfer from the surrounding fluid into the HIT region. According to Joule’s law, the Joule dissipation is given by
 \begin{equation} D_J=\int _V{\frac {\boldsymbol{J}^2}{\sigma }\ {\rm d}V}, \end{equation}
with
 $\boldsymbol{J} = \sigma (\boldsymbol{u} \times \boldsymbol{B})$
the current density in the fluid. Owing to the difficulty of directly evaluating the current density
 $\boldsymbol{J}$
from the 2D–2C velocity field, the spectral form mentioned by Burattini et al. (Reference Burattini, Zikanov and Knaepen2010) is employed:
 \begin{equation} D_J=2\frac {\sigma B^2}{\rho }\int _{\boldsymbol{k}}{\cos ^2({\theta })\boldsymbol{\varPhi }(\boldsymbol k)\ \textrm {d} \boldsymbol{k}}=2\frac {\sigma B^2}{\rho }\sum _{ \boldsymbol{\varOmega _k}}{\cos ^2({\theta })\boldsymbol{\varPhi }(\boldsymbol k)\ \delta _{\boldsymbol{k}}}, \end{equation}
where
 $\theta$
is the angle between
 $\boldsymbol{k}$
and the magnetic field
 $\boldsymbol{B}$
(
 $y$
axis),
 $\boldsymbol{\varOmega _k}$
denotes the set of all wavenumber vectors in the spectral space of the HIT region and
 $\delta _{\boldsymbol{k}}$
denotes the area of the discretised spectral element corresponding to each wavenumber. The viscous dissipation
 $D_\varepsilon$
was computed by summing the turbulent dissipation rate
 $\varepsilon$
in (2.2) over the HIT region
 $\varOmega _{ {H}}$
as
 \begin{equation} D_\varepsilon =\int _V{\varepsilon \ {\rm d}V}=\sum _{\varOmega _{ {H}}}{\varepsilon \ \varDelta ^2}. \end{equation}
Since the small-scale energy, which continuously decreases during the decay process, is more susceptible to noise, a sharp cutoff was applied to the velocity field with a cutoff wavenumber
 $k_c=0.3k_{\textit{max}}=3142\ \textrm { m}^{-1}$
(corresponding to a mesh size
 $\varDelta _c=1\ \textrm {mm}$
) when calculating
 $\varepsilon$
(Buzzicotti et al. Reference Buzzicotti, Linkmann, Aluie, Biferale, Brasseur and Meneveau2018). The SGS contribution was then modelled using the dynamic Smagorinsky model. Finally,
 $\varPi _E$
represents the energy flux through the boundary of the sampling region:
 \begin{equation} \varPi _E=\oint _{\varOmega _{ {H}}}{\boldsymbol{u}\left (\frac {\boldsymbol{u}^2}{2}\right )\boldsymbol{\cdot }\boldsymbol{n}\ \textrm { d}l}, \end{equation}
where
 $\boldsymbol{n}$
is the outward unit normal vector to the boundary of
 $\varOmega _{ {H}}$
.
As shown in figure 8(b), at
 $N=1.28$
, Joule dissipation dominates during the early stage of decay when
 $t^* \lesssim 1$
, after which viscous dissipation gradually becomes dominant in the later stages. This transition aligns closely with the boundary between the power-law regimes in the decay process, suggesting that the emergence of the
 $K \sim t^{-1/2}$
power law may be linked to the dominance of Joule dissipation. Additionally, the energy flux
 $\varPi _E$
plays a significant role at the onset of decay, as the surrounding fluid continues to transfer energy into the HIT region through inertia after the shutdown of the jets. Subsequently,
 $|\varPi _E|$
decreases significantly at
 $t^* \simeq 0.3$
, which coincides with the onset of the
 $K \sim t^{-1/2}$
stage. This observation suggests that the
 $K \sim t^{-1/2}$
stage may initially develop under a balanced MHD HIT condition, but the persistent energy injection delays its emergence. Moreover, consistent with Burattini et al. (Reference Burattini, Zikanov and Knaepen2010), Joule and viscous dissipations are nearly equivalent in the final decay stage.
Meanwhile, figure 8(c) shows that, for
 $N=0.62$
, Joule dissipation and viscous dissipation are of comparable magnitude when
 $t^*\lesssim 1$
. However, the
 $K\sim t^{-1/2}$
stage is not clearly observed under this condition, suggesting that sufficiently strong Joule dissipation is required for the emergence of the
 $K\sim t^{-1/2}$
scaling behaviour. Thereafter, viscous dissipation dominates the later stages, similar to
 $N=1.28$
. The evolution of
 $\varPi _E$
mirrors this case, explaining the emergence of the
 $K \sim t^{-1/2}$
stage. Finally, as shown in figure 8(d), at
 $N=0.08$
, viscous dissipation dominates throughout the decay process, resulting in a decay law similar to that observed in the absence of a magnetic field.
Thus, Joule dissipation plays a decisive role in the formation of the
 $K \sim t^{-1/2}$
power law during the early stage of decay. Moreover, under balanced MHD HIT initial conditions, the
 $K \sim t^{-1/2}$
power law can occur at
 $N \sim 1$
and before the magnetic damping time
 $\tau$
.
4. Anisotropy introduced by Joule dissipation
4.1. Anisotropic dissipation of the integrated kinetic energy
From the definition of
 $D_{\!j}$
(equation (3.4)), the directional dependence could be observed, which may lead to anisotropic decay of the velocity components perpendicular and parallel to the magnetic field. Therefore, the ratios of the squared velocity components perpendicular to and parallel to the magnetic field,
 $\varGamma = \langle u_{\!y}^2 \rangle / \langle u_z^2 \rangle$
, are shown in figure 9(a). At
 $N=1.28$
,
 $\varGamma$
increases during the initial decay stage and reaches its maximum value of
 $\varGamma = 1.54$
at
 $t^* \approx 1$
, after which it gradually decreases to unity. Figure 9(b) visually depicts this process through scatter plots of the velocity components perpendicular to and parallel to the magnetic field. Circular scatter-plot outlines indicate isotropy, while elongated circular outlines indicate anisotropy.
Anisotropic decay of the velocity components at
 $N=1.28$
. (a) Ratio
 $\varGamma = \langle u_{\!y}^2 \rangle / \langle u_z^2 \rangle$
. (b) Scatter plots of
 $u_{\!y}$
and
 $u_z$
(normalised by maximum velocity).

The evolution of the ratio and scatter plots suggests that during the decay process, the HIT first becomes anisotropic and then gradually returns to isotropy. By comparing the evolution trends of the various dissipation terms shown in figure 8(b), it can be observed that the stage during which turbulence tends towards anisotropy corresponds to a regime of strong Joule dissipation, whereas the stage of recovery towards isotropy is dominated by viscous dissipation. In both stages, the energy flux remains relatively weak. These observations suggest that Joule dissipation promotes the development of anisotropy in turbulence, whereas viscous dissipation may be associated with the restoration of isotropy. During the phase of stronger energy injection, the turbulence remains approximately isotropic to some extent, suggesting that energy inflow in this stage may contribute to maintaining isotropy. Meanwhile, the recovery of isotropy corresponds to the stage in which the relative contribution of Joule dissipation increases and becomes comparable to that of viscous dissipation in the late decay phase, as shown in figure 8(b). This suggests that the transient anisotropy may contribute to the temporary dominance of viscous dissipation during part of the decay process. Specifically, the `preferential damping’ induced by Joule dissipation preferentially consumes the perpendicular component
 $u_z$
in the early stage, resulting in a decrease in the energy proportion of
 $u_z$
, as shown in figure 9(a). However, viscous dissipation acts on both
 $u_{\!y}$
and
 $u_z$
simultaneously, rendering the impact of the reduced
 $u_z$
energy on viscous dissipation less pronounced than on Joule dissipation, and thereby leading to a relative decrease in the proportion of Joule dissipation, as shown in figure 8(b). Subsequently, since the energy of
 $u_{\!y}$
exceeds that of
 $u_z$
, it experiences stronger viscous dissipation and decays more rapidly until it reaches a level comparable to
 $u_{z}$
, at which point the turbulence restores isotropy. The diminishing energy proportion of
 $u_y$
results in a relative decrease in the contribution of viscous dissipation. Finally, as isotropy is restored, Joule and viscous dissipations are of equal importance.
Furthermore, when
 $N=0.62$
, the evolution trend of
 $\varGamma$
is similar to that observed for
 $N=1.28$
, although its magnitude remains relatively smaller, with a maximum value of
 $\varGamma = 1.27$
, as shown in figure 9(a). As discussed in § 3, the evolution of Joule dissipation and viscous dissipation during the decay process at
 $N=0.62$
follows a pattern similar to that observed at
 $N=1.28$
. This similarity provides a plausible explanation for the comparable evolution behaviour of
 $\varGamma$
in the two cases. Finally, for
 $N=0.08$
, although Joule dissipation remains significantly weaker than viscous dissipation (figure 8
d), weak anisotropy still emerges relative to the case without a magnetic field, with a maximum
 $\varGamma =1.08$
.
4.2. Anisotropic evolution of energy spectrum
Ratio
 $\varGamma$
captures only the anisotropic evolution of the integral energy components
 $\langle u_{\!y}^2 \rangle$
and
 $\langle u_z^2 \rangle$
of the turbulent field. The influence of Joule dissipation on velocity components in different directions and at different scales needs to be characterised instead using two-dimensional energy spectra
 $\boldsymbol{\varPhi }(\boldsymbol k)$
. Since
 $\varGamma$
exhibits similar evolution across different
 $N$
values, and the development of anisotropy undergoes similar underlying physical processes, the case
 $N=1.28$
, where anisotropy is most pronounced, is selected for further analysis. The corresponding two-dimensional energy spectra in plane
 $\mathcal{P}$
and plane
 $\mathcal{V}$
at different times are shown in figures 10(a) and 10(b), respectively. Meanwhile, figure 10(c) presents the non-magnetic-field case, which is used as a reference for comparison. Here
 $\varphi (\boldsymbol k,\boldsymbol x)$
and
 $\varphi (\boldsymbol k,\boldsymbol y)$
denote the angles between the wavevector
 $\boldsymbol k$
and the
 $x$
axis (in plane
 $\mathcal{V}$
) and the
 $y$
axis (in plane
 $\mathcal{P}$
), respectively. It should be noted that, due to the resolution limitations of the PIV system, regions where
 $\boldsymbol{\varPhi }(\boldsymbol k)\lt 3\times 10^{-9}$
are strongly affected by measurement noise. As a result, the contours of
 $\boldsymbol{\varPhi }(\boldsymbol k)$
at large
 $k$
become sparse when
 $t^*\gt 1$
. This does not reflect the true distribution of
 $\boldsymbol{\varPhi }(\boldsymbol k)$
; rather, it indicates that
 $\boldsymbol{\varPhi }(\boldsymbol k)\lt 3\times 10^{-9}$
in these regions.
Temporal evolution of the two-dimensional energy spectrum
 $\boldsymbol{\varPhi }(\boldsymbol k)$
during decay at (a)
 $N=1.28$
, plane
 $\mathcal{P}$
; (b)
 $N=1.28$
, plane
 $\mathcal{V}$
; (c) no magnetic field. A common colour scale is used for all cases at each time instant.

At
 $t^*=0$
, the contours of
 $\boldsymbol{\varPhi }(\boldsymbol k)$
in all three cases exhibit an approximately circular distribution, indicating that the turbulence in the initial stage of decay is close to isotropic.
Subsequently, at
 $t^*=1$
, corresponding approximately to the stage at which anisotropy is strongest as shown in figure 9(a), clear anisotropy is also observed in the two-dimensional energy spectrum of plane
 $\mathcal{P}$
. Specifically, the contours of
 $\boldsymbol{\varPhi }(\boldsymbol k)$
become approximately elliptical, with the major axis aligned along
 $\theta =\pi /2$
, and this anisotropy is observed across almost all resolved scales. This result indicates that wavevectors perpendicular to the magnetic field retain more energy, whereas wavevectors with smaller
 $\theta$
exhibit lower energy and are more strongly affected by Joule dissipation, as shown in (3.4). Meanwhile, the energy spectrum in plane
 $\mathcal{V}$
remains approximately isotropic. However, compared with the case without a magnetic field, the contours shift towards smaller
 $k$
, indicating a larger gradient of the energy spectrum. This phenomenon reflects the steepening of the energy spectrum induced by Joule dissipation. Furthermore, in plane
 $\mathcal{P}$
, at
 $\theta =\pi /2$
, the gradient of
 $\boldsymbol{\varPhi }(\boldsymbol k)$
is closer to that of the case without a magnetic field, whereas at
 $\theta =0$
, it is nearly identical to that in plane
 $\mathcal{V}$
. This indicates that the steepening of the energy spectrum primarily occurs in wavevectors aligned with the magnetic field direction.
Then, at
 $t^*=3$
, the contours of
 $\boldsymbol{\varPhi }(\boldsymbol k)$
in plane
 $\mathcal{P}$
become more circular compared with those at
 $t^*=1$
, suggesting a weakening of anisotropy. This is consistent with the isotropy recovery process shown in figure 9(a). However, relatively strong energy is still retained at wavenumbers corresponding to
 $\theta =\pi /2$
. Meanwhile,
 $\boldsymbol{\varPhi }(\boldsymbol k)$
remains approximately isotropic in plane
 $\mathcal{V}$
as well as in the absence of a magnetic field, whereas the energy spectrum in plane
 $\mathcal{V}$
exhibits a steeper gradient.
Finally, at
 $t^*=10$
,
 $\boldsymbol{\varPhi }(\boldsymbol k)$
in plane
 $\mathcal{P}$
does not fully recover isotropy. On the one hand, wavevectors near
 $\theta =\pi /2$
still retain relatively high energy; on the other hand, strong energy emerges at small
 $k$
near
 $\theta =0$
. Unlike at
 $t^*=1$
, the distribution of
 $\boldsymbol{\varPhi }(\boldsymbol k)$
in plane
 $\mathcal{P}$
at
 $\theta =\pi /2$
deviates from that of the case without a magnetic field, and the overall energy is relatively lower. Since Joule dissipation does not directly act on wavevectors at
 $\theta =\pi /2$
(because
 $\cos ^2{( \pi /2)}=0$
in (3.4), the contribution from this term becomes zero), this difference should arise from mechanisms other than Joule dissipation. Meanwhile, the gradient of
 $\boldsymbol{\varPhi }(\boldsymbol k)$
is larger than that in plane
 $\mathcal{P}$
at
 $\theta =0$
, and it also exhibits higher energy at small wavenumbers. This difference may primarily arise from the distinct spatial structures of
 $u_z$
in plane
 $\mathcal{P}$
.
In summary, in plane
 $\mathcal{P}$
,
 $\ \boldsymbol{\varPhi }(\boldsymbol k)$
undergoes a process of first developing anisotropy and then gradually recovering towards isotropy. However, unlike the results in § 4.1, where turbulence nearly recovers isotropy in the final decay stage,
 $\boldsymbol{\varPhi }(\boldsymbol k)$
still exhibits observable anisotropy. This anisotropy originates from differences in the energy distribution along
 $k$
at different
 $\theta$
values and suggests the possible anisotropy of the turbulent structure. Therefore, the isotropic energy recovery process discussed in § 4.1 applies only to integral energy components. Meanwhile,
 $\ \boldsymbol{\varPhi }(\boldsymbol k)$
in both plane
 $\mathcal{V}$
and the non-magnetic-field case remains approximately isotropic throughout the decay process, while
 $\boldsymbol{\varPhi }(\boldsymbol k)$
in plane
 $\mathcal{V}$
exhibits a steeper gradient. It is noteworthy that, during the early decay stage (
 $t^*=1$
), the distributions of
 $\boldsymbol{\varPhi }(\boldsymbol k)$
in plane
 $\mathcal{P}$
at
 $\theta =\pi /2$
and
 $\theta =0$
are approximately consistent with the corresponding distributions of
 $\boldsymbol{\varPhi }(\boldsymbol k)$
as a function of
 $k$
in the non-magnetic-field case and in plane
 $\mathcal{V}$
, respectively. However, significant deviations emerge in both cases during the later decay stage (
 $t^*=10$
). The causes of these deviations and the anisotropic evolution of the turbulent structure are further discussed in subsequent sections.
5. Energy transfer in wavenumber space
5.1. Angular energy transfer
In plane
 $\mathcal{P}$
,
 $\boldsymbol{\varPhi }(\boldsymbol k)$
exhibits a non-uniform distribution across different
 $\theta$
, with higher energy at
 $\theta =\pi /2$
. This suggests the possible existence of organised energy transfer along the angular direction. This also provides a plausible explanation for why, in § 4.2, the overall energy of
 $\boldsymbol{\varPhi }(\boldsymbol k)$
at
 $\theta =\pi /2$
in plane
 $\mathcal{P}$
is lower than that in the non-magnetic-field case during the later stages of decay. An efficient approach to investigating energy fluxes in Fourier space is the ‘mode-to-mode’ energy transfer framework (Domaradzki & Rogallo Reference Domaradzki and Rogallo1990), which has been extensively applied to study the anisotropic energy fluxes induced by MHD effects (Dar et al. Reference Dar, Verma and Eswaran2001; Alexakis et al. Reference Alexakis, Mininni and Pouquet2005; Teaca et al. Reference Teaca, Verma, Knaepen and Carati2009; Reddy et al. Reference Reddy, Kumar and Verma2014; Fan et al. Reference Fan, Chen and Ni2025). For a triad
 $(\boldsymbol{k}, \boldsymbol{p}, \boldsymbol{q})$
, the energy transfer rate between modes is given by
 \begin{equation} S(\boldsymbol k|\boldsymbol p|\boldsymbol q)=\text{Im}\{\left [\boldsymbol k \boldsymbol{\cdot }\hat {\boldsymbol u}(\boldsymbol q)\right ] \left [\hat {\boldsymbol u}^*(\boldsymbol k) \boldsymbol{\cdot }\hat {\boldsymbol u}(\boldsymbol p)\right ]\}, \end{equation}
where
 $\text{Im}$
denotes the imaginary part and the asterisk represents the complex conjugate. This quantity describes the energy transfer from mode
 $\boldsymbol{p}$
to mode
 $\boldsymbol{k}$
, mediated by mode
 $\boldsymbol{q}$
, with
 $\boldsymbol{k} = \boldsymbol{p} + \boldsymbol{q}$
.
Following (5.1), the angular energy transfer
 $\varPi (\theta )$
can be defined (Reddy et al. Reference Reddy, Kumar and Verma2014) to investigate anisotropic energy dynamics. As shown in figure 11(a), for a specific angle
 $\theta$
between the wavevector and the magnetic field,
 $\varPi (\theta )$
represents the energy transferred from wavevectors
 $\boldsymbol{p}$
with
 $\theta ^* \lt \theta$
(the
 $G$
region) to wavevectors
 $\boldsymbol{k}$
with
 $\theta ^* \gt \theta$
(the
 $R$
region) in plane
 $\mathcal{P}$
:
 \begin{equation} \varPi (\theta )=\sum _{\boldsymbol k \in R}\sum _{\boldsymbol p \in G}S(\boldsymbol k|\boldsymbol p|\boldsymbol q). \end{equation}
The Fourier space is divided into 18 equally spaced angular sectors for
 $\theta \in (0, \pi /2)$
. A sharp cutoff was also applied to the velocity field with a cutoff wavenumber
 $k_c=0.3k_{\textit{max}}$
. Since only 2D-2C data were collected in this study, the results obtained from (5.2) can only directly reflect the angular energy transfer within plane
 $\mathcal{P}$
. However, figure 10(b) shows that isotropy in plane
 $\mathcal{V}$
is well preserved throughout the decay process, suggesting that the energy spectrum in plane
 $\mathcal{P}$
remains approximately symmetric about the
 $y$
axis. Therefore, although (5.2) does not provide the exact angular energy transfer of the full three-dimensional turbulent field, it may still capture its general behaviour and exhibit a similar evolution trend.
(a) A schematic diagram for describing the definition of angular energy transfer
 $\varPi (\theta )$
. (b) Angular energy transfer
 $\varPi (\theta )$
at different decay times for
 $N=1.28$
(normalised by maximum absolute value).

Results at different times during the decay process for
 $N=1.28$
are shown in figure 11(b). Energy transfer
 $\varPi (\theta ) \lt 0$
, indicating that energy is transferred from wavevectors with larger
 $\theta$
to those with smaller
 $\theta$
, consistent with the distribution of
 $\boldsymbol{\varPhi }(\boldsymbol k)$
shown in figure 10(a). This indicates the indirect effect of Joule dissipation on wavevectors perpendicular to the magnetic field direction. Specifically, by directly dissipating the energy of wavevectors with
 $\theta \lt \pi /2$
, Joule dissipation induces angular energy inhomogeneity. This subsequently drives organised angular energy transfer, removing energy from wavevectors at
 $\theta \to \pi /2$
, and ultimately causes
 $\boldsymbol{\varPhi }(\boldsymbol k)$
in this direction to deviate from the non-magnetic-field case. Furthermore, as shown in figure 11(b), angular energy transfer gradually concentrates around
 $\theta \to \pi /2$
, which is similar to the conical energy flux identified by Fan et al. (Reference Fan, Chen and Ni2025). This suggests that, during the decay process, angular energy inhomogeneity gradually becomes concentrated near
 $\theta \to \pi /2$
.
5.2. Bidirectional energy transfer
One possible explanation for the strong large-scale (small
 $k$
) energy observed near
 $\theta =0$
in plane
 $\mathcal{P}$
, as shown in figure 9(a), is that the energy in this region is not entirely transferred forward to smaller scales. Instead, a possible inverse energy transfer towards larger scales may occur. The bidirectional energy transfer has been confirmed in numerical simulations of decaying and forced MHD turbulence (Knaepen & Moreau Reference Knaepen and Moreau2008; Fan et al. Reference Fan, Chen and Ni2025) and also observed in laboratory experiments by Baker et al. (Reference Baker, Pothérat, Davoust and Debray2018); see also Alexakis & Biferale (Reference Alexakis and Biferale2018) for a review. Following (5.1), for a specific wavenumber
 $k_0 \in k$
, the net energy transfer from large scales (
 $|\boldsymbol{p}| \lt k_0$
) to small scales (
 $|\boldsymbol{k}| \gt k_0$
) across this wavenumber is
 \begin{equation} \varPi _T(k_0)=\sum _{|\boldsymbol k| \gt k_0}\sum _{|\boldsymbol p| \lt k_0}S(\boldsymbol k|\boldsymbol p|\boldsymbol q). \end{equation}
A positive
 $\varPi _T(k_0)$
indicates direct energy transfer, whereas a negative value signifies inverse energy transfer. Furthermore, strong large-scale energy is primarily concentrated in the region where
 $\theta \sim 0$
, corresponding to the
 $z$
-direction component in physical space. Therefore, to distinguish the different effects of the magnetic field on energy transport in the
 $y$
and
 $z$
directions,
 $\varPi _T(k_0)$
is decomposed into
 $y$
and
 $z$
components:
 \begin{align}\varPi _T(k_0)_{y}=\sum _{|\boldsymbol k| \gt k_0}\sum _{|\boldsymbol p| \lt k_0}\mathfrak{I} \big\{\big [\boldsymbol k \boldsymbol{\cdot }\hat {\boldsymbol u}(\boldsymbol q)\big ] \big [\hat {\boldsymbol u_{\!y}}^*(\boldsymbol k) \boldsymbol{\cdot }\hat {\boldsymbol u_{\!y}}(\boldsymbol p)\big ] \big\},\end{align}
 \begin{align}\varPi _T(k_0)_{z}=\sum _{|\boldsymbol k| \gt k_0}\sum _{|\boldsymbol p| \lt k_0}\mathfrak{I} \big\{\big [\boldsymbol k \boldsymbol{\cdot }\hat {\boldsymbol u}(\boldsymbol q)\big ] \big [\hat {\boldsymbol u_z}^*(\boldsymbol k) \boldsymbol{\cdot }\hat {\boldsymbol u_z}(\boldsymbol p)\big ]\big\}.\end{align}
A sharp cutoff was also applied to the velocity field with a cutoff wavenumber
 $k_c=0.3k_{\textit{max}}$
.
The
 $y$
and
 $z$
components of the energy flux,
 $\varPi _T(k_0)_{y}$
and
 $\varPi _T(k_0)_{z}$
, respectively, at different times during the decay process for
 $N=1.28$
are shown in figures 12(a) and 12(b). Figure 12(a) indicates that, in the direction parallel to the magnetic field, energy is primarily transferred directly at small scales (
 $k_0 \gtrsim 600\ \mathrm{m}^{-1}$
), with a weaker direct transfer also present at large scales. Meanwhile, as shown in figure 12(b), although
 $\varPi _T(k_0)_{z}$
still exhibits significant direct transfer at small scales, inverse energy transfer is observed at large scales (
 $k_0 \lesssim 600\ \mathrm{m}^{-1}$
). Unlike the direct energy flux, the inverse energy flux does not decrease significantly over time. This behaviour suggests that the relative contribution of inverse energy transfer gradually increases during the decay process, distinguishing it from the anisotropy pattern induced by Joule dissipation discussed in § 4. Therefore, the inverse transfer of
 $\varPi _T(k_0)_{z}$
towards larger scales is more likely to give rise to another MHD effect:
 $u_z$
components tend to develop larger-scale flow structures in directions perpendicular to it (
 $y$
axis), manifested as vortex structures stretched along the magnetic field direction.
Inter-wavenumber energy flux
 $\varPi _{T}(k_0)$
at different decay times for
 $N=1.28$
(cube-root-scaled for visualisation). (a) Parallel component. (b) perpendicular component.

6. Anisotropic evolution of vortical structures
Davidson (Reference Davidson1997) provided the following physical interpretation of vortex stretching: the magnetic field elongates vortex structures along its direction due to the axial diffusion of angular momentum induced by the circumferential current (Davidson Reference Davidson1995). Figures 13(a) and 13(b) present the distribution of
 $u_z$
in plane
 $\mathcal{P}$
at
 $N=1.28$
for
 $t=0$
and
 $t=5$
, respectively. Initially (
 $t=0$
),
 $u_z$
displays an irregular, approximately random distribution. By
 $t=5$
, however, the contours of
 $u_z$
exhibit a denser spacing in the
 $z$
direction and a more sparse spacing in the
 $y$
direction. This suggests that the gradient of
 $u_z$
is ‘smoothed’ in the
 $y$
direction, thereby enhancing the coherence of
 $u_z$
along this direction; that is, small-scale vortices are forced to merge into larger-scale structures. This phenomenon reflects the bidirectional energy transfer described in § 5.2.
Contours of
 $u_z$
at
 $N=1.28$
when (a)
 $t^*=0$
and (b)
 $t^*=5$
.

Furthermore, the enhanced coherence also leads to an increase in the velocity autocorrelation along the
 $y$
direction, which is ultimately reflected in the growth of the integral length scale:
 \begin{equation} l_{\!y}=\int _0^{\infty } f_{z,y}(r)\, \textrm {d} r=\sum \frac {\langle u_z(y,z)u_z(y+r,z) \rangle }{u_{z,\textit{rms}}^2} \delta _r , \end{equation}
where
 $f_{z,y}(r)$
is the velocity autocorrelation function and
 $\delta _r$
denotes the spatial vector spacing. Davidson (Reference Davidson1997) made a quantitative prediction for the growth of
 $l_{\!y}$
showing that, when
 $N \gg 1$
,
 \begin{equation} l_{\!y} \sim l_0 t^{1/2}, \end{equation}
where
 $l_0$
is the initial vortex size. As shown in figure 14, for
 $N=1.28$
and
 $N=0.62$
, the parallel integral scale normalised by the container size,
 $l_{\!y} / L_0$
, exhibits a region of growth following approximately
 $l_{\!y} / L_0 \sim t^{1/2}$
. This shows good agreement with previous theoretical and numerical studies (Alemany et al. Reference Alemany, Moreau, Sulem and Frisch1979; Davidson Reference Davidson1997; Burattini et al. Reference Burattini, Zikanov and Knaepen2010; Fan et al. Reference Fan, Chen and Ni2025). In contrast, when
 $N=0.08$
, the growth rate of
 $l_{\!y}/L_0$
decreases compared with higher
 $N$
values and more closely resembles the experimental results in the absence of a magnetic field. Simultaneously, the anisotropy of the vortex structure increases continuously over time, which contrasts with the evolution of energy anisotropy discussed in § 4 and instead follows a law more similar to the inverse energy transfer described in § 5.2. Overall, unlike the dynamic balance among Joule dissipation, viscous dissipation and angular energy transfer, there appears to be no compensating mechanism capable of mitigating the anisotropy of the vortex structure, leading to a monotonically increasing trend.
Parallel integral length scale
 $l_{\!y}$
during the decay (normalised by the size of container). The deviation in the final stage at
 $N=1.28$
is due to the limited size of the sampling area.

7. Conclusion
In this experimental study, we have documented the free decay of MHD HIT at low magnetic Reynolds number and interaction parameters around unity. By employing a novel synthetic jet array to generate an isotropic turbulent initial condition within a uniform magnetic field of up to 3 T, and measuring the velocity field via PIV, we captured the two-stage decay process: an early regime dominated by
 $t^{-1/2}$
scaling for
 $t^*\lesssim 1$
, transitioning to a classical hydrodynamic-like
 $t^{-3/2}$
regime at later times. This result provides the first direct observational evidence for the
 $t^{-1/2}$
decay scaling of kinetic energy in freely decaying MHD HIT at the critical interaction parameter
 $N \sim 1$
, fulfilling a long-standing prediction by Moffatt (Reference Moffatt1967) that had previously lacked empirical validation. This finding further supports the applicability of this theory in the
 $N \sim 1$
regime.
In the early stage, Joule dissipation predominantly drives the energy loss, targeting turbulent motions with gradients perpendicular to the magnetic field. In the late stage, viscous dissipation overtakes as
 $u_{\!y}$
diminishes, resulting in a
 $t^{-3/2}$
decay law akin to hydrodynamic turbulence.
Anisotropic evolution manifests in multiple aspects of turbulence. The anisotropy of the integral kinetic energy exhibits a transient peak at
 $t^* \sim 1$
when
 $N=1.28$
, reaching a ratio of
 $1.54$
. This behaviour is driven by the selective damping of the velocity component perpendicular to the magnetic field and subsequently weakens due to viscous dissipation and angular energy transfer. However, scale-dependent anisotropy continues to develop: wavevectors parallel to the magnetic field retain higher energy at low wavenumbers, where inverse energy transfer also occurs. In physical space, this manifests as the continuous elongation of vortex structures along the magnetic field direction, accompanied by a
 $t^ {1/2}$
growth of the integral length scale parallel to the magnetic field.
Acknowledgements
The authors gratefully acknowledge Dr H. Zhu from Huazhong University of Science and Technology for his valuable discussions and suggestions.
Funding
This work was supported by the National Natural Science Foundation (NSFC) (grant nos. 12595301, 12388101, 52222607, 52176086), the National Key R&D Program of China (grant no. 2022YFE03130000), CAS Project for Young Scientists in Basic Research (grant no. YSBR-136) and the Young Talent Support Plan of Xi’an Jiaotong University.
Declaration of interests
The authors report no conflict of interest.
Appendix A. Application and convergence verification of the dynamic Smagorinsky model
To estimate the unresolved contribution to the kinetic-energy dissipation rate, the dynamic Smagorinsky model was employed. First, the measured velocity field was spatially filtered using a sharp cutoff with a cutoff wavenumber of
 $k_c=\pi /\varDelta _c$
, giving the resolved velocity
 $\tilde {u}_i$
. The resolved strain-rate tensor was then calculated as
 \begin{equation} \tilde {s}_{ij}=\frac {1}{2} \left (\frac {\partial \tilde {u}_i}{\partial x_{\!j}}+\frac {\partial \tilde {u}_{\!j}}{\partial x_i}\right )\!, \end{equation}
with its magnitude defined by
 \begin{equation} |\tilde {s}|=\left (2\tilde {s}_{ij}\tilde {s}_{ij}\right )^{1/2}. \end{equation}
The SGS stress tensor was modelled using the eddy-viscosity assumption:
 \begin{equation} \tau _{ij}^{\textit{sgs}}-\frac {1}{3}\tau _{kk}^{\textit{sgs}}\delta _{ij}= -2\nu _t \tilde {s}_{ij}, \end{equation}
where the eddy viscosity is given by (Germano et al. Reference Germano, Piomelli, Moin and Cabot1991)
 \begin{equation} \nu _t=C_d \varDelta ^2 |\tilde {s}|. \end{equation}
Here,
 $C_d=C_s^2$
is not prescribed as a constant, but is dynamically evaluated from the resolved velocity field.
To determine
 $C_d$
, a second test filter, denoted by
 $\widehat {(\boldsymbol{\cdot })}$
, was applied at a larger filter width
 $\hat {\varDelta }$
(cutoff wavenumber
 $\hat {k_c}=\pi /\hat {\varDelta }$
), typically chosen as
 $\hat {\varDelta }=2\varDelta$
. The Germano identity was used:
 \begin{equation} L_{ij}={\widehat {\tilde {u}_i\tilde {u}_{\!j}}}-{{\hat {\tilde {u}}}_i}{{\hat {\tilde {u}}}_{\!j}}, \end{equation}
where
 $L_{ij}$
is the resolved stress between the grid-filtered and test-filtered fields. Following the dynamic procedure, the model coefficient was obtained by minimising the error between the modelled and resolved stresses in a least-squares sense (Germano et al. Reference Germano, Piomelli, Moin and Cabot1991):
 \begin{equation} C_d=\frac {L_{ij}M_{ij}}{M_{ij}M_{ij}}, \end{equation}
where
 \begin{equation} M_{ij}=2\varDelta ^2\widehat {|\tilde {s}|\tilde {s}_{ij}}-2\hat {\varDelta }^2| \hat {\tilde {s}}|\hat {\tilde {s}}_{ij}. \end{equation}
In practice, spatial or ensemble averaging was applied to the numerator and denominator to improve statistical convergence:
 \begin{equation} C_d=\frac {\big \langle L_{ij}M_{ij}\big \rangle } {\big \langle M_{ij}M_{ij}\big \rangle }. \end{equation}
The SGS dissipation rate was then estimated as
 \begin{equation} \varepsilon _{\textit{sgs}}=-\tau _{ij}^{\textit{sgs}}\tilde {s}_{ij}=2\nu _t\tilde {s}_{ij}\tilde {s}_{ij}. \end{equation}
The total dissipation rate was therefore evaluated as the sum of the resolved viscous dissipation and the modelled SGS contribution:
 \begin{equation} \varepsilon =2\nu \left \langle \tilde {s}_{ij}\tilde {s}_{ij}\right \rangle +\varepsilon _{\textit{sgs}}. \end{equation}
This method enables direct estimation of the unresolved energy dissipation associated with scales smaller than the measurement or filtering scale from the resolved experimental velocity field. Accordingly, in § 3, this approach is used to supplement the SGS dissipation after applying a sharp cutoff with
 $k_c=0.3 k_{\textit{max}}=3140\ \textrm {m}^{-1}$
when calculating the viscous dissipation during the decay process.
To verify the applicability of the dynamic Smagorinsky model under all conditions considered in this study, convergence tests were performed near
 $k_c$
. Sharp cutoff was applied to the energy spectra at
 $t^* =0$
, 1, 3 and 10 for
 $N=1.28$
, using successive cutoff wavenumbers of
 $ k_c/ k_{\textit{max}}=0.1$
, 0.125, 0.15, 0.2, 0.25, 0.3, 0.5 and 1. This procedure generated a series of velocity fields at different effective grid scales, covering inertial-range spectral slopes ranging from
 $-5/3$
to
 $-3.8$
, as shown in figure 15(a), thereby encompassing essentially all application scenarios of the dynamic Smagorinsky model considered in this paper.
(a) Distribution of
 $\boldsymbol{\varPhi }(\boldsymbol k)|_{\theta =0}$
at different times for
 $N=1.28$
. The cutoff wavenumber
 $k_c=0.3 k_{\textit{max}}=3140\ \textrm {m}^{-1}$
is indicated by the solid grey line. For the curves with t* = 1, 3, 10, the portion where
 $k\gt k_c$
is smoothed using Gaussian smoothing to ensure observability. (b) Convergence ratios of the dynamic Smagorinsky model (solid line) and the classical Smagorinsky model (dotted line) near
 $k_c=0.3k_{\textit{max}}$
.

The dissipation rate
 $\varepsilon (k_c)$
was then calculated using the dynamic Smagorinsky model at each
 $k_c$
. The convergence coefficient was defined as
 \begin{equation} \varepsilon (k_{c}^ {(i)})/\varepsilon (k_{c}^ {(i-1)}), \end{equation}
where convergence is indicated as the ratio approaches unity. As shown in figure 15(b), compared with the classical Smagorinsky model with
 $c_d=c_s^2=0.0289$
, the dynamic Smagorinsky model exhibits good convergence near
 $k_c=0.3k_{max }$
for all
 $t^*$
. This indicates that the dynamic Smagorinsky model is suitable for estimating the SGS dissipation in the present study.
When
 $t^*=0$
, the inertial-range energy spectrum approximately follows the
 $-5/3$
power law, under which both the classical and dynamic Smagorinsky models show good applicability. As
 $k_c$
increases,
 $\varepsilon$
gradually increases and approaches the converged value.
However, when
 $t^*\gt 0$
, the energy spectrum becomes steeper, as shown in figure 15(a). Under these conditions, the classical Smagorinsky model produces significant over-dissipation, resulting in an overestimation of
 $\varepsilon$
. Although the over-dissipation effect weakens gradually as
 $k_c$
increases, convergence is still not achieved near
 $k_c=0.3k_{max }$
. In contrast, the dynamic Smagorinsky model partially alleviates the over-dissipation effect through the dynamic evaluation of
 $C_d$
, and therefore achieves approximate convergence near
 $k_c=0.3k_{max }$
.


 P
 y−z
 V
 x−z

 Rejet=4153
 u¯
 urms′

 P(0)
 P(r,θ)
 d(r,θ)=[u(r,θ)−u(0)]2¯
 Rejet=4153
 d(r,θ)
 d(r,θ)
 θ
 θ

 Rejet=ujetd0/ν=4153
 urms/⟨urms⟩
 u¯/urms

 Rejet=4153
 Φ(k)
 φ(k,y)
 k
 k=|k|
 Reλ
 N

 t−1/2
 t−3/2
 DJ
 Dε
 ΠE
 N=

 N=1.28
 Γ=⟨uy2⟩/⟨uz2⟩
 uy
 uz

 Φ(k)
 N=1.28
 P
 N=1.28
 V

 Π(θ)
 Π(θ)
 N=1.28

 ΠT(k0)
 N=1.28

 uz
 N=1.28
 t∗=0
 t∗=5

 ly
 N=1.28

 Φ(k)|θ=0
 N=1.28
 kc=0.3kmax=3140 m−1
 k>kc
 kc=0.3kmax


