I. INTRODUCTION
Titania (TiO2) is an important photoactive material with existing and potential uses in a wide variety of environmental and energy applications, such as photocatalytic oxidation of contaminants,Reference Liu, Zhang, Nishimoto, Murakami and Fujishima1–Reference Chen, Graham, Li and Gray4 photochemical water splitting under ultraviolet (UV) illumination,Reference Fujishima and Honda5, Reference Fujishima and Honda6 and dye-sensitized photovoltaic cells.Reference O’Regan and Gratzel7–Reference Kongkanand, Tvrdy, Takechi, Kuno and Kamat9 Nanostructured TiO2 with different morphologies has attracted great interest since unique properties emerge as a function of the shape and structure of TiO2 nanomaterials.Reference Vijayan, Dimitrijevic, Rajh and Gray10–Reference Hurum, Agrios, Gray, Rajh and Thurnauer12 Among them, one-dimensional (1D) TiO2 nanowires and nanorods have been synthesized on various substrates by vapor evaporation methods, i.e., metal–organic chemical vapor deposition,Reference Chen, Chen, Korotcov, Huang, Tsai and Tiong13, Reference Wu and Yu14 thermal evaporation,Reference Wu, Shih, Tseng, Hsu and Tsay15, Reference Wu, Shih and Wu16 and oblique angle deposition.Reference Smith, Mao, Lu, Catlett, Chen and Zhao17 Periodic TiO2 nanorod arrays have been synthesized on Si substrate by pulsed laser deposition, where a monolayer of polystyrene being used as templates.Reference Li, Fang, Koshizaki, Sasaki, Li, Gao, Shimizu, Bando and Golberg18 Vapor phase techniques, which normally require high growth temperatures, have several limitations, such as cost and energy consumption. Low-temperature solution-based methods, which are more suitable for large-scale production, have recently been developed to grow TiO2 nanorods on selected substrates.Reference Feng, Shankar, Varghese, Paulose, Latempa and Grimes19–Reference Wang, Chen, Leung, Luan, Liu, Tang, Yan, Zhang, Zapien, Bello and Lee23 In the study conducted by Liu and Aydil,Reference Liu and Aydil21 it was found that the TiO2 nanorods could only be fabricated on fluorine-doped tin oxide substrate. Subsequently, it was found TiO2 nanorods could be synthesized on different substrates by controlling several key growth parametersReference Kumar, Madaria and Zhou22 and by coating the substrates with a thin TiO2 layer.Reference Wang, Chen, Leung, Luan, Liu, Tang, Yan, Zhang, Zapien, Bello and Lee23 Here, we report a two-step fabrication procedure to grow rutile TiO2 nanorods on top of anatase TiO2 films on Si-based substrates and glass.
Crystalline TiO2 has three polymorphs: anatase, rutile, and brookite. Among them, rutile is the most stable phase and is normally prepared by calcination of anatase at high temperatures. As a photocatalyst, anatase TiO2 is usually considered to be more active than the crystalline rutile.Reference Prieto-Mahaney, Murakami, Abe and Ohtani24 Rutile has a lower bandgap (3.02 eV) than anatase (3.23 eV) and therefore, absorbs more strongly than anatase in the near-UV light and visible regions (360–415 nm). However, due to higher rates of electron and hole recombination, rutile normally has lower reactivity than anatase. In some cases when hole scavengers are present, it has also been observed as well that rutile has greater photocatalytic reactivity than anatase.Reference Kim, Lee, Lee, Lee and Lee25, Reference Habibi and Vosooghian26 Although photocatalytic activity is related, in part, to crystallinity and specific surface area, enhanced reactivity has been observed in mixed-phase nanocomposites of anatase and rutile.Reference Hurum, Agrios, Gray, Rajh and Thurnauer12, Reference Zachariah, Baiju, Shukla, Deepa, James and Warrier27–Reference Li and Gray32
In the present work, a thin layer (about 20–50 nm) of anatase TiO2 was first deposited on arbitrary substrates [(111)Si or borosilicate glass] followed by subsequent growth of rutile TiO2 nanorods. The morphology and interface structure were characterized by x-ray diffraction (XRD) and electron microscopy to identify the growth mechanism of TiO2 nanorods.
II. EXPERIMENTAL
Titanium isopropoxide (Ti[OCH(CH3)2]4, 97%), titanium butoxide (Ti[O(CH2)3CH3]4, 97%), hydrochloric acid (HCl, 37 wt%), tris(2-aminoethyl) amine (97%), and isopropyl alcohol were purchased from Sigma-Aldrich (St. Louis, MO) and used as received. The substrates, (111)Si wafers and glass slides, were ultrasonically cleaned in acetone and distilled water in sequence, and finally plasma cleaned in a plasma cleaner (South Bay Technologies, Arlington, VA) for 10 min. In a typical experiment, a mixture of 0.4 mL Ti[OCH(CH3)2]4, 1.4 mL isopropyl alcohol, and 0.1 mL tris (2-aminoethyl) amine was spin coated on selected substrates at spinning speed of 5000 turns per minutes. The coated substrates were then annealed in a furnace at 500 °C for 1 h. In a typical hydrothermal synthesis, 5 mL distilled water was mixed with 5 mL HCl under magnetic stirring in a Teflon-lined stainless steel autoclave (50-mL volume; Parr Instrument Co., Moline, IL). After stirring for 10 min, 0.17 mL Ti[O(CH2)3CH3]4 was added into the mixture as small droplets. The coated and annealed substrate was then placed into the Teflon-liner against the wall with an angle and the coated side was kept face down. The autoclave containing the substrate was sealed and annealed inside an oven at 100–175 °C for 1–10 h. After that, the autoclave was cooled to room temperature under tap water. The substrate was finally washed with distilled water, followed by air-drying in a nitrogen gas flow. Powder XRD patterns of the samples were taken with a Rigaku X-ray diffractometer (Rigaku Americas, The Woodlands, TX) in the diffraction angle 2θ range 5–80° using Cu Kα radiation (λ = 1.54056 Å). The morphology and structure of the grown TiO2 products were characterized by a Hitachi 4800-II scanning electron microscope (SEM; Hitachi, Tokyo, Japan) at 20 kV, a Hitachi H-8100 transmission electron microscope (TEM), and a Hitachi HD-2300A scanning transmission electron microscope (STEM).
III. RESULTS AND DISCUSSION
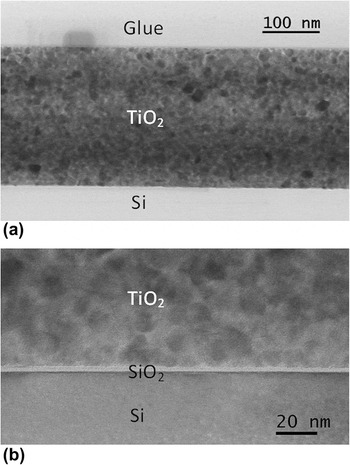
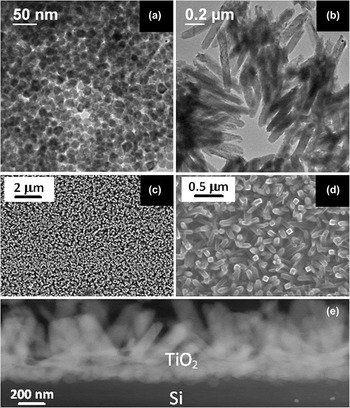
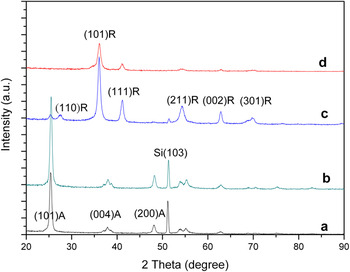
On a selected substrate, a thin layer of TiO2 film was first formed by spin coating the Ti[OCH(CH3)2]4 mixture and then annealing for 1 h at 500 °C in an air-flowed oven. From the cross-sectional TEM image of a thin film deposited on the Si(111) substrate, as shown in Fig. 1(a), we find that the typical thickness of the film is about 240 nm. The polycrystalline film consists of many small grains, the sizes of which are in the range of 10–20 nm, as measured from the high-resolution TEM image shown in Fig. 1(b). The nanoparticles are distributed nearly uniformly within the entire film, illustrating that there is no directional preference in the nucleation and growth of the TiO2 during annealing. There is normally a thin layer of amorphous SiO2 on Si substrate [Fig. 1(b)], which makes the growth of nanoparticles uniform while lessening the substrate influence. This is confirmed by the plan-view TEM image [Fig. 2(a)], which reveals uniform distribution of round particles. The crystalline structure of the nanoparticles was determined by powder XRD. Figure 3(a) shows the powder XRD patterns of the spin-coated thin film, which is indexed as the TiO2 anatase structure. No peaks of the TiO2 rutile structure were detected, demonstrating that most, if not all, of the formed TiO2 oxides exhibited the anatase structure.
(a) A low-magnification transmission electron microscope (TEM) image of titania (TiO2) on Si(111) substrate. TiO2 thin film has thickness of about 254 nm. (b) A high-magnification TEM image of the TiO2/SiO2 interface. Here, the SiO2 layer is seen clearly. The size of TiO2 nanoparticles is in the range of 10–20 nm.

(a) Plan-view TEM image of TiO2 anatase nanoparticles formed by spin coating and annealing. (b) TEM image of the TiO2 nanorods formed by hydrothermal reaction scratched from the Si substrate. (c) Low-magnification and (d) medium-magnification scanning electron microscope (SEM) images of TiO2 rods grown on anatase film at 175 °C for 3 h. (e) Z-contrast scanning transmission electron microscope (STEM) image of cross section of the TiO2 nanorods and Si interface, collected by annular dark-field detector.

X-ray powder diffraction patterns of the (a) as-grown TiO2 film by spin coating followed by 1 h annealing at 500 °C; growth of TiO2 nanorods by hydrothermal method for (b) 1 h; (c) 3 h, and (d) 6 h, respectively. Some of the rutile (R) and anatase (A) peaks are labeled.

TiO2 nanorods were then grown on the polycrystalline anatase–coated substrate by a hydrothermal method in an autoclave at 175 °C for 1, 3, and 6 h. The morphology and structure of the TiO2 nanorods were characterized by using both SEM and TEM. Figure 2(b) shows the TEM image of the nanorods synthesized at 175 °C for 3 h. The samples were mechanically detached from the substrate and put onto a TEM grid coated with a thin film of amorphous carbon. The SEM images of the nanorods synthesized at 175 °C for 3 h are shown in Figs. 2(c) and 2(d). The analysis of these images reveals that the nanorods have an average length of about 700 nm and diameter of about 80 nm. A cross-sectional STEM image of the nanorods and interface is shown in Fig. 2(e), where the Z-contrast image was collected by a high-angle annular dark-field detector. The nanorods grow upward and are connected with nearly rounded particles at the end adjacent to the substrate. Compared to Fig. 1, which consists of 10–20 nm anatase nanoparticles before the growth of nanorods, the particles in Fig. 2(e) have grown to a range of 50–100 nm.
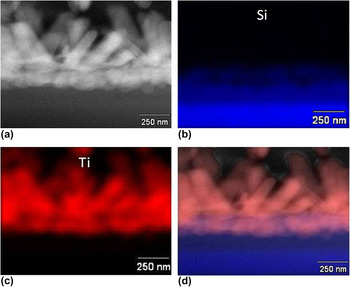
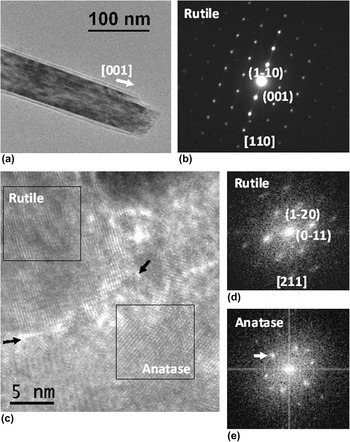
The crystalline structure of the nanorods was studied by both XRD and electron diffraction. Powder XRD patterns of samples grown at 175 °C for 1, 3, and 6 h are shown in Figs. 3(b)–3(d), respectively. The diffraction peaks in these patterns can be indexed as either anatase or rutile phases. With increasing reaction time, the peaks assigned to the anatase phase gradually disappeared and only rutile peaks could be found after 6 h of hydrothermal treatment. The loss of anatase TiO2 may indicate that there was a phase transformation from anatase nanoparticles that was laid down initially to rutile structure with increasing reaction time. For randomly oriented TiO2 nanocrystals, the most intense reflection should be the (110). However, here in the powder XRD pattern collected from TiO2 nanorods, the (101) reflection is the most intense one [Figs. 3(c) and 3(d)]. This is because the growth axis of TiO2 nanorods is along the [001] direction as revealed by electron diffraction [Figs. 5(a) and 5(b)] and the (101) planes are the side wall of rod-shaped TiO2 nanorods which are preferentially exposed to x-ray. X-ray energy dispersive spectroscopy (EDS) mapping was used to identify the composition of the rounded particles as shown in Fig. 4. Figure 4(a) is a STEM image of the Si substrate and TiO2 interface. Figures 4(b) and 4(c) show the EDS maps of Si and Ti, respectively, while an overlay map by combining Figs. 4(a)–4(c) is shown in Fig. 4(d). These data indicate that the round particles at the end of the nanorods are Ti rich, and the XRD data [Fig. 3(c)] show that the majority of TiO2 phase was rutile with a small portion of anatase still remaining. Thus, the anatase nanoparticles (10–20 nm) in the as-deposited film (Fig. 1) were transformed to larger rutile particles (50–100 nm) after hydrothermal reaction [Fig. 2(e)] illustrating that a film coarsening occurs simultaneously with the anatase-to-rutile transformation. In the acidic environment of HCl, the formation of 1D rutile nanostructure is more favorable than that of anatase.Reference Liu and Aydil21 Similar phenomenon has also been observed in other studies of the phase transformation of TiO2 nanoparticles.Reference Gribb and Banfield33
Energy dispersive spectroscopy mapping of the TiO2 rods treated at 175 °C grown for 3 h. (a) Z-contrast STEM image, (b) Si map, (c) Ti map, and (d) mixed map of the combinations of (a) to (c).

(a) TEM image of a rutile TiO2 nanorod and (b) its corresponding selected-area electron diffraction pattern. The growth direction of the rod can be identified as along the [001]. (c) High-resolution electron microscopic image of the interface of rutile TiO2 nanorod and anatase TiO2 nanoparticle. The interface is tilted and incoherent. (d) and (e) are corresponding Fourier transform of the area shown by rectangles in (c), which can be indexed by using either rutile or anatase structure.

Electron diffraction was used to identify the growth direction of the nanorods. A TEM image of a TiO2 nanorod and its corresponding electron diffraction are shown in Figs. 5(a) and 5(b), respectively. The diffraction pattern is indexed as the [110] zone axis of rutile TiO2. Comparing the TEM image and diffraction pattern, the growth direction of the rutile TiO2 nanorods is consistent with the [001], as has been observed previously in the synthesis of TiO2 nanorods.Reference Liu and Aydil21 According to the calculations derived from counting the numbers of corners and edges of the coordination polyhedra available, the growth rates of the different crystal faces differ and follow the sequence (110)<(100)<(101)<(001).Reference Cheng, Ma, Zhao and Qi34 This likely explains why the growth direction of the nanorods is along the [001].
In the absence of the polycrystalline anatase base layer, the rutile nanorods do not grow directly on Si substrate using the hydrothermal method with the same growth parameters as used here. This indicates that the anatase layer serves as the nucleation layer for the growth of rutile TiO2. A structural study of the interface of rutile and anatase may provide us some clues to understand the function of the anatase layer. In the sample grown for 3 h [Fig. 3(c)], the interface between large rod-like rutile particle and small rounded anatase particles was found in an area close to the substrate, as shown in Fig. 5(c). The structures of the nanoparticles were identified by employing the Fourier transform of the high-resolution electron microscopic image and calculating the d-spacing of the crystalline lattice, which is measured with the peaks shown in the diffractogram in Figs. 5(d)–5(e). As shown in Fig. 5(d), the [211] direction of the rutile particle is along the incident beam direction. The anatase nanoparticle cannot be indexed as any low-order zone (the center symmetry in intensity shown in the diffractogram was imposed by the Fourier transform). However, the lattice plane of 0.35 nm [indicated by an arrowhead in Fig. 5(e)] is a typical spacing of the (110) plane of anatase. We also find that the interface is not coherent. There is a distorted and defect-concentrated area along the interface, as shown by the black arrows [Fig. 5(c)]. Such a defect-dense area may be the reaction front where the anatase nanoparticles transformed into rutile TiO2.
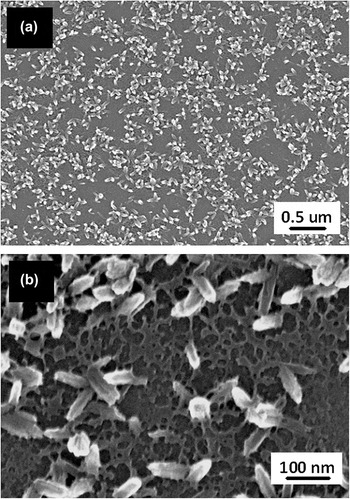
The SEM image of a sample grown for 1 h at 175 °C was shown in Fig. 6(a), where the nanorods were still in their early stage of growth. There is a network above which nanorods growth is found. The network consists of discontinuous plate-like materials as revealed by the high-magnification SEM image in Fig. 6(b). Since the hydrothermal temperature is relatively high (175 °C), part of the anatase TiO2 layer may also be dissolved in the strong acidic environment, making it a discontinuous layer. The rutile TiO2 with plate morphology may then first nucleate and form on the pre-existing anatase layer. This would in turn provide preferred sites for the further growth of TiO2 nanorods.
SEM images of TiO2 nanorods grown at 175 °C for 1 h at (a) low magnification and (b) medium magnification, respectively. There forms a thin and discontinuous layer on which nanorods grow.

IV. CONCLUSIONS
TiO2 nanorods with rutile structure were grown by a low-temperature hydrothermal method on Si-based substrates coated with a thin layer of anatase TiO2 nanoparticles fabricated by spin coating and thermal annealing. At growth temperature of 175 °C, the growth of rutile nanorods was accompanied by the phase transformation of this base layer from anatase to larger rutile nanoparticles. A thin layer of discontinuous plate-like rutile phase was first formed on which the rutile TiO2 nanorods grew. The anatase layer is essential for the growth of the rutile nanorods by providing nucleation sites.
ACKNOWLEDGMENTS
The research was supported by a Northwestern University’s Initiative for Sustainability and Energy at Northwestern seed grant and U.S. Department of Energy, under Contract DE-AC02-06CH11357 (Institute for Catalysis in Energy Processes). The electron microscopy work was performed in the Electron probe instrumentation center facility of NUANCE Center (supported by NSF Nanoscale Science & Engineering Center, NSF Materials Research Science & Engineering Center, Keck Foundation, the State of Illinois) at Northwestern University.