Background
Dispersal is a key ecological process affecting population, species and community dynamics over small and large spatial scales. For species of ecological and economic importance, such as pest insects and their natural predators, it is essential to understand how dispersal behaviour leads to observed population distributions in order that effective management strategies can be implemented at appropriate scales (Petrovskii et al., Reference Petrovskii, Petrovskaya and Bearup2014).
Ground beetles (Coleoptera: Carabidae) are widely recognized to be important components of terrestrial ecosystems, playing a major role in the food web as both predators of a wide range of invertebrates and as prey to a number of bird and mammal species, some of which are of conservation concern (Holland et al., Reference Holland, Hutchison, Smith and Aebischer2006; Pocock and Jennings, Reference Pocock and Jennings2007). Carabids are also considered to be of bio-indicative value since they are sensitive to cultivation impacts, and particularly to the intensification of agricultural practices (Rainio and Niemelä, Reference Rainio and Niemelä2003). For these reasons, and because of their importance in the natural control of invertebrate pests and weed populations in agricultural land, the biology and ecology of species within Carabidae have been extensively studied (Kromp, Reference Kromp1999; Bohan et al., Reference Bohan, Boursault, Brooks and Petit2011). Critical to their function in controlling pest populations within fields is their dispersal ability. Many carabid species are highly mobile with movement mainly via walking, though the flight may be used under some circumstances, e.g. longer distance dispersal (Lövei and Sunderland, Reference Lövei and Sunderland1996). Field margins act as refuges for natural enemy species and movement occurs into cropped fields from these semi-natural areas (Thomas et al., Reference Thomas, Green and Marshall1997). As such, ‘beetle banks’ have been specifically created in farmland across the UK and Europe as overwintering habitats for beneficial invertebrates (Thomas et al., Reference Thomas, Wratten and Sotherton1991; MacLeod et al., Reference MacLeod, Wratten, Sotherton and Thomas2004). Knowledge of dispersal into fields from such areas and the effects of biological characteristics of individual species and how this leads to their observed distribution in agricultural landscapes is key to understanding the maintenance of metapopulations and the dynamics of predator–prey interactions (Petrovskii et al., Reference Petrovskii, Petrovskaya and Bearup2014; Bastola and Davis, Reference Bastola and Davis2018; Banks et al., Reference Banks, Laubmeier and Banks2020). This is particularly relevant in the context of climate change and habitat fragmentation, for which it is important to be able to predict the effects of changes to the environment on species of economic and ecological importance.
Previous studies investigating ground beetle dispersal have used mark-release-recapture techniques (Rijnsdorp, Reference Rijnsdorp1980; Thomas et al., Reference Thomas, Green and Marshall1997, Reference Thomas, Parkinson and Marshall1998). This approach results in the estimation of movement distance being limited to the maximum distance at which pitfall traps are set. Others have used harmonic radar to track individuals (Wallin and Ekbom, Reference Wallin and Ekbom1994; Lövei et al., Reference Lövei, Stringer, Devine and Cartellieri1997). These are similar in principle to mark-release-recapture because individuals are tagged and then located at a later time point. However, neither of these approaches gives fine-scale detail of walking movements since observation frequencies are low and often the majority of individuals released are not recovered. To try to overcome these limitations, individual-based simulation models have been used, incorporating spatial and landscape parameters for forest carabids (Jopp and Reuter, Reference Jopp and Reuter2005) and common agricultural (Pterostichus) species (Firle et al., Reference Firle, Bommarco, Ekbom and Natiello1998; Benjamin et al., Reference Benjamin, Cédric and Pablo2008), or based on population-level estimates of random walk movement parameters for a range of insects including ground beetles (Byers, Reference Byers2001). Although such models may try to take into account factors that are likely to affect distribution and abundance in the field, they are frequently based on data collected from field studies like those described above, which do not explicitly consider inter- and intra-individual variation in walking behaviours and how this affects dispersal distances. This is particularly relevant when considering pest species and their natural predators since it is important to know the extent of dispersal in differing situations i.e. under alternate cultivation practices. Studies using high-resolution movement data in a homogenous featureless environment have been recorded for mealworm beetles (Tenebrio molitor) (Reynolds et al., Reference Reynolds, Leprêtre and Bohan2013), where a power law distribution in the beetles’ step-lengths was found. In the same study, highly linear movements in Poecilus beetles were reported, although a full analysis for this species was not undertaken.
Recent advances in tracking technology mean that fine-scale position data can now be more easily collected from real animal movement paths in both the field and laboratory. In this study, we used a laboratory-based technique, a locomotion compensator, to measure fine-scale walking movements of Poecilus cupreus, one of the most common carabid species in European agricultural land (Kromp, Reference Kromp1999; Luff, Reference Luff and Holland2002). It is a diurnal, macropterous species which is active in spring-summer and is found in relatively dry warm habitats such as open grassland and agricultural fields (Luff, Reference Luff1998). Its abundance and dominance in these habitats make it an ideal species for investigating movement behaviour within- and between- individuals. Although the locomotion compensator is not a new technique (Kramer, Reference Kramer1976), to our knowledge it has not been used in this way before. It should be noted that the artificial setup of the experiment results in limitations as to the conclusions which can be reliably drawn from these results. Whilst such problems regarding the artificiality and low generality of the setup are a recognized flaw in model systems (Carpenter, Reference Carpenter1996) and lead to the common ‘replication vs realism’ debate (Schindler, Reference Schindler1998; Srivastava et al., Reference Srivastava, Kolasa, Bengtsson, Gonzalez, Lawler, Miller, Munguia, Romanuk, Schneider and Trzcinski2004) there are inherent benefits of such model systems, such as repeatability and ease of experimentation (Levins, Reference Levins1966; Srivastava et al., Reference Srivastava, Kolasa, Bengtsson, Gonzalez, Lawler, Miller, Munguia, Romanuk, Schneider and Trzcinski2004). In this experimental setup, the use of the TrackSphere locomotion compensator allows for data to be collected with relative ease and accuracy, giving data with high frequency and greater accuracy than would be expected from simple video analysis or from capture-recapture techniques. Similarly, the setup removes any impedimentary effect a tracker attached to an individual would have.
Here we chose to focus on measuring the dispersal potential of P. cupreus as well as discerning whether there were significant differences in general movement patterns in an unobstructed environment. We give a detailed analysis of individual movement of P. cupreus which the novel use of the TrackSphere allows. We quantify the observed movement using standard path analysis measures and explore the level of inter- and intra-individual variation. We subsequently demonstrate how simple random walk movement models, parameterized at the population level from the observed data, do not adequately explain the observed dispersal behaviour.
Methods
Insect collection and care
Adult P. cupreus were captured daily using pitfall traps from a permanent grazed grassland in Dartington, Devon, UK (1.7-acre field, centred at OS grid reference SX 78366 62988) between 8 and 20 July 2012, coinciding with main activity period for this species. Pitfall traps consisted of 200 ml white plastic cups dug into the ground, flush with the soil surface. Each trap was covered by a plastic lid to prevent flooding during wet weather. No preservative or liquid was used inside the pitfall traps in order to retain live individuals. The beetles were maintained at 16°C in tanks containing soil, leaf litter and dead wood in mixed populations with other ground beetle species and fed on fresh meat-based (chicken) cat food every few days until needed for the experiment, whereby identified individuals were transferred to separate 20 ml universal tubes containing a small piece of damp tissue paper (Luff, Reference Luff and Holland2002).
Tracking beetle walking behaviour
Use of trackSphere
A locomotion compensator (Tracksphere LC 300, Syntech, Hilversum, The Netherlands; Syntech, 2004) was used to track and measure the movement paths (measured in mm) for each beetle. The locomotion compensator consists of a lightweight sphere (300 mm diameter), with a camera located directly above to measure displacements. The sphere rotates opposite to these displacements by means of two electric motors, and two encoders contacting the sphere transmit the rotational movements to a computer as incremental (x, y) coordinates, which are recorded 10 times s−1. The sphere is supported by a noiseless aerostatic spherical bearing.
Experimental design
Beetles were tested three times each between 1 and 8 August 2012. Between trials, individuals were maintained at 16°C. Experiments were carried out between 16.8 and 24.2°C, recorded at the beginning of each trial, and were illuminated by a fluorescent light located directly behind the sphere. A white cardboard screen was placed around the sphere to prevent external influences affecting beetle behaviour and the sphere was wiped clean with 70% ethanol after each trial. Individual beetles were allowed to acclimatize on the sphere for 1 min before recording began for 10 min. However, due to the sphere failing to properly compensate for the movements of eight beetles for the full 10-min period, the final analysis was performed on data recorded over a 5-min span starting from 10 seconds into the track and finishing 5 min later (this period of data collection was available for all experimental trials). Trials in which beetles did not move at all during this period were removed from the dataset completely, giving data from 22 individual beetles. In summary, walking movement data ((x, y) coordinates recorded 10 times s−1) over a 5-min period were obtained for 22 individual beetles, repeated three times each (66 observations in total).
Initial processing of movement path data
The raw movement data, recorded at a frequency of 10 Hz was found to include artificial ‘pixelisation’ of the movement paths, leading to artificially high turning angles being recorded. To overcome this problem, the raw data were sub-sampled at a sampling rate of 1 Hz to smooth the movement paths and avoid pixelization effects (i.e. only every 10th location recorded in the raw data was included in the analysis). The choice of 1 Hz as the sub-sampling rate was essentially an arbitrary choice, however other sampling rates of 2, 0.5 and 0.2 Hz (i.e. respectively only every 5th, 20th or 50th raw data point included) were also considered but did not qualitatively change the results (online Supplementary Tables S1–10, Additional File 3).
A minimum instantaneous speed threshold was used to classify bouts of ‘purposeful movement’ (movement associated with relocation in space) and ‘non-movement’ (periods where beetles either paused to reorient or stopped moving entirely, leading to zero or limited relocation in space). This gave an objective way to classify each step of the movement paths with instantaneous speeds above the minimum threshold classified as movement and those below as periods of non-movement. A range of minimum speed threshold values was considered: 5, 10 and 15 mm s−1, as well as no minimum speed threshold. The minimum speed threshold of 5 mm s−1 was used for the main analysis as this retained the largest number of data points while allowing the objective classification of bouts. The use of different minimum speed thresholds did not lead to qualitatively different results (online Supplementary Tables S1–10, Additional File 3).
Using this threshold (5 mm s−1) lead to movement and stationary bouts of very short length due to noise in the recording and processing of the data. To account for this the movement data were smoothed, with bouts of movement and non-movement identified using a cumulative sum algorithm similar to Knell and Codling (Reference Knell and Codling2012) (see Additional File 1). Bouts that had not ended by the end of the experiment were considered to have been artificially truncated and hence were not included in the analysis presented in the main paper, since their true duration was indeterminable. However, results were qualitatively similar if these truncated bouts were included, under the assumption that they terminated at the endpoint of the experiment (see Additional File 4).
Statistical analysis
Basic path analysis measures
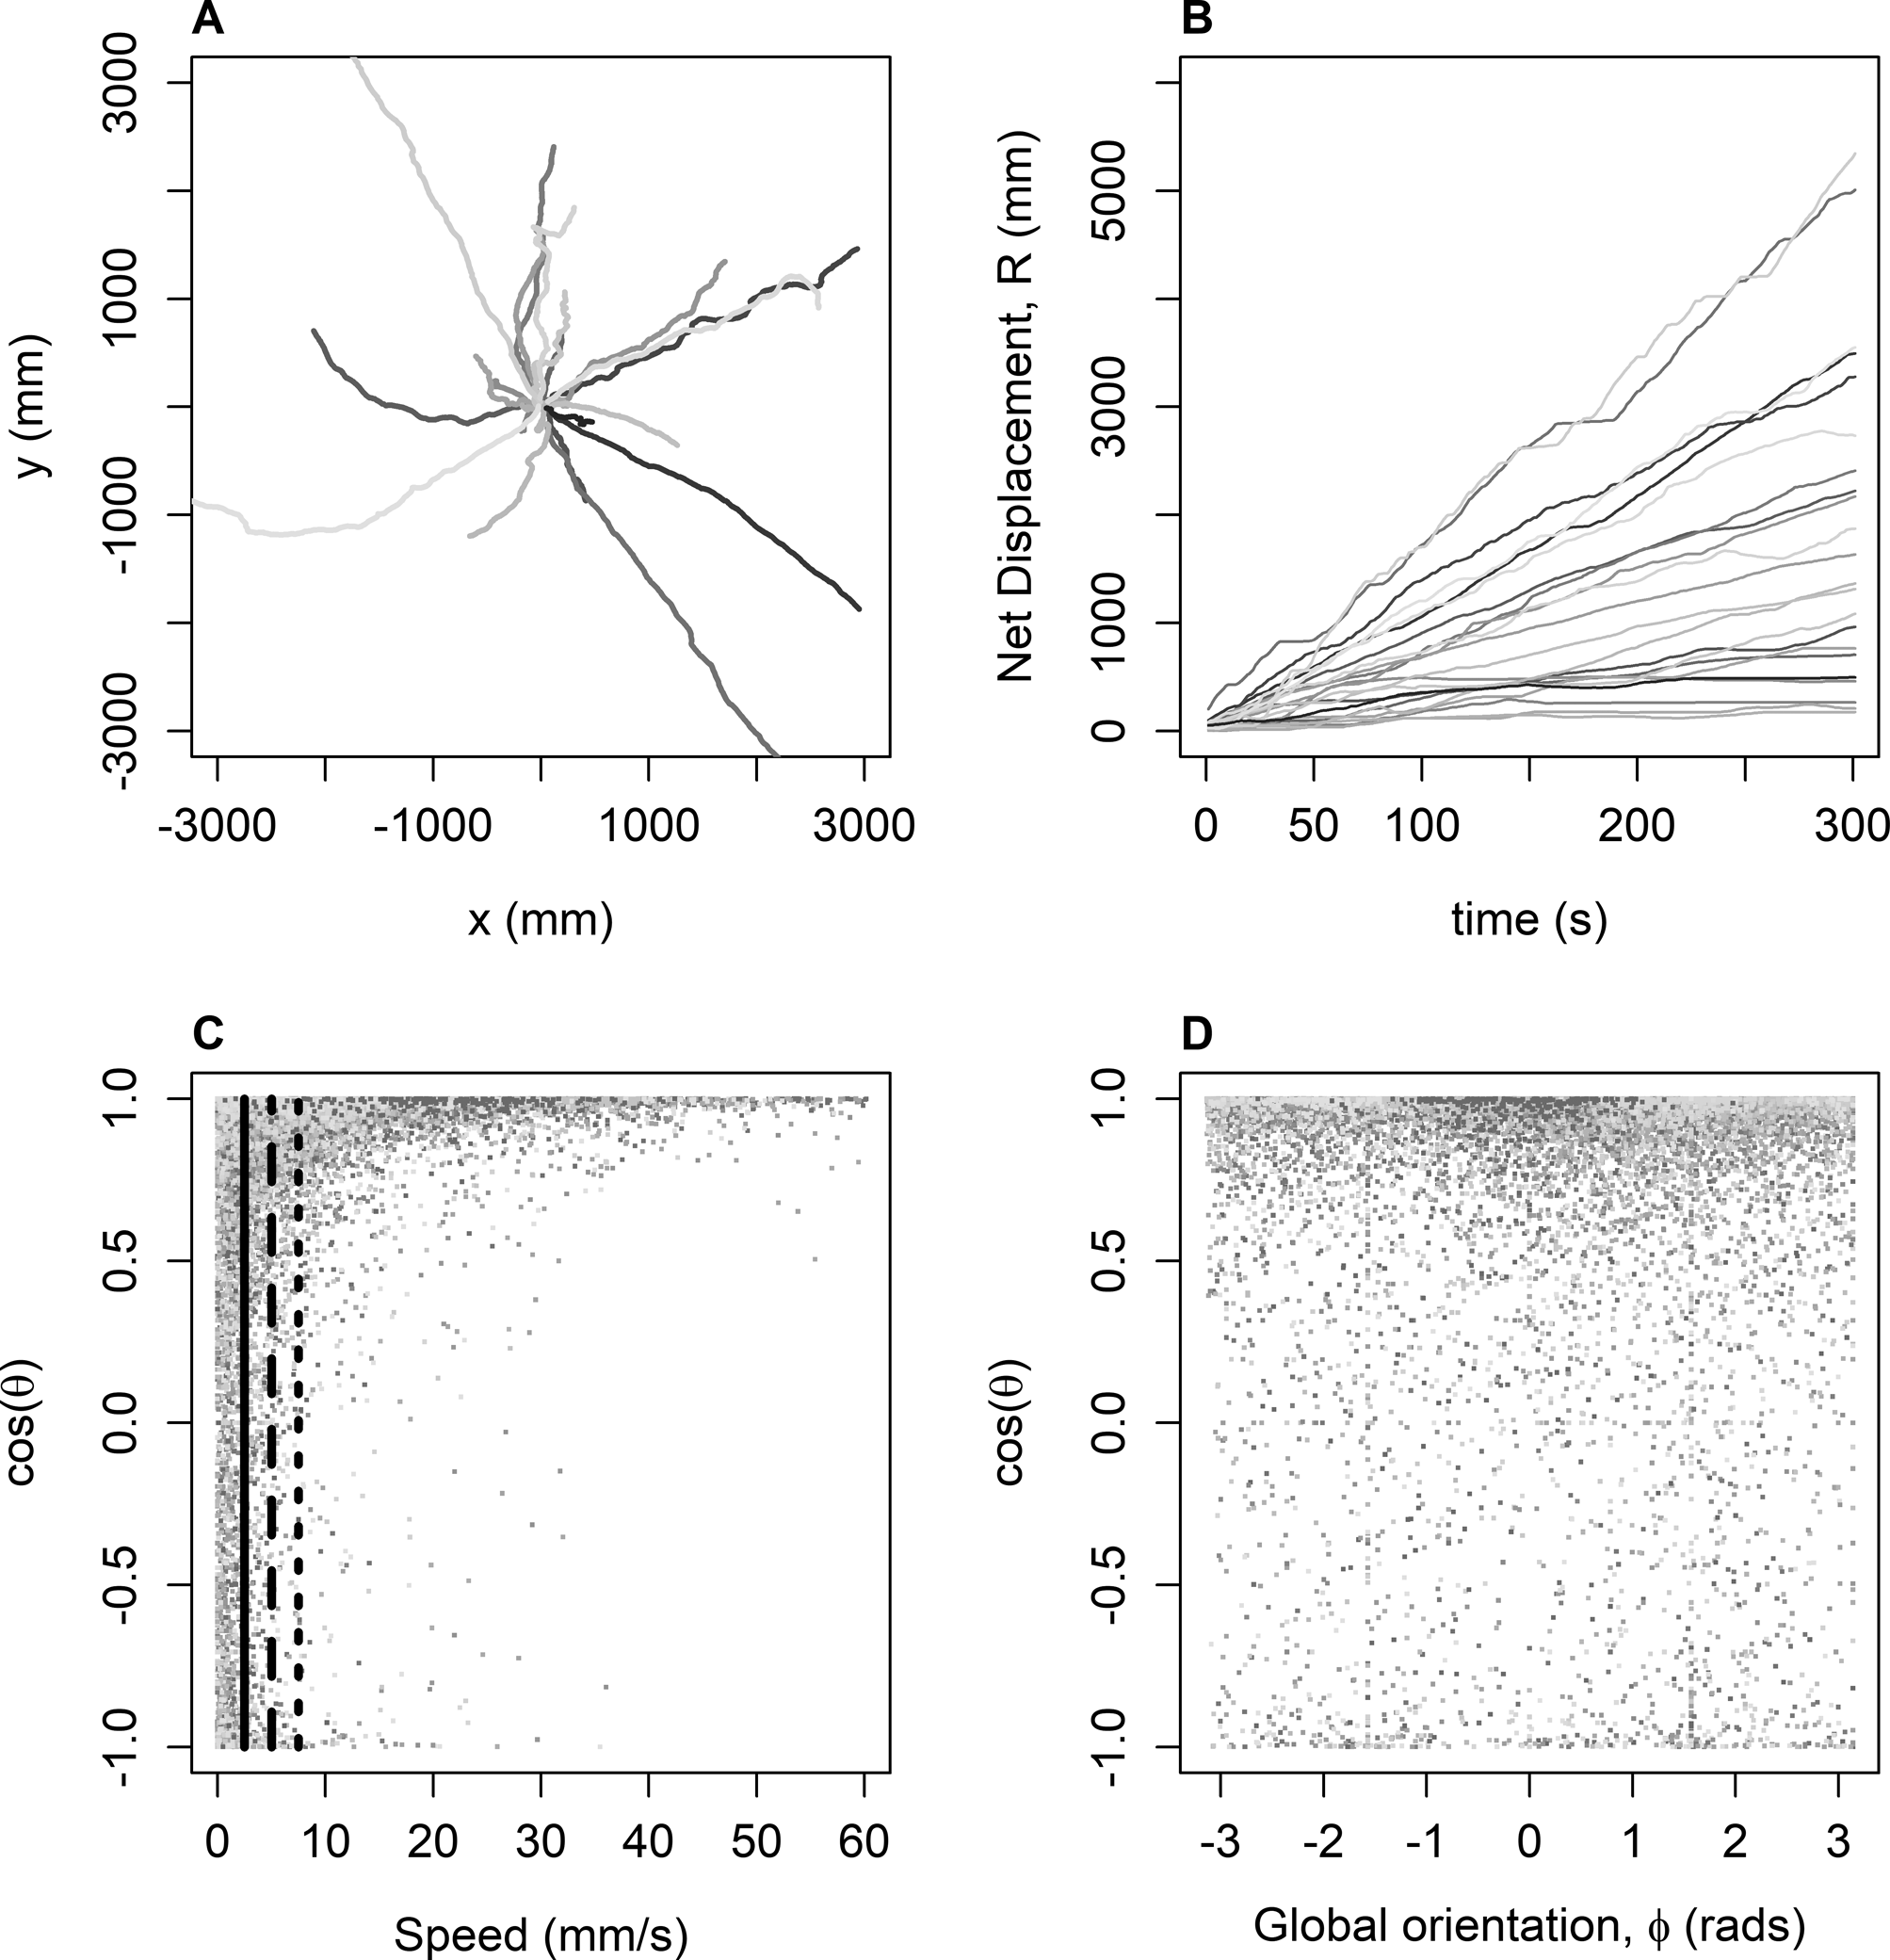
Standard path analysis measures adopted from random walk theory were quantified for each of the observed movement paths (Kareiva and Shigesada, Reference Kareiva and Shigesada1983; Kramer and McLaughlin, Reference Kramer and McLaughlin2001; Goodwin and Fahrig, Reference Goodwin and Fahrig2002; Codling et al., Reference Codling, Plank and Benhamou2008). It is known that the precise form of the distributions underlying movement in step-turn processes has large effects on the predicted movement and hence a detailed analysis of individual movement is required in order to accurately predict movement behaviour (Codling et al., Reference Codling, Bearon and Thorn2010; Choules and Petrovskii, Reference Choules and Petrovskii2017). Therefore, for each movement path the turning angles between the directions of successive movement steps, the global direction of movement at each step, and step length/speed (step length and the instantaneous speed are equivalent as we used a fixed sampling frequency of 1 Hz), were calculated (fig. 1c, d). The observed speeds were then used to determine the bouts of movement and non-movement as described in the previous section. Summary statistics for each movement path were determined: total net displacement (mm; Fig. 1b), mean cosine of turning angles, straightness (total track length/total net displacement; a measure of tortuosity), average speed (mm s−1; determined for bouts of movement only), number of bout transitions (movement to non-movement and vice versa), average bout duration (s), variance in bout duration (s2), and proportion of time spent moving (%). The temperature was included as a covariate in the initial analyses but was found not to be significant and so was excluded from subsequent analysis, as has been observed in other studies of ground beetle movement (Tuf et al., Reference Tuf, Dedek and Veselý2012; Růžičková and Veselý, Reference Růžičková and Veselý2016).
(a) Individual beetle movement paths for the first trial run of each beetle. Starting points are the origin (0, 0). (b) Displacement over time for each individual beetle from their first trial run. (c) Cosine of the turning angle (the angle between successive steps) against the instantaneous speed at that step. The vertical lines represent possible values for the speed threshold value (5 mm s−1, 10 mm s−1 and 15 mm s−1) which were used to distinguish between purposeful movement and non-movement. Data is taken for all beetles across all three trials. (d) Global orientation of movement at each step and the cosine of the corresponding turning angle (the angle between successive global orientations). Data are taken for all beetles across all three trials. In all plots, the same hue is used to indicate individual beetles. For all figures, the sampling size used was 1 Hz.

Intra- and inter-individual variation
Repeatability
To measure the consistency of behaviour among individuals the repeatability, r, was calculated (also known as the intraclass coefficient, ICC, (Lessells and Boag, Reference Lessells and Boag1987)). Where r = V ind/(V ind + V ɛ ) with V ind being the variance between individuals and V ɛ the residual variance, which is equivalent to the variation within individuals (Nakagawa and Schielzeth, Reference Nakagawa and Schielzeth2010; Dingemanse and Dochtermann, Reference Dingemanse and Dochtermann2013; Houslay and Wilson, Reference Houslay and Wilson2017). Therefore, r, indicates the relative strength of the variance between individuals compared to the total variance (V ind + V ɛ ) (Brommer, Reference Brommer2013; Dingemanse and Dochtermann, Reference Dingemanse and Dochtermann2013; Dosmann et al., Reference Dosmann, Brooks and Mateo2015). These variances were found using Linear Mixed Effect Models using Restricted Maximum-Likelihood parameter estimation following the method described in Nakagawa and Schielzeth (Reference Nakagawa and Schielzeth2010) by the use of the rptR package (Stoffel et al., Reference Stoffel, Nakagawa and Schielzeth2017) in R (R Core Team, 2018).
Correlation
Correlation between any of the parameters at either the between- or within-individual level was calculated by dividing the covariance between two parameters by the square root of the product of the two variances (Dosmann et al., Reference Dosmann, Brooks and Mateo2015). These values we found using a bivariate (two-trait) mixed model, with the individual beetle as the random intercept, the experiment number (centred) as the repeat number, and the parameters (centred and scaled) as the random effects, as per Houslay and Wilson (Reference Houslay and Wilson2017). The model was implemented by the MCMCglmm package (Hadfield, Reference Hadfield2010) in R (R Core Team, 2018). In order to ensure auto-correlation was not an effect, 500,000 iterations were run with a ‘burn-in’ period of 15,000 and a thinning of 100. Results were significant if the confidence intervals (95%) did not span 0, as is standard with Bayesian CIs (Houslay and Wilson, Reference Houslay and Wilson2017).
Global movement direction
Global orientation of movement directions was considered at both population and individual level, to ascertain whether a global or an individual preference in direction existed. A Watson test checked for uniform distribution of global movement directions and a Rayleigh test determined whether the distribution corresponded to a unimodal wrapped distribution with specific resultant vector (where a resultant vector close to 1 would indicate a strong preference in movement direction, whereas a vector close to 0 would indicate no preference in direction).
Turning angles
The observed turning angles were fitted to two standard circular probability distributions: the von Mises (a close approximation to the normal distribution on a circle) and the wrapped Cauchy (a heavy-tailed circular distribution). These were fitted using the CircStats package in R (R Core Team, 2018). The Kuiper and the Watson-U2 tests were used to check the validity of both models, with the Akaike Information Criterion (AIC) used to indicate the closer fitting distribution (Mardia and Jupp, Reference Mardia and Jupp2009). Evidence of unimodal turning angle distributions centred around 0 would indicate persistence in the beetles’ movements.
Step lengths (instantaneous speeds) and intermittency
Four distributions were considered for fitting the observed distribution of step lengths (instantaneous speeds), with the same distributions also considered for the movement and non-movement bout durations: power-law, exponential, Weibull and log-normal. Distributions were fitted using the fitdistrplus package in R (R Core Team, 2018), except for the power-law that was fitted using the power.law.fit function in the iGraph package in R (R Core Team, 2018). The power-law was considered in two circumstances. Firstly, to check if a power-law fitted all the data, a restricted power-law was considered. The x min value, in this case, was set at the smallest non-zero value of the data rather than the value for x min calculated by power.law.fit function (Virkar and Clauset, Reference Virkar and Clauset2014). Secondly, a power-law fitting only the tail of the data was considered as this is an indicative feature of Lévy walk behaviour (Edwards et al., Reference Edwards, Phillips, Watkins, Freeman, Murphy, Afanasyev, Buldyrev, Luz, Raposo, Stanley and Viswanathan2007; Sims et al., Reference Sims, Righton and Pitchford2007; Reynolds et al., Reference Reynolds, Leprêtre and Bohan2013; Ahmed et al., Reference Ahmed, Petrovskii and Tilles2018). The tail of the data was calculated by using the best fit x min value calculated by the power.law.fit() function. The potential distributions were fitted only to data points which were greater than this minimum value. As the fitting algorithm for the power-law utilized a maximum likelihood estimation (MLE) method to maximize the P-value for the Kolmogorov–Smirnov (K-S) test, a G-test was also used to consider the fit of the distributions (Edwards et al., Reference Edwards, Phillips, Watkins, Freeman, Murphy, Afanasyev, Buldyrev, Luz, Raposo, Stanley and Viswanathan2007).
CRW vs BRW behaviour
To investigate whether the characteristics of the beetle movement paths could be classified best as either a correlated random walk (CRW; i.e. movement is persistent but not globally directed) or a biased random walk (BRW; i.e. movement is globally directed), we measured the Δ statistic from (Marsh and Jones, Reference Marsh and Jones1988):
 $$\Delta = \displaystyle{1 \over {n^2}}\left[{{\left({\mathop \sum \nolimits\cos \theta_i} \right)}^2 + {\left({\mathop \sum \nolimits\sin \theta_i} \right)}^2} \right]-\displaystyle{1 \over {{\lpar {n-1} \rpar }^2}}\left[{{\left({\mathop \sum \nolimits\cos \omega_i} \right)}^2 + {\left({\mathop \sum \nolimits\sin \omega_i} \right)}^2} \right]$$
where, θ i is the global orientation and ω i is the turning angle, at time i. The Δ statistic gives a relative measure of how well the observed data fit each of the two types of random walk movement model (see details in Additional File 5).
Data for turning angles and step lengths (speeds) were fitted at the population level (10045 data points from 66 movement paths) and at the individual path level (between 37 and 298 data points for each movement path). The Δ statistic was calculated for each individual movement path separately and also for all turning and global orientation angles aggregated at the population level. Data for bout durations were fitted only at the population level due to the limited number of data points from each individual path (326 data points from 66 movement paths).
Results
Basic path analysis measures
Fig. 1c illustrates how the observed movement paths consisted of bouts of high speed and highly persistent movement (where the mean cosine of turning angles is close to 1), interspersed with bouts of low speed (5–10 mm s−1) in which the distribution of turning angles is more uniform.
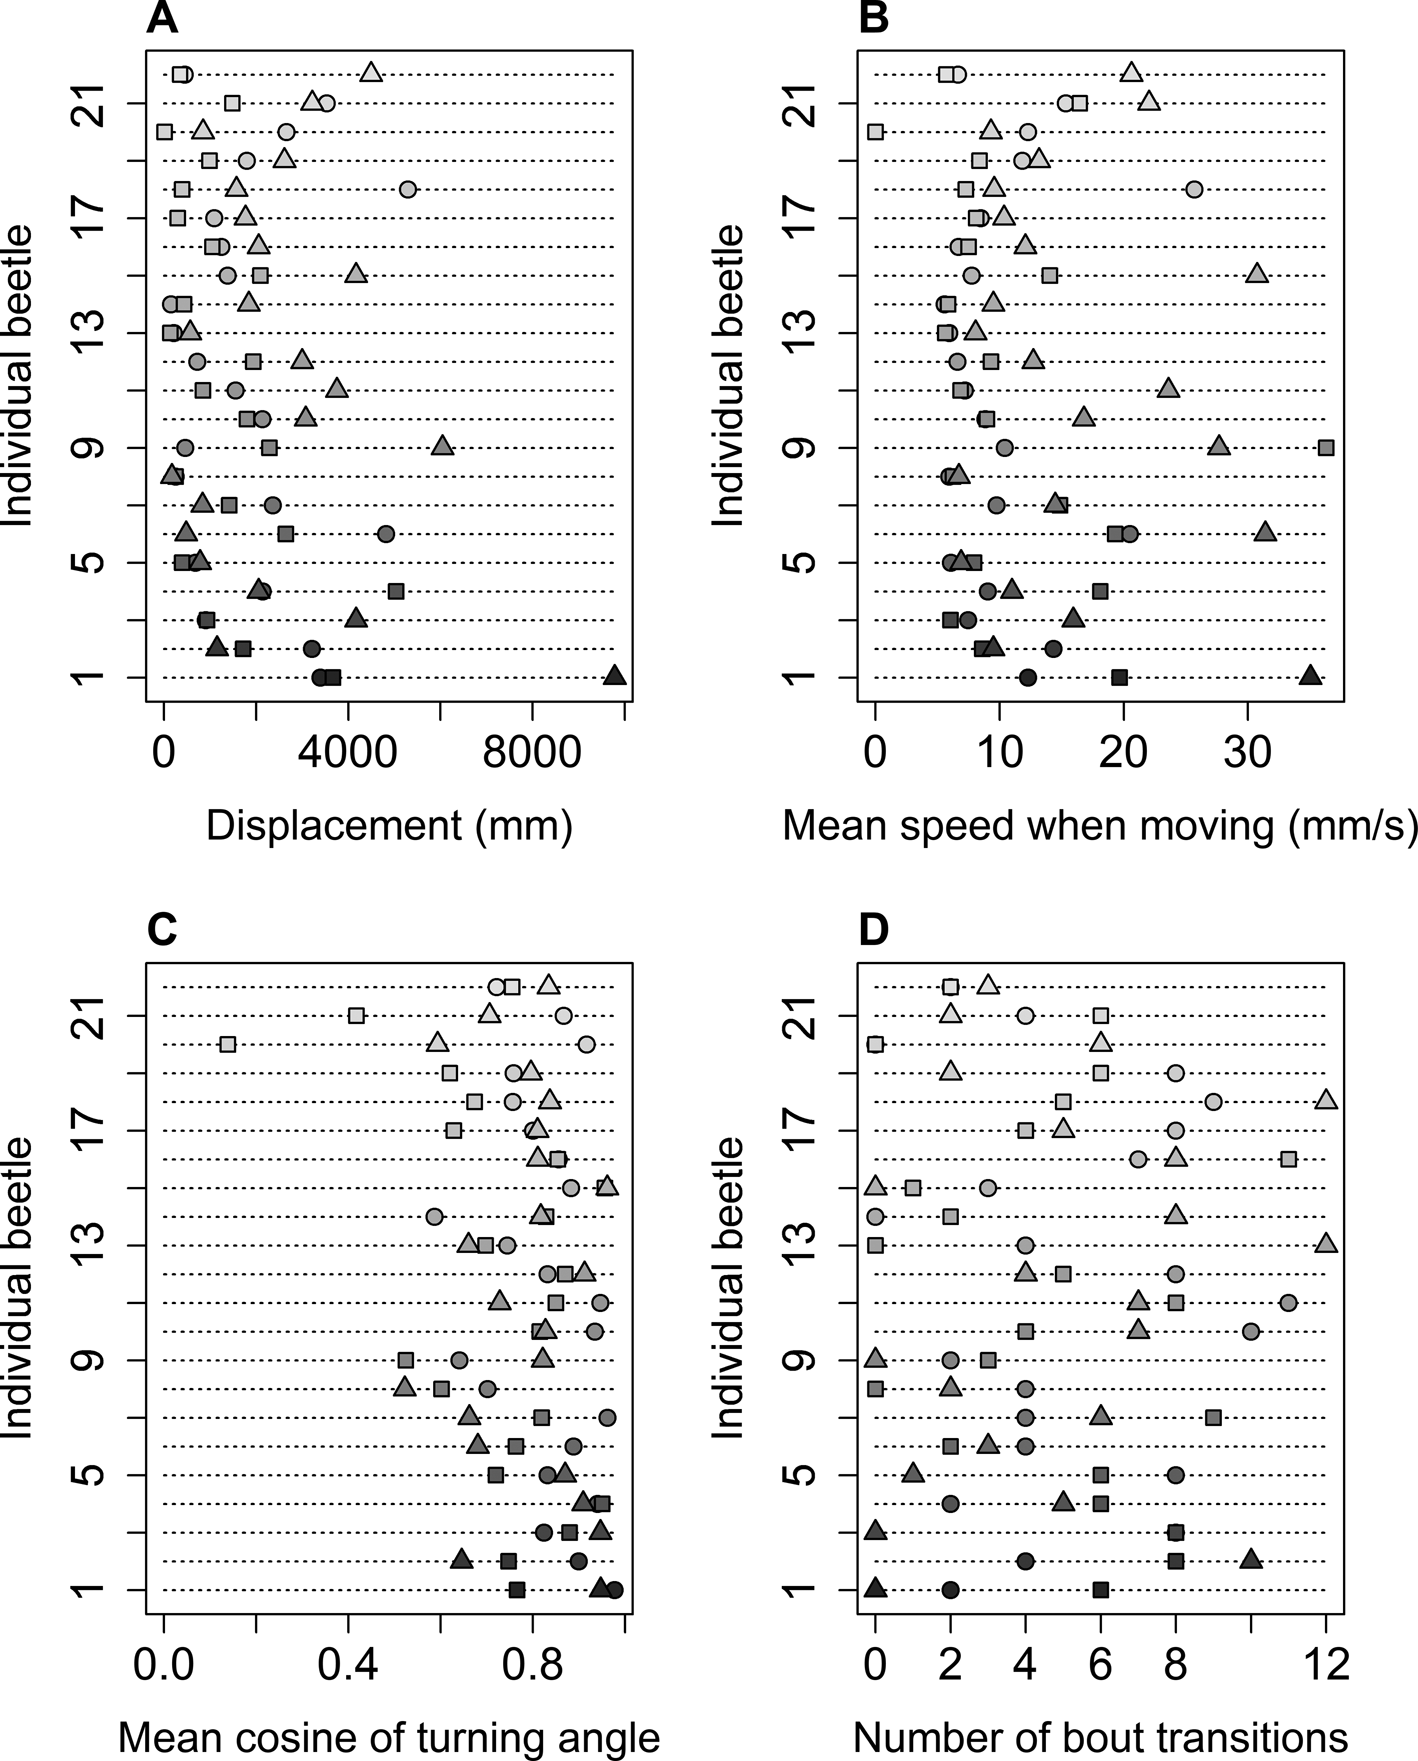
The beetles’ net displacement ranged from 14 to 9785 mm (fig. 2a) with the measure of straightness of each individual path varying from 0.98 (near straight-line movement) to 0.21 (tortuous) (Additional File 2; online Supplementary Fig. S1). The average of the mean cosine values was found to be 0.780 with a standard deviation of 0.146, indicating a small range of values for the mean cosine across all trials (fig. 2c). On average the beetles as a population spent 55.5% of the experiment moving, recording an average speed when moving in the range of 5.65 mm s−1 to 36.3 mm s−1 with the population average being 12.5 mm s−1 (fig. 2b; Additional File 2, online Supplementary Fig. S1). The number of transitions from bouts of movement to non-movement (and vice-versa) in a single trial varied from 0 to 12 across the population, with individuals exhibiting a wide range in the number of transitions across their individual three trials (fig. 2d). Correspondingly the average bout length varied from 17s, for the individual trial which displayed 12 completed bouts, to 293s for the individual trial which displayed only one complete bout during the experiment.
(a–d) (a) Total displacement, (b) mean cosine of turning angle, (c) mean speed when moving, and (d) number of bout transitions of each beetle for each trial (figures displaying variability across the other parameters are found in Additional File 2, Fig. S1). In all plots, circle points correspond to Trial 1, square to Trial 2 and triangle to Trial 3.

Intra- and inter-individual variation
Repeatability
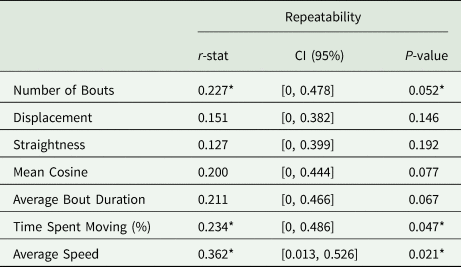
The number of bouts, time spent moving (%) and average speed when moving were found to be repeatable implying that the beetles displayed individual consistency across the three trials (P < 0.05). All of these gave repeatability of over 0.2, with the highest being average speed when moving, r = 0.282. However, when considering the 95% confidence intervals, only average speed had an interval which did not span 0, indicating that average speed was the only consistent movement behaviour (Table 1).
Values of the repeatability value, r, for the calculated parameters, along with the 95% confidence intervals (CIs)

Values marked with the asterisk (*) indicate significant results (P < 0.05).
The repeatability results demonstrate that between 12.7 and 36.2% of the variance in the parameters was caused by differences between individuals and therefore the majority of the variation in the parameters is due to the differences within-individuals (Additional File 2; Table S1).
Correlation in parameters
At the between individual-level all parameter combinations had CIs which span 0 indicating no evidence of statistically significant correlation (Additional File 2; Table S2). At the within-individual level, a strong positive correlation (P < 0.01) between displacement, straightness and time spent moving was observed, as well as between displacement and average speed, as might be expected from standard movement. A strong negative correlation (P < 0.01) between the average bout duration and the number of bout transitions was anticipated: the longer a bout, the fewer there can be in a given time period. However, a significant positive correlation (P < 0.01) between the average speed when moving and the time spent moving was also found, indicating that the longer the time the beetles spent moving, the faster on average they moved (Additional File 2; Table S3).
Global movement direction
Fig. 1d shows a near-uniform distribution in the global orientation angle, relative to the associated turning angle for the pooled data across all beetles and trials. This suggests that, at the population level, there is no consistent reorientation towards a specific global movement direction. A Rayleigh test at the population level revealed a slight bias towards a global movement direction of  $\bar{\mu } = 59^\circ $, although the resultant vector was low (
 $\bar{R} = 0.194$) suggesting this was only a weak effect.
At the individual level, beetles were observed to have highly consistent oriented movements (resultant vector,  $\bar{R}$, ranging from 0.194 to 0.972, with mean = 0.662, sd = 0.213). The Watson test rejected the possibility of a uniform distribution of global movement directions for each individual, indicating movement at the individual level was highly directed.
Turning angles
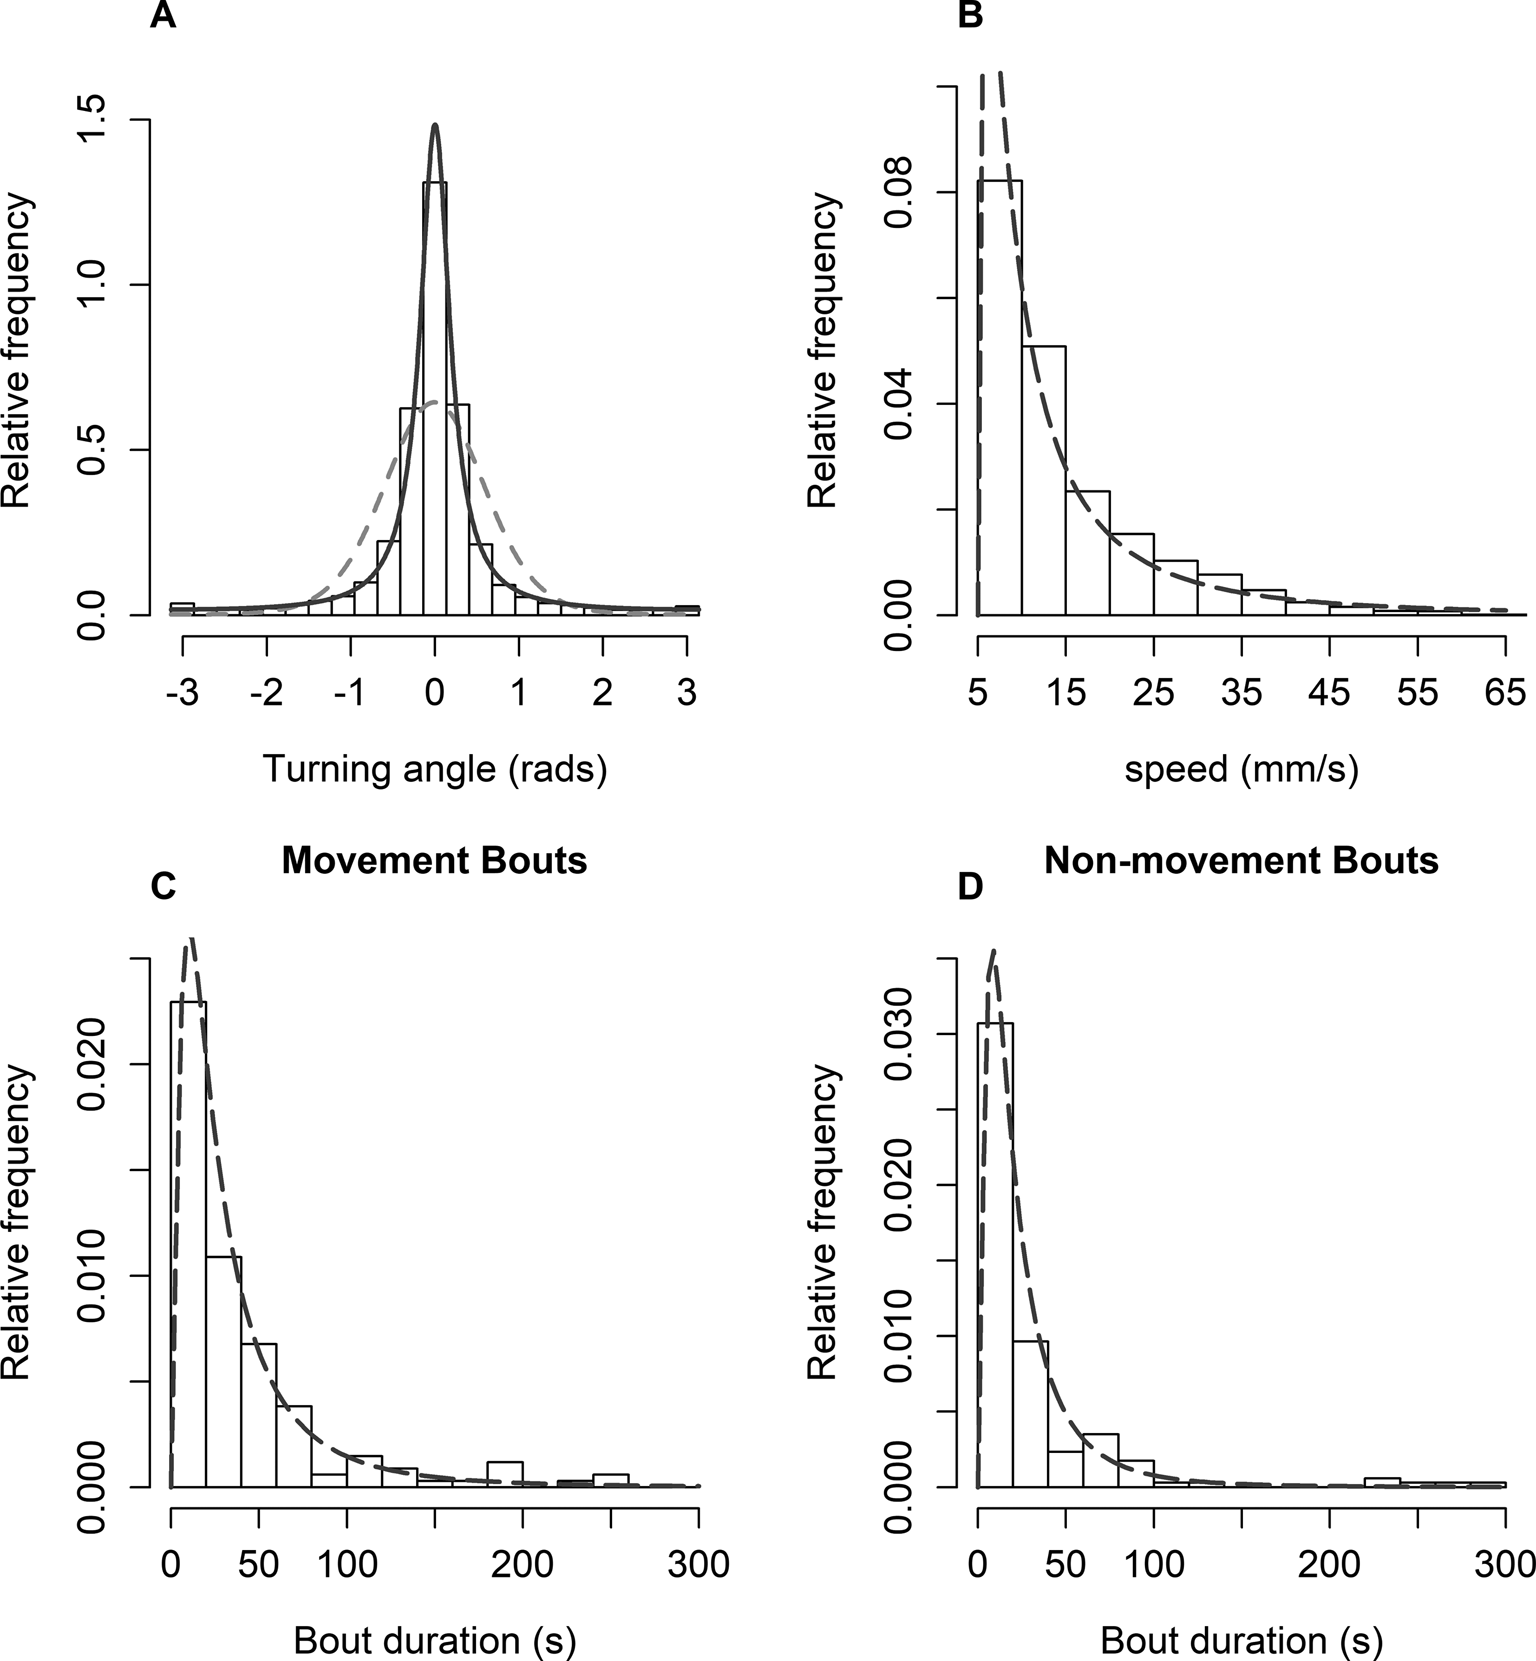
When considering the distribution of turning angles at the population level, both the wrapped Cauchy (MLE parameters: ρ = 0.859, μ = 0.005) and von Mises distributions (MLE parameters: κ = 6.43, μ = 0.001) were rejected by the Watson test ( $U_{wc}^2 = 2.42\comma \;\;P \lt 0.01\semicolon \;\;U_{vM}^2 = 51.9\comma \;\;P \lt 0.01$) and the Kuiper test (V wc = 6.79, P < 0.01; V vM = 21.1, P < 0.01) (online Supplementary Tables S1–S2, Additional File 3). However, the AIC favoured the wrapped Cauchy over the von Mises (AICwc = 7032, AICvM = 10668), and visual inspection indicates that the wrapped Cauchy is the better fit (fig. 3a). Tests at other sampling rates and speed thresholds revealed no significant differences from these results (online Supplementary Tables S1–S2, Additional File 3).
(a) Histogram of the turning angles. The solid dark grey line shows the best fit wrapped Cauchy (WC) distribution with μ = 0.005, ρ = 0.859 and the dashed light grey line shows the best fit von Mises (vM) distribution with μ = 0.001 and κ = 6.43. (b) Histogram for distribution of the instantaneous speeds. The grey dashed line shows the best fitting log-normal distribution (c) and (d) histograms showing the distribution of the length of bouts of movement and non-movement. The grey dashed line shows the best fitting log-normal distribution. In all cases, the sampling rate was 1 Hz and speed cut-off threshold was 5 mm s−1.

At the individual level, a wrapped Cauchy distribution was found to be the best fitting distribution for 58 of the 66 trials. The resultant vectors for each of the individual trials were high, indicating persistence in movement ( $\bar{R}$ ranging from 0.397 to 0.913 with mean = 0.780, sd = 0.147).
Step-lengths (instantaneous speeds) and intermittency
When considering the distribution of the instantaneous speeds at the population level, both the K-S test and G-test rejected all four distributions (P < 0.01 ) when fitted to the tail of the data. The AIC indicated that the Weibull distribution (MLE parameters; γ = 0.992, α = 9.67) was the closest fit (online Supplementary Tables S3–S5, Additional File 3). When considering the full data set and using a restricted power-law with x min = 5, the K-S test and G-test still rejected all the distributions (P < 0.01), but the AIC now favoured the log-normal distribution (fig. 3b) with MLE parameters μ = 1.69, σ 2 = 1.28 (online Supplementary Tables S6–S8, Additional File 3). Choosing different values for the sampling rate and speed threshold did not qualitatively change these results (online Supplementary Tables S3–S8, Additional File 3). At the individual level, the log-normal and the Weibull distributions were favoured in 65 of the 66 trials when considering the full data set, and 61 of the 66 when looking only at the tail of the data.
Intermittency (movement and non-movement bouts)
Both the Weibull (MLE parameters; γ = 0.97, α = 45.7) and log-normal (MLE parameters; μ = 3.30, σ 2 = 1.04) distributions were accepted by the G-test for the distribution of the bouts of movement with the AIC value distinguishing between them by favouring the log-normal distribution. For the bouts of non-movement, the G-test and K-S test reject all the distributions (P < 0.01); although, the log-normal distribution (MLE parameters; μ = 3.00, σ 2 = 0.94) was favoured by the AIC (AIClog−norm = 1373, AICexp = 1420, AICweib = 1422). Visual inspection implies a reasonable fit here (figs 3c, d; online Supplementary Tables S9–S10, Additional File 3).
As predicted by the lognormal distribution an inverse relation was found between lengths of following bouts, with a long bout often followed by a short bout, and bouts close to the median bout length mostly followed by bouts of comparable length (Additional File 3, online Supplementary Fig. S1).
CRW vs BRW behaviour
At the individual level the Marsh-Jones Δ statistic indicated that the observed data did not fit with the expected result from either a CRW or BRW, with 60 paths giving an indeterminate result, five paths identified as most like a CRW and only one most like a BRW (Additional File 5; online Supplementary Table S1). Similarly, at the population level, the statistic did not coincide with the expected result for either a BRW or a CRW. However, in this case the value (Δ = −0.335) was strongly negative and much closer to the expected CRW value, indicating that the population movement was more similar to a CRW.
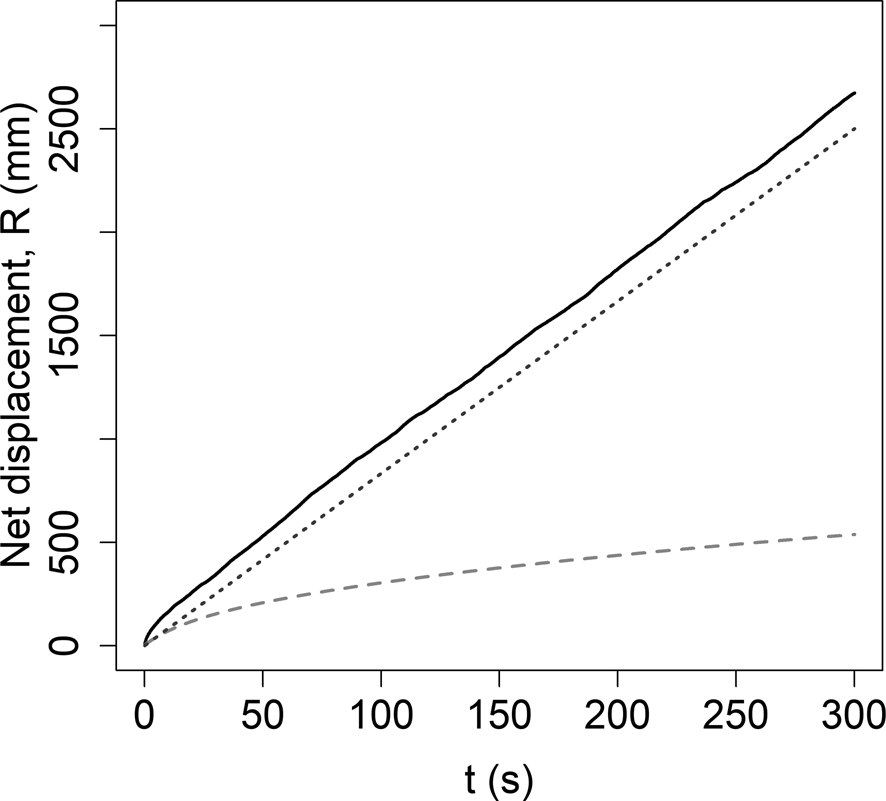
When the observed net displacement was compared with the expected displacement of a CRW (parameterised by calculated population-level values of the speed and turning angle mean resultant length), it is clear that the beetles dispersed considerably faster than expected by simple CRW movement (fig. 4). With an initial period of super-ballistic behaviour followed by a sustained linear increase in net displacement over time as predicted by a purely ballistic movement process.
Net displacement of beetles over time. The solid black line shows the mean net displacement of the beetle population with sampling rate 1 Hz and no speed threshold; the light grey dashed line is the expected result for a CRW with turning angles taken from a zero centred wrapped Cauchy distribution with concentration parameter ρ = 0.819, and step length drawn from the exponential distribution with mean, 1/λ = 8.33 (Additional File 3, online Supplementary Table S2 & S5); the dark grey dotted line is a ballistic movement.

Discussion
Movement data of 22 P. cupreus beetles were collected over three replicate trials on a locomotion compensator. Analysis of observed trajectories highlighted high levels of inter- and intra-individual variation in movement path characteristics (figs 1 and 2), with a correlation between time, spent moving and instantaneous speed, suggestive of possible ‘flee’ behaviour. Observed turning angles were best fitted by the wrapped Cauchy distribution with step lengths (instantaneous speeds) best described by a log-normal distribution with no evidence of power-law behaviour (fig. 3a, b). Beetle movements were observed to be highly persistent at the individual level, with beetles able to maintain forward movement towards a chosen direction over a sustained period. At the population level, a weak preference in global movement direction appeared to be present, however, further, inspection highlighted that this weak global directional bias was directly correlated to the initial movement direction of the beetles at the start of recording (presumably related to the initial orientation of the beetle as they were released onto the tracking sphere’), and the global bias towards this specific orientation had disappeared by the end of each trial (Additional File 5; online Supplementary Fig. S1). Hence, there was no strong evidence for a consistent global bias at the population level (see fig. 1a). This could be an artefact of the experimental setup where such an unfamiliar setting caused the beetles to engage in ‘flee’ behaviour where the movement was in a constant direction away from the starting location. Assuming the beetles were not placed facing exactly the same direction at the start of the experiment, along with the beetles' inherent ability to travel in a straight line could explain the lack of global direction.
Intermittency in movement was observed, with the lengths of the bouts of movement and non-movement both best described by log-normal distributions (fig. 2c, d). Movement bouts were found to highly vary between individuals at both the inter- and intra-individual level, with some trials consisting of bouts of constant movement and others involving highly intermittent stop-start behaviour. The intermittency in movement behaviour, along with the observation that bouts of short length are often followed by bouts of similar length (Additional File 3, fig. S1), has been characterized as foraging or searching behaviour in aphids (Mashanova et al., Reference Mashanova, Oliver and Jansen2010) and has been reported for a number of species including crickets, copepods and ghost crabs (Kramer and McLaughlin, Reference Kramer and McLaughlin2001).
The ability for individual beetles to disperse over much larger distances than predicted by a simple CRW movement model, while showing no evidence of a global preferred direction at the population level, is an interesting finding. The beetles in this study showed an innate ability to travel on a near-constant bearing with high persistence (fig. 1a) phenomena found in other insects such as dung beetles (Byrne et al., Reference Byrne, Dacke, Nordström, Scholtz and Warrant2003) but has been shown to not be present in other animals such as humans (Souman et al., Reference Souman, Frissen, Sreenivasa and Ernst2009). It is known that small errors in attempted straight-line movement compound over time (Biegler, Reference Biegler2000; Cheung et al., Reference Cheung, Zhang, Stricker and Srinivasan2007), therefore, if an individual can continue on a constant bearing for a protracted time period without any obvious external cues, the method by which these small errors are negated is interesting and may be due to some unknown internal cue. Similar underestimates of total displacement have also been reported when considering parameterised CRW models for T. confusum beetles (Morales and Ellner, Reference Morales and Ellner2002) and three Eleodes sp. (Crist et al., Reference Crist, Guertin, Wiens and Milne1992). A possible explanation for these discrepancies is that the parameterised models do not consider the use of internal mechanisms or external cues that enable deviations in heading to be corrected so that forward movement is maintained. However, it is far from clear in this context what such mechanisms might be since there were no known visual navigation cues in the immediate walled environment of the locomotion compensator that could have been utilized.
Other insect species, such as bumblebees and other arthropods (Chittka et al., Reference Chittka, Williams, Rasmussen and Thomson1999; and references therein) are thought to possess an internal magnetic compass that allows forward navigation in the absence of other cues. Bumblebees also use odour cues to direct movement within a featureless environment (Chittka et al., Reference Chittka, Williams, Rasmussen and Thomson1999) and are able to discriminate between hydrocarbon scent marks excreted from the tarsi left by themselves and conspecifics on flowers (Pearce et al., Reference Pearce, Giuggioli and Rands2017); P. cupreus has been observed to use chemical cues to navigate, orienting towards prey such as Heteromurus nitidus, a ground-dwelling springtail (Mundy et al., Reference Mundy, Allen-Williams, Underwood and Warrington2000) therefore a similar mechanism might allow them to track their own footprints on the locomotion compensator, although we have no direct evidence that this is the case.
Polarization of light has been shown to act as a method of navigation in many species of insect and beetles (Schwind, Reference Schwind1991; Wehner, Reference Wehner2001). Dung beetles (e.g. Scarabaeus sp. and Scarabaeini sp) have been shown to use the polarization of light to move with high persistence (Dacke et al., Reference Dacke, Byrne, Scholtz and Warrant2004; Baird et al., Reference Baird, Byrne, Smolka, Warrant and Dacke2012), Although there were no direct visual cues in our experimental arena, there was a fixed light source on the ceiling of the laboratory and it is possible that P. cupreus are using the polarization of the light source relative to their initial starting direction to maintain their forward movement. This could be simply tested by running a similar experimental setup incorporating a light polarizer, similar to the method used to demonstrate the use of light polarization in dung beetle navigation (Dacke et al., Reference Dacke, Byrne, Scholtz and Warrant2004; Baird et al., Reference Baird, Byrne, Smolka, Warrant and Dacke2012).
Whilst the experimental setup allowed for the collection of data both at a high frequency and high level of accuracy, giving answers to the questions regarding the dispersal potential and variability in movement behaviour of P. cupreus, the experimental setup itself causes the conclusions and applications of our findings to be limited. Due to the featureless conditions, caution must be taken in generalizing these results as they are not indicative of movement in natural environments, in which encounters with obstacles or changing conditions would be present. However, a similar tracking device was used in Dahmen et al., Reference Dahmen, Wahl, Pfeffer, Mallot and Wittlinger2017 to compare the movement of desert ants (Cataglyphis sp.) under experimental conditions to those observed in an open test field. They recorded movement in a test arena both outside with natural light and inside a laboratory with a polarized light source, comparing the observed movement to that recorded by using a cushioned tracking sphere under similar conditions. The findings reported no significant differences between the movement recorded using the tracking sphere to that in the open test field. Whilst this may be the case for this specific species of ant, as we did not engage in similar direct comparisons of movement in natural settings to that on the TrackSphere, it is not necessarily clear that movement recorded on such a device can act as a sensible approximation for real-world movement
Although the homogeneity of the experimental setup has been highlighted as a flaw in scaling up our findings to movement in the real world, the agricultural landscapes P. cupreus often inhabit, are by their cultivated nature more homogeneous relative to non-agricultural landscapes. Therefore, our recorded movement behaviour could be beneficial to studies which attempt to understand the invasive potential of P. cupreus in crop management.
Banks et al. (Reference Banks, Laubmeier and Banks2020) looked at the expected affect ladybirds and P. cupreus had on controlling aphid invasions of agricultural fields, with the aim of providing a pest management structure to efficiently eradicate aphid populations. Their model concluded that using a population of ladybirds was the most effective compared to a mixture of the two predators. However, the model explicitly relied on predicted movement rates of P. cupreus which had been aggregated at the population level. Therefore, applying our findings of the dispersal potential and movement behaviour in similar studies may affect the outcome, leading to alternative crop management strategies.
Supplementary material
The supplementary material for this article can be found at https://doi.org/10.1017/S0007485320000565