Introduction
The cross-disciplinary concept of creativity – is central to human activity (Shai et al., Reference Shai, Reich, Hatchuel and Subrahmanian2013) and involves producing original, potentially workable ideas to solve a design problem (Bourgeois-Bougrine et al., Reference Bourgeois-Bougrine, Buisine, Vandendriessche, Glaveanu and Lubart2017). Creative ideas rarely arise from a void and are conceptualized without rethinking and reflecting on experiences and perceptions. Our earlier studies on this topic show that students devise novel ideas with the aid of various stimuli (Koronis et al., Reference Koronis, Silva, Kang and Yogiaman2020). A literature review adduces that while creativity is not a new concept in cognitive psychology, it remains empirically undefined (Runco and Jaeger, Reference Runco and Jaeger2012). However, despite its intricate nature, creativity is taught as a central subject in engineering, architecture, industrial, and graphic design (Lawson, Reference Lawson2006).
New concept ideas can emerge from a set of example solutions that designers are exposed to. As a result, those solutions may encourage them to draw from tried-and-tested concepts while discouraging them from thinking of new or distantly related concepts (Kang et al., Reference Kang, Chia, Koronis and Silva2018).
Howard et al. (Reference Howard, Culley and Dekoninck2008) suggested that using creative stimuli removes mental blocks and facilitates new ideas creation. Although the direct transfer from the stimuli to the new design situation mechanism was not validated during the latter study, some ideas produced were not connected to the stimulus – this should not suggest that the stimulus was ineffective. Their later work asserted the positive influence of stimuli on generating appropriate and original ideas during brainstorming sessions (Howard et al., Reference Howard, Dekoninck and Culley2010). These studies explore the relationship between creativity as developmental tools, the creativity of engineering students’ project outcomes (Bourgeois-Bougrine et al., Reference Bourgeois-Bougrine, Buisine, Vandendriessche, Glaveanu and Lubart2017), the impact of visual stimuli in the experiment space, and the creativity of design students’ concept sketches (Goldschmidt and Smolkov, Reference Goldschmidt and Smolkov2006).
Fidelity of external representations refers to the participants’ notion that the stimulus is abstract or concrete, with the latter having a higher level of detail, content and reflection of reality. Research has found that the classification of stimulus into abstract or concrete affects design outcomes. For example, in Vasconcelos and Crilly's (Reference Vasconcelos and Crilly2016) study, abstract stimuli inspired a higher number of ideas and more creative outcomes than their concrete counterparts. Yet despite the breadth of design creativity research, the exact measures of what constitutes creativity–persuasive design briefs that enhance ideation outcomes remain insufficiently explored. Similarly, educational design practice lacks comprehensive demonstrations in enhancing the understanding of abstraction effects. In light of this, we employed multiple fidelity levels on the stimulus provided with the briefs to identify elements that contribute to efficient designs. To this end, this investigation seeks to contribute an empirical study to the field of design creativity to shed light on how concrete and abstract representations affect students’ design outcomes.
Α secondary objective was to draw on a survey and assess the existence of statistical relationships with design outcomes so as to understand what drives students’ creativity. It was an integrated approach to gain a deeper grasp of participant perspectives of the design briefs and stimuli they received. In the design science sphere, one can refer to a number of studies that examine the relationships between the design process and outcomes.
Kvan and Jia (Reference Kvan and Jia2005) explore the learning styles of architectural students and correlate their learning styles with their architectural design studio performance. Lu (Reference Lu2015) considered the relationship between students’ outcomes of different design cognition types. His results suggest that students at lower grade levels exhibited a greater tendency toward information-driven design than students at the senior grade level. In their previous work, Yang (Reference Yang2005) examined whether prototypes with fewer parts correlate with better design outcomes in answering whether more uncomplicated prototypes mean a more successful design with implications for developing software tools to support prototyping.
As such, in our analysis, we paired the sketch evaluations with survey responses to explore if variable permutations of stimuli can foster design creativity and gather insight into students' reception of the design brief. To our knowledge, this study is among the first to experimentally manipulate multiple levels of stimuli fidelity while simultaneously considering their downstream relationships with product awareness and design brief perceptions.
We expect that our findings may prove helpful to design professionals to deliver briefs tailored to promote desired creative outcomes. Secondly, we investigate whether participants are influenced by individuals’ awareness of the domain or perceptions of the briefs during the design process. If we find that those are related to variations in creativity scores, educators and project managers may also have insight into providing adequate stimuli to support the creative process and resultant outcomes. Hopefully, all the above allow design and creativity instructors to provide a safe transition framework within undergraduate coursework and promote inclusivity in class.
In the following sections, we introduce the definitions of creativity and demonstrate how it can be evaluated in an ideation task for undergraduate projects. In addition to students’ performance, we also investigate associations between the creative outcomes and the responses obtained from a post-experimental questionnaire. Next, we analyze our findings so as to draw conclusions on how to help students become more creative designers. We then discuss the influence of different stimuli on creativity to promoting a holistic comprehension of the design process. In the closing sections, we state our conclusions and limitations and suggest future research paths. In the Appendix, we detail the statistics and reproductions of the materials used in our experiment.
Background and related work
Levels of stimulus fidelity
We define fidelity as the degree or extent of the completeness of how briefs reflect or reproduce the real-world situation they refer to. Concrete terms refer to detailed, explicit examples that our senses can directly perceive, indicating higher fidelity in this respect. By contrast, abstract terms refer to ideas, attributes, and relationships requiring inferences using mental representations from language and context (Marschark and Paivio, Reference Marschark and Paivio1977). For the purposes of this study, an abstract brief based on abstract functions at a high level refers to a low-level stimulus fidelity. The contextual information provided here adds meaning and influences how readers interpret objects and situations (Charnley et al., Reference Charnley, Pease and Colton2012). It also fosters intrinsic motivation where designers “respond not to objective stimuli but based on what the act of designing the artifact and/or system [means] to them”. Understanding this contextual information can be of particular assistance in dealing with the task at hand. As such, it is considered a stimulus of medium-level fidelity – lying somewhere in between abstract and concrete – while physical examples are described as stimuli of a higher specificity level relating to the product (i.e., concrete).
Similar to the study of analogical distances, scholars examine creative outcomes concerning the participants’ fidelity of external representation (Vasconcelos and Crilly, Reference Vasconcelos and Crilly2016). Degrees of stimuli fidelity have also been described in psychology as simulation, with low-fidelity stimulus taking a textual form and high-stimulus fidelity represented as video-based items (Lievens et al., Reference Lievens, De Corte and Westerveld2012). Zahner et al. (Reference Zahner, Nickerson, Tversky, Corter and Ma2010) reported that abstract cases stimulated the generation of original ideas or Novelty. Solutions rated highly on the originality metrics came from abstractly analogized problems, while those rated on the lower end came from concretely analogized cases. Furthermore, findings from the research of analogical distances yielded results congruent to those of the fidelity of external representations. Some argued concrete features are easier to recognize and thus easier to replicate juxtaposed to more abstract features (Vasconcelos et al., Reference Vasconcelos, Cardoso, Sääksjärvi, Chen and Crilly2017).
Gonçalves et al. (Reference Gonçalves, Cardoso and Badke-Schaub2016) claim that the inspiration process, that is to say, designers’ selection of stimuli during the development of a design problem, has not been investigated in the research. Also, researchers concluded that abstractness augments divergent thinking (Zahner et al., Reference Zahner, Nickerson, Tversky, Corter and Ma2010), encouraging the development of a deeper understanding of real-life problems in the derivation of creative solutions. More abstract functions expressed as troponyms (action-specific verbs) and hypernyms (more generic action terms) such as “transmitting energy to object or separating outer structure from inner material” were used instead of tangible, concrete terms expressed as hyponyms (specific grouping terms) like “using a press to crush and remove the peanut shell” (Heckler, Reference Heckler2010; Linsey et al., Reference Linsey, Tseng, Fu, Cagan, Wood and Schunn2010).
Design brief and types of information
In a typical design project, the design brief is a document situated at the beginning of the design process (Camburn et al., Reference Camburn, Auernhammer, En Sng, Mignone, Arlitt, Blake Perez, Huang, Basnet, Blessing and Wood2017), written near the start of the project to formalize the expectations for the project, thereby setting the tone for the project and guiding its direction (Koronis et al., Reference Koronis, Chia, Kang Kai Siang, Silva, Yogiaman and Raghunath2019). The design brief steers the design process, and how it is conveyed has a critical influence on generating creative ideas (Carlgren et al., Reference Carlgren, Rauth and Elmquist2016; Sosa et al., Reference Sosa, Vasconcelos and Cardoso2018), often developed by a project manager or the design team in consultation with the “client” as a condensed articulation of desired results and targeted group needs. However, how can a design brief be optimally crafted to elicit maximum creativity in designers?
The proliferation of contradictory advice on writing design briefs suggests a lack of universally agreed exact definition of design briefs guidelines. Thus, what constitutes an efficient design brief remains open (Phillips, Reference Phillips2004). An efficient design brief should provide enough detail, be agreeable by both designer and client or recipient, and specify the needs well for the maximum effect (Perks et al., Reference Perks, Cooper and Jones2005). However, design briefs may be prepared incorrectly (Walsh et al., Reference Walsh, Roy and Potter1992) and may provide insufficient information (Oakley, Reference Oakley1990; Cooper and Press, Reference Cooper and Press2011) or superfluous detail (Bruce and Vazquez, Reference Bruce and Vazquez1999). While a design brief is a useful guide in the ideation process, elements of a brief that contribute to enhancing the design outcome collectively remain undefined.
At the same time, no existing literature to the authors’ knowledge explores stimuli fidelity for the case of design briefs in a single study. The scholarly study of Gonçalves et al. (Reference Gonçalves, Cardoso and Badke-Schaub2016) has investigated external stimuli, but solely on identifying how students search, select, and retrieve those for inspirational purposes. In this sense, the lack of standardization calls for identifying best practices for design brief formats that best enable designers to yield creative outcomes.
External stimuli as inspiration
When designers pursue inspiration, they tend to prefer using visual representations as stimuli (Vasconcelos and Crilly, Reference Vasconcelos and Crilly2016). However, this eliciting lookout process comes with the downside of cognitive fixation as exposure to visual stimuli induces copying of design features (Jansson and Smith, Reference Jansson and Smith1991; Goldschmidt and Smolkov, Reference Goldschmidt and Smolkov2006). In the study of Goucher-Lambert et al. (Reference Goucher-Lambert, Moss and Cagan2019), these inspirational stimuli were provided as a means to assist designers in engaging analogical reasoning or closely related mental processes similar to analogical reasoning. Those inspirations are used as starting points and, depending on their suitability, discarded, or adapted into the design process (Gonçalves et al., Reference Gonçalves, Cardoso and Badke-Schaub2016).
Vasconcelos and Crilly (Reference Vasconcelos and Crilly2016) research has identified a vast range of external stimuli on inspiration and fixation while discussing their merits in design creativity. Questions and insights open new ideation avenues and encourage stimuli that help designers think of more creative solutions. Our study fits this context, but we are especially focused on investigating the impact of three types of stimuli – abstract representations, additional textual information, and physical (concrete) example solutions incorporating various fidelity levels.
In engineering design literature, findings suggest that abstract brief requirements improve idea associations between domains (Linsey et al., Reference Linsey, Markman and Wood2012). In pedagogy, transferring ideas between domains using graphic simulations can be improved by presenting problems in an abstract, idealized form (Goldstone and Sakamoto, Reference Goldstone and Sakamoto2003). Finally, in the design of information systems, abstraction and re-representation have been reported to enhance Novelty while reducing the appropriateness of the ideas (Zahner et al., Reference Zahner, Nickerson, Tversky, Corter and Ma2010).
We also investigate the effect of including contextual information in the design brief. Context is the “situation in which something happens and that helps you understand” (Oxford, Reference Lea and Bradbery2020). Context encompasses an in-depth understanding of the stakeholders’ interests, user needs, problems with existing solutions, environmental and situational context, and reframing of goals (Studer et al., Reference Studer, McKilligan, Daly and Seifert2016). This information adds meaning and influences how readers interpret objects and situations (Charnley et al., Reference Charnley, Pease and Colton2012). In essence, contextual information dwells on the question of “Why am I designing this artifact?”. Understanding contextual information may help challenging assumptions and expand designers’ perspectives about the early stages of the project at hand, impacting design outcomes’ creativity. Participants who received the contextual brief may also be more inclined to adopt the role of user and thereby prioritize the user's satisfaction over the need to meet the brief's requirements (Koronis et al., Reference Koronis, Chia, Kang Kai Siang, Silva, Yogiaman and Raghunath2019).
Physical examples, such as prototypes, and visual examples, such as sketches, were reported to share the mental load of internal conceptual representations when dealing with highly complex problems (Viswanathan and Linsey, Reference Viswanathan and Linsey2012). These external representations were introduced to facilitate the ideation process and break the design fixation cycle. Although physical examples have different effects on idea generation, what that effect remains inconclusive. Therefore, there is a need to study example solutions in the form of stimuli to better understand their impact when encountered in the idea generation process. Since pictorial examples in ideation have been extensively investigated (Toh and Miller, Reference Toh and Miller2014), our study considers the effect of physical examples instead.
Ideation and creative outcomes
Engineering design research on ideation has devoted much attention to studying how concept selection impacts the development of creative ideas (Toh and Miller, Reference Toh and Miller2015; Zheng et al., Reference Zheng, Ritter and Miller2018). The ideation stage is one of the most inventive and explorative processes of every design project. During that stage, designers are inevitably influenced by earlier examples and artifacts they interacted with or were provided along with briefing. Earlier scholarship into engineering education has documented ways to foster creativity and innovative thinking for individuals and design teams (Cropley and Cropley, Reference Cropley, Cropley, Kaufman and Baer2005; Toh and Miller, Reference Toh and Miller2015; Binyamin and Carmeli, Reference Binyamin and Carmeli2017; Guo et al., Reference Guo, Su and Zhang2017).
Research has shown that textual stimuli can help participants increase their originality (Goldschmidt and Sever, Reference Goldschmidt and Sever2011), implying that textual stimuli can be potentially beneficial for inspiration in creative design ideation. In earlier work, Koronis et al. (Reference Koronis, Chia, Kang Kai Siang, Silva, Yogiaman and Raghunath2019) discussed the main effect of providing various brief formats with stimuli. The findings suggested methods to improve creativity outcomes, highlighting that designers or clients should consider excluding any stimuli or quantitative information in the design brief.
Designers can benefit from general and abstract representations (Linsey et al., Reference Linsey, Wood and Markman2008), while the latter causes a high number of ideas and offers more creativity than their concrete counterparts (Vasconcelos and Crilly, Reference Vasconcelos and Crilly2016). Gonçalves et al. (Reference Gonçalves, Cardoso and Badke-Schaub2013) suggested that texts with a moderate abstraction level can inspire designers to an optimal degree. Pahl et al. (Reference Pahl, Beitz, Feldhusen, Grote, Wallace and Blessing2007) suggest that abstraction helps to identifying fictitious constraints and eliminate all but genuine restrictions (p. 65). Their textbook includes step-by-step instructions to guide the framing of requirements that lead to defining the objective without laying down any particular solution.
In the design studio, to successfully tackle a design problem, students need to be conscious of the task's main goals and priorities. To this aim, a design brief must provide them with guidance and direction through the design process (Chen, Reference Chen2016; Koronis et al., Reference Koronis, Chia, Kang Kai Siang, Silva, Yogiaman and Raghunath2019). Hence, in the present study, we want to expand the exploration of the relationships between the external representations and creativity levels, measured by Novelty and Usefulness of completed sketches. This may facilitate understanding the influence of different stimuli on creative outcomes and promote a holistic comprehension of the design process in the early stage.
Research objectives
This empirical study aimed at assessing creativity, using multiple metrics, including a hands-on drawing exercise, a post-sketch survey, and judge ratings on sketches. A creative project is often initiated with a design brief, and yet, there is an absence of literature identifying what constitutes an effective design brief, and how its structure could impact the designers’ creative cognition and outputs in terms of Novelty and Usefulness. Addressing this gap, we manipulated various fidelity levels of stimuli to determine which one can be amalgamated to constitute an evocative design brief.
The second area of interest was determining whether design briefs effectively stimulated students, thus examining feelings regarding the design briefs and how they correlate with each of the survey components. Lastly, we ascertained whether students’ stimulation by the design brief is related to product awareness from our survey questionnaire. Our intention was to explore whether their familiarity with the task or prior knowledge on the domain encapsulates relationships with their creative outcomes. With the aims above in mind, we formulated the following research questions (RQs):
-
RQ1. What level of stimulus fidelity is required to improve students’ creative outcomes during the sketch exercise?
-
RQ2.1. Are there significant relationships between the student's perception of the design brief and their creative outcomes?
-
RQ2.2. Is previous knowledge and familiarity with a design task enabling students to generate more creative outcomes?
Methods
Participants
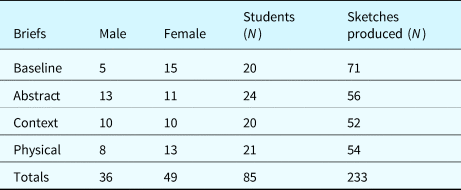
The experiment was conducted in a product design-oriented course in a university with a sample of 85 first-year undergraduate students actively involved. The age of students ranged between 19 and 21 (with an average age of 20 years). As part of the admission practice, students were allocated to classes with an equal mix of educational backgrounds, academic scores, nationalities, and major subject preferences. Each class of students was randomly assigned to one of the four experimental groups; therefore, participant groups were reasonably homogeneous to allow for a fair comparison. For this sketch exercise, students were divided into 4 groups of 18–24 studentsFootnote 1 per group. Table 1 shows descriptive statistics for each of the various experimental groups.
Descriptive statistics for the classes

Experimental procedure
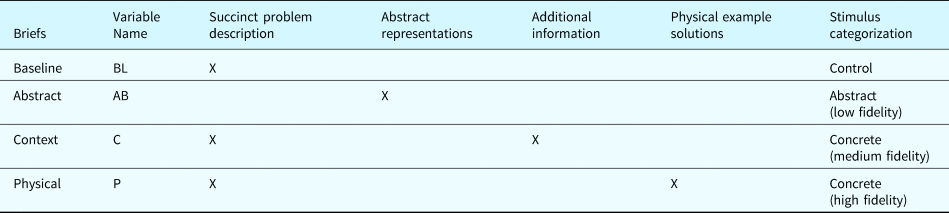
Students were invited to participate in the study to deal with a short sketch activity. Four varying design briefs (listed in Appendix 1), of various abstract and concrete nature levels, were provided to respective groups to investigate the influence of stimuli on the design outcomes. One group acted as a control group in the below setting:
• Baseline: This group did not have admission to any stimuli; participants received a succinct problem description.
• Abstract: A generic brief was handed to the participants inclusive of abstraction propositions.
• Contextual: The contextual group received textual description intending to contribute to develop empathy toward the user.
• Physical: Participants received a number of example solutions to interact with before the control brief was given.
The terms used in the abstract brief are hypernyms, meaning that they had higher-order words or a semantic relation compared with the control brief, for example, using the term “Design a way of” instead of “Design a device” and Displacement” instead of “Movement”. The terms in the control brief are more tangible and relatable, while those in the abstract brief are more conceptual and imaginative. Hence, groups with abstract representations as stimuli received requirements in a language of simple, generic principles that student designers relate to, intending to improve association and transfer (in Appendix 1 side to side comparison).
The various briefs were deliberately created to permit participants to explore a broad range of concepts, so they would not be unduly penalized for lack of knowledge in any specific domain. The potential bias of external motivation was controlled for participants informed that incomplete sketches would bear no influence on their academic standing or performance. The outline of Table 2 helps map the various types of information that each group received with the design brief.
Categorization of variables in the coding system and information available to students

A pre-sketch survey (found in Appendix 3) was designed as a short form and sought demographic particulars, the allocation for the study, and ascertained their familiarity with the requested design task (Awareness). It was a short anonymous data collection of participants after the implied consent was obtained. All participants were given identical material packages containing an A3 size paper and pens to complete their sketches.
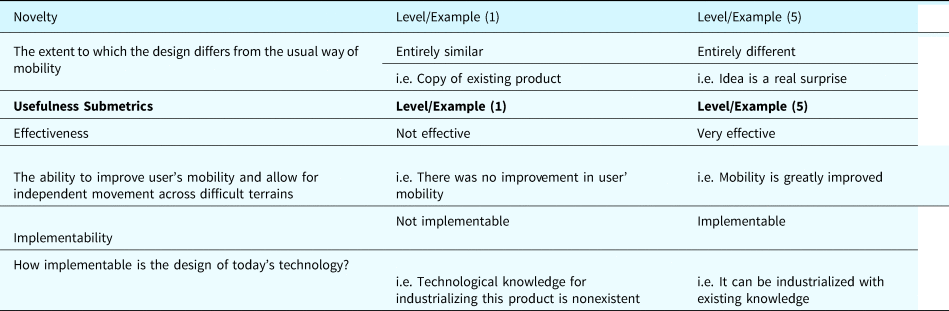
Next, participants were tasked to individually sketch their solution concepts on an ideation task consisting of designing “A device to improve mobility for low-income persons with physical disabilities”. Students were allocated 15 min to develop three concepts. They were instructed to be as creative as possible with the connotation that in our experiment, three metrics create scores for creativity (refer to Table 3). We assumed that using an assistive device or helping someone use a mobility device would be an instance that several students would have experienced before. Τhe survey results showed that 51.8% of the participants (42 individuals) have used or assisted someone to use a mobility aid(s)/device(s) for the disabled.
Creativity metrics rubric with examples

After sketching, the participants completed a post-activity survey dwelling seven questions grouped into sections (in Appendix 4); this second survey investigated feelings regarding the design brief. The sketches were later submitted to the judges, who graded the sketches in subsequent weeks based on a rubric aiming to score creativity on novelty and usefulness measures.
The solutions were solicited in the form of sketches. The level of detail in sketches was left entirely to the students, and all sketches were accepted, regardless of their detail level. The evaluators accepted all solutions and had the effectiveness metric to score low if the sketch was not satisfying brief requirements. We assume the amount of time was sufficient to produce ideas, as the largest number of best ideas are generated during the first 15 min (Howard et al., Reference Howard, Dekoninck and Culley2010).
Creativity metrics and factor analysis
The creativity of design outcomes can be assessed in several ways, including consensual and conceptual measures. Amabile (Reference Amabile1996) has included the constructs of novelty and appropriateness (usefulness, correctness, and valuableness) when applied to a product or response. More recent literature in the field of design science suggests a plethora of metrics for evaluating creative outcomes from an ideation task. These include novelty, Variety, Quantity (fluency), Quality (Shah et al., Reference Shah, Smith and Vargas-Hernandez2003), Workability, Relevance, and Specificity of Ideas (Dean et al., Reference Dean, Hender, Rodgers and Santanen2006). Kampylis and Valtanen (Reference Kampylis and Valtanen2010) suggest that creative products must be novel (original and unconventional) and appropriate (valuable and useful), while Runco and Jaeger (Reference Runco and Jaeger2012) state that there is a general agreement that originality and usefulness are necessary components of creativity.
While there are many metrics and approaches for evaluating creativity, the metrics, novelty and usefulness were chosen for this particular study because of their simplicity and understandability. Prior to this work, we conducted a pilot study, where it became apparent that novelty and appropriateness [alignment of a concept with the requirements in the design brief, also termed “quality” by Shah et al. (Reference Shah, Smith and Vargas-Hernandez2003)] did not capture the effectiveness of the design outcome, which is an important element in functional engineering creativity (Cropley and Cropley, Reference Cropley, Cropley, Kaufman and Baer2005). Thus, adopting the definitions of Dean et al., our creativity metrics are most closely aligned with the dimensions of novelty (“the degree to which an idea is original and modifies a paradigm”), relevance (“the idea applies to the stated problem and will be effective at solving the problem”), and workability (the idea “can be easily implemented and does not violate known constraints”) (Dean et al., Reference Dean, Hender, Rodgers and Santanen2006). Our past efforts assessing creativity showed that this approach makes our assessment more comprehensive amongst judges; while using these metrics, ideas have been shown to determine if there is an effect or outcome from a test condition.
Novelty was defined as the extent to which the design differs from usual forms of mobility. Under the lens of historical creativity, as Boden (Reference Boden and Boden1996) defines it in her work, we considered a product being fundamentally novel “with respect to the whole of human history” and not fundamentally novel with respect to the individual mind which had the idea. Usefulness encapsulated multiple facets as our interest in using a modified version of the usefulness metric was to include a broader definition by a series of Usefulness factors (Dean et al., Reference Dean, Hender, Rodgers and Santanen2006) with several possible interpretations by the participants. Therefore, Usefulness was measured as an embodiment of Implementability, Effectiveness, Applicability, Ease of Use and Storage, and Affordability. As such, we hoped to assess idea solutions in the form of products and services rendered by participants with a broad enough Usefulness metric.
In general, all judges valued and scored high in novelty the ideas that were different and came from other domains even if those ideas were not feasible – copying existing products predisposed them to mark with the lowest grade possible (1 out of 5). In contrast, existing solutions could still score high in Usefulness since the metrics were established as orthogonal. Independently of the influence of the design brief conditions investigated, the creativity of the design outcomes might also depend on other variables besides our control. These include, but might not be limited to, individual skills, cognitive styles, motivation, and task dedication.
After sketches were evaluated, exploratory factor analysis was performed using the maximum likelihood method to test sampling adequacy. An insufficient number of primary loadings of the Usefulness sub-metrics suggested that three out of the five items were eliminated from Usefulness, as they did not contribute to cross-loading of 0.3 or above. For this reason, two metrics – Novelty as a unidimensional metric and Usefulness as a unidimensional construct – composed of the mean score of Implementability and Effectiveness – were used to evaluate the creative outcomes based on equal weighting. Confirmatory factor analysis revealed high loadings among the sub-dimensions that comprise Usefulness and high discriminant validity between Novelty and Usefulness.
Design outcome evaluation
The broad judging panel included faculty members familiar with the domain of the product, academic researchers and engineers from architecture, design education, and the consumer product design industry. In total, three judges assessed student's creative outcomes using a rubric-based system. The panel used their domain-based expertise to judge the Novelty and Usefulness of the concept drawings without consulting each other during the process, in line with existing practices (Baer, Reference Baer2008). All judges were blind to the study's hypotheses and experimental conditions and had at least 10 years of experience in their respective fields. Τhey had domain-specific understanding and awareness of the relevant practical issues giving them an “expert status”, that is fairly consistent across their corresponding domains (Kaufman and Kaufman, Reference Kaufman and Kaufman2007).
The sketch evaluation was conducted with reference to the consensual technique of creativity assessment (Amabile, Reference Amabile1996). This technique is based on the ratings of a group of “expert judges”, validated as a reliable and consistent evaluation practice among expert judges (Amabile, Reference Amabile1996; Baer, Reference Baer2008). We measured creativity via a framework that follows the Amabile peer evaluation technique (CAT) utilizing a rubric-based system and Likert scale with minimal and generic descriptions. Accordingly, we included an assortment of judges that allow for subjective viewpoints on the evaluation of creative works but did not use CAT scales. Table 3 helps to explain better how the scales have been handed to the judges, who we assume shared similar understandings of all creativity metrics to a reasonable degree.
Due to our focus being on the quality (rather than quantity) of the design outcomes, we did not account for the number of ideas or student's cognitive overload as a metric for scoring the design outcomes. As such, we accounted for the fact that in some cases, students generated a single idea instead of three, and we treated all ideas as they would have given the same merit.
At the cessation of the creativity evaluation, the interrater reliability was checked for consistency among judges. The intraclass correlation coefficient (ICC) estimates of a two-way random effect model on the absolute agreement were employed using SPSS version 25. The ICC results were in the good to fair range (Hallgren, Reference Hallgren2012), where novelty scores were 0.67 (95% CI 0.55–0.75), implementability scores were 0.51 (95% CI 0.34–0.64), and for effectiveness, scores were 0.55 (95% CI 0.39–0.59). For this study, all creativity indices were treated as continuous data.
Correlations between the survey questions and creative outcomes
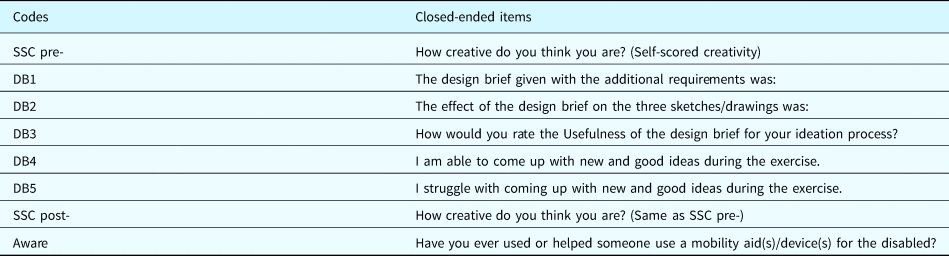
This study is further concerned with the relationship between students ascertained feelings about the design briefs and the creative process of students’ designs. Subsequently, the creativity indices and pre- and post-sketching survey responses were assessed for the existence and the degree of linear relationships per group. On another note, we ascertained the product awareness and asked students to indicate whether they were familiar with the product they will design for. All survey questions are listed in Table 4, see Appendix 3 for all descriptive stats.
Survey questionnaire items

Results
Statistical analysis
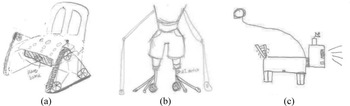
Examples of concept sketches are shown in Figure 1 in varying degrees of creativity. This experiment yielded 233 sketches from student designers (see Table 1 for descriptive statistics).
Sketches with varying degrees of novelty and usefulness scores; low novelty and high usefulness (left); high novelty and low usefulness (middle); high novelty and high usefulness (right).

Data outliers were retained in the set, as they presented natural variance in participant responses. The Shapiro–Wilk test was conducted to ascertain a normal distribution across the sample. Both outcome indices were not normally distributed (p < 0.05). This is likely due to the small number of discrete levels for our response variable. Our creativity metrics were evaluated on Likert-type items with five integer levels, so our creativity scores are discrete and ordinal. In a past study, we have argued that these kinds of evaluations lead to discrete values and often violate normality assumptions (Kang et al., Reference Kang, Chia, Koronis and Silva2018). In addition to that, Levene's test for equality of variances showed that the assumption of homoscedasticity was violated (p < 0.05). As such, the non-parametric equivalent to a one-way between-groups analysis of variance (ANOVA) Kruskal–Wallis test was implemented to compare the different brief outcomes. The pairwise comparisons per metric indicated statistically significant differences across several conditions described in the following subsections.
An example solution considered relatively novel and highly useful is illustrated in Figure 1a. To deal with the task, the student drew a chair sporting a triangular wheel structure with a power source and remote control. Furthermore, the design was also regarded as a very functional solution that could be easily implemented. Consequently, this solution scored 4.13 points for Usefulness, and 3 points for Novelty. Figure 1b illustrates a case of a highly novel solution to the mobility design task by one of the students. It is introducing a kind of leg exoskeleton designed to support the wearer's body weight. Additional longer wheels are attached to the back of the person's body. This solution, even if it was considered novel, appears to have balancing issues. As such, the idea scored 4.67 points for Novelty, and 2.75 for Usefulness. Figure 1c shows an example of a highly novel solution, which was considered to some extent surprising since it succeeded in modifying existing paradigms. The outcome scored 4.65 points for Novelty, and a 4 for Usefulness and depicts a robotic dog-like creature with a light-emitting head.
Novelty
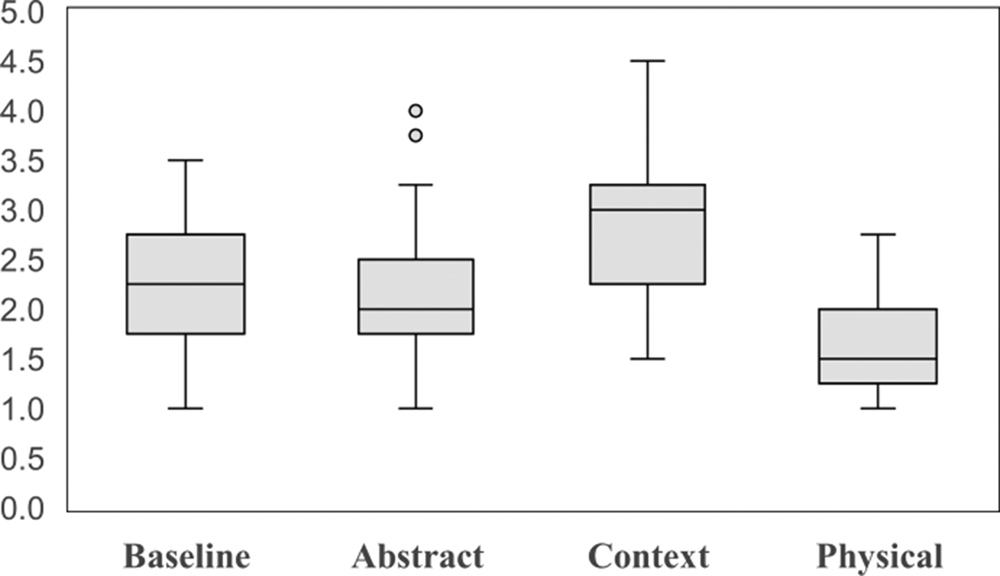
In examining the differences between the classes using the Kruskal–Wallis Test, a significant difference was revealed in mean Novelty scores, H (3, n = 233) = 71.28, p < 0.05. The test provided strong evidence of a difference (p < 0.001) between the mean ranks. Those of the contextual brief (C) recorded higher scores than the other three brief groups (see Fig. 2 boxplots), achieving higher scores for the top 25% while no outliers and extreme scores were observed (shown as a circle). Additionally, sketches from this group exhibited statistically significant differences when contrasted against the Baseline, which fared the second-best performance amongst the briefs.
Proportion illustrations of novelty by brief conditions.

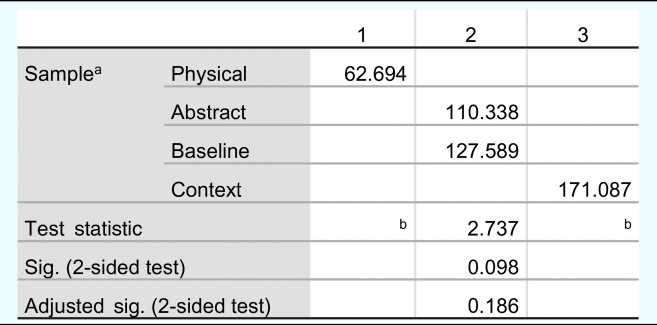
A follow-up analysis (Dunn's post hoc tests) showed that the Contextual brief ranked first on this metric. Homogeneous subset tests showed that the group was given the contextual information clusters on its own at the third subset. In other words, comparing it with the rest of the lower-ranking groups produced a significant difference. There were also no significant differences between the Abstract and the Baseline, as they belong to the same ranking group. However, the latter groups are preferred over the Physical brief when Novelty is under consideration, as the Physical is clustered on the lowest ranking subset. Appendix 2 shows the subsets per group and their clustered mean scores in different columns.
Usefulness
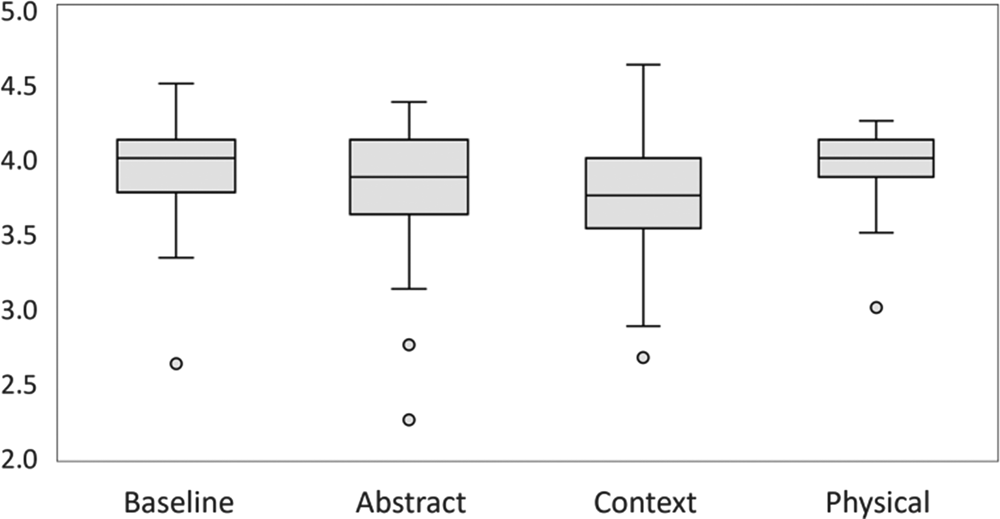
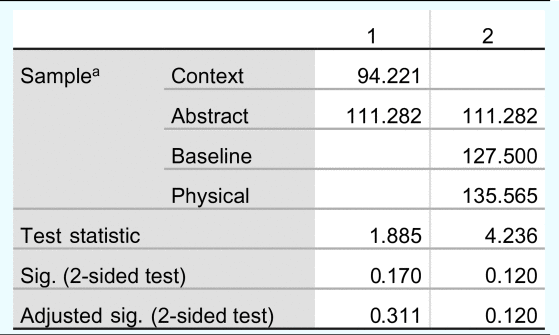
Τhe magnitude of the adjusted statistical significance of the average scores indicated that Usefulness scores were significantly affected by the provision of variable stimuli, H (4, n = 233) = 18.77, p < 0.05. Students with the Physical and Baseline briefs scored highly in this metric, while the ones in the Contextual brief marked the worst performance for Usefulness as realized in Figure 3 boxplots. The circles right below the whiskers indicate data outliers. Inspecting the ranking scores of Appendix 2, the Physical brief recorded the highest median score, thus nominating it the most promising in improving Usefulness.
Proportion illustrations of usefulness by brief conditions.

The following stepwise test inferred insignificant differences in Usefulness scores between those who received the Baseline and those who received the Physical briefs, p = 0.120. The aforementioned groups are clustered under the same subset – thus, they are homogeneous – but none is significantly better than the other. However, according to the arrangement of the mean values, the Baseline and Physical briefs are statistically significantly different from the Contextual brief.
Overall, providing contextual stimuli lowers Usefulness significantly compared to all other groups. All other stimuli had no significant effect on improving Usefulness (see Appendix 2).
Correlation analysis
Overall, fewer observations were collected from the students – a smaller sample completed the sketching activity – as few requested to opt-out from the survey. Participants had the option to remove their responses from this survey, and accordingly, only those who completed the pre- and post-sketch surveys and had their scores paired with the design outcomes were included in the analysis. Descriptive statistics in Appendix 3 show the percentage of responders, including their genders, who completed the survey by the experimental condition.
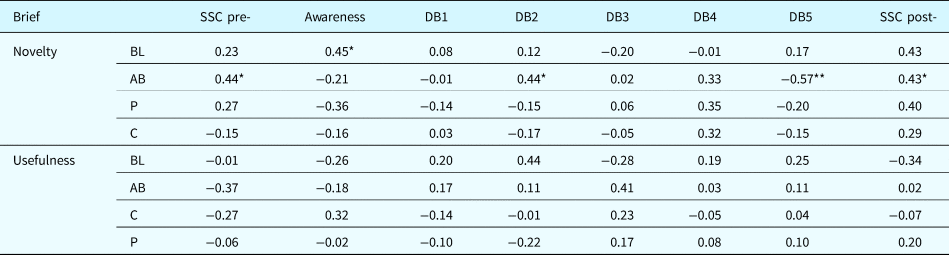
The Spearman rank-order correlation coefficients were carried out in the SPSS to assess the existence of statistical relationships. Table 5 shows the correlation of survey responses with design outcomes per group. Statistically significant correlations (marked with an asterisk) are observed within the abstract brief for self-scored creativity (SSC), effect of the design brief (DB2 and DB5). Creativity was also significantly related to the SSC post-, r = 0.43, p = 0.004. Lastly, a significant positive relationship was found between Awareness and the Baseline brief on Novelty. This correlation tends to increase negatively on all other briefs on this metric. In the Usefulness, there was one positive correlation for the Contextual brief, although it did not reach significance.
Correlations between survey and creative outcome (n = 85)

*p < 0.05, **p < 0.01 (two-tailed test).
Students who received the Abstract brief found it stimulating for their creativity; the survey item DB2 was positively related to the novelty scores (r = 0.44, p = 0.004). In addition, a substantial proportion of students (43.5%) found the briefs helping them score well and nominated it as “highly stimulating”. Brief BL was the most stimulating (by 45% of respondents); however, it had no significant correlation to any of the creativity indices.
The survey item DB5 and novelty scores were negatively related (r = −0.57, p = 0.001); however, this also implies that high novelty scores are associated with the ease of coming up with original and better ideas. This effect, coupled with the Novelty DB2 correlation, combines to suggest that low-fidelity briefs helped students inspire Novelty. However, also, these briefs were perceived as less constraining compared to briefs of higher fidelity.
Positive linear relationships between Novelty and SSC post- show that students generally felt they contributed with creative ideas after the sketch exercise. Though this observation was common for all briefs, it was significant only for students of Brief AB. The Baseline brief showed a positive correlation in Awareness (r = 0.45, p = 0.05), suggesting that unfamiliar with the ideation task, students would still score high in Novelty.
Almost half of the participants (43 out of 83) were aware of mobility devices or interacted with them. However, there was no significant relationship between the ones that scored high on Novelty and any other brief than the Baseline in the population where participants are aware. The remainder briefs had mainly negative correlations observed, but none of them were deemed significant. Ultimately, no significant associations were found between the Usefulness metric and any of the survey response categories. These observations raise the possibility that product awareness (mean number of students familiar with mobility devices) is not tied to the brief stimuli (correlated) for improving the creativity metrics.
Discussion
With respect to RQ1, the findings highlighted that medium-level fidelity stimuli, such as contextual information provision, helped students achieve higher Novelty scores. Our results show that students are able to produce more novel ideas, as the content of the textual stimulus becomes more concrete (in Contextual brief). In our view, contextual information can contribute to providing the designers with an empathic point of view. This can be due to the briefs giving details on the product's importance and health benefits to the users (Koronis et al., Reference Koronis, Chia, Kang Kai Siang, Silva, Yogiaman and Raghunath2019). As such, students likely prioritize user needs over the need to meet the brief's requirements, which may explain the positive effect on Usefulness (Ryd, Reference Ryd2004; Sadowska and Laffy, Reference Sadowska and Laffy2017).
Contextual briefs motivate designers by communicating the higher management's vision, explaining how the design project meets market demand, and helping designers empathize with user needs/difficulties and see the broader societal benefit of their work (Guay et al., Reference Guay, Vallerand and Blanchard2000). Koronis et al. (Reference Koronis, Chia, Kang Kai Siang, Silva, Yogiaman and Raghunath2019) reported similar attributes regarding the importance of contextual information with physical examples permutation in another design problem (orange squeezer). The combined effect of contextual and physical stimuli was equally beneficial for Novelty and Usefulness. In addition to that, an overall decision that collectively considers all the mean values and aims to maximize the creativity metrics suggested that the physical–contextual brief was the optimal one. As such combining these stimuli should be promoted in design briefs.
On the other hand, abstract representations based on a brief with abstract functions at a higher level yielded lower Novelty scores. Note that abstract briefs employed in this work were not devoid of content but were not as specific to the level of details as the contextual and physical ones (see Appendix 1 for full descriptions of each design brief). This finding challenges the literature, where the exposure to higher fidelity conditions resulted in less novel ideas, while low-fidelity stimuli yielded more novel ideas (Cheng et al., Reference Cheng, Mugge and Schoormans2014). Though Vasconcelos and Crilly (Reference Vasconcelos and Crilly2016) suggested the possibility of using more abstract (low-fidelity) representations in counteracting fixation, the present study recommends otherwise if Novelty is the goal. Cascini et al. (Reference Cascini, Fiorineschi and Rotini2019) also observed fixating effects in groups of students who provided abstract propositions. However, their novelty measures – including variety with a posteriori novelty calculation by the work of Shah et al. (Reference Shah, Smith and Vargas-Hernandez2003) – were different from those used in our study. Our novelty definition followed the Amabile definition of Novelty as to extent to which a design differs from the usual way of completing the requested task. Thus, using different assessment approaches could be another reason for which our results diverge.
Another possible interpretation of the lower performance in novelty could be that the higher-order words included in our abstract briefs could have influenced the design exploration paths pursued by students in a different manner, that is, leading them to face the design task from deviating abstraction levels (e.g., decreasing the range of associations and domains instead of encouraging associative thinking and knowledge transfer). Perhaps a type of abstract formalisms similar to the studies reviewed above (examination of lower abstraction levels) could have brought idea generation and problem-solving paths yielding higher novelty scores. Also, participants may wonder why they are being exposed to that extra material and change their idea generation process accordingly (Vasconcelos and Crilly, Reference Vasconcelos and Crilly2016).
Our challenging findings might be the result of novice students’ scarce experience and the fact that they do not know the methods and/or have the tools to fully conceive and develop a concept solution starting from the abstract description of the design task. In analogous briefs, our novice students with lesser experience and knowledge posited that they were not benefited from utilizing those briefs as opposed to more advanced students. Experience in design projects and assignments would likely help designers contribute more novel ideas and solutions to abstract briefs (Koronis et al., Reference Koronis, Casakin, Silva and Siang Kang2021). Advanced students were observed being more able to apply abstraction and establish structural mappings between the available stimuli and the design task. However, the “why” and “how” behind the different fidelity levels and the effects on creative outcomes – for instance, how contextual information leads to creative solutions – have yet to be answered. We will have to understand the thought processes, motivations, and factors that influence the participants’ decisions.
While some studies purported the positive relationship between textual stimuli and the originality of ideas, others found that images yielded better results, and physical objects reduced the novelty and variety of final concepts (Toh and Miller, Reference Toh and Miller2015). Linsey et al. (Reference Linsey, Tseng, Fu, Cagan, Wood and Schunn2010) and Heckler (Reference Heckler2010) also highlight those concrete representations in the form of example stimuli create highly aligned or useful design outcomes. In our study, physical examples classified as a concrete representation provided an increased degree of fidelity and helped generate more useful than novel ideas. Five of the participants (26%) indicated the narrowed effect of their initial ideas from exposure to concrete representations. We can infer from these observations that high-fidelity stimuli appear to steer the student designer away from potentially innovative or disruptive avenues.
Given our survey and RQ2.1 analysis, it seems worrying that respondents wrote that most of the briefs were “somewhat useful”. Surprisingly, this opinion was more common among students who received the Baseline group (16 out of 20). This practice is at odds with our experimental findings, as participants in this group ranked second-best in both creativity indexes. While some degree of ambiguity is desirable to promote innovation and creativity in the design studio, instructors should provide the necessary conditions for minimal frustration and confusion (Sawyer, Reference Sawyer2017). Thus, using design briefs to communicate the design of artifacts requires gauging factors such as how detailed written instructions should be or which – if any – visual examples have to be provided.
We have noticed a few students saying that briefs had no effect on their sketches or suggested that they felt constrained by the briefs. As educators, we hope that students can be unconstrained and let their imaginations run free, yet expect them to conform to briefs’ requirements (Beghetto and Sriraman, Reference Beghetto and Sriraman2016). Therefore, it is quite challenging to strike the right balance between promoting Novelty and Usefulness to improve student concepts’ creativity.
In RQ2.2, we sought to investigate whether familiarity with the design task enables students to generate more creative outcomes. As our results indicate, there were no statistically significant differences in the student (self-reported) Awareness and the variable groups besides the Baseline group's Novelty scores (Table 5). Broadly speaking, this positive correlation suggests that having a high level of Awareness of the domain will only assist the ones receiving a succinct description of a design problem. Added information and stimuli fixate the designers; thus, they tend to produce fewer novel outcomes because design fixation is evidenced (Jansson and Smith, Reference Jansson and Smith1991; Cassotti et al., Reference Cassotti, Camarda, Poirel, Houdé and Agogué2016).
Limitations and future work
One main limitation of this study is that findings collected from first-year students who embarked on this activity with no prior design knowledge may limit the extension of these results to advanced students and/or professional designers. Considering our sample was that of first-year undergraduate students, it is perhaps correct to expect our novice students from this background to be less fixated than practitioners and allow their creativity to construct sketches with originality. James et al. (Reference James, Kuan, Anwar Ali, Huang, Ganeshkumar, Behera, Sanaei, Otto and Hölttä-Otto2014), in their study, indicate that experts were found to be more practical, structured, detailed, and had more control of actions during design, compared to their novice counterparts who were found to consider larger space of solutions and the ability to generate more ideas, though not realistic. Practitioners can be engaged in smaller numbers during design innovation workshops; however, the scope of this paper currently does not include professional designers as participants, but future work in this domain may seek to provide insights into this direction.
Additionally, there are other aspects of requirement elicitation in the design brief worthy of investigation, such as populating design specification via a requirements checklist described by Pahl et al. (Reference Pahl, Beitz, Feldhusen, Grote, Wallace and Blessing2007) or via a more abstract-level multi-purpose requirements checklist as discussed in the work of Becattini et al. (Reference Becattini, Cascini and Rotini2015). However, these investigations lie beyond the scope of this paper. Lastly, this research will benefit from being tested in other participant pools, such as working adults or those in disciplines other than design. Nonetheless, we provide the impetus for future research to the existing findings by testing the representations in combination and measuring the effect between the brief and the respective representations.
Future studies can be improved by involving participants from the design professions to support our findings outside academic settings. One could consider increasing the sample size to ensure the generalization of results on other populations and settings; however, it is not always sufficient to increase the participants’ numbers. This is because institutions' teaching approaches may vary or have additional educational resources and, more importantly, different relations/collaborations with industrial partners. These factors could result in potential differences among institutions in terms of student–practitioner skills/expertise.
Using semantic analysis, future investigations may look deeper into why and how abstract and concrete stimuli interact to influence creativity scores by analyzing the participant input (written comments) from the sketching exercises. To further this study, we could go more in-depth into understanding cognition mechanisms through semantic analysis to uncover more in-depth insights into influences on creativity outcomes and participant perceptions and profiles.
Conclusion
This study aimed to answer three research questions, which revolved around identifying determinants that enhanced the creativity indexes (Novelty and Usefulness) and exploring their downstream relationships with product awareness and design brief perceptions. Our study suggested that concrete representations with medium specificity levels, including contextual information, positively influence Novelty scores. On the other hand, high-fidelity representations improved the Usefulness of design outcomes, while low-fidelity stimuli – in the form of abstraction – negatively influenced both Usefulness and Novelty scores.
From the student's perspective, low-fidelity briefs were perceived to inspire their Novelty outcomes and identified those briefs as less constraining than higher fidelity briefs. In addition to that, a significant positive correlation in the abstract briefs shows that students felt that they are creative before and after the sketching exercise in this group.
In assessing students’ prior knowledge and their impact on the creative outcomes, no clear relationship between the product awareness and the creativity of their concept sketches was highlighted. This finding potentially allows for more flexibility in design team configurations. In that sense, not all group members will have to have prior experience with the product they will design to ensure high-quality outcomes.
This research may prove valuable to the pedagogy of design and creativity for educators to deliver briefs tailored that optimize communication and maximize creative outcomes of design ideas. Educational programs aimed at promoting creativity in the design studio may find it useful to consider that the way design briefs are constructed can either promote or inhibit different aspects of design creativity.
Georgios Koronis is a Research Fellow Professor in Singapore University of Technology and Design at the Engineering Product Development pillar. His primary research focuses on two major areas, creativity and design innovation. He is investigating how framing a design brief, and input data affect the design outcome of designers.
Arlindo Silva is an Associate Professor in Singapore University of Technology and Design at the Engineering Product Development pillar. His current research interests rest on design methods and techniques, product design and development, engineering education, creativity, materials selection methodologies, renewable composites, cost modeling and management of uncertainty in design.
Jacob Kang Kai Siang is a Ph.D. graduate from the Singapore University of Technology and Design at the Engineering Product Development pillar. His area of ongoing research includes the intersection between design, innovation and development of product service systems that have tangible impact on people's lives.
Christine Yogiaman is Assistant Professor at in Singapore University of Technology and Design at the Architecture and Sustainable Design pillar. Her work covers research and sustainable design practice on architecture, computation pertaining to the description, generation, and construction of architecture and urban environments, design performance, and architectural operations.
Appendix 1. Design Briefs with various permutations of stimuli
BASELINE BRIEF (BL)
Problem Description:
Design a device to improve mobility for low-income individuals with physical disabilities.
Customer Needs:
– Help the user move independently across uneven, narrow, or inclined terrain.
– Affordable device cost.
– Be easy to maintain and repair.
– Be easy to store or move device when not in use.
– Support the movement of the user onto and off the device (support daily living).
ABSTRACT BRIEF (AB)
Problem Description:
Design a way to improve mobility for low-income persons with physical disabilities.
Customer Needs:
– Help the user move independently across difficult, uneven, narrow, or inclined terrains.
– Be affordable.
– Be easy to maintain and repair.
– Support the movement of user onto and off the device (support daily living).
– Be easy to store or move when not in use.
To assist you in developing your design, consider the following abstractions:
Transferring energy from system or device to people with little or no energy.
Transferring signals from person to system or device.
Effecting a controlled displacement of an object in any axis.
Acquiring within a person's resource capability.
Restoring something to its original state.
Transforming an entity to fit storage dimensions.

Side-by-side comparison between concrete and abstract representation
THE PHYSICAL DESIGN BRIEF (P)
Provided in class are several mobility devices. The idea here is to put yourself in the user's shoes.
Problem Description:
Design a device to improve mobility for low-income persons with physical disabilities.
Customer Needs:
– Help the user move independently across difficult, uneven, narrow, or inclined terrains.
– Be affordable.
– Be easy to maintain and repair.
– Support the movement of user onto and off the device (support daily living).
– Be easy to store or move device when not in use.


Photos of physical examples provided to the participants in the group with the physical brief
THE CONTEXTUAL DESIGN BRIEF (C)
Problem Description:
Design a device to improve mobility for low-income persons with physical disabilities.
Physical mobility is essential for daily life, whether you need to walk to the kitchen or toilet, travel to work, or get groceries. In addition to those with physical disabilities, loss of mobility is especially common among the elderly. Based on UN projections, Singapore's elderly population (defined as those aged 65 years and above) is expected to continue to rise rapidly, reaching almost half of Singapore's total population by 2050. This will increase the absolute number of people with mobility and activity limitations.
Losing mobility has physical, social, and psychological consequences. The dependence on others to move around makes it more challenging to carry out daily activities, participate actively in society, and develop meaningful relationships. Social isolation may cause a sense of loneliness, worthlessness, and depression. For those facing financial difficulties, cost-effective mobility solutions are especially impactful.
Improving mobility for the elderly and people with physical disabilities from lower-income groups will enable independence in their daily activities. Mobility is important to help them be engaged in society and live dignified lives.
Customer Needs:
– Help the user move independently across difficult, uneven, narrow, or inclined terrains.
– Be affordable.
– Be easy to maintain and repair.
– Support the movement of user onto and off the device (support daily living).
– Be easy to store or move device when not in use.
Appendix 2. Homogeneous subsets per brief condition, subsets are based on asymptotic significance at 0.05 level.
Novelty Scores Subset

Usefulness Scores Subset

Appendix 3. Descriptive and frequency data pre-experimental

Product Awareness Descriptive

Appendix 4. Descriptive and frequency data post-experimental


Appendix 5. Spearman's ρ correlations survey responses and creative outcomes
Sig. (two-tailed test)