



SCHEMATIC DIAGRAMS IN SECOND LANGUAGE LEARNING OF ENGLISH PREPOSITIONS: A BEHAVIORAL AND EVENT-RELATED POTENTIAL STUDY
Image schemas are abstract representations of recurring dynamic patterns of bodily interactions with the environment (Johnson, Reference Johnson1987). It is a key cognitive linguistics (CL) concept that explains the embodied origins of human meaning and thought. As an example, our recurring and ubiquitous daily interactions with all types of containers (e.g., a glass, a room, a vehicle, a human body) give rise to the abstract CONTAINER schema. And we develop automatic and unconscious knowledge of the schematic structural elements of a CONTAINER (Dodge & Lakoff, Reference Dodge, Lakoff, Beate and Grady2005): its boundary, interior, and exterior.
The schematic structures are instantiated in linguistic structures (Johnson, Reference Johnson1987). For example, the schematic spatial information of the CONTAINER schema can be encoded by prepositions or verbs in English. Static location in the interior of a container can be expressed by the preposition in (e.g., in a room). Motion from the interior to the exterior of a container can be expressed by the preposition out (e.g., out of the room) or by the verb exit (e.g., exit the room). A language has its own system of encoding the schematic structures of conceptualization. Observation and analysis of linguistic structures (especially grammatical structures) are an important approach that cognitive linguists employ to understand image schematic structures and thereby the structures of human cognition. English prepositions are so far the most heavily studied structure in the image-schematic analysis of language due to their preeminent functions of encoding spatial information in the language (see Brugman, Reference Brugman1988; Lakoff, Reference Lakoff1987; Tyler & Evans, Reference Tyler and Evans2003).
As speakers of different languages manifest variations in conceptualizations of the spatio-physical world (Munnich et al., Reference Munnich, Landau and Dosher2001), second language (L2) learners often face challenges mapping the differences between their L1 and the L2 spatial representations (Becker & Carroll, Reference Becker and Carroll1997). Late L2 learners have difficulty in correctly interpreting L2 spatial terms so that they are compatible with the geometric and functional requirements in the target language (Munnich & Landau, Reference Munnich and Landau2010).
Instruction that exposes learners to the target L2 schematic representations has been suggested to be a plausible solution to this learning problem (De Knop & Dirven, Reference De Knop, Dirven, De Knop and De Rycker2008; Tyler, Reference Tyler2012; Wong, Zhao, & MacWhinney, Reference Wong, Zhao and MacWhinney2018). Various authors have proposed visual diagrams to capture the embodied, physical-spatial meanings reflected in prepositions (Tyler & Evans, Reference Tyler and Evans2003), as well as verb forms (Langacker, Reference Langacker1991) and meanings of sentences. Importantly these diagrams are attempts to represent aspects of embodied experience, most particularly meaningful spatial configurations between a focus entity and a ground element. CL-inspired instruction uses schematic diagrams as a mediational tool for helping L2 learners achieve targetlike conceptualization of spatial configurations (Masuda & Labarca, Reference Masuda, Labarca and Masuda2015; Morimoto & Loewen, Reference Morimoto and Loewen2007) and as a consequence develop a deeper understanding of the L2 structure/concept (Tyler, Huang, & Jan, Reference Tyler, Huang and Jan2018).
The current study aimed at investigating the effectiveness of using schematic diagrams to teach English prepositions to Chinese learners of English in an EFL setting. Chinese learners even at advanced levels of English proficiency have been reported to experience difficulty in acquiring English prepositions (Ma, Reference Ma2007). An important reason is that learners tend to be confused by the differences in L1–L2 spatial categorizations. For example, in and at demonstrate a semantic distinction between the notions of containment and pinpointing in English. This semantic contrast is not observed in Chinese (Pederson et al., Reference Pederson, Danzinger, Wilkins, Levinson, Kita and Senft1998), and could therefore pose a challenge to the learners. The current study attempted to address this learning difficulty by integrating schematic-diagram‒based instruction in a computer-based online tutorial system. Learners with different L2 proficiency levels were compared on the treatment effects so as to examine to what extent individual difference plays a role in mediating the efficacy of the instruction. Learning outcomes were assessed by both behavioral and neurocognitive measurements. Brain potentials collected through the electroencephalogram (EEG) method revealed the nature of grammar learning motivated by the instruction.
IMAGE SCHEMAS AND LANGUAGE COMPREHENSION
Psycholinguists seek to establish the empirical grounds for image schemas. There has been converging evidence supporting that language comprehension activates spatial representations that resemble the image schemas associated with the sentences (see Hurtienne, Reference Hurtienne2011 and Gibbs, Reference Gibbs, Beate and Grady2005 for comprehensive reviews). For instance, Stanfield and Zwaan (Reference Stanfield and Zwaan2001) presented their participants with two types of sentences that were theoretically aligned with two schemas that differed in terms of spatial orientations: for example, He hammered the nail into the floor (the UP-DOWN schema) and He hammered the nail into the wall (the LEFT-RIGHT schema). After reading a sentence stimulus, the participants saw a picture of the object mentioned in the sentence (e.g., the nail) in either horizontal or vertical orientations. The authors found that participants gave significantly faster responses when the object orientation of the picture matched the orientation of the schema than when there was a mismatch.
Such a facilitation effect primed by implicit image schematic representations has also been reported in the processing of temporal expressions (Zwaan, Magliano, & Graesser, Reference Zwaan, Magliano and Graesser1995), concrete and abstract verbs (Richardson et al., Reference Richardson, Spivey, Barsalou and McRae2003), and nouns (Glover et al., Reference Glover, Rosenbaum, Graham and Dixon2004). Converging results support that image schemas are psychologically real. The inherent dynamics of image-schemas are seen as prototypical gestalts that impose constraints over the construing possibilities of a conceptualization. The image-schematic structure of the conceptualization is derived from basic sensorimotor experiences and is accessed automatically and unconsciously.
Studies in cognitive neuroscience have also been providing empirical evidence for the role of image schemas in language comprehension. The event-related potentials (ERPs) methodology provides excellent temporal resolution for analyzing the real-time scalp-recorded electrophysiological brain activity. Researchers who use this methodology are primarily interested in ERP components, which are brain activation patterns associated with various perceptual and cognitive processes. Image schemas are essentially a semantic construct and are expected to be related to an N400 component. The N400 is a negative brain wave that often peaks about 400 msec poststimulus onset for a semantically anomalous stimulus (compared to a semantically appropriate stimulus) (Kutas & Hillyard, Reference Kutas and Hillyard1980).
Zane and Shafer (Reference Zane and Shafer2018) compared English native speakers’ ERP responses to two types of prepositional phrases. The key manipulation was whether the preposition and the object that followed matched the geometric and functional features of the underlying schema in the phrase. Take the phrase in the bowl as an example of the matching condition. The preposition in and the object bowl fit the requirements of the CONTAINER schema. The mismatching condition was exemplified by the phrase in the plate, in which the object the plate does not possess the prototypical features of the CONTAINER schema (i.e., boundary, interior, exterior). The plate fits better with the geometric and functional features of the CONTACT and SUPPORT schemas and therefore is more semantically congruent with the preposition on. Zane and Shafer also created matching and mismatching phrases by using abstract nouns (e.g., in the moment vs. on the moment).
Zane and Shafer found limited evidence for an N400 for the mismatching phrases versus matching phrases. The N400 effect was only significant with concrete nouns and the effect size was small (η2 = .036). They only chose two midline electrodes (Cz and Pz) instead of using a larger scalp coverage for the N400 analysis. They did not find evidence for a P600, another widely studied ERP component that has been found to be associated with the processing of (morpho)syntactic violations (Osterhout & Holcomb, Reference Osterhout and Holcomb1992).
Neurophysiological research on image schemas is still very limited. Zane and Shafer is the only ERP study so far that has investigated image schemas in the semantic context of English prepositional phrases. Even more limited in neuroimaging research is the role of image schemas in second language processing.
SCHEMATIC DIAGRAMS AND SECOND LANGUAGE PEDAGOGY
Image schemas are one of the most prominent CL concepts that has been applied in the literature of second language pedagogy. Cognitive linguists often attempt to represent the conceptualization of spatial relations between entities, especially prepositions, by using schematic diagrams. Note that there is a theoretical difference between a highly abstract “image schema,” such as the CONTAINER schema, and the diagrams developed to represent the physical-spatial configurations labeled by, for example, prepositions. There is no direct link between the diagrammatic representations of a schema and how physical-spatial experiences are represented in the brain.
Using schematic diagrams in L2 instruction has been argued to help learners formulate targetlike spatial configurations and their extended meanings. Tyler and Evans (Reference Tyler and Evans2003) argued that paying careful attention to the physical, experiential consequences for humans of interacting with entities in particular spatial configurations could explain the multiple meanings associated with individual prepositions. Diagrams could be used to represent the basic spatial configuration labeled by the word/preposition and the extended meanings arising from humans’ physical-spatial experience in relation to the basic spatial configuration.
A number of empirical studies have applied schematic diagrams to support L2 vocabulary or grammar learning. Among these, Tyler and her colleagues have made remarkable contributions to applied CL research centered on English grammar. They produced detailed theoretical CL descriptions of English prepositions (Tyler & Evans, Reference Tyler and Evans2003), phrasal verbs (Mahpeykar & Tyler, Reference Mahpeykar and Tyler2015), and modality (Tyler & Jan, Reference Tyler and Jan2017). They also applied their CL descriptive materials in empirical studies of L2 instruction on English prepositions (Tyler et al., Reference Tyler, Mueller and Ho2011), modal verbs (Tyler et al., Reference Tyler, Mueller and Ho2010), and conditionals (Jacobsen, Reference Jacobsen2018). These studies tended to adopt task-based language teaching (TBLT) as the instructional framework. A variety of CL materials, such as schematic diagrams, pictorial illustrations, and explanations about conceptual polysemy and metaphor, were integrated into classroom-based communicative tasks.
Another group of studies that used schematic representations in L2 instruction has consistently adopted the sociocultural approach to language learning (Lantolf, Reference Lantolf2000). They focused on the L2 learning of English verb particles (Lee, Reference Lee2016), French prepositions (Buescher & Strauss, Reference Buescher, Strauss and Masuda2015), German prepositions (Arnett & Deifel, Reference Arnett, Deifel and Masuda2015), and Japanese particles (Masuda & Labarca, Reference Masuda, Labarca and Masuda2015). In these studies, schematic diagrams created by cognitive linguists functioned as the most critical instructional materials that orient, structure, and scaffold the mental actions that led to semantic learning.
Most of the previously mentioned studies have reported positive effects of learning, in either qualitative or quantitative forms, that resulted from the CL-instruction that contained schematic representations. But it was difficult to tease out the effect of schematic diagrams from the entire instructional package. It was practically impossible to tell whether effective learning was wrought by enhanced knowledge of the target structure because of the schematic diagrams, the communicative tasks, or the verbalization and internalization activities in the sociocultural studies. For the studies that also mixed in the teaching on polysemy and conceptual metaphors, it was even more difficult to single out the role of schematic diagrams.
There are few studies that adopted an experimental design for the focused examination of the instructional role of schematic diagrams. Morimoto and Loewen (Reference Morimoto and Loewen2007), for example, was a well-cited study that explored how schematic diagrams motivated L2 vocabulary learning by contrasting it with the traditional translation-based instruction. They used intact classes of high school Japanese-L1 EFL learners and focused on the instruction of two words: break and over. The diagram group was presented with the schematic diagrams that represented the core meanings of the target words, whereas the translation group was given the dictionary meanings. Measurements included a processing-based acceptability judgment test (AJT) and a production-based picture description test. Their overall results did not favor the instructional advantage of diagram-based instruction over translation-based instruction. The authors attributed the sources of the null effect to short treatment time and an insufficient opportunity for learners to internalize new concepts.
Wong et al. (Reference Wong, Zhao and MacWhinney2018) was another study that had an experimental focus on the treatment effect of schematic diagrams. It was also the only study that had implemented diagram-based instruction in a computer-based tutorial system. Their target structure was English prepositions. Diagram-based instruction was operationalized as schematic diagrams provided to learners as computer-based feedback to their online performance in a sentence-picture matching task. The diagrams illustrated all the spatial and nonspatial senses of the target prepositions. Their participants were Cantonese-speaking high school learners in Hong Kong.
The participants who were randomly assigned to the schematic-diagram feedback condition were compared to two other treatment groups who received metalinguistic rule feedback and correctness feedback (only indicating correct or incorrect performance), respectively. There was also a control group who did not receive preposition training. A cloze test that asked participants to fill in the most appropriate preposition in sentences and an L1-to-L2 sentence translation test were used to measure treatment effects. Their findings suggested that diagram-based feedback outperformed rule feedback and correctness feedback in the translation test, but not in the cloze test. And the control group did not show improvement over time.
Wong et al. noted that the null treatment difference in the cloze test could be due to the relative easiness of the cloze test because it was administered without time pressure and took a similar format as the training task. Therefore, the authors proposed the possibility that “the advantage of schematic diagram feedback over traditional types of explicit feedback could be shown when learners are asked to do more demanding tasks, such as output production or on-line processing tests under time pressure” (p. 461). This is a noteworthy observation because it highlights the limitations of the existing methodologies to capture the instructional advantage of diagram-based instruction.
THE CURRENT STUDY
To our knowledge, the current study was the first to employ a computer-based training paradigm together with the ERP technique to examine the neurocognition of acquiring English prepositions using diagram-based instruction. It was built on the behavioral study of Wong et al. (Reference Wong, Zhao and MacWhinney2018) and was adapted for use with ERPs, which provide a more sensitive measure of learners’ semantic processing of prepositions.
We adopted the online tutorial training in their study, but we only focused on the comparison between schematic-diagram feedback and correctness feedback so as to maximize the contrast and to maintain a focus on the investigation of the instructional functions of schematic diagrams. A control group with no preposition training was not included in the present study because Wong et al. demonstrated that the control group did not show any learning improvements over time. In addition, L2 proficiency was introduced in the present study in response to the call for more attention on the role of learners’ individual differences in applied CL research (Boers, Reference Boers2011; Jacobsen, Reference Jacobsen2018).
We used both behavioral and ERP measures to assess learners’ performance over time. We created sentences in which the preposition either matched or mismatched the schematic representations depicted in the target sentence and aimed at the identification of the N400 component. Considering that our participants were L2 learners, we specifically manipulated two types of mismatching conditions that contained distractor prepositions and unacceptable prepositions. Both of them demonstrate semantic violations. Yet the distractor preposition (e.g., lotus flowers grow on the mud) is the one that learners tend to confuse with the target correct preposition (e.g., lotus flowers grow in the mud), whereas the unacceptable preposition has a more severe semantic anomalousness (e.g., lotus flowers grow against the mud) and is expected to pose less challenges to learners. Having the unacceptable sentence condition could allow us to validate our assumption of whether distractor prepositions are the most problematic area for the learner. Also, the processing of unacceptable sentences is more likely to evoke an N400 component, and thus helped us judge whether participants stayed focused on task.
Apart from the N400, we also expected to find evidence for an N270, which is another robust ERP component as a mismatch triggered negativity (Wang et al., Reference Wang, Tian, Wang, Cui, Zhang and Zhang2003). The N270 often peaks at around 270 msec poststimulus onset when people are engaged in conflict processing due to a mismatch between a target stimulus and a deviating distractor stimulus (Bennett et al., Reference Bennett, Duke and Fuggetta2014). The mismatch triggered N270 is task irrelevant. It has been observed in mismatches in various feature dimensions including shape (Zhang et al., Reference Zhang, Wang, Li, Wang and Tian2005), face (Zhang et al., Reference Zhang, Wang, Wang, Cui, Tian and Wang2001), color (Wang et al., Reference Wang, Tian, Wang, Cui, Zhang and Zhang2003), and spatial position (Yang & Wang, Reference Yang and Wang2002), among others. The N270 is often followed by an N400 when participants are required to process more complex conflicts that involve multiple sources of mismatch (Bennett et al., Reference Bennett, Duke and Fuggetta2014; Wang et al., Reference Wang, Tian, Wang, Cui, Zhang and Zhang2003). In the current study we expect to find both N270 and N400 components because our participants were asked to do complex conflict processing that involved two types of semantic incongruent sentences.
METHODS
PARTICIPANTS
Fifty-one Chinese-L1 learners of English participated in the current study. All of them were second-year full-time students enrolled in a large public university in Guangzhou, China. They were recruited using open advertisement from all non-English majors in the university (e.g., history, physiology, psychology, mathematics, education, tourism management). English majors were excluded from the recruitment because they were assumed to have more English exposure than the other majors. Seven participants’ data were removed from analysis. These include four participants who did not complete all the sessions in the study and three participants whose ERP data were of poor quality. Forty-four participants (29 female and 15 male) were included in the final pool for data analysis.
All the 44 participants (aged between 19 and 21) were native speakers of Chinese who had learned English for more than 10 years in classroom environments. None of them had any significant L2 immersion experience, and none had lived in an English-speaking country or had visited one for more than a brief vacation. All participants were right-handed (Oldfield, Reference Oldfield1971), had normal or corrected hearing and vision, and had no known developmental, neurological, or psychiatric disorders. All participants gave written informed consent and received monetary compensation for their participation.
The participants’ scores in the College English Test Band 4 (CET4) were used as the approximate index for English proficiency. CET4 is a national, large-scale, standardized test administered to (typically second-year) non-English majors who have completed required English courses in college education (Zheng & Cheng, Reference Zheng and Cheng2008). The test consists of four parts with the total score of 710 points: listening comprehension, reading comprehension, cloze or error correction, and writing and translation. Our participants had a mean CET4 score of 502.36 (SD = 42.56). We divided them into two proficiency groups: low proficiency (n = 22) (mean = 468.95, SD = 19.66) and high proficiency (n = 22) (mean = 535.77, SD = 31.35). The mean scores of the two groups were shown by an independent samples t-test to be significantly different, t = ‒8.469, p < .0001, d = 2.554.
The participants were randomly assigned by the tutorial system to one of the two treatment conditions: schematic diagram feedback (SF) (n = 21) and correctness feedback (CF) (n = 23). The mean CET4 score for the SF group was 502.52 (SD = 43.64), whereas the mean score for the CF group was 502.22 (SD = 42.52). An independent samples t-test suggested no significant difference between the two group proficiencies (t = ‒.024, p = .981, d = .007).
DESIGN AND MATERIALS
All participants in the study received computer-based preposition instruction through the practice-based model of training (Anderson, Reference Anderson and Anderson1995). The tutorial system provided no prior presentation of grammar rules before practice. All participants were trained in a sentence-picture matching task (see Figure 1) as in Wong et al. (Reference Wong, Zhao and MacWhinney2018). On each computer screen they were presented with a picture stimulus and two minimal-pair sentences that only differed with respect to the prepositions (e.g., The frog hopped over the pebbles vs. The frog hopped toward the pebbles). They were asked to choose the sentence that matched the picture and were given immediate feedback. This training was designed to promote cue focusing (Zhao & MacWhinney, Reference Zhao and MacWhinney2018), a recent theoretical extension of the Competition Model (MacWhinney, Reference MacWhinney, Gass and Mackey2012) in L2 pedagogy. Focusing is predicted to effectively direct learner attention to the relevant feature of the input (i.e., the two prepositions in contrast and the picture stimulus) and to enhance learner awareness of the accurate semantic distinctions between the contrasting prepositions.
Training interface of schematic diagram feedback (Wong et al., Reference Wong, Zhao and MacWhinney2018).
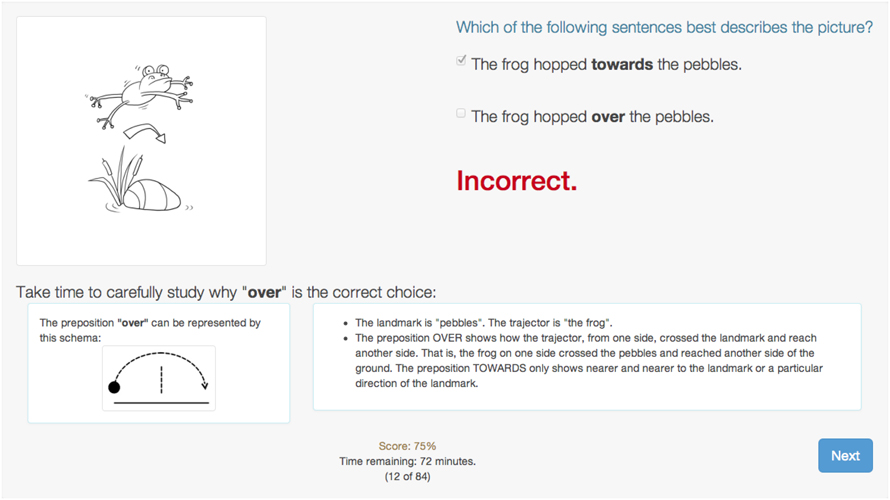
The SF group was given feedback in the form of schematic diagram representation that was mapped to the specific sense of the target preposition as well as a verbal explanation of the mapping. Using the sentence The frog hopped over the pebbles as an example, the schematic diagram feedback (see Figure 1) provided the visual illustration of the spatial configuration of the ABOVE-AND-BEYOND sense of the preposition over (Tyler & Evans, Reference Tyler and Evans2003). The verbal explanation highlighted the landmark and the trajector in the target sentence (i.e., Landmark = pebbles; Trajector = the frog) and described their spatial relation for the learner in simple terms. The CF group received training with the same task format as the SF group, but they were only informed of whether their response was correct or incorrect. Participants in the SF and the CF groups were exposed to the same sets of training and test stimuli but in a different random order.
The tutor provided training for three target prepositions, in, at, and over. Specifically, six pairs of spatial and extended senses of the prepositions (Table 1) were included in the training. They contained three pairs for over, two pairs for at, and one pair for in. This distribution reflects the imbalanced numbers of senses for the three prepositions. According to the analysis in Tyler and Evans (Reference Tyler and Evans2003), over has the largest number of senses among the three, and in fact is the most polysemous preposition in the English language. At and in rank lower in the polysemy ranking.
The six pairs of in, at, and over senses for training and measurements

The spatial and extended senses of the prepositions are represented by the same basic spatial configuration and are elucidated by the same schematic diagram (Wong et al., Reference Wong, Zhao and MacWhinney2018). The diagrams were developed based on Tyler and Evans (Reference Tyler and Evans2003). The tutor provided a total of 84 training items (7 items for each of the 12 senses). The training sentences were selected and revised from grammar books (Celce-Murcia & Larsen-Freeman, Reference Celce-Murcia and Larsen-Freeman1999; Huddleston & Pullum, Reference Huddleston and Pullum2002; Quirk et al., Reference Quirk, Greenbaum, Leech and Svartvik1985) and also from Lindstromberg (Reference Lindstromberg2010), which is a great reference for teaching English prepositions using CL materials.
PROCEDURE
The current study consisted of a pretest session, a training session, and a posttest session, all of which were carried out in the psychology lab in the university where the participants were recruited. There was an interval of two to three days between each session. Participants came to the lab on an individual basis. At the beginning of the study, participants were briefed by a research assistant who explained the study procedure and completed the research ethics procedure.
Training was arranged in the computer lab of the psychology department where participants were given access to computers that had already been set up for the tutor. They registered for a username and filled out an online language background questionnaire before training. The questionnaire collected information about the participants’ L1 background, L2 learning experiences, and other demographic information. A research assistant was present in the computer lab for troubleshooting during training.
Two tests were used to measure learner performance at the pretest and the posttest: a computer-delivered AJT and a paper-and-pencil translation test. The AJT measure elicited online processing data in both behavioral and ERP forms. The AJT test was carried out before the translation test at both pre- and posttests.
MEASUREMENTS
The experimental stimuli for the AJT consisted of 324 English sentences, with 108 sentences in each of the three conditions: (a) sentences containing the correct preposition (e.g., lotus flowers grow in the mud), (b) semantic violation containing a distractor preposition (e.g., lotus flowers grow on the mud), and (c) semantic violation containing an unacceptable preposition (e.g., lotus flowers grow against the mud). Table 2 presents sample stimuli in the three conditions.
Sample sentences with correct prepositions, distractor prepositions, and unacceptable preposition in the acceptability judgment test

We started by creating nine sentences with the correct prepositions for each of the 12 spatial and extended senses of in, at, and over. Then this set of 108 sentences (9 correct sentences × 12 senses) were manipulated into the semantic violation sentences that contained distractor prepositions and unacceptable prepositions. Sentences were designed so that both preceding (and succeeding) sentence contexts were identical across canonical and violation conditions. Three native speakers of English validated the correct prepositions and the unacceptability of the semantic violation sentences.
Sentences were presented in a randomized order with the constraint that only one version of a sentence (either correct, distractor, or unacceptable version) was presented to each participant. There were also 24 additional filler sentences that included the use of other prepositions (e.g., through, across, on, between, to). A total of 132 sentences were presented. The same set of AJT stimuli were used in the pretest and the posttest. All sentences contained 9‒12 words. No participants reported difficulty understanding the test sentences.
The second measurement was a paper-and-pencil translation test that was designed to elicit participants’ productive use of prepositions. The test consisted of 50 sentences: 3 sentences for each of the 12 senses in addition to 14 filler sentences that examined untrained prepositions. The participants were given the Chinese sentence with the target verb and were asked to translate the whole sentence into English. For example, they were presented with the prompt 小猫很快跳过了草丛 (jump) (translation: The cat quickly jumped over the bushes), and were asked to translate this Chinese sentence into English using the provided English verb jump. The given English verb created an obligatory phrasal context for eliciting the target preposition. The sentences were validated by three Chinese native speakers. The same set of test items were used in the pretest and posttest. Test items did not overlap with training items. There were also no overlaps among the AJT and translation test items. Filler items in both the AJT and the translation test were excluded from data analysis. Participants’ performance in the translation test was only scored on the use of the target prepositions. Other errors were excluded from analyses.
The brain imaging data was elicited from the pretest and posttest administration of the AJT measure, whereas there was no such evidence for the translation task on pre- or posttests and also not for the training period (the processing of the feedback).
EEG RECORDING AND DATA PREPROCESSING
During the ERP session, participants were seated 70 cm from the computer monitor in a quiet room and did the AJT using the software E-Prime (Version 1.2, Psychology Software Tools, Inc., Pittsburgh, PA, USA). They were given six practice trials and were briefed how and when to respond to the stimuli. They were instructed to minimize eye and body movements during sentence presentation. The AJT was programmed so that sentences were presented in units. Each sentence was segmented into five to eight units, each of which contained one to three words, for example, The girl / waved / at / the mosquitoes / near / the pond. The head noun phrase was always the first unit of each sentence, and the verb the second. In addition, the preposition was always the third unit, and the succeeding noun phrase the fourth unit.
Each trial began with a fixation cross in the center of the screen, which was presented for 1 second before the appearance of the first sentence unit. Sentences were presented one unit at a time in the center of the screen (duration = 500 msec) with an interval of 500 msec. The last unit of each sentence was followed by a 500-msec blank screen and then a prompt “? ? ?” in the center of the screen. Participants had up to 2 seconds to judge the sentence as acceptable or not (pressing the F key for acceptable and the J key for unacceptable). A blank screen appeared right after the participants made the response, and its duration lasted between 500‒2,500 msec depending on the participants’ judgment time. The interval between two trials was kept at 2,500 msec. The participants could have a 1-minute break after completing every 30 trials. A pilot study on five participants was carried out before the full study to ensure that the ERP settings of the AJT were appropriate for the participants’ English proficiency level. The data of the pilot participants were included in the current analyses.
EEG data were recorded using a 64-channel (Ag-AgCl) NeuroScan system. Electrodes were positioned following the 10–20 system convention. The reference electrode was placed at the tip of the nose and the forehead was used as the ground. The vertical electrooculogram (EOG) was obtained from the left eye by one supraorbital and one infraorbital electrode and the horizontal EOG from electrodes placed lateral to the outer canthi of both eyes. Electrode impedance was kept below 5 kΩ. EEG and EOG signals were digitized online at 500 Hz and band-pass filtered from .05 to 100 Hz.
Offline signal processing was carried out using Scan 4.5. The reference electrode was first converted to bilateral mastoid (M1 and M2). The interference of the horizontal and the vertical eye movements were then eliminated. After that, the data were segmented for a 900 msec time window, including a 100 msec prestimulus baseline. Then, the baseline was corrected and the recorded trials with eye blinks or other activities beyond the range of +/– 90 μV were rejected. In addition, the data from the whole-head recordings were offline band-pass filtered (1‒30 Hz) with a finite impulse response filter. At last, the ERPs elicited by standard stimuli and deviant stimuli were obtained by averaging the data from each participant. Only those data with at least 30 accepted deviant trials in each deviant condition were adopted.
DATA ANALYSIS
Mean scores on the translation test were submitted to a 2 × 2 × 2 repeated measures ANOVA with time (pretest, posttest) as a repeated factor and feedback (SF, CF) and proficiency (high proficiency, low proficiency) as two between-subjects factors.
Participants’ behavioral AJT responses were transformed to d’ scores. Each participant in each of the AJT (either pretest or posttest) had two d’ scores. One indicated their ability to discriminate correct sentences from distractor sentences, and the other was for the discrimination between correct and unacceptable sentences. We first performed a 2 × 2 ANOVA with time (pretest, posttest) and violation type (correct vs. distractor, correct vs. unacceptable) as within-subjects factors to examine whether the participants could differentiate the two types of violation sentences. Then we ran a 2 × 2 × 2 ANOVA with time (pretest, posttest) as a within-subjects factor, and feedback (SF, CF) and L2 proficiency (high proficiency, low proficiency) as between-subjects factors within each violation type. We only used the reaction times for correctly answered AJT items (Jiang, Reference Jiang2013).
For ERP analysis, the EEG data was time-locked to the onset of the preposition, the locus of the experimental manipulation. Ten electrodes were selected to cover five levels of anterior/posterior distributions: F3, F4 (anterior), FC3, FC4 (central-anterior), C3, C4 (central), CP3, CP4 (central-posterior), and P3, P4 (posterior). Five additional midline electrodes (Fz, FCz, Cz, CPz, Pz) were also selected and analyzed. The selection of the electrodes was informed by previous literature (Besson et al., Reference Besson, Kutas and Van Petten1992; Deacon et al., Reference Deacon, Dynowska, Ritter and Grose-Fifer2004; Wang et al., Reference Wang, Tian, Wang, Cui, Zhang and Zhang2003; Zane & Shafer, Reference Zane and Shafer2018). The ERP components were analyzed regardless of whether the participants’ acceptability judgments were correct (Chen et al., Reference Chen, Shu, Liu, Zhao and Li2007; Frenck-Mestre et al., Reference Frenck-Mestre, Osterhout, McLaughlin and Foucart2008; Morgan-Short et al., Reference Morgan-Short, Steinhauer, Sanz and Ullman2012). Individual ERPs at the 15 chosen sites were averaged into separate grand average ERPs for the training conditions.
The following time windows were selected based on previous literature and visual inspection of the waveforms: 300‒400 msec (N270) and 400‒500 msec (N400). We expected to find an N270 followed by an N400, the same pattern found in previous studies that required participants to process more complex conflicts that involved multiple sources of mismatch (Bennett et al., Reference Bennett, Duke and Fuggetta2014; Wang et al., Reference Wang, Tian, Wang, Cui, Zhang and Zhang2003). The N400 component was predicted to be relevant because it was observed in Zane and Shafer’s (Reference Zane and Shafer2018) native speaking participants’ processing of unexpected prepositions. The N400 was also expected because we used the same set of AJT items in the pretest and the posttest and N400s are known to be sensitive to repetition effects in sentence processing (Besson et al., Reference Besson, Kutas and Van Petten1992; Holcomb & Grainger, Reference Holcomb and Grainger2006; Van Petten et al., Reference Van Petten, Kutas, Kluender, Mitchiner and McIsaac1991).
The inferential statistics of the ERP analysis was conducted separately for the two latency windows, both of which started with the analysis on the grand average amplitudes and then proceeded to analyses on the midline electrodes and on the distributional factors (Anterior/Posterior and Hemisphere). Each of these analyses began with a global 2 × 2 × 2 × 2 ANOVA with time (pretest, posttest) and violation (correct, distractor, unacceptable) as within-subjects factors, and feedback (SF, CF) and L2 proficiency (high, low) as between-subjects factors, and followed by step-down ANOVAs for analyzing any significant interactions. The Greenhouse-Geisser correction for inhomogeneity of variance was applied where appropriate.
RESULTS
BEHAVIORAL RESULTS: TRANSLATION TEST
Figures 2 (a) and (b) present the participants’ mean accuracies on the translation test in the form of error bars. The global ANOVA analysis yielded a main effect for time [F(1, 40) = 144.685, p < .0001, η2 = .783], a time × feedback interaction [F(1, 40) = 13.500, p = .001, η2 = .252], and a three-way time ×feedback × proficiency interaction [F(1, 40) = 5.464, p = .025, η2 = .120].
Mean accuracy scores in the translation test. (a) shows the distinction between the two feedback conditions, whereas (b) shows the distinction between the two proficiency groups. Error bars represent standard error.

Both feedback groups had significant accuracy improvement over time. Step-down ANOVAs showed that the two feedback groups did not differ in terms of mean accuracies at the pretest, F(1, 42) = .145, p = .705, η2 = .003, but showed significant accuracy differences at the posttest, F(1, 42) = 7.445, p = .009, η2 = .151. This result explained the significant interaction between time and feedback. While starting at the same level of performance at the pretest, the SF group had a mean accuracy gain of .360 (SD = .192) at the posttest, whereas the CF group only gained a mean score of .191 (SD = .117).
In the follow-up analysis for the time × feedback × proficiency interaction, we found that the time × feedback interaction was only significant among the low-proficiency participants [F(1, 20) = 18.573, p < .0001, η2 = .482], but not among the high-proficiency participants [F(1, 20) = .870, p = .362, η2 = .042]. In other words, for the participants with higher English proficiency, feedback did not play a significant role in determining their accuracy gains. But for the low-proficiency participants, the type of feedback was crucial in determining their accuracy at the posttest. It implies that low-proficiency learners were in a more urgent need of high-quality feedback on their performance during training and that schematic diagram feedback was able to effectively fulfil this need.
BEHAVIORAL RESULTS: ACCEPTABILITY JUDGMENT TEST
The mean d’ scores are presented in Figure 3 for the discrimination between correct stimuli and distractor stimuli and for the discrimination between correct and unacceptable stimuli, respectively. The repeated measures ANOVA yielded a main effect for time, F(1, 38) = 35.485, p < .0001, η2 = .483, and a main effect for violation type (correct/distractor vs. correct/unacceptable), F(1, 38) = 52.062, p < .0001, η2 = .578. There was also a significant time × violation interaction, F(1, 38) = 4.757, p = .035, η2 = .111.
Mean d’ scores in the acceptability judgment test reflects the participants’ ability to discriminate (a) correct stimuli versus distractor stimuli and (b) correct stimuli versus unacceptable stimuli. In light of the significant three-way interaction between time, feedback, and proficiency in inferential statistics results, this bar graph presents four groups of d’ scores. SF standards for schematic-diagram feedback, whereas CF standards for correctness feedback. Error bars represent standard error.

After training, participants had an overall improvement in their ability to make the two types of discriminations. They showed significantly poorer ability to discriminate correct and distractor sentences than to differentiate correct and unacceptable sentences, both at the pretest [F(1, 41) = 45.496, p < .0001, η2 = .526] and at the posttest [F(1, 41) = 14.775, p < .0001, η2 = .265]. The time × violation interaction was attributed to the significantly larger d’ score increase from pre- to posttest for the discrimination between correct and distractor sentences than for the correct and unacceptable sentence discrimination, F(1, 41) = 4.121, p = .049, η2 = .091.
Correct Stimuli vs. Distractor Stimuli
Regarding the participants’ ability to discriminate correct and distractor stimuli, the ANOVA analysis revealed a main effect of time, F(1, 38) = 35.855, p < .0001, η2 = .485, and a significant three-way interaction between time, feedback, and proficiency, F(1, 38) = 4.453, p = .041, η2 = .105. The follow-up analysis for the three-way interaction revealed the same pattern of results as in the translation test. The time × feedback interaction was only significant among the low-proficiency participants [F(1, 20) = 4.783, p = .041, η2 = .193], but not among the high-proficiency participants [F(1, 20) = .572, p = .459, η2 = .031]. All the groups except the low-proficiency participants in the CF condition showed a significant improvement of d’ scores at the posttest.
Correct Stimuli vs. Unacceptable Stimuli
Regarding the participants’ ability to judge correct and unacceptable stimuli, the repeated measures ANOVA analysis on the d’ scores only revealed a main effect of time, F(1, 38) = 29.500, p < .0001, η2 = .437. None of the interactions were significant.
Reaction Time
The global repeated measures ANOVA revealed main effects of time, F(1, 38) = 24.840, p < .0001, η2 = .395, and of violation type (correct, distractor, unacceptable), F(1, 38) = 4.033, p = .022, η2 = .096. Bonferroni pairwise comparisons indicated that the violation effect was due to the reaction time difference between correct sentences and distractor sentences (p = .020). Judgment times on correct and unacceptable sentences were statistically similar (p = .595). Both the previously mentioned d’ score results and the reaction time results here strongly indicate that participants had a difficult time discriminating distractor sentences from correct sentences. They spent longer time and made poorer judgments on distractor sentences than on correct and unacceptable sentences.
ERP RESULTS
Descriptive statistics of the means and standard errors of ERP voltage in the 300‒400 and 400‒500 msec time windows are presented in Table 3. The voltage waveforms of the grand average ERPs at the pretest and the posttest in the two treatment conditions are shown in Figure 4. Visual inspections of the waveforms suggested that the participants’ sentence processing that involved semantic violations on the use of English prepositions yielded N270s in the 300‒400 msec time window and N400s in the 400‒500 msec time window. The N270s were more prominent in the voltage waveforms at the frontal sites. The N400s visually appeared at the electrodes at the frontal and central sites.
Means and standard errors of ERP voltage in the time windows of 300‒400 msec and 400‒500 msec by sentence types and treatment conditions

Voltage maps and waveforms reflecting the difference between pretest and posttest grand average ERPs of all sentence types by feedback conditions. Voltage maps reflect the amplitude change over tests (pretest amplitude – posttest amplitude) in the time windows of 300‒400 msec and 400‒500 msec.

N270 TIME WINDOW (300–400 msec)
Grand Average ERP Amplitudes
The global ANOVA analysis on the grand average ERP amplitudes revealed a main effect of time [F(1, 40) = 4.708, p = .036, η2 = .110] and a time × feedback interaction [F(1, 40) = 8.210, p = .007, η2 = .178]. There was also a main effect of violation, F(1, 40) = 4.545, p = .014, η2 = .107. Violation was also involved in a significant two-way interaction with feedback [F(1, 40) = 3.720, p = .029, η2 = .089] and in a three-way interaction with feedback and proficiency [F(1, 40) = 3.129, p = .049, η2 = .076]. Figure 5 presents the voltage waveforms of the three sentence types (correct, distractor, and unacceptable sentences) averaged from the pretest and posttest amplitudes of both feedback groups.
Voltage maps and waveforms reflecting difference between correct sentence, distractor sentences, and unacceptable sentences. Voltage maps and waveforms reflect amplitude averaged from pretest and posttest grand average ERPs in both feedback conditions in the time window of 300‒400 msec.

Step-down ANOVA analyses revealed that the average posttest amplitude was significantly larger than that of the pretest in the SF condition [F(1, 40) = 12.911, p = .002, η2 = .392], but not in the CF condition [F(1, 40) = .241, p = .629, η2 = .012]. Schematic diagram feedback motivated significant changes in brain potentials at the posttest, whereas correctness feedback failed to do so.
Follow-up analyses of the violation effect suggested that correct sentences generated larger amplitude (mean = 1.779 μV) than unacceptable sentences (mean = 1.272 μV) and distractor sentences (mean = 1.081 μV). Bonferroni pairwise comparisons suggested that the variance among the three sentence types was due to the difference between correct sentences and distractor sentences (p = .016). The other two comparisons were not significant: correct and unacceptable sentences (p = 1.000), and distractor and unacceptable sentences (p = .183). Follow-up ANOVA analyses of the violation × feedback interaction and of the violation × feedback × proficiency interaction did not yield any significant findings.
Midline Analysis
We then carried out analyses on the data collected from five midline electrodes: Fz, FCz, Cz, CPz, and Pz. The global ANOVA analysis generated two interactions: a time × midline × feedback interaction [F(1, 40) = 5.325, p = .010, η2 = .117] and a violation × midline interaction [F(1, 40) = 4.019, p = .013, η2 = .091]. For the time × midline × feedback interaction, we found that the time × feedback interaction was significant at FCz [F(1, 40) = 6.638, p = .014, η2 = .142], Cz [F(1, 40) = 7.603, p = .009, η2 = .160], CPz [F(1, 40) = 12.398, p = .001, η2 = .237], and Pz [F(1, 40) = 11.288, p = .002, η2 = .220]. The interaction was not significant at the Fz electrode [F(1, 40) = 1.526, p = .224, η2 = .037]. All the interactions were due to significant pre-post amplitude difference in the SF condition but not in the CF condition. This treatment difference in the 300‒400 msec time window was observed over all the midline electrodes except for the frontal one.
Follow-up analyses for the violation × midline interaction showed that the violation effect was found at all the midline electrodes: Fz [F(1, 40) = 4.735, p = .011, η2 = .104], FCz [F(1, 40) = 3.582, p = .032, η2 = .080], Cz [F(1, 40) = 3.116, p = .050, η2 = .071], CPz [F(1, 40) = 4.224, p = .018, η2 = .093], and Pz [F(1, 40) = 5.989, p = .004, η2 = .127]. Bonferroni pairwise comparisons indicated that the violation effects at the first four sites were all contributed by the voltage difference between correct sentences and distractor sentences: Fz (p = .007), FCz (p = .023), Cz (p = .050), and CPz (p = .037). Violation at the Pz site was contributed by the correct versus distractor sentence difference (p = .039) and also by the correct versus unacceptable sentence difference (p = .006).
Distributional Factors: Anterior/Central/Posterior (AP), Hemisphere
A global ANOVA analysis on distributional factors yielded a time × AP × feedback interaction [F(1, 40) = 5.140, p = .015, η2 = .114]. Violation was involved in a two-way interaction with AP [F(1, 40) = 4.186, p = .016, η2 = .095] and in a three-way interaction with AP and hemisphere [F(1, 40) = 2.163, p = .013, η2 = .091].
Regarding the time × AP × feedback interaction, follow-up analyses suggested that the time × feedback interaction was significant at central-anterior [F(1, 40) = 5.692, p = .022, η2 = .125], central [F(1, 40) = 8.565, p = .006, η2 = .176], central-posterior [F(1, 40) = 10.855, p = .002, η2 = .213], and posterior sites [F(1, 40) = 12.184, p = .001, η2 = .233]. The interaction was not significant at the anterior sites [F(1, 40) = 2.206, p = .145, η2 = .052].
Follow-up analyses for the violation × AP interaction showed that the violation effect was found to be significant in all the analyzed regions over the scalp. Bonferroni pairwise comparisons suggested that the variance in violation came from the difference between correct and distractor sentences at anterior (p = .008), central-anterior (p = .020), central (p = .032), and central-posterior sites (p = .034). The violation effect at the posterior sites were due to both correct versus distractor sentence difference (p = .030) and correct versus unacceptable sentence difference (p = .010). These findings related to AP were in line with the results of the midline analysis in the 300‒400 msec time window. Step-down ANOVA analyses for the violation × AP × hemisphere three-way interaction did not yield significant findings.
N400 TIME WINDOW (400 to 500 msec)
Grand Average ERP Amplitudes
The global ANOVA analysis on the grand average ERP amplitudes revealed a main effect of time [F(1, 40) = 6.688, p = .013, η2 = .143], a significant time × feedback interaction [F(1, 40) = 4.648, p = .037, η2 = .104], and a significant time × violation × feedback three-way interaction [F(1, 40) = 3.591, p = .032, η2 = .082]. Violation did not show a main effect [F(1, 40) = .579, p = .562, η2 = .014]. There was no main effect of proficiency [F(1, 38) = .414, p = .524, η2 = .011] or interactions with it.
Step-down ANOVAs in the 400‒500 msec time window showed that the SF condition showed a main effect for time [F(1, 20) = 10.228, p = .005, η2 = .338], whereas the CF condition did not [F(1, 20) = .103, p = .752, η2 = .005]. The SF group outperformed the CF group at the AJT posttest in the ERP component analysis of both time windows.
Regarding the time × violation × feedback interaction, follow-up analyses revealed that the time × feedback interaction was significant for distractor sentences [F(1, 40) = 9.681, p = .003, η2 = .195], but was not significant for correct sentences [F(1, 40) = 1.873, p = .179, η2 = .045] or for unacceptable sentences [F(1, 40) = .011, p = .915, η2 = .000]. Specifically, there was a significant test improvement in the processing of distractor sentences in the SF condition [F(1, 20) = 10.940, p = .004, η2 = .354], but not in the CF condition [F(1, 20) = .110, p = .744, η2 = .005]. In short, the most prominent distinction here between schematic-diagram feedback and correctness feedback came from the distractor sentences, which was the most difficult type of sentences for the participants in the current study. For a graphic view of this finding, Figure 6 zooms into distractor sentences and compared the voltage waveforms of its grand average ERPs at the pretest and the posttest in the two feedback conditions.
Voltage maps and waveforms reflecting difference between pretest and posttest grand average ERPs of distractor sentences by feedback conditions. Voltage maps reflect the amplitude change over tests (pretest amplitude – posttest amplitude) in the time window of 400‒500 msec.

Midline Analysis
The global ANOVA midline analysis revealed a time × midline × feedback three-way interaction [F(1, 40) = 5.788, p < .0001, η2 = .126]. Step-down ANOVA analyses suggested that the time × feedback interaction was significant at these sites: Cz [F(1, 40) = 4.185, p = .047, η2 = .095], PCz [F(1, 40) = 7.913, p = .008, η2 = .165], and Pz [F(1, 40) = 7.113, p = .011, η2 = .151]. The interaction was marginally significant at FCz [F(1, 40) = 3.676, p = .062, η2 = .084], and was not significant at Fz [F(1, 40) = .285, p = .596, η2 = .007]. All the interactions were due to significant pre-post amplitude difference in the SF condition but not in the CF condition. The contrast in brain potentials in the 400‒500 msec time window motivated by the two types of instructional feedback was most prominent at the central-posterior site and the posterior site, less so at the central site, and least observable at the frontal site. This distributional pattern aligns with the typical scalp distribution of the N400 (Kutas & Hillyard, Reference Kutas and Hillyard1980; Van Petten et al., Reference Van Petten, Kutas, Kluender, Mitchiner and McIsaac1991).
Distributional Factors: Anterior/Central/Posterior (AP), Hemisphere
A global ANOVA analysis on distributional factors yielded a time × AP × feedback three-way interaction [F(1, 40) = 5.139, p = .012, η2 = .114]. Step-down ANOVAs suggested that the time × feedback interaction was significant at posterior [F(1, 40) = 7.140, p = .011, η2 = .151], central-posterior [F(1, 40) = 6.185, p = .017, η2 = .134], and central electrodes [F(1, 40) = 5.051, p = .030, η2 = .112]. The interaction was not significant at central-anterior [F(1, 40) = 3.163, p = .083, η2 = .073] and anterior electrodes [F(1, 40) = .777, p = .383, η2 = .019]. This pattern of results aligned well with the midline analysis of this time window.
DISCUSSIONS
In the current study we provided computer-based training on English prepositions to Chinese-speaking L2 learners. We hypothesized that the feedback based on visual schematic representations (in combination with verbal explanations) had an instructional advantage over the minimally informed correctness feedback. Our behavioral results of the translation test confirmed this prediction and further revealed that the treatment difference was more striking when the participants had a lower L2 proficiency. The ERP results elicited by the AJT also supported the prediction. We found both the N270 and the N400 components as predicted. Schematic-diagram feedback motivated significant changes in brain potentials. But we did not observe any amplitude modulations for the CF participants.
Our findings strongly support the effectiveness of diagram-based instruction, despite the relatively short duration of treatment time (approximately 1 hour). Based on the findings, we reject Morimoto and Loewen’s (Reference Morimoto and Loewen2007) proposal that the advantage of diagram-based instruction could not be shown in one-off lessons with short durations. SF in our study could motivate neurocognitive changes sufficient enough to reach statistical significance.
BEHAVIORAL RESULTS: TASK VARIATION AND L2 PROFICIENCY
The SF group was found to outperform the CF group in all of our measurements with only one exception. We did not observe a time and feedback interaction in the behavioral results of the AJT. Instead, we found a time × feedback × proficiency three-way interaction in the d’ score analysis of the correct versus distractor stimuli discrimination. This was a more regional effect compared to the overall larger treatment difference observed in the translation test. So our behavioral results suggest that grammar learning driven by schematic diagrams tends to become more pronounced as the posttest requires more productive knowledge. This is in line with the findings in Munnich and Landau (Reference Munnich and Landau2010) and Wong et al. (Reference Wong, Zhao and MacWhinney2018) that used both processing and productive measurements to examine L2 learners’ acquisition of English prepositions. Production tasks are open-ended and therefore reveal to the fullest extent learners’ difficulties and knowledge development.
Learners of lower L2 proficiency were found to benefit more from diagram-based treatment compared to higher-proficiency learners. This finding was different from Boers’s (Reference Boers2011) analysis of the lower effectiveness of CL treatment among lower-proficiency learners. Boers’s analysis was based on the findings in Gao and Meng (Reference Gao and Meng2010) in which they found that teaching English idioms with conceptual metaphors was more effective among more advanced learners than among lower-proficiency learners. Boers argued that lower-proficiency learners may “find it harder than higher-proficiency learners to cope with the (CL) explanations used during tuition (if these are put in the L2)” (p. 247). The behavioral results in our study did not support this argument. Same as Gao and Meng, our participants were also Chinese EFL learners who were college entry-level non-English majors. But the comparative effectiveness of schematic-diagram feedback was more pronounced among our lower-proficiency participants even when the CL explanations given were in the L2. Based on this finding, we contend that lower-proficiency learners have a stronger need for the better-quality feedback provided by the CL treatment and can benefit more from it than their higher-proficiency counterparts, as long as the instruction allows effective time on task and the CL materials are created with good comprehensibility.
ERP RESULTS: VIOLATION
We found both N270 and N400 components in the ERP results of the AJT. Schematic-diagram feedback motivated significant changes in brain potentials at the posttest, whereas correctness feedback failed to do so. This finding provided support to Wong et al.’s (Reference Wong, Zhao and MacWhinney2018) argument that more sensitive online processing measures would be able to capture the depth of learning motivated by such type of instruction.
The identification of both N270 and N400 components was also within expectations because our participants were required to do more complex conflict processing due to multiple sources of semantic violations (Bennett et al., Reference Bennett, Duke and Fuggetta2014; Wang et al., Reference Wang, Tian, Wang, Cui, Zhang and Zhang2003). The wide scalp distribution of the violation-evoked N270s in our study was also a finding that is well aligned with the previous literature (Wang et al., Reference Wang, Tian, Wang, Cui, Zhang and Zhang2003).
The fact that the main effect of violation was significant only as an N270 effect rather than an N400 effect generated several implications. First of all, this finding supports that the N270 effect is task-irrelevant as reported in previous literature (Wang et al., Reference Wang, Wang, Kong, Cui and Tian2001; Wang et al., Reference Wang, Tian, Wang, Cui, Zhang and Zhang2003). Our participants were shown by the N270 effect to be aware of the conflict between target stimuli and deviating stimuli without having the full capacity to do semantic discrimination of the two. Their selective attention during serial sentence processing was drawn to the preposition where conflicting information was manipulated. The correct orientation of selective attention is good evidence for learners’ noticing (Schmidt, Reference Schmidt1990) of conflicting information in language form.
Second, the null significant N400 effect for violation suggests that our participants had not achieved sufficient understanding as a higher level of awareness (Schmidt, Reference Schmidt1990) of language meaning. This null effect can be explained by at least two accounts. First, to make adequate semantic discrimination between the correct sentence and the violation sentences, learners need to match the schematic representation of the preposition with the force dynamics of the preceding verb and also with the geometric and functional features of the succeeding object. Our target learner group had not developed the procedural knowledge required for this high-demanding task of semantic integration. Second, it is possible that the N400 effect that can be triggered by preposition mismatches is just very small. Zane and Shafer (Reference Zane and Shafer2018) was the only ERP study that had examined this question. The English native speakers in their study experienced an N400 with a small effect size (η2 = .036) on stimuli with preposition mismatches. Zane and Shafer provided insightful accounts for this finding:
[T]he denotation of a preposition cannot drastically narrow the cohort of possible nouns that can follow it. In English, for example, the average speaker uses roughly 10,000 count nouns, while there are only 80‒100 prepositions in the entire English language (Landau & Jackendoff, 1993). This uneven ratio means that a single preposition is combinable with thousands of nouns. Further, prepositions are used so frequently, in such a wide variety of contexts, it is necessary that their semantic representation be incredibly vast (or polysemous), so that they can be extended to all of these uses. (p. 85)
Although this N400 effect yielded among native speakers is rather limited, it may be further reduced among L2 learners.
ERP RESULTS: TREATMENT DIFFERENCE
Though the N400 effect was not significant for semantic violation, it was significant for the amount of amplitude change generated by the two types of feedback. In other words, feedback yielded different N400 repetition-sensitive effects. Because the participants were exposed to the same set of AJT items at both the pre- and posttests, it is within expectation that the posttest items elicited more positive ERPs than did the pretest items (Van Petten et al., Reference Van Petten, Kutas, Kluender, Mitchiner and McIsaac1991). But the reduced N400 negativity in our posttest was not accompanied by reduced amplitude, which was often found in the repetition of the same stimuli or semantically related stimuli (Besson et al., Reference Besson, Kutas and Van Petten1992). On the contrary, we observed that the N400 amplitude of the SF group was significantly increased after treatment, which suggests that this N400 effect was not merely a repetition-evoked ERP component but was triggered by the SF instruction.
We suggest that learners in the SF group were in this busy engagement of retrieving the memory of the complex information recalled from the feedback while they were doing online sentence processing and acceptability judgment. Considering the relatively short duration of the treatment, the newly obtained explicit knowledge of schematic representations was not yet well established in learner’s long-term memory. Sentence processing with the effort of integrating schematic-diagram feedback places higher demands on the retrieval or the maintenance of working memory. That was why we observed a significant increase in the N400 amplitude among the SF participants. Learners in this condition were making more cognitive efforts and were engaged in deeper semantic processing. Combining with the N270 findings, we conclude that diagram-based instruction led to more attention to form and meaning, both of which contributed to the learning improvements that we observed in the behavioral results.
The treatment advantage of the SF condition over the CF condition revealed by the N400 effect was more pronounced in the learning of distractor sentences. Our results from the d’ score analysis, the reaction time analysis, and the violation-triggered N270 effect provide converging evidence for the learning difficulty of detecting this tricky erroneous use of prepositions. Unlike many of our unacceptable sentences (e.g., wave across, grow against, climb between) in which the verb and the preposition have very low frequency of co-occurrence, the distractor sentences contained verb-preposition phrases that have higher plausibility and frequency (e.g., wave to, grow on, climb across). Learners are required to have a more refined understanding of the spatial representations of the distractor preposition to discriminate it against the target preposition. That was why schematic-diagram feedback was shown to be particularly helpful in treating this type of preposition errors.
An important motivator of our study is Wong et al. (Reference Wong, Zhao and MacWhinney2018) in which they reported no instructional difference between the SF and the CF conditions in a cloze test with multiple choices of prepositions. People who received minimal feedback could perform as well as those who received much richer feedback with schematic diagrams and explanations. Their finding motivated us to carry out our current study with a more fine-tuned measure of preposition processing. Our findings allowed us to argue that the advantage of schematic-diagram feedback was not limited to production tasks, but was also shown in the behavioral and neuroimaging measures of an online sentence processing task. The increased amplitude of the N400 and the N270 components helped us understand the nature of the processing advantage generated by schematic diagrams.
FUTURE DIRECTIONS
Several aspects of the study warrant further examinations in future research. First, the results of the current study provide significant empirical evidence for the neurocognitive functions of schematic diagrams that modulate L2 learning. Schematic diagrams are, nonetheless, not equal to image schemas that transcend linguistic behaviors and are not limited to perceptual experience. Our design and measurements only provide an indirect channel for us to understand the neurocognition involved in the processing of image schemas among L2 speakers. These are not direct measures of image schemas.
Second, the one-off instruction that we offered was long enough to yield significant behavioral and ERP treatment effects. But our participants had not been able to discriminate the erroneous uses of prepositions from the correct use to the extent to yield N400 effects after treatment. If situations allow, instruction of a more longitudinal nature would be ideal to further strengthen learning to approximate the native speaker pattern of processing behaviors. In that case, it will be necessary to collect data from English native speakers as the baseline for comparison.
Third, we focused on examining the influence of schematic diagrams in supporting L2 preposition learning in the current article. Analyses of the distinction among types of prepositions, for example, spatial senses versus extended senses, are not included in this article. Such analyses will reveal what type of electrophysiological responses that spatial senses and extended senses elicit among L2 learners and how the different senses react to diagram-based instruction.
Finally, individual differences should remain an important issue in the future studies of applied CL. L2 proficiency was found to be a significant variable that modulates instructional effects according to our behavioral results. Learners with lower L2 proficiency benefited more from diagram-based instruction than higher-proficiency learners. This result was opposed to the findings reported in previous studies that argued for better treatment effects among higher-proficiency learners. Considering that there are only very few studies including ours that have examined the role of L2 proficiency in CL-based instruction, it is difficult to make any generalization. Future research can explore more on this issue of L2 proficiency as well as other individual difference variables such as age (related to cognitive maturity), learning styles (visual, auditory, kinaesthetic), working memory capacity, and others that may play a role in influencing the effectiveness of CL-inspired learning.
CONCLUSION
Overall, our findings suggest that L2 instruction based on schematic diagrams of a relatively short duration led to significant improvements in learners’ productive behavioral performance and in their sensitivity to semantic violation of preposition use during online sentence processing. Such results have greatly advanced our understanding of the instructional potentials of schematic diagrams and also of cognitive semantics by bringing in strong neurophysiological evidence.



