


1. Introduction
The name generator survey battery is the gold standard for measuring networks in nationally representative survey research (Marsden, Reference Marsden, Scott and Carrington2011). A name generator typically targets a survey respondent’s close, intimate contacts. For instance, the name generator, first included on the General Social Survey in 1985, focuses on the people with whom the respondent “discusses important matters,” and the discussants identified in this battery constitute a respondent’s core network (Marsden, Reference Marsden1987). The focus on intimate contacts is theoretically motivated by the tendency for more intimate ties to generate stronger normative social pressures (Burt, Reference Burt1984, 317). And empirically, name generators capture a great deal of relevant variation in respondents’ networks. For instance, the “important matters” items yield similar results to name generators targeting explicitly political discussion (Huckfeldt et al., Reference Huckfeldt, Johnson and Sprague2004; Klofstad et al., Reference Klofstad, McClurg and Rolfe2009; Sokhey and Djupe, Reference Sokhey and Djupe2014).
Though the focus on intimate contacts is well justified, a great deal of influence arises outside of these core networks. For example, Granovetter (Reference Granovetter1973) famously stresses “the strength of weak ties” for spreading new ideas or opportunities. And for this reason, Putnam (Reference Putnam2000) emphasizes their importance for generating bridging social capital, which fosters cooperation between different parts of communities. By design, the name generator focuses on core networks rather than respondents’ less intimate, weak ties. This emphasis on core networks has reduced scholarly attention to theoretically important acquaintance networks.Footnote 1 Recently, scholars examining public opinion and political behavior have begun to remedy this problem, placing a new spotlight on acquaintances (e.g., Baldassarri and De Jong, Reference Baldassarri and De Jong2025; Djupe et al., Reference Djupe, Sokhey, Neiheisel and Lewis2025; Santoro and Sokhey, Reference Santoro and Sokhey2024). Yet little research has examined the measurement properties of survey batteries designed to measure acquaintance networks for these applications. Accordingly, in this paper we describe an increasingly popular survey battery for measuring acquaintance networks, and evaluate the reliability and validity of these measures for use in the study of public opinion and political behavior.
2. Measuring acquaintance networks
To measure the broader networks of survey respondents, we modify a battery originally developed by Bernard et al. (Reference Bernard, Johnsen, Killworth, Robinson and Kochen1989, Reference Bernard, Johnsen, Killworth and Robinson1991). The central idea for the battery is to ask respondents how many people they know with a given attribute. For instance, Bernard et al. focus on measuring how many people respondents knew who died in a recent Mexico City earthquake. Bernard and colleagues noted that not only can these items estimate the size of a subpopulation with a given attribute (e.g., how many people died in the earthquake), but they can be combined to estimate the overall size of respondents’ networks. By aggregating individual responses to these batteries, subsequent work has used the items to measure the structure of social networks (e.g., Breza et al., Reference Breza, Chandrasekhar, McCormick and Pan2020; McCormick et al., Reference McCormick, Moussa, Ruf, DiPrete, Gelman, Teitler and Zheng2013). Since these batteries aggregate all of an individual’s network ties to a subpopulation, the resulting data are often referred to as Aggregated Relational Data (ARD). And the technique for using these data to estimate the size of a subpopulation is often referred to as the Network Scale-up Method (McCormick, Reference McCormick, Light and Moody2021).Footnote 2 The validity of ARD batteries has been explored in a variety of contexts (e.g., Laga et al., Reference Laga, Bao and Niu2021; Lubbers et al., Reference Lubbers, Bojanowski, Targarona Rifa and Ciordia2025), but research has not yet validated their use for exploring individual-level public opinion and political behavior.
2.1 Data and design considerations
To examine the reliability and validity of ARD batteries for measuring acquaintance networks, we included versions of them on modules of the 2018 and 2024 Cooperative Election Studies (CES), as well as an August–September 2022 wave of the Civic Health and Institutions Project, a 50 States Survey (CHIP50).Footnote 3 In addition to measuring acquaintance networks, we also examine core networks measured using name generators and name interpreters (name interpreters ask follow-up questions about the individuals the respondent identifies with the name generator). By comparing measures of acquaintance networks and core networks, we offer perspective on the tradeoffs of each approach. Further, this comparison allows us to test an assumption that, as Sinclair (Reference Sinclair2012) notes, has long been implicit in work relying on name generators—that core networks offer a representative portrait of the broader network.Footnote 4 The distinguishing design features of these data sets—and concomitant ways we use them—are as follows (additional information appears in the Appendix):
-
• 2018 CES modules: We included an ARD battery on two modules, one of which was split at random to include either the ARD battery or a name generator and interpreter. Due to space constraints we were only able to include these items in the pre-election wave of the modules (thereby making them cross-sectional). We use these data primarily in support of our assessments of validity.
-
• 2024 CES modules: We included an ARD battery in both the pre-election and post-election waves of one module. This panel structure provides purchase on questions of individual-level reliability.
-
• August–September 2022 Wave, CHIP50 study: We included an ARD battery in this large-N, cross-sectional survey-wave; respondents also received a name generator/interpreter battery developed by the CHIP50 team. We use these data in support of our assessments of validity. Importantly, having measures of both the core network and the acquaintance network for the same respondents allows us to look at (1) the relationships between core and acquaintance networks, and (2) the relationships between core (acquaintance) networks and an outcome variable while conditioning on acquaintance (core) network values.
2.2 Question wording and response options
The wording for each battery can be found in Appendix A. For instance, the 2024 questions began, “Think of all the people that you are acquainted with (meaning that you know their name and would stop and talk at least for a moment if you happened to run into the person). How many of these people are you pretty certain have the following attributes?” The batteries included a list of attributes that denote politically-relevant subpopulations such as people who voted for Trump, people who voted for Harris, gun owners, and people who identify as lesbian, gay, bisexual or transgender.Footnote 5
To reduce the burden for respondents, the ARD battery provides bucketed response options rather than requesting a specific integer value. The options for all items are: 0; 1; 2–5; 6–10; more than 10. Following McCormick et al. (Reference McCormick, Moussa, Ruf, DiPrete, Gelman, Teitler and Zheng2013), we measure an individual
 $i$
’s exposure to subpopulation
 $j$
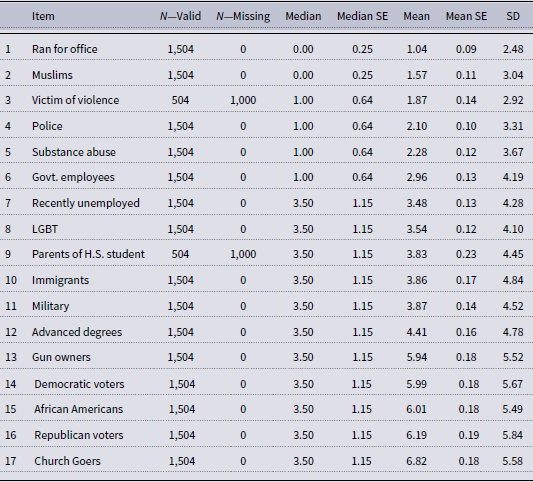
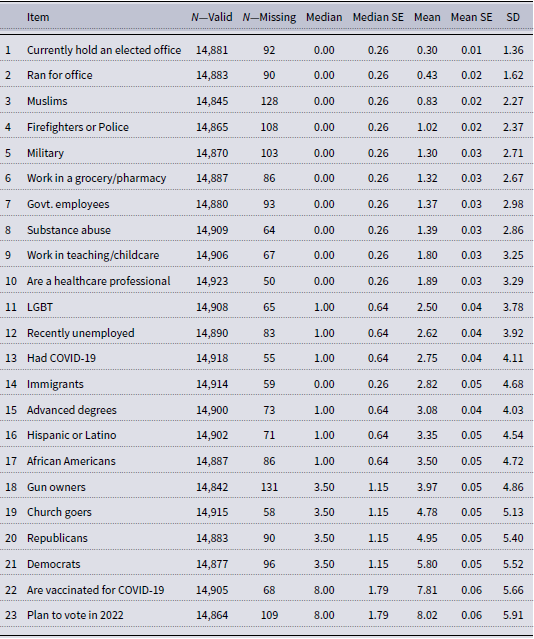
as the midpoint of the selected interval and, for those who chose the bucket of “more than 10,” we assign a value of 15. In Appendix B (Tables 1–7), we report descriptive statistics for these items and the other survey items on which we rely.
2.3 A note on boundaries
Before proceeding, we wish to be clear that like all network studies, our analysis is subject to the boundary specification problem (Laumann et al., Reference Laumann, Marsden and Prensky1989)—i.e., the various decisions that determine which nodes and edges constitute the network of interest. We focus on large, national samples to facilitate generalizing from observed respondents to the broader US population, and our items are geared towards politically salient subpopulations. Nonetheless, our choices about subpopulations remain just that, choices. A strength of the approach is that a researcher can choose alternative subpopulations, but those choices could very well result in different inferences.
2.4 Plan of analysis
In the sections that follow we examine the reliability and validity of the acquaintance network measures that these ARD batteries produce. We begin by examining the reliability of the acquaintance network items using a test–retest approach. We then turn our attention to the validity of the measures. We first examine the relationship between measures of the acquaintance network and measures of the core network. We then examine the association between each network and attitudinal measures, focusing specifically on affect toward the subpopulations included in our network batteries. Finally, we examine the relationship between each network and objective measures of the geographic context.
3. Reliability
Gerring (Reference Gerring2012) refers to reliability and validity as the “ubiquitous and paramount” goals of measurement (158). In our pursuit of both criteria, we begin our analysis with the former, examining the individual-level reliability of the acquaintance network items. To do so, we included the same battery on both the pre-election and post-election waves of the 2024 CES. The pre-election wave was fielded from October 1 through November 4, 2024; the election was held on November 5 and the post-election wave was fielded from November 6 through December 10. The only change to the items between the waves involved converting the tense of the vote choice items. For example, one pre-election item asked respondents how many people they knew who “will vote for Trump,” while the corresponding post-election item read, “voted for Trump.”
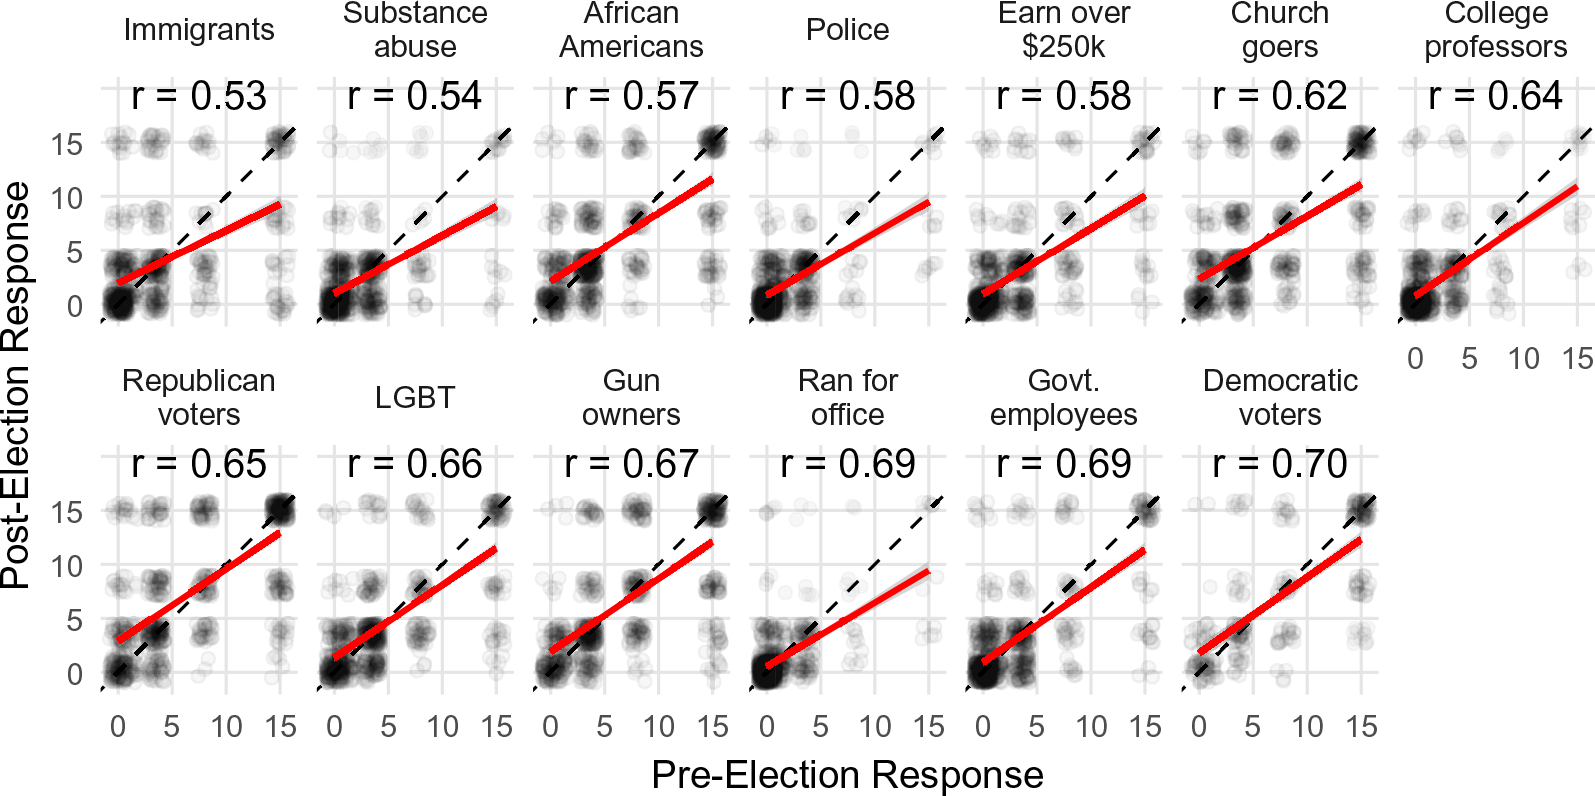
Figure 1 presents the individual-level test–retest reliability of these items, as measured by Pearson correlation coefficients.Footnote 6 The figure shows that the correlation between pre-election and post-election responses ranges from 0.53 for the Immigrants item, to 0.70 for the Democratic voters item. By comparison, these values are similar to typical items included on the American National Election Studies and General Social Surveys (Alwin and Krosnick, Reference Alwin and Krosnick1991), and exceed reports for measures of political discussion frequency with family, friends, and neighbors (Morey and Eveland, Reference Morey and Eveland2016).Footnote 7
Test–Retest reliability for the acquaintance items included on both the pre- and post-election waves of the 2024 CES. Dots represent jittered individual responses. The solid lines indicate the linear relationship between the pre- and post-election responses for an item, and the values at the top of each panel report the corresponding correlation coefficient. The dashed lines indicate a perfect 1:1 relationship. Data: 2024 CES, FSU module.

Figure 1 Long description
Panel A: Scatter plot showing the relationship between pre-election and post-election responses for immigrants. The horizontal axis represents pre-election response, and the vertical axis represents post-election response. The plot includes a red regression line and a dashed line indicating a perfect 1:1 relationship. Panel B: Scatter plot showing the relationship between pre-election and post-election responses for substance abuse. The horizontal axis represents pre-election response, and the vertical axis represents post-election response. The plot includes a red regression line and a dashed line indicating a perfect 1:1 relationship. Panel C: Scatter plot showing the relationship between pre-election and post-election responses for African Americans. The horizontal axis represents pre-election response, and the vertical axis represents post-election response. The plot includes a red regression line and a dashed line indicating a perfect 1:1 relationship. Panel D: Scatter plot showing the relationship between pre-election and post-election responses for police. The horizontal axis represents pre-election response, and the vertical axis represents post-election response. The plot includes a red regression line and a dashed line indicating a perfect 1:1 relationship. Panel E: Scatter plot showing the relationship between pre-election and post-election responses for individuals earning over $250k. The horizontal axis represents pre-election response, and the vertical axis represents post-election response. The plot includes a red regression line and a dashed line indicating a perfect 1:1 relationship. Panel F: Scatter plot showing the relationship between pre-election and post-election responses for church goers. The horizontal axis represents pre-election response, and the vertical axis represents post-election response. The plot includes a red regression line and a dashed line indicating a perfect 1:1 relationship. Panel G: Scatter plot showing the relationship between pre-election and post-election responses for college professors. The horizontal axis represents pre-election response, and the vertical axis represents post-election response. The plot includes a red regression line and a dashed line indicating a perfect 1:1 relationship. Panel H: Scatter plot showing the relationship between pre-election and post-election responses for Republican voters. The horizontal axis represents pre-election response, and the vertical axis represents post-election response. The plot includes a red regression line and a dashed line indicating a perfect 1:1 relationship. Panel I: Scatter plot showing the relationship between pre-election and post-election responses for LGBT. The horizontal axis represents pre-election response, and the vertical axis represents post-election response. The plot includes a red regression line and a dashed line indicating a perfect 1:1 relationship. Panel J: Scatter plot showing the relationship between pre-election and post-election responses for gun owners. The horizontal axis represents pre-election response, and the vertical axis represents post-election response. The plot includes a red regression line and a dashed line indicating a perfect 1:1 relationship. Panel K: Scatter plot showing the relationship between pre-election and post-election responses for individuals who ran for office. The horizontal axis represents pre-election response, and the vertical axis represents post-election response. The plot includes a red regression line and a dashed line indicating a perfect 1:1 relationship. Panel L: Scatter plot showing the relationship between pre-election and post-election responses for government employees. The horizontal axis represents pre-election response, and the vertical axis represents post-election response. The plot includes a red regression line and a dashed line indicating a perfect 1:1 relationship. Panel M: Scatter plot showing the relationship between pre-election and post-election responses for Democratic voters. The horizontal axis represents pre-election response, and the vertical axis represents post-election response. The plot includes a red regression line and a dashed line indicating a perfect 1:1 relationship.
4. Validity
We turn next to validity, evaluating construct validity in three ways. First, in Section 4.1 we examine the relationship between acquaintance networks (measured with the ARD items) and core networks (measured with a name generator). Second, in Section 4.2 we examine the association between affect toward a subpopulation and reported exposure to the subpopulation in both the acquaintance network and the core network. Critically, in a subset of these analyses we are able to examine each of these relationships while controlling for the presence of the other type of network measure—this allows us to offer direct commentary on the “added value” of acquaintance network items relative to more familiar core network items. Finally, in Section 4.3 we examine the relationship between county-level partisanship and individual exposure to partisans in acquaintance and core networks.
4.1 Acquaintance networks and core networks
To reiterate, we explore the individual-level relationship between acquaintance networks and core networks by embedding our acquaintance network items on a wave of the Civic Health and Institutions Project. This analysis is possible because a name generator battery was also included in this wave of the CHIP50. This name generator asked respondents to, “think about the three people living outside your household with whom you have the strongest, closest relationship.” Thus, this battery targets the portion of one’s core network outside of their own home, but excludes spouses, cohabitating partners, and roommates.
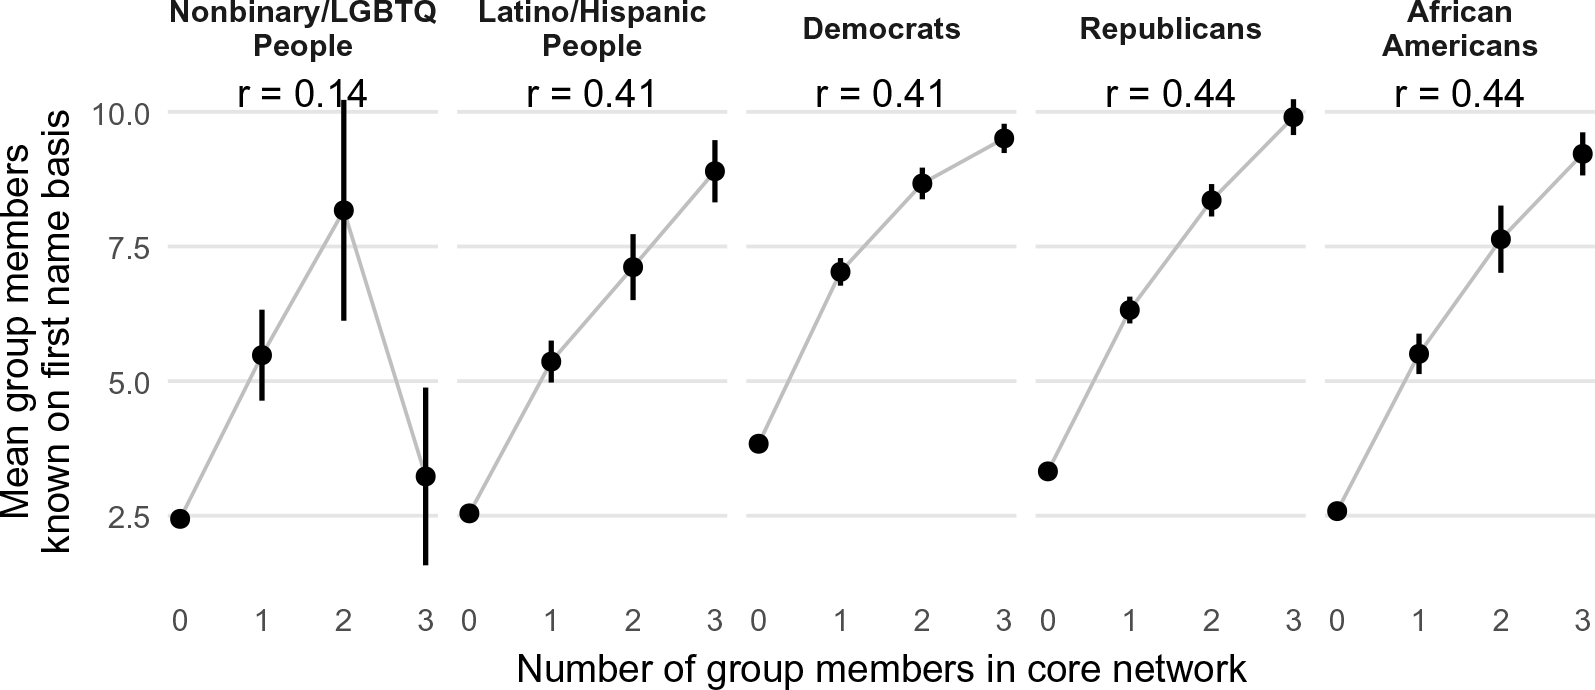
With these data, we can measure an individual’s exposure to a subpopulation via their core network and their acquaintance network. To that end, Figure 2 plots the average number of people the respondent reports knowing from a subpopulation (via the ARD battery), given the number of people from that same subpopulation they report knowing when reporting on their core network (via the name generator). The figure is limited to the subpopulations that were included in the name interpreter. We plot all attributes in the name interpreter (which was written by the CHIP50 PIs) that overlapped even slightly with the acquaintance items that we included. But there were several discrepancies between the batteries that may shape the results. The largest discrepancy is for the first panel, which represents nonbinary/LGBTQ individuals. The name interpreter asks “Which of the following best describes the gender of the people you named?” and gives the options: “Man,” “Woman,” or “Other.” The corresponding acquaintance network item is broader, asking how many people they know who “identify as lesbian, gay, bisexual, transgender or queer.” For the panel labeled “Latino/Hispanic People,” the name interpreter asks which core network members are “Hispanic,” while the corresponding acquaintance network item asks for people who “are of Latino or Hispanic descent.”
The mean number of acquaintances for each subpopulation by the corresponding number of subpopulation members reported in the name generator/interpreter battery. Dots represent mean values, and vertical lines represent 95% confidence intervals. The values at the top of each panel report the correlation coefficient for the individual-level relationship between the number of subpopulation members in the core network and the number of subpopulation members in the acquaintance network. Data: CHIP50, 2022.

Figure 2 suggests a strong positive relationship between the core network and acquaintance network. People who report more members of a subpopulation in their core networks also tend to report greater exposure to the subpopulation in their acquaintance networks. The largest exception is for nonbinary/LGBTQ individuals, where the correlation between core network exposure and acquaintance network exposure is only
 $r = 0.14$
. This low value may stem from the aforementioned slippage between the name interpreter item and our acquaintance network item. This low correlation may also be an artifact of small sample sizes within bins; less than one percent of respondents (96 of 14,446) reported having two or more nonbinary individuals in their core network.Footnote
8
4.2 Acquaintance networks, core networks, and affect
4.2.1 Comparing split-samples
We next examine the association between acquaintance networks and affect toward the corresponding subpopulations. We embedded a standard feeling thermometer battery in two modules of the 2018 CES; this battery began: “We’d like to get your feelings towards some groups in society. Please drag and drop the groups onto the scale to indicate how warm or cold you feel towards each of them.” Respondents used a 101-point scale to rate their feelings toward the following subpopulations (displayed in random order): Immigrants, Muslims, Republicans, Democrats, Lesbians and Gay People, Christian Fundamentalists, Atheists, and Gun Owners. Except for Atheists, each of these subpopulations was drawn from those included on the ARD, though the item wording varied as shown in Appendix A.Footnote 9
We expect affect toward a subpopulation to increase with exposure to the subpopulation—an expectation informed by the extensive literature on intergroup contact (for discussions, see e.g., Pettigrew and Tropp, Reference Pettigrew and Tropp2006; Young and Zhou, Reference Young and Zhou2025). We included the ARD battery in one module and divided the other module at random, with half of the respondents receiving the ARD battery and the other half receiving the name generator and interpreter. The name interpreter asked respondents whether each discussant they identified was a member of each of the aforementioned subpopulations. An important difference in the item wording is that the thermometers asked about Christian Fundamentalists and Atheists, while the network batteries asked about people who attend church. For this analysis, we report the correlation between the Christian Fundamentalist thermometer and network exposure to church goers.
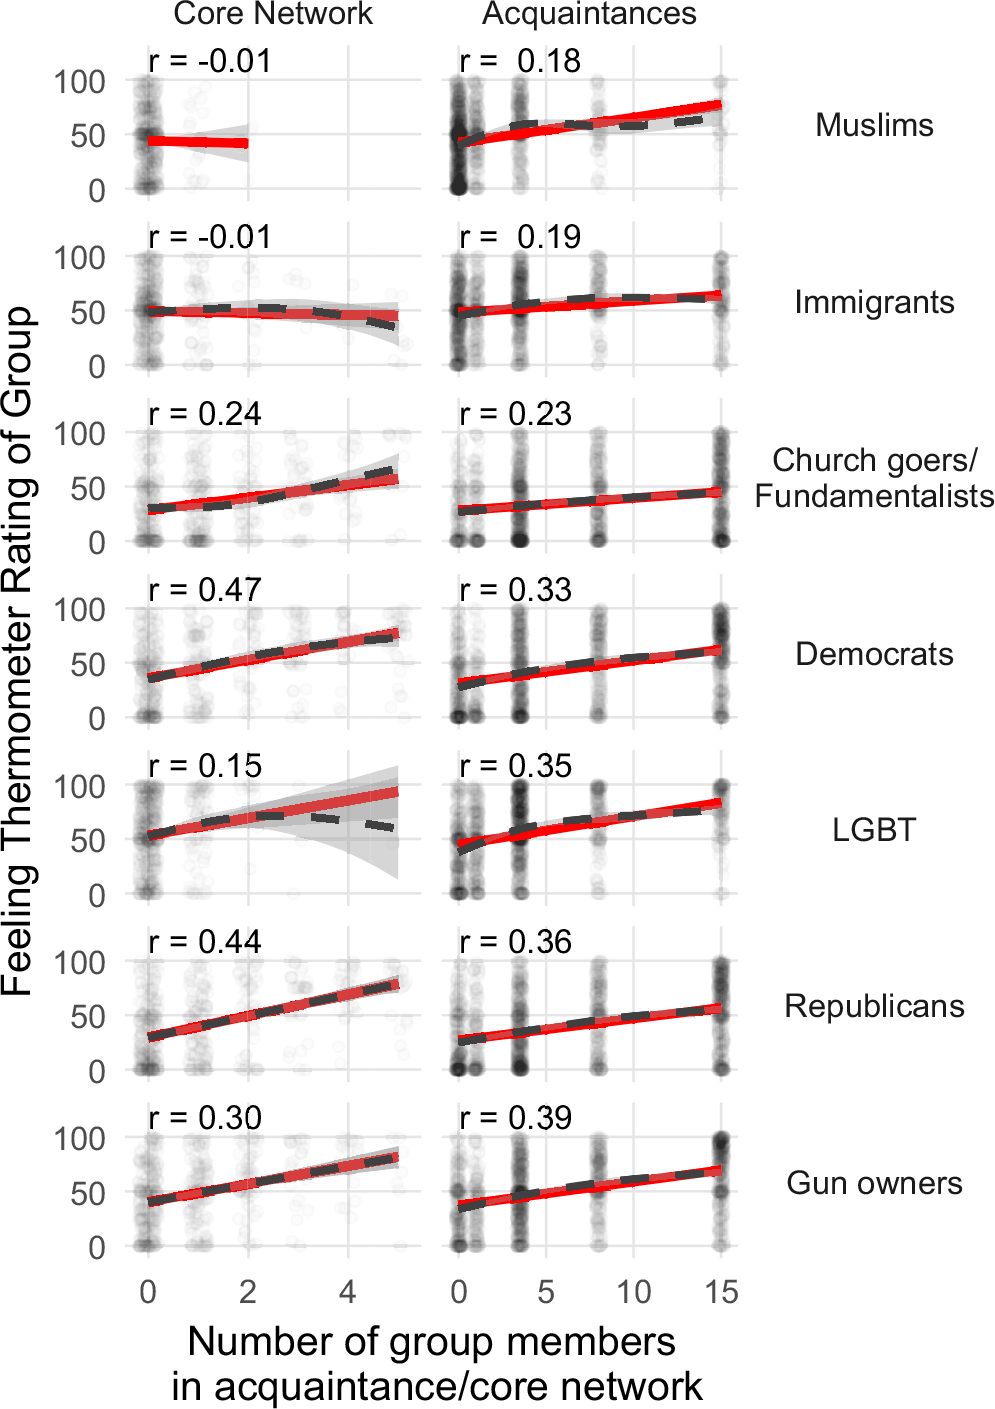
Figure 3 displays the relationship between affect and reported exposure to the subpopulation in both the core network (left column) and the acquaintance network (right column). For most subpopulations, we observe positive relationships in most panels, but the strength of association varies considerably. Focusing on the left column, we observe no apparent relationship between affect and reported exposure in the core network to Muslims or Immigrants. We observe weak positive relationships for affect toward, and reported core network exposure to, LGBT individuals. Similarly, the plot shows a weak positive relationship between affect toward fundamentalists and reported exposure to church goers in the core network.Footnote 10 The plot shows stronger positive relationships between affect and exposure in the core network to gun owners, Republican voters, and Democratic voters. Turning to the right column, the patterns are similar. Compared to exposure in the core network, we see a stronger relationship between affect and exposure in the acquaintance network to Muslims, Immigrants, and LGBT people. Conversely, the plot suggests weaker relationships—relative to exposure in the core network—between affect and reported exposure to Democrats and Republicans in the acquaintance network.
An individual’s feeling thermometer rating for a subpopulation (Y axis) by the number of subpopulation members the individual reports knowing (X axis). The first column displays the number of subpopulation members known in the core network. The second column displays the number known in the acquaintance network. Each row displays the relationship for a different subpopulation. Dots represent individual observations (jittered). Red solid lines represent linear predictions and gray dashed lines represent predictions from a generalized additive model with the maximum basis dimension constrained to
 $k=4$
(each with 95% confidence intervals). The values at the top of each panel report the correlation coefficient for the variables depicted in the panel. Data, core network panels: 2018 CES, FSU module. Data, acquaintance network panels: 2018 CES, FSU and CU modules.

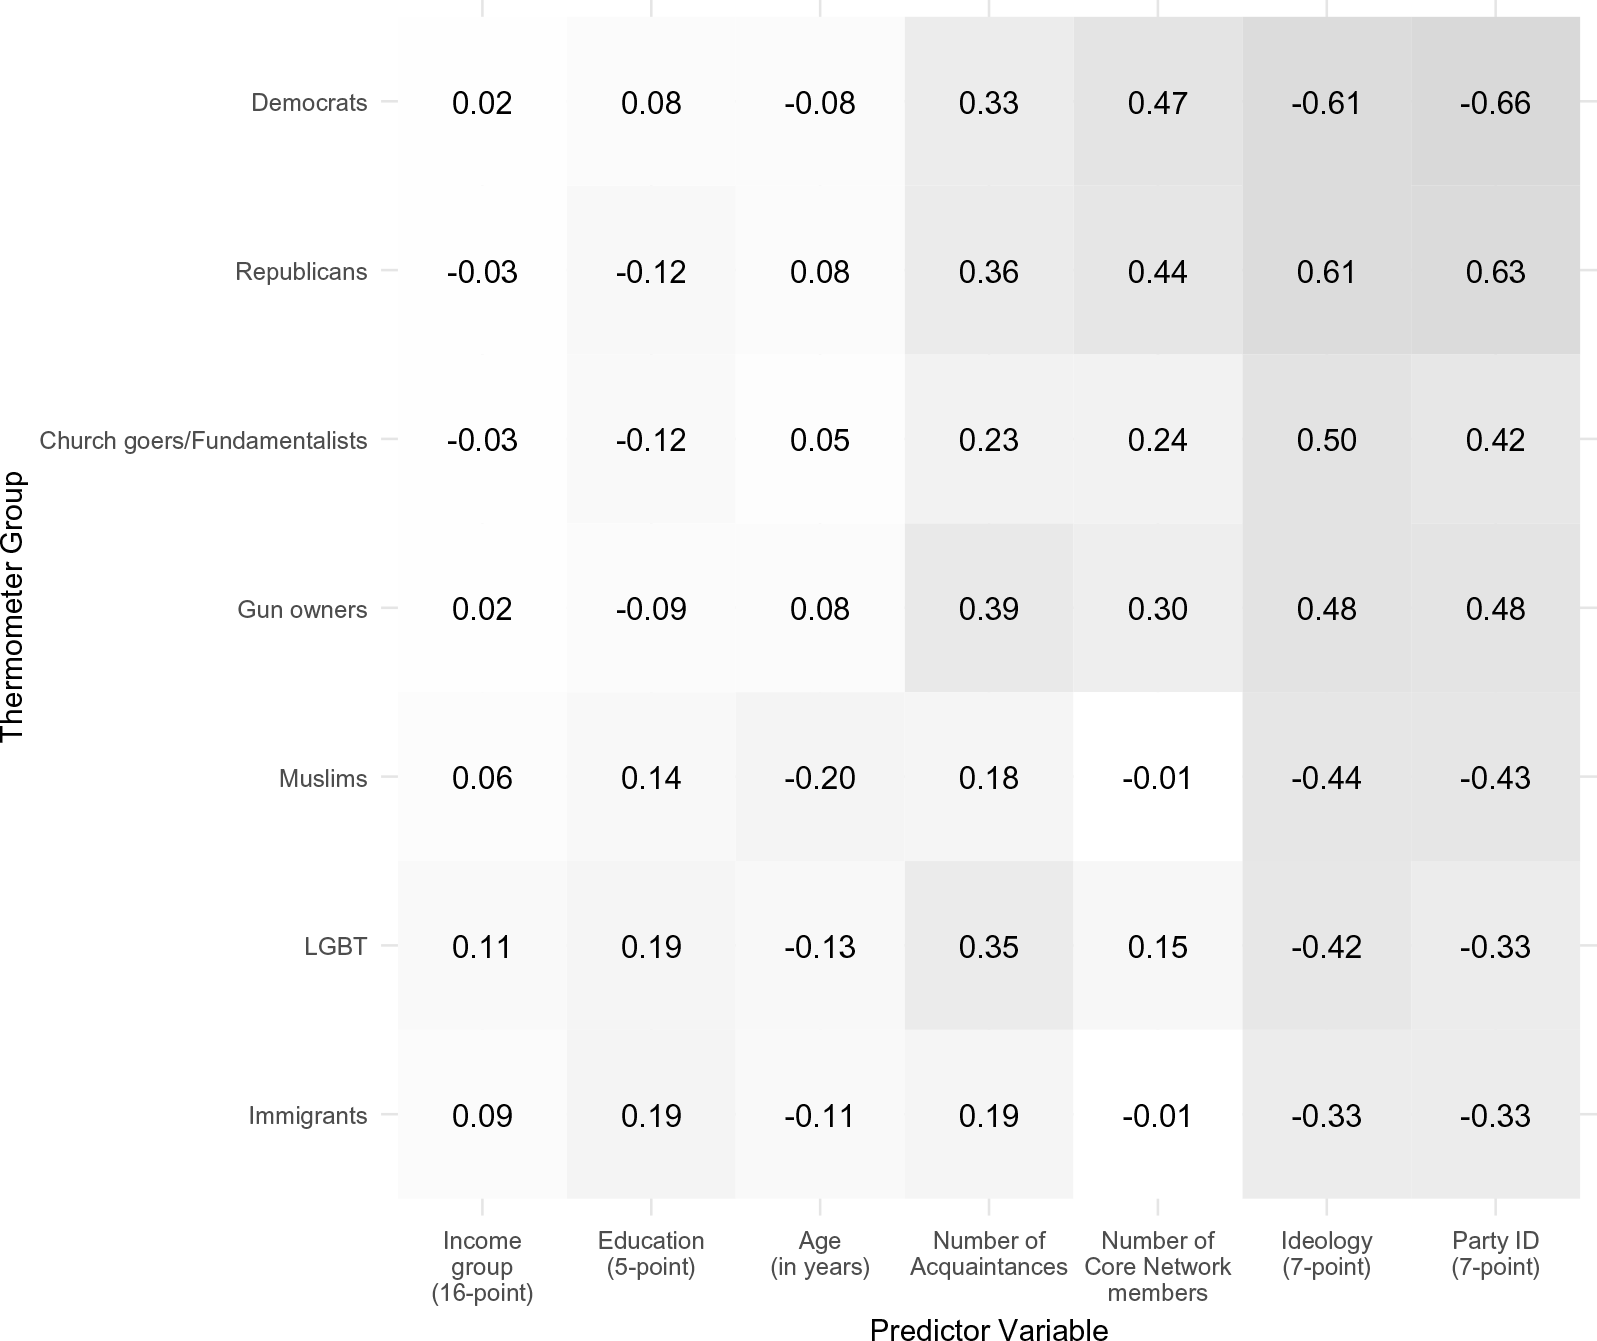
To put these correlations in perspective, Figure 4 displays the correlation between the feeling thermometer ratings toward each subpopulation and several personal attributes commonly used as covariates in attitudinal models. For comparison, the plot also reports the correlations first displayed in Figure 3. For many subpopulations, the correlations between affect and reported network exposure meet or exceed the correlations between affect and the personal attributes. For instance, the correlation between affect toward Democrats and network exposure to Democrats exceeds the bivariate correlations between affect toward Democrats and income, education, and age. But, it is weaker than the bivariate correlations between affect toward Democrats and either party identity or ideology. We observe similar patterns for affect toward Republicans. More generally, network exposure often exhibits a weaker correlation with affect than does party ID or ideology, but a stronger correlation with affect than the other (demographic) variables.
Correlations between individual feeling thermometer ratings for a subpopulation (Y axis) and various predictors (X axis) including reported network exposure and other individual attributes. The value in each cell represents the correlation coefficient. Party ID and ideology are coded with larger values indicating stronger Republican identity and stronger conservatism. Darker cells indicate stronger correlations (in absolute value). Data: 2018 CES, FSU and CU modules.

Figure 4 Long description
A matrix with seven rows and seven columns showing correlation coefficients between various thermometer groups and predictor variables. The thermometer groups include Democrats, Republicans, Church goers/Fundamentalists, Gun owners, Muslims, LGBT, and Immigrants. The predictor variables are Income group, Education, Age, Number of Acquaintances, Number of Core Network members, Ideology, and Party ID. Each cell contains a correlation coefficient value, with darker cells indicating stronger correlations in absolute value. Notable trends include strong positive correlations between Republicans and Party ID (0.63) and strong negative correlations between Democrats and Ideology (-0.61).
4.2.2 Directly comparing core and acquaintance networks
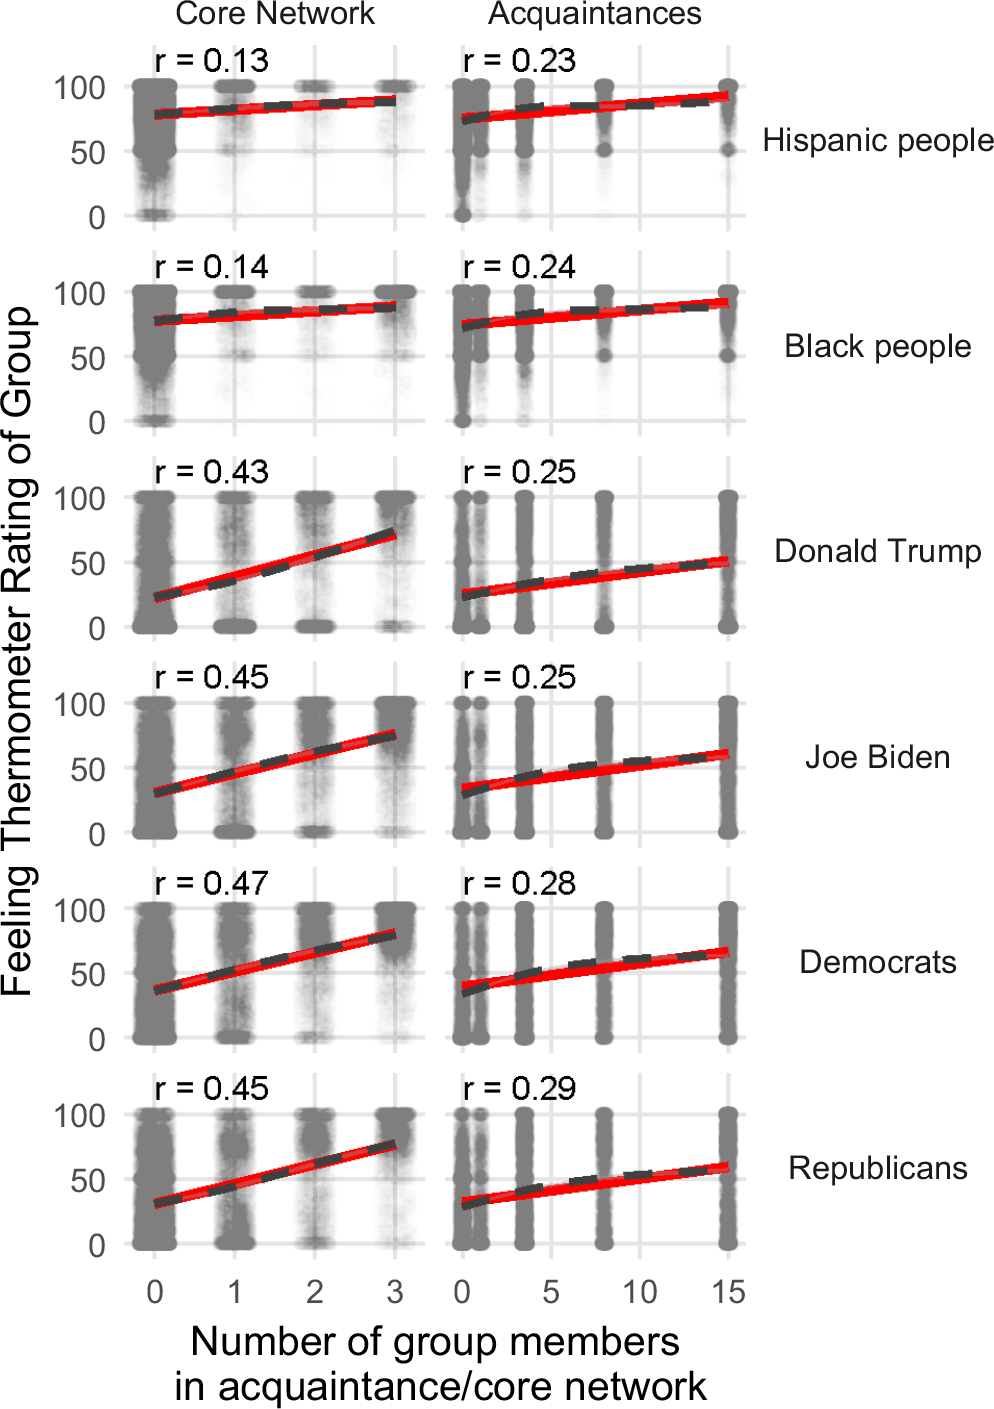
In addition to including a name generator/interpreter battery, the CHIP50 PIs also placed a feeling thermometer battery on the aforementioned wave (in which our ARD measures also appeared); this enables us to repeat the previous correlational analysis with these August–September 2022 data. The feeling thermometer battery measured affect for the following groups and people: Republicans, Democrats, Asian people, Black people, Hispanic people, White people, Scientists, Police, Donald Trump, and Joe Biden. Our ARD battery did not include items for Asian people, White people, or scientists, and the name interpreter did not include police. Accordingly, the analysis focuses on the feeling thermometers for Republicans, Democrats, Black people, Hispanic people, Donald Trump, and Joe Biden.
We correlate the Republican and Donald Trump thermometers with the number of Republicans the respondent reports in the core network and in the acquaintance network. Likewise, we correlate the Democratic and Joe Biden thermometers with the number of Democrats the respondent reports in the core network and the acquaintance network. And we correlate the thermometers for Black and Hispanic people with the corresponding Black and Hispanic items from the core network and acquaintance network.
The results are displayed in Figure 5. The left column of the plot shows that the correlation between the reported number of subpopulation members in the core network and affect toward the subpopulation varies from 0.13 to 0.47. The right column demonstrates that the correlation between the reported number of subpopulation members in the acquaintance network and affect ranges from 0.23 to 0.29. When looking at affect toward minority groups (Hispanic people and Black people), the correlation between reported network exposure and affect is stronger for the acquaintance network than for the core network. In contrast, for the partisan groups, the correlation is stronger for reported core network exposure than for reported acquaintance network exposure.
An individual’s feeling thermometer rating for a group (Y axis) by the number of group members the individual reports knowing (X axis). The first column displays the number of group members known in the core network. The second column displays the number known in the acquaintance network. Each row displays the relationship for a different social group. Dots represent individual observations (jittered). Red solid lines represent linear predictions and gray dashed lines represent predictions from a generalized additive model with the maximum basis dimension constrained to
 $k=4$
(each with 95% confidence intervals). The values at the top of each panel report the correlation coefficient for the relationship depicted in the panel. Data: CHIP50, 2022.

Figure 5 Long description
Panel A: Scatter plot showing the relationship between the number of Hispanic people known in the core network and feeling thermometer ratings. The horizontal axis represents the number of group members in the core network, and the vertical axis represents the feeling thermometer rating of the group. Individual observations are represented by dots, with a red solid line indicating linear predictions and a gray dashed line indicating predictions from a generalized additive model. Panel B: Scatter plot showing the relationship between the number of Hispanic people known in the acquaintance network and feeling thermometer ratings. The horizontal axis represents the number of group members in the acquaintance network, and the vertical axis represents the feeling thermometer rating of the group. Individual observations are represented by dots, with a red solid line indicating linear predictions and a gray dashed line indicating predictions from a generalized additive model. Panel C: Scatter plot showing the relationship between the number of Black people known in the core network and feeling thermometer ratings. The horizontal axis represents the number of group members in the core network, and the vertical axis represents the feeling thermometer rating of the group. Individual observations are represented by dots, with a red solid line indicating linear predictions and a gray dashed line indicating predictions from a generalized additive model. Panel D: Scatter plot showing the relationship between the number of Black people known in the acquaintance network and feeling thermometer ratings. The horizontal axis represents the number of group members in the acquaintance network, and the vertical axis represents the feeling thermometer rating of the group. Individual observations are represented by dots, with a red solid line indicating linear predictions and a gray dashed line indicating predictions from a generalized additive model. Panel E: Scatter plot showing the relationship between the number of Republicans known in the core network and feeling thermometer ratings. The horizontal axis represents the number of group members in the core network, and the vertical axis represents the feeling thermometer rating of the group. Individual observations are represented by dots, with a red solid line indicating linear predictions and a gray dashed line indicating predictions from a generalized additive model. Panel F: Scatter plot showing the relationship between the number of Republicans known in the acquaintance network and feeling thermometer ratings. The horizontal axis represents the number of group members in the acquaintance network, and the vertical axis represents the feeling thermometer rating of the group. Individual observations are represented by dots, with a red solid line indicating linear predictions and a gray dashed line indicating predictions from a generalized additive model. Panel G: Scatter plot showing the relationship between the number of Democrats known in the core network and feeling thermometer ratings. The horizontal axis represents the number of group members in the core network, and the vertical axis represents the feeling thermometer rating of the group. Individual observations are represented by dots, with a red solid line indicating linear predictions and a gray dashed line indicating predictions from a generalized additive model. Panel H: Scatter plot showing the relationship between the number of Democrats known in the acquaintance network and feeling thermometer ratings. The horizontal axis represents the number of group members in the acquaintance network, and the vertical axis represents the feeling thermometer rating of the group. Individual observations are represented by dots, with a red solid line indicating linear predictions and a gray dashed line indicating predictions from a generalized additive model. Panel I: Scatter plot showing the relationship between the number of Democrats known in the core network and feeling thermometer ratings. The horizontal axis represents the number of group members in the core network, and the vertical axis represents the feeling thermometer rating of the group. Individual observations are represented by dots, with a red solid line indicating linear predictions and a gray dashed line indicating predictions from a generalized additive model. Panel J: Scatter plot showing the relationship between the number of Democrats known in the acquaintance network and feeling thermometer ratings. The horizontal axis represents the number of group members in the acquaintance network, and the vertical axis represents the feeling thermometer rating of the group. Individual observations are represented by dots, with a red solid line indicating linear predictions and a gray dashed line indicating predictions from a generalized additive model. Panel K: Scatter plot showing the relationship between the number of Republicans known in the core network and feeling thermometer ratings. The horizontal axis represents the number of group members in the core network, and the vertical axis represents the feeling thermometer rating of the group. Individual observations are represented by dots, with a red solid line indicating linear predictions and a gray dashed line indicating predictions from a generalized additive model. Panel L: Scatter plot showing the relationship between the number of Republicans known in the acquaintance network and feeling thermometer ratings. The horizontal axis represents the number of group members in the acquaintance network, and the vertical axis represents the feeling thermometer rating of the group. Individual observations are represented by dots, with a red solid line indicating linear predictions and a gray dashed line indicating predictions from a generalized additive model.
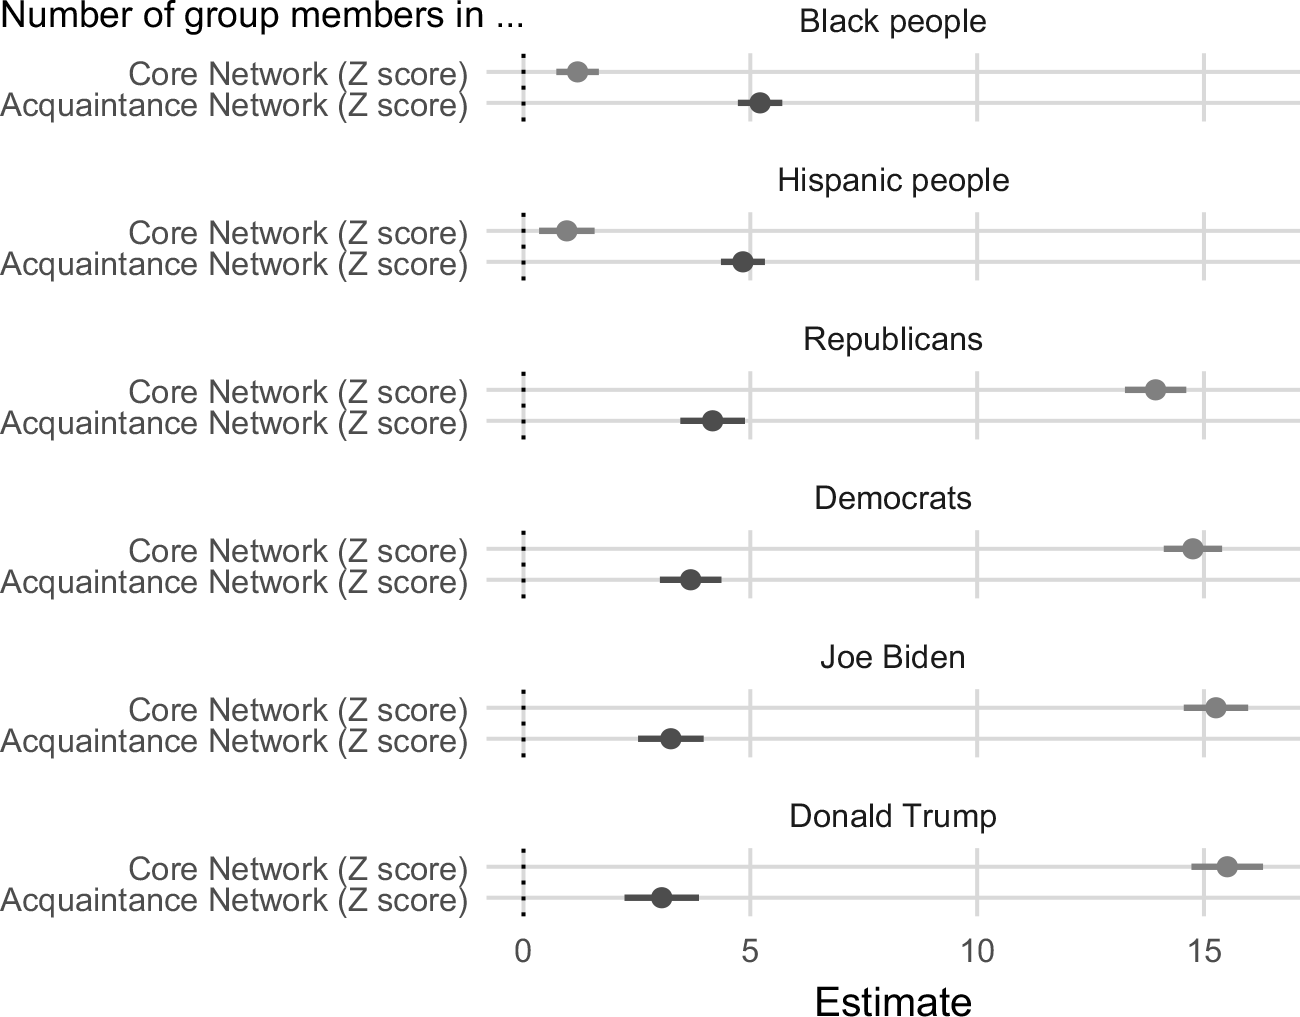
These patterns are consistent with those observed in the 2018 CES data (Figure 3). However, unlike with the 2018 data, these data allow us to fit regression models of affect that include both forms of network exposure as explanatory variables. By doing so we can examine the relationship between each form of exposure, conditional on the other form of exposure. Again, this approach is not possible with the 2018 analyses because the respondents were only assigned to the name generator/interpreter battery or to the ARD battery.
Before fitting models, we standardize each explanatory variable to facilitate comparison of the coefficients. The results are displayed in Figure 6, and there are two important takeaways from the plot. First, in all six models, the relationship between the acquaintance network and affect remains statistically significant after controlling for exposure in the core network. The models indicate that a standard deviation increase in reported exposure in the acquaintance network is associated with a 3-to-5.5 point increase in affect toward the group, conditional on reported exposure in the core network. Second, the patterns from Figure 5 persist after adjusting for each measure of exposure. For affect toward Black people and Hispanic people, reported exposure in the acquaintance network exhibits a stronger relationship with affect than does reported exposure in the core network. For affect toward the politicians and parties, the reverse is true.Footnote 11
Estimates from regressions of an individual’s feeling thermometer rating for a group on their reported exposure to members of the group in the core network and the acquaintance network. Each panel plots a separate regression model. Prior to fitting each model, the explanatory variables were standardized with mean
 $= 0$
and standard deviation
 $= 1$
. Dots represent survey-weighted coefficients and horizontal lines represent design-based 95% confidence intervals. Data: CHIP50, 2022.

4.3 County-level measures and network exposure
Our last set of construct validity analyses focuses on county-level measures of partisans and network exposure to partisans, and county-level measures of race/ethnicity and network exposure to members of racial/ethnic groups. We begin with partisanship.
4.3.1 County-level partisanship and network exposure to partisans
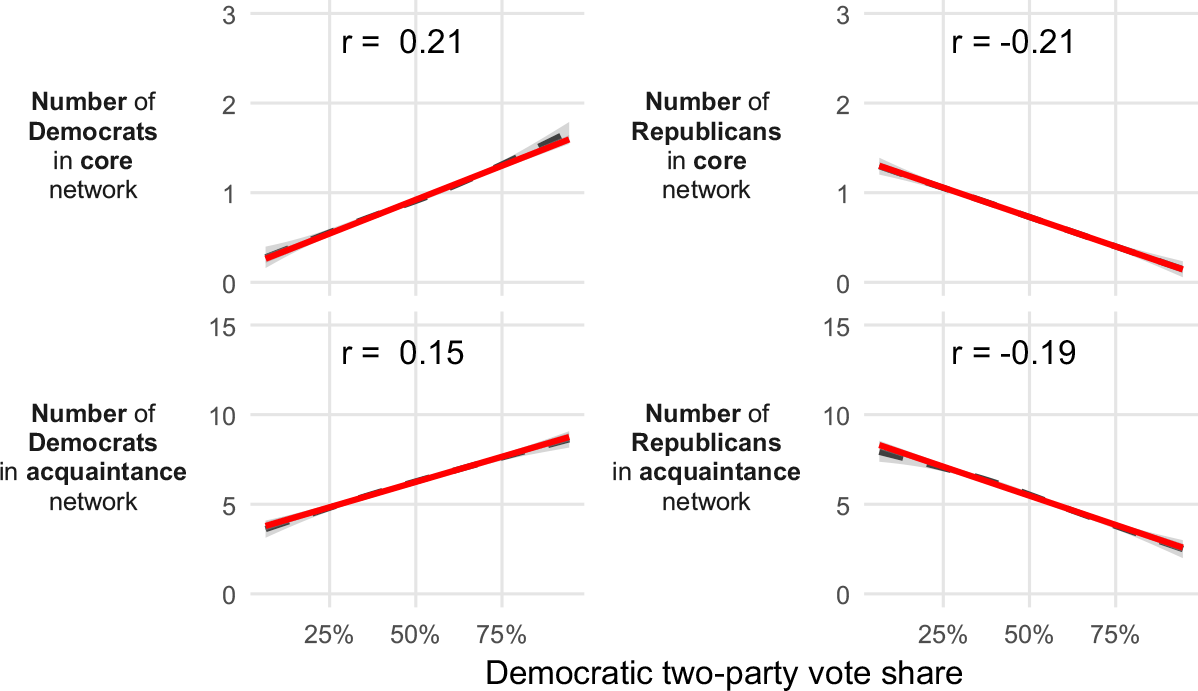
Given the force of baseline homophily,Footnote 12 we should expect greater exposure to supporters of a given party as the supply of those supporters increases within counties of residence.Footnote 13 We measure county-level partisanship using the county’s 2020 presidential vote. The top row of Figure 7 shows that people in more Democratic counties tend to report knowing more Democrats in their core networks (top-left panel) and fewer Republicans in their core networks (top-right panel). The bottom row of the figure suggests similar results for acquaintance networks. People in more Democratic counties tend to report more Democratic acquaintances (bottom-left panel) and fewer Republican acquaintances (bottom-right panel).
The number of party members an individual reports knowing (Y axis) by the Democratic 2020 presidential two-party vote share in the individual’s county (X axis). The first row displays the number of Democrats (left panel) and Republicans (right panel) known in the core network. The second row displays the number of Democrats and Republicans known in the acquaintance network. The left column displays the relationship for the number of Democrats known, and the right column for Republicans known. The solid red lines represent linear predictions and the dashed gray lines represent predictions from a generalized additive model. The values at the top of each panel report the correlation coefficients for the relationship depicted in the panel. Data: CHIP50, 2022.

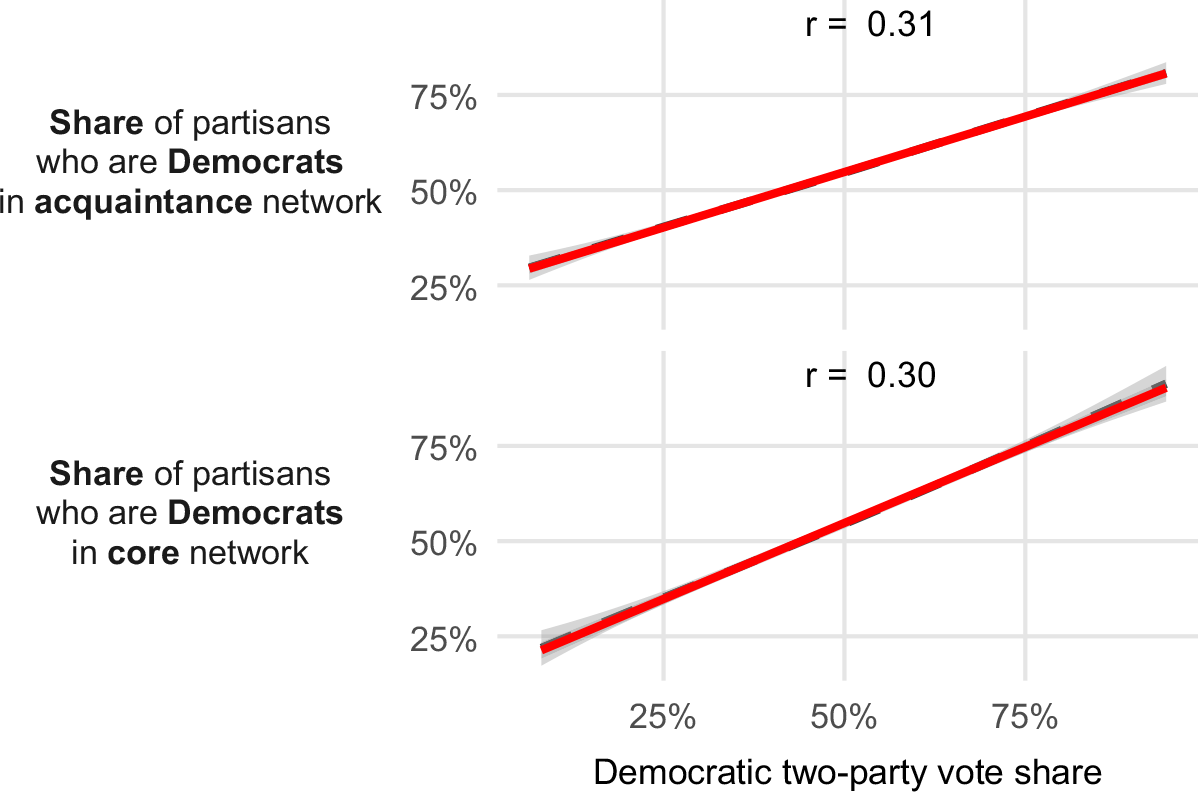
One limitation of this analysis is that it is difficult to compare the name generator and acquaintance network. In Figure 7, each additional Democrat in the core network reduces the maximum possible number of Republicans in the core network. The acquaintance network features no such constraint. Therefore, Figure 8 repeats this analysis, but replaces the number of partisans of each party with the share of partisans in an individual’s network who are Democrats. Only two panels are needed for this plot because the share of partisans who are Democrats is the mathematical complement to the share of partisans who are Republicans. By focusing on partisan shares rather than counts, this analysis places the core network and acquaintance network on more comparable scales. Nevertheless, this alternative specification yields similar results. People in more Democratic counties tend to report a greater share of Democrats in their networks.
An individual’s reported share of partisans they know who are Democrats (Y axis) by the Democratic 2020 presidential two-party vote share in an individual’s county (X axis). The top panel displays the share of Democrats in the acquaintance network. The bottom panel displays the share of Democrats in the core network. The solid red lines represent linear predictions and the dashed gray lines represent predictions from a generalized additive model. The values at the top of each panel report the correlation coefficients for the relationship depicted in the panel. Data: CHIP50, 2022.

4.3.2 County-level Race/Ethnicity and network exposure
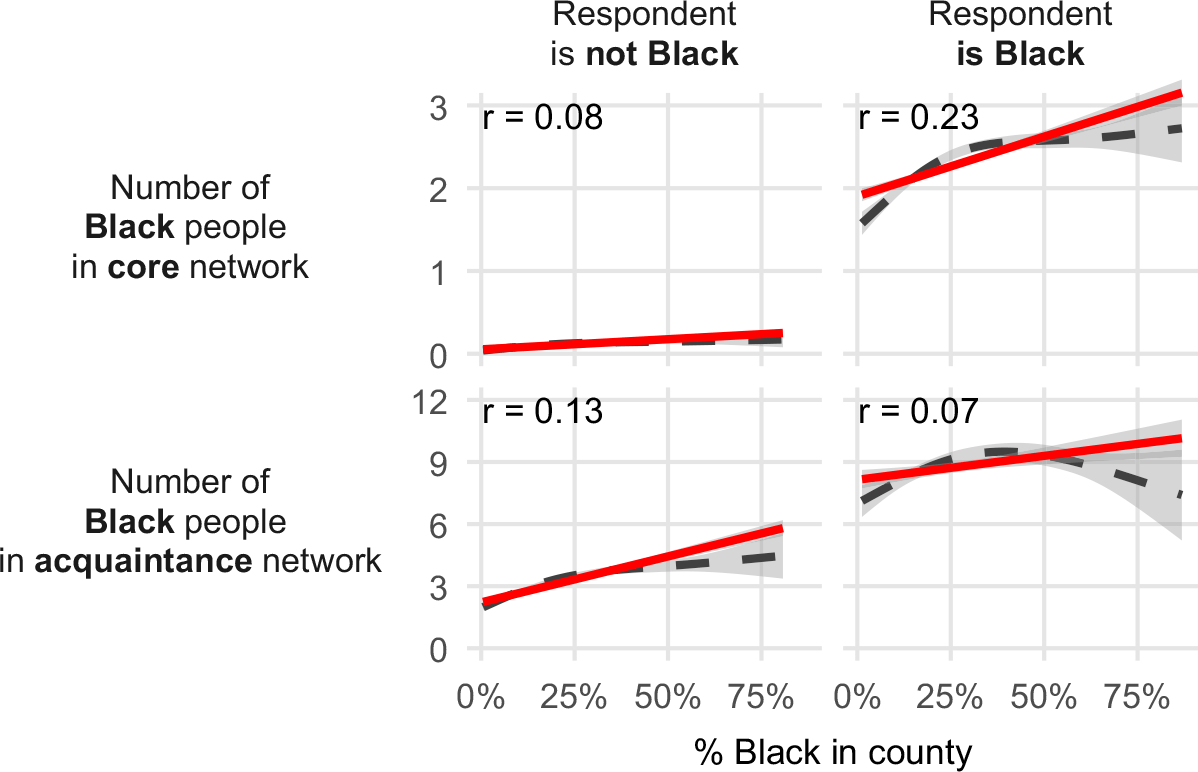
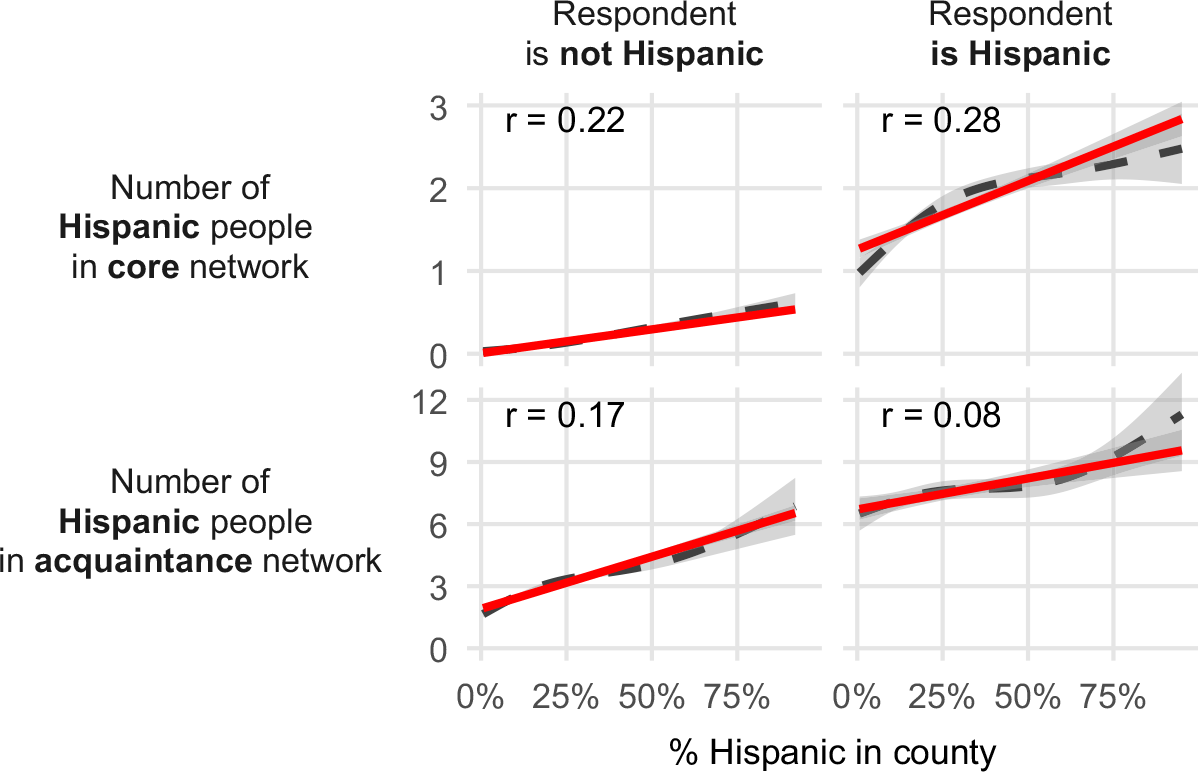
Finally, we turn to consider county-level measures of race (county-level percentages of Black people; Figure 9), and county-level measures of ethnicity (i.e., county-level percentages of Hispanic people; Figure 10). The network measures again come from the 2022 CHIP50 data. The county-level measures of race and ethnicity derive from the US Census Bureau’s 2022 estimates from the Vintage 2024 county characteristics file (CC-EST2024-ALLDATA).Footnote 14 In the plots, we examine how homophily might shape the strength of the relationship between the network and the county-level demographics. We do so because McPherson et al. (Reference McPherson, Smith-Lovin and Cook2001) identify race and ethnicity as the strongest dimensions of inbreeding homophily—the tendency to associate with similar others to a degree that exceeds what would be expected based on the distribution of similar others in the local context. McPherson et al. (Reference McPherson, Smith-Lovin and Cook2001, 421) note that this tendency is particularly strong for members of minority groups.
An individual’s reported number of Black people in their acquaintance and core networks (Y axis) by the share of Black people residing in their county (X axis). The first row displays the number of Black people in the core network. The second row displays the number of Black people in the acquaintance network. The left column presents the results for respondents who do not identify as Black and the right column presents results for Black respondents. The solid red lines represent linear predictions and the dashed gray lines represent predictions from a generalized additive model. The values at the top of each panel report the correlation coefficients for the relationship depicted in the panel. Data: CHIP50, 2022.

Figure 9 Long description
The image contains four scatter plots. Panel A: The scatter plot shows the number of Black people in the core network (Y axis) by the percentage of Black people in the county (X axis) for respondents who are not Black. The solid red line represents linear predictions, and the dashed gray line represents predictions from a generalized additive model. The correlation coefficient is 0.08. Panel B: The scatter plot shows the number of Black people in the core network (Y axis) by the percentage of Black people in the county (X axis) for Black respondents. The solid red line represents linear predictions, and the dashed gray line represents predictions from a generalized additive model. The correlation coefficient is 0.23. Panel C: The scatter plot shows the number of Black people in the acquaintance network (Y axis) by the percentage of Black people in the county (X axis) for respondents who are not Black. The solid red line represents linear predictions, and the dashed gray line represents predictions from a generalized additive model. The correlation coefficient is 0.13. Panel D: The scatter plot shows the number of Black people in the acquaintance network (Y axis) by the percentage of Black people in the county (X axis) for Black respondents. The solid red line represents linear predictions, and the dashed gray line represents predictions from a generalized additive model. The correlation coefficient is 0.07.
An individual’s reported number of Hispanic people in their acquaintance and core networks (Y axis) by the share of Hispanic people residing in their county (X axis). The first row displays the number of Hispanic people in the core network. The second row displays the number of Hispanic people in the acquaintance network. The left column presents the results for respondents who do not identify as Hispanic and the right column presents results for Hispanic respondents. The solid red lines represent linear predictions and the dashed gray lines represent predictions from a generalized additive model. The values at the top of each panel report the correlation coefficients for the relationship depicted in the panel. Data: CHIP50, 2022.

Our results support these expectations for core networks, as shown by the stronger correlation between the core network and the county-level measure for respondents who identify as a member of the minority group relative to those who do not identify as a member. Notably, we do not see this pattern when looking at the acquaintance network. We suspect that this distinction between core networks and acquaintance networks arises because individuals can be more selective with their core networks, choosing confidants from among their acquaintances. That said, the specific mechanisms driving these patterns are beyond the scope of the present analyses—McPherson et al. (Reference McPherson, Smith-Lovin and Cook2001, 419) caution that inbreeding homophily may arise not only from direct choices concerning alters, but also from group memberships, kinship, and other structurally induced associations.
5. Discussion: Suggestions for researchers
In the context of research on American politics and democratic functioning, one might be curious about whether individuals are exposed to disagreement along political lines (e.g., Huckfeldt et al., Reference Huckfeldt, Johnson and Sprague2004; Mutz, Reference Mutz2006), or to people that possess different racial characteristics (e.g., Eveland et al., Reference Eveland, Appiah and Beck2017). Core network approaches help us address these questions, but they take us only so far—we know that we miss important social dynamics when we limit ourselves to name generators and the core networks (Marsden, Reference Marsden1987) they are explicitly designed to tap.
In recent years ARD approaches have made their way into political science and cognate fields for exactly this reason (e.g., Baldassarri and De Jong, Reference Baldassarri and De Jong2025; Djupe et al., Reference Djupe, Sokhey, Neiheisel and Lewis2025; Völker et al., Reference Völker, Hofstra, Corten and van Tubergen2025; Lubbers et al., Reference Lubbers, Bojanowski, Targarona Rifa and Ciordia2025; Santoro and Sokhey, Reference Santoro and Sokhey2024). In this paper, we follow these scholars in adapting measures that have traditionally been used to study problems like natural disaster impacts (Bernard et al., Reference Bernard, Johnsen, Killworth, Robinson and Kochen1989, Reference Bernard, Johnsen, Killworth and Robinson1991), network structures (McCormick et al., Reference McCormick, Moussa, Ruf, DiPrete, Gelman, Teitler and Zheng2013), and exposure to hard-to-reach populations such as crime victims (Ventura et al., Reference Ventura, Ley and Cantú2024). Given that these items continue to gain popularity and find new applications—with many focused on the relationship between individuals’ exposure to subpopulations and individual-level public opinion and political behavior—we have focused our attention on assessing their measurement properties.
In this paper, we have examined the reliability and validity of the adapted ARD measures. In terms of reliability, the individual-level test–retest correlations for these items are similar in magnitude to those reported for items frequently used by public opinion scholars. And our three tests of validity also yield favorable results: the acquaintance network measures correlate with the core network measures, the acquaintance items reflect the partisan and racial/ethnic make-up of larger county-contexts (as do the more familiar core network items), and the acquaintance items correlate with affect, a key criterion variable, at rates that often match or exceed name generator measures or individual-level correlates of affect. Importantly, when we put the acquaintance and core network items into a single regression model specification, the acquaintance items remain statistically significant in all six models, even as we condition on core network exposure. Substantively, the results of this “head-to-head” comparison suggest asymmetries with respect to minority populations vs. politicians and parties—asymmetries we leave for other scholars to investigate in future applications.
Despite the occasional asymmetries, many analyses suggest that measures of exposure drawn from the ARD correlate as strongly with criterion variables as measures of exposure drawn from name generator batteries. These results suggest that the ARD battery offers a valuable alternative to the name generator when theoretically appropriate. When feasible, our results suggest researchers should collect acquaintance network data in their studies alongside name generator information. When only one battery is feasible, theory can adjudicate between these approaches. Name generators will continue to be useful for the study of strong ties. Likewise, name generators offer unique value for questions about the characteristics of specific nodes or edges in the network. These questions span a wide range of topics such as the political expertise of an individual’s friends or family (Huckfeldt, Reference Huckfeldt2001), social dynamics such as reciprocity (e.g., Delpy, Reference Delpy2024), information exchanged in particular dyads (e.g., Carlson, Reference Carlson2024; Morey et al., Reference Morey, Eveland and Hutchens2012), or the contacts people turn to for specific questions or problems (for a discussion, see e.g., Burt et al., Reference Burt, Kilduff and Tasselli2013). But we urge scholars to consider ARD batteries for questions focused on simple contagions, social exposure to larger groups (e.g., Brown and Enos, Reference Brown and Enos2021), the spread of information (Foos and de Rooij, Reference Foos and de Rooij2017; Bond, Reference Bond2018), and mobilization in mass publics (Jones et al., Reference Jones, Bond, Bakshy, Eckles, Fowler and Danforth2017)—questions that are frequently at the heart of political conflict processes (for a discussion, see Larson, Reference Larson2021). In addition to being useful to scholars employing both observational and (field-)experimental designs, such measures may aid researchers working in computational/simulation-based frameworks, helping them better calibrate their models (e.g., Alvarez-Galvez, Reference Alvarez-Galvez2016).
Acquaintance batteries are straight-forward to include in common population survey designs, thereby preserving the external validity benefits that have come with the inclusion of name generators. In addition, these items can be administered efficiently: in a recent online survey we fielded, a four-alter name generator and interpreter clocked in at roughly 3 minutes of survey time, while an ARD battery asking about 10 attributes took around one minute for respondents to complete.Footnote 15 Given these resource considerations, we encourage scholars to include both sets of items when possible, taking care in their placement to avoid ordering/response effects (Weisberg, Reference Weisberg2009).
6. Conclusion
In his book on the practice of network research, Robins (Reference Robins2015) writes that “[w]e need, most particularly, strong research design and good network measurement. It is not enough to be seduced by analysis at the cost of limited observation. Then, we will indeed have a social network science” (229). Though his comments are not aimed at the study of political behavior specifically, we agree strongly with his observations and find them to be particularly apt in describing the challenges facing scholars studying topics like political communication and social influence. For example, exposure to political disagreement holds a central place in democratic theory and forms the foundation of countless empirical studies (for a discussion see McClurg et al., Reference McClurg, Klofstad, Sokhey, Victor, Montgomery and Lubell2017). Yet most social scientific papers to date have been limited to core network dynamics, thereby missing significant chunks of what it means for individuals to exercise choice in networks that are embedded in multiple, overlapping contexts.
Fortunately, the acquaintance network approach we have outlined in this paper shows great promise. These measures have desirable properties that match their familiar counterparts, they can easily be added to existing research designs, and they require minimal additional investments of survey resources. Given these considerations, we believe that researchers interested in interpersonal interaction should add acquaintance items to their toolbox, including such batteries alongside name generators and interpreters.
Acknowledgements
We thank Jenn Larson, David Lazer, Shahryar Minhas, and Katya Ognyanova for helpful feedback on this manuscript. We also thank audiences at the 2025 annual meeting of the American Political Science Association in Vancouver, British Columbia and the 2025 Annual Political Networks and Computational Social Science Conference (PolNet-PaCSS). We thank the Covid States Project (now CHIP50) and the political science departments of Florida State University and the University of Colorado for funding the various surveys on which we rely. The Covid States Project (CHIP50) is not responsible for the findings, interpretations, or recommendations that we draw from the data.
Supplementary material
The supplementary material for this article can be found at https://doi.org/10.1017/nws.2026.10047.
Competing interests
We have no competing interests.
Notes
Additional information on the CES can be found at: https://tischcollege.tufts.edu/research-faculty/research-centers/cooperative-election-study. Additional information on CHIP50 can be found at https://www.chip50.org/ and additional information on the Covid States Project can be found at: https://www.covidstates.org/
Funding statement
We thank the political science departments at Florida State University and the University of Colorado at Boulder for supporting the purchase of CES modules in 2018 and 2024—the items used in this paper were included in these shared resources. We thank the Covid States Project Team (now CHIP50) for running our proposed content on Wave 24 of the study.
Data availability statement
Replication data and code will be deposited in the Harvard Dataverse upon the paper’s publication
Appendix A. Item Text
A.1 2018 Cooperative Election Study
A.1.1 Acquaintance battery
Included in the CU module. FSU module split at random to include either the ARD battery or the name generator battery.
Included toward the beginning of the pre-election wave.
Prompt: Think of all of the people that you are acquainted with (meaning that you know their name and would stop and talk at least for a moment if you ran into the person on the street or in a shopping mall). How many of these people are you pretty certain have the following attributes?
Response options: 0; 1; 2–5; 6–10; More than 10
Item labels (order randomized):
-
• own a gun
-
• voted for Trump in 2016
-
• voted for Clinton in 2016
-
• work for the government
-
• identify as lesbian, gay, bisexual or transgender
-
• are police officers
-
• serve in the military
-
• have run for office
-
• are African American
-
• have a substance abuse problem
-
• attend church regularly
-
• are Muslims
-
• were born outside the US
-
• have been unemployed in the last 5 years
-
• have a graduate degree (e.g., a masters or Ph.D.)
-
• have been a victim of violent crime [Note: Not included on CU module]
-
• have a child in high school [Note: Not included on CU module]
A.1.2 Name generator battery
Not included in the CU module. FSU module split at random to include either the ARD battery or the name generator battery.
Included toward the beginning of the pre-election wave.
Name generator, prompt: Looking back over the last six months—who are the people with whom you discussed matters important to you? Please enter only their first names or initials below.
Name generator, response options: [five text boxes, allowing up to five names]
Name interpreter, prompt: Which of these people are you pretty certain have the following attributes?
Name interpreter, response options: [Checkbox grid. Rows labeled with names piped in from name generator]
Name interpreter, item labels (order randomized):
-
• owns a gun
-
• voted for Trump in 2016
-
• voted for Clinton in 2016
-
• works for the government
-
• identifies as lesbian, gay, bisexual or transgender
-
• is a police officer
-
• serves in the military
-
• has run for office
-
• is African American
-
• has a substance abuse problem
-
• attends church regularly
-
• is Muslim
-
• was born outside the US
-
• has been unemployed in the last 5 years
-
• has a graduate degree (e.g., a masters or Ph.D.)
-
• have been a victim of violent crime
-
• have a child in high school
A.1.3 Feeling thermometer battery
Included in both the CU and FSU modules toward the end of the pre-election wave.
Prompt: We’d like to get your feelings towards some groups in society. Please drag and drop the groups onto the scale to indicate how warm or cold you feel towards each of them.
Response options: 0 to 100 with 0 labeled “Very Cool” (left side) and 100 labeled “Very Warm” (right side)
Item labels (order randomized):
-
• Immigrants
-
• Muslims
-
• Republicans
-
• Democrats
-
• Lesbians and Gay People
-
• Christian Fundamentalists
-
• Atheists
-
• Gun Owners
A.2 2022—CHIP50
The data were gathered as part of the Covid States Project, now known as CHIP50. The respondents were recruited from an online panel provided by PureSpectrum. Our items were included on the 24th wave of the project, which was in the field August 11 through September 13, 2022.
A.2.1 Acquaintance battery
Prompt: Think of all of the people that you are acquainted with (meaning that you know their name and would stop and talk at least for a moment if you ran into the person on the street or in a store). How many of these people are you pretty certain have the following attributes?
Response options: 0; 1; 2 to 5; 6 to 10; More than 10
Item labels (order randomized):
-
• Identify as Republicans
-
• Identify as Democrats
-
• Plan to vote in 2022
-
• Work for the government
-
• Have run for office
-
• Currently hold an elected office
-
• Are police officers or firefighters
-
• Are members of the military
-
• Own a gun
-
• Were born outside the US
-
• Are African American
-
• Are of Latino or Hispanic descent
-
• Identify as lesbian, gay, bisexual, transgender or queer
-
• Attend church/organized worship regularly
-
• Are Muslims
-
• Have a graduate degree (e.g., a masters or Ph.D.)
-
• Have been unemployed in the last 5 years
-
• Have tested positive for COVID-19 in the last month
-
• Are vaccinated for COVID-19
-
• Have a substance abuse problem
-
• Are a healthcare professional
-
• Work in teaching/childcare
-
• Work in a grocery/pharmacy
A.2.2 Name generator battery
Prompt: For the next few questions, think about the 3 people living outside your household with whom you have the strongest, closest relationship. You can write their initials below to remind yourself who each person is as you answer the following questions:
Response options: [three text boxes, allowing up to three names]
Prompt: Are any of those three people a family member, a friend, a neighbor, a coworker, or a classmate? (Please select all that apply)
Response options: Family; Friend; Neighbor; Coworker; Classmate
Prompt: In the last week, how often did you talk with those three people (either in person, over the phone, or electronically)?
Response options: Several times a day; Daily; Several times total; Once; Not at all
Prompt: Which of the following best describes the gender of the people you named?
Response options: Man; Woman; Other
Prompt: Which of the following best describes the age of the people you named?
Response options: 18 to 24; 25 to 34; 35 to 44; 45 to 54; 55 to 64; 65+
Prompt: Which of the following best describes the race or ethnicity of the people you named?
Response options: African American; Asian; Hispanic; White; Other; Not sure
Prompt: Where does each of the people you named live?
Response options: Same city as me; Same state as me but different city; Different state; Different country
Prompt: Which of the following best describes the people you named?
Response options: Democrat; Republican; Independent; Not sure
Prompt: How much would you say each of these people knows about politics?
Response options: A lot; Some; A little; Not sure
A.2.3 Feeling thermometer battery
Prompt: We’d like to get your feelings towards different groups on a scale of 0 to 100, which we call a “feeling thermometer.” On this feeling thermometer scale, ratings between 0 and 49 degrees mean that you feel unfavorable and cold (with 0 being the most unfavorable/coldest). Ratings between 51 and 100 degrees mean that you feel favorable and warm (with 100 being the most favorable/warmest). A rating of 50 means you have no feelings one way or the other. How would you rate each of the following groups?
Response options: numeric entry, 0 to 100
Item labels (order randomized):
-
• Republicans
-
• Democrats
-
• Donald Trump
-
• Joe Biden
-
• Asian people
-
• Black people
-
• Hispanic people
-
• White people
-
• Scientists
-
• Police
A.3 2024 Cooperative Election Study
A.3.1 Acquaintance battery
Included toward the middle of both the pre- and post-election waves
Pre-election prompt: Think of all the people that you are acquainted with (meaning that you know their name and would stop and talk at least for a moment if you happened to run into the person). How many of these people are you pretty certain have the following attributes?
Pre-election response options: 0; 1; 2–5; 6–10; More than 10
Pre-election item labels (order randomized):
-
• Were born outside the US
-
• Identify as lesbian, gay, bisexual or transgender
-
• Work as an instructor/professor at a college or university
-
• Are Black or African-American
-
• Have run for elected office
-
• Have a substance abuse problem
-
• Work for the government
-
• Are police officers
-
• Earn over $250,000 per year
-
• Attend religious services every week (or more often)
-
• Own a gun
-
• Will vote for Trump in this year’s presidential election
-
• Will vote for Harris in this year’s presidential election
-
• Will vote for Biden in this year’s presidential election
Post-election prompt: Think of all the people that you are acquainted with (meaning that you know their name and would stop and talk at least for a moment if you happened to run into the person). How many of these people are you pretty certain have the following attributes?
Post-election response options: 0; 1; 2–5; 6–10; More than 10
Post-election item labels (order randomized):
-
• were born outside the US
-
• identify as lesbian, gay, bisexual or transgender
-
• work as an instructor/professor at a college or university
-
• are Black or African-American
-
• have run for elected office
-
• have a substance abuse problem
-
• work for the government
-
• are police officers
-
• earn over $250,000 per year
-
• attend religious services every week (or more often)
-
• own a gun
-
• voted for Trump in this year’s presidential election
-
• voted for Harris in this year’s presidential election
A.3.2 Name generator battery
(not included in 2024).
A.3.3 Feeling thermometer battery
(not included in 2024).
Appendix B. Descriptive Statistics
B.1 Acquaintance battery descriptive statistics
2018 acquaintance items, CES: FSU and CU modules. Estimates are weighted with design-based standard errors

Table 1 Long description
Descriptive statistics for the 17 acquaintance items in the 2018 CES (FSU and CU modules): valid N, missing N, median, median SE, mean, mean SE, and SD for each item.
2022 acquaintance items, CHIP50. Estimates are weighted with design-based standard errors

Table 2 Long description
A table comparing acquaintance items across different years and surveys. The table has 23 rows and 8 columns. Column headers are Item, NValid, NMissing, Median, Median SE, Mean, Mean SE, SD. Row 1: Item, Currently hold an elected office; NValid, 14,881; NMissing, 92; Median, 0.00; Median SE, 0.26; Mean, 0.30; Mean SE, 0.01; SD, 1.36. Row 2: Item, Ran for office; NValid, 14,883; NMissing, 90; Median, 0.00; Median SE, 0.26; Mean, 0.43; Mean SE, 0.02; SD, 1.62. Row 3: Item, Muslims; NValid, 14,845; NMissing, 128; Median, 0.00; Median SE, 0.26; Mean, 0.83; Mean SE, 0.02; SD, 2.27. Row 4: Item, Firefighters or Police; NValid, 14,865; NMissing, 108; Median, 0.00; Median SE, 0.26; Mean, 1.02; Mean SE, 0.02; SD, 2.37. Row 5: Item, Military; NValid, 14,870; NMissing, 103; Median, 0.00; Median SE, 0.26; Mean, 1.30; Mean SE, 0.03; SD, 2.71. Row 6: Item, Work in a grocery/pharmacy; NValid, 14,887; NMissing, 86; Median, 0.00; Median SE, 0.26; Mean, 1.32; Mean SE, 0.03; SD, 2.67. Row 7: Item, Govt. employees; NValid, 14,880; NMissing, 93; Median, 0.00; Median SE, 0.26; Mean, 1.37; Mean SE, 0.03; SD, 2.98. Row 8: Item, Substance abuse; NValid, 14,909; NMissing, 64; Median, 0.00; Median SE, 0.26; Mean, 1.39; Mean SE, 0.03; SD, 2.86. Row 9: Item, Work in teaching/childcare; NValid, 14,906; NMissing, 67; Median, 0.00; Median SE, 0.26; Mean, 1.80; Mean SE, 0.03; SD, 3.25. Row 10: Item, Are a healthcare professional; NValid, 14,923; NMissing, 50; Median, 0.00; Median SE, 0.26; Mean, 1.89; Mean SE, 0.03; SD, 3.29. Row 11: Item, LGBT; NValid, 14,908; NMissing, 65; Median, 1.00; Median SE, 0.64; Mean, 2.50; Mean SE, 0.04; SD, 3.78. Row 12: Item, Recently unemployed; NValid, 14,890; NMissing, 83; Median, 1.00; Median SE, 0.64; Mean, 2.62; Mean SE, 0.04; SD, 3.92. Row 13: Item, Had COVID-19; NValid, 14,918; NMissing, 55; Median, 1.00; Median SE, 0.64; Mean, 2.75; Mean SE, 0.04; SD, 4.11. Row 14: Item, Immigrants; NValid, 14,914; NMissing, 59; Median, 0.00; Median SE, 0.26; Mean, 2.82; Mean SE, 0.05; SD, 4.68. Row 15: Item, Advanced degrees; NValid, 14,900; NMissing, 73; Median, 1.00; Median SE, 0.64; Mean, 3.08; Mean SE, 0.04; SD, 4.03. Row 16: Item, Hispanic or Latino; NValid, 14,902; NMissing, 71; Median, 1.00; Median SE, 0.64; Mean, 3.35; Mean SE, 0.05; SD, 4.54. Row 17: Item, African Americans; NValid, 14,887; NMissing, 86; Median, 1.00; Median SE, 0.64; Mean, 3.50; Mean SE, 0.05; SD, 4.72. Row 18: Item, Gun owners; NValid, 14,842; NMissing, 131; Median, 3.50; Median SE, 1.15; Mean, 3.97; Mean SE, 0.05; SD, 4.86. Row 19: Item, Church goers; NValid, 14,915; NMissing, 58; Median, 3.50; Median SE, 1.15; Mean, 4.78; Mean SE, 0.05; SD, 5.13. Row 20: Item, Republicans; NValid, 14,883; NMissing, 90; Median, 3.50; Median SE, 1.15; Mean, 4.95; Mean SE, 0.05; SD, 5.40. Row 21: Item, Democrats; NValid, 14,877; NMissing, 96; Median, 3.50; Median SE, 1.15; Mean, 5.80; Mean SE, 0.05; SD, 5.52. Row 22: Item, Are vaccinated for COVID-19; NValid, 14,905; NMissing, 68; Median, 8.00; Median SE, 1.79; Mean, 7.81; Mean SE, 0.06; SD, 5.66. Row 23: Item, Plan to vote in 2022; NValid, 14,864; NMissing, 109; Median, 8.00; Median SE, 1.79; Mean, 8.02; Mean SE, 0.06; SD, 5.91.
2024 acquaintance items, CES: FSU module. Estimates are weighted with design-based standard errors. N reflects the 801 individuals who responded to both the pre- and post-election waves

Table 3 Long description
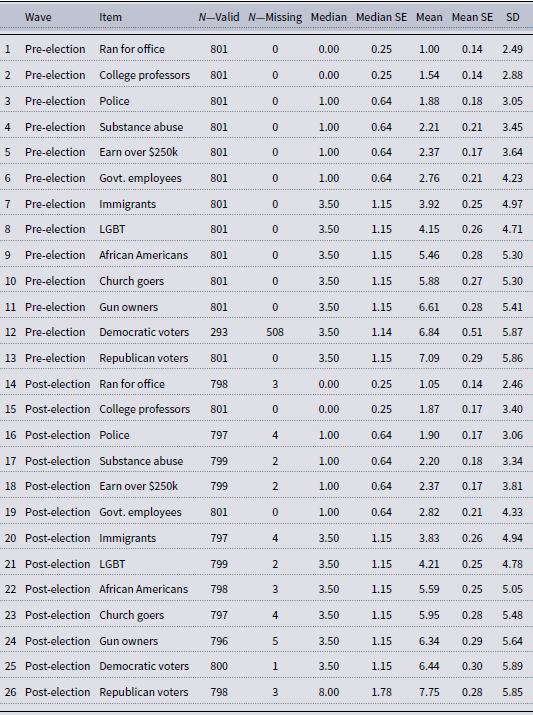
A table comparing acquaintance items across different years and waves. The table has 26 rows and 8 columns. Column headers are Item, NValid, NMissing, Median, Median SE, Mean, Mean SE, and SD. Row 1: Pre-election Ran for office, 801, 0, 0.00, 0.25, 1.00, 0.14, 2.49. Row 2: Pre-election College professors, 801, 0, 0.00, 0.25, 1.54, 0.14, 2.88. Row 3: Pre-election Police, 801, 0, 1.00, 0.64, 1.88, 0.18, 3.05. Row 4: Pre-election Substance abuse, 801, 0, 1.00, 0.64, 2.21, 0.21, 3.45. Row 5: Pre-election Earn over $250k, 801, 0, 1.00, 0.64, 2.37, 0.17, 3.64. Row 6: Pre-election Govt. employees, 801, 0, 1.00, 0.64, 2.76, 0.21, 4.23. Row 7: Pre-election Immigrants, 801, 0, 3.50, 1.15, 3.92, 0.25, 4.97. Row 8: Pre-election LGBT, 801, 0, 3.50, 1.15, 4.15, 0.26, 4.71. Row 9: Pre-election African Americans, 801, 0, 3.50, 1.15, 5.46, 0.28, 5.30. Row 10: Pre-election Church goers, 801, 0, 3.50, 1.15, 5.88, 0.27, 5.30. Row 11: Pre-election Gun owners, 801, 0, 3.50, 1.15, 6.61, 0.28, 5.41. Row 12: Pre-election Democratic voters, 293, 508, 3.50, 1.14, 6.84, 0.51, 5.87. Row 13: Pre-election Republican voters, 801, 0, 3.50, 1.15, 7.09, 0.29, 5.86. Row 14: Post-election Ran for office, 798, 3, 0.00, 0.25, 1.05, 0.14, 2.46. Row 15: Post-election College professors, 801, 0, 0.00, 0.25, 1.87, 0.17, 3.40. Row 16: Post-election Police, 797, 4, 1.00, 0.64, 1.90, 0.17, 3.06. Row 17: Post-election Substance abuse, 799, 2, 1.00, 0.64, 2.20, 0.18, 3.34. Row 18: Post-election Earn over $250k, 799, 2, 1.00, 0.64, 2.37, 0.17, 3.81. Row 19: Post-election Govt. employees, 801, 0, 1.00, 0.64, 2.82, 0.21, 4.33. Row 20: Post-election Immigrants, 797, 4, 3.50, 1.15, 3.83, 0.26, 4.94. Row 21: Post-election LGBT, 799, 2, 3.50, 1.15, 4.21, 0.25, 4.78. Row 22: Post-election African Americans, 798, 3, 3.50, 1.15, 5.59, 0.25, 5.05. Row 23: Post-election Church goers, 797, 4, 3.50, 1.15, 5.95, 0.28, 5.48. Row 24: Post-election Gun owners, 796, 5, 3.50, 1.15, 6.34, 0.29, 5.64. Row 25: Post-election Democratic voters, 800, 1, 3.50, 1.15, 6.44, 0.30, 5.89. Row 26: Post-election Republican voters, 798, 3, 8.00, 1.78, 7.75, 0.28, 5.85.
B.2 Name generator descriptive statistics
2018 name generator/interpreter items, FSU module. Entries are descriptive statistics for the reported number of core network members from each subpopulation. Estimates are weighted with design-based standard errors

Table 4 Long description
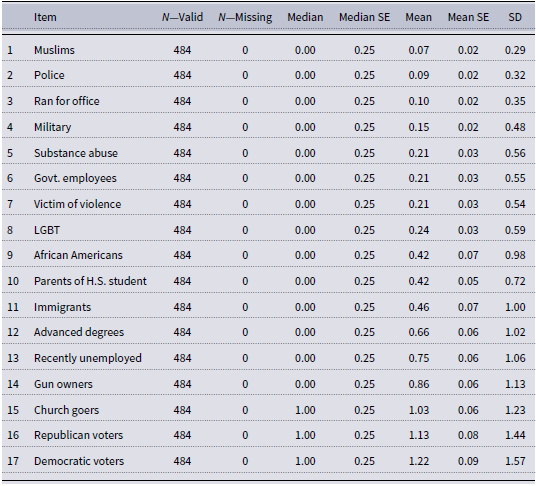
The table presents descriptive statistics for the reported number of core network members from different subpopulations in 2018. It includes 17 rows and 7 columns. The columns are labeled as Item, NValid, NMissing, Median, Median SE, Mean, Mean SE, and SD. Each row lists a subpopulation and corresponding statistics. Row 1: Muslims, 484, 0, 0.00, 0.25, 0.07, 0.02, 0.29. Row 2: Police, 484, 0, 0.00, 0.25, 0.09, 0.02, 0.32. Row 3: Ran for office, 484, 0, 0.00, 0.25, 0.10, 0.02, 0.35. Row 4: Military, 484, 0, 0.00, 0.25, 0.15, 0.02, 0.48. Row 5: Substance abuse, 484, 0, 0.00, 0.25, 0.21, 0.03, 0.56. Row 6: Govt. employees, 484, 0, 0.00, 0.25, 0.21, 0.03, 0.55. Row 7: Victim of violence, 484, 0, 0.00, 0.25, 0.21, 0.03, 0.54. Row 8: LGBT, 484, 0, 0.00, 0.25, 0.24, 0.03, 0.59. Row 9: African Americans, 484, 0, 0.00, 0.25, 0.42, 0.07, 0.98. Row 10: Parents of H.S. student, 484, 0, 0.00, 0.25, 0.42, 0.05, 0.72. Row 11: Immigrants, 484, 0, 0.00, 0.25, 0.46, 0.07, 1.00. Row 12: Advanced degrees, 484, 0, 0.00, 0.25, 0.66, 0.06, 1.02. Row 13: Recently unemployed, 484, 0, 0.00, 0.25, 0.75, 0.06, 1.06. Row 14: Gun owners, 484, 0, 0.00, 0.25, 0.86, 0.06, 1.13. Row 15: Church goers, 484, 0, 1.00, 0.25, 1.03, 0.06, 1.23. Row 16: Republican voters, 484, 0, 1.00, 0.25, 1.13, 0.08, 1.44. Row 17: Democratic voters, 484, 0, 1.00, 0.25, 1.22, 0.09, 1.57.
2022 name generator/interpreter items, CHIP50. Entries are descriptive statistics for the reported number of core network members from each subpopulation. Estimates are weighted with design-based standard errors

Table 5 Long description
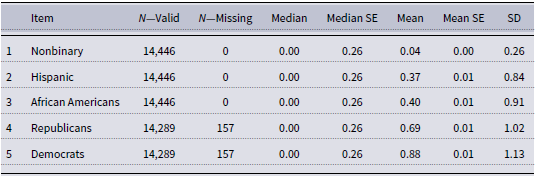
A table with five rows and eight columns comparing descriptive statistics for core network members across different subpopulations. The columns are labeled Item, N-Valid, N-Missing, Median, Median SE, Mean, Mean SE, and SD. Row 1: Nonbinary, 14,446, 0, 0.00, 0.26, 0.04, 0.00, 0.26. Row 2: Hispanic, 14,446, 0, 0.00, 0.26, 0.37, 0.01, 0.84. Row 3: African Americans, 14,446, 0, 0.00, 0.26, 0.40, 0.01, 0.91. Row 4: Republicans, 14,289, 157, 0.00, 0.26, 0.69, 0.01, 1.02. Row 5: Democrats, 14,289, 157, 0.00, 0.26, 0.88, 0.01, 1.13.
B.3 Feeling thermometer descriptive statistics
2018 feeling thermometers, CES: FSU and CU modules. Estimates are weighted with design-based standard errors

Table 6 Long description
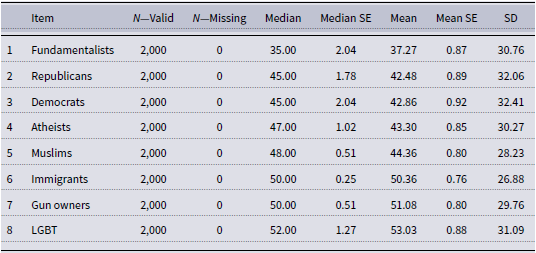
A table presenting 2018 feeling thermometer estimates from the CES FSU and CU modules. Estimates are weighted with design-based standard errors. The table has 8 rows and 8 columns labeled Item, N-Valid, N-Missing, Median, Median SE, Mean, Mean SE, and SD. The rows list Fundamentalists, Republicans, Democrats, Atheists, Muslims, Immigrants, Gun owners, and LGBT, along with their respective statistical values.
2022 feeling thermometers, CHIP50. Estimates are weighted with design-based standard errors

Table 7 Long description
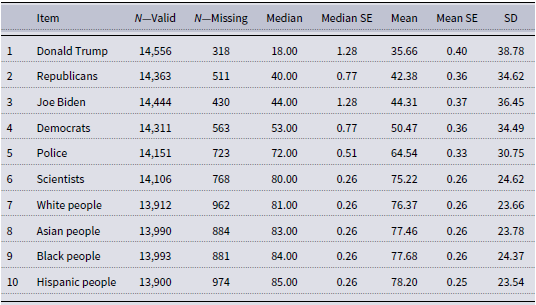
The table presents data on 2022 feeling thermometers for various items, with estimates weighted using design-based standard errors. It includes ten rows and eight columns. The columns are labeled as Item, N-Valid, N-Missing, Median, Median SE, Mean, Mean SE, and SD. Each row lists an item along with its corresponding statistical measures. Row 1: Donald Trump, 14556, 318, 18.00, 1.28, 35.66, 0.40, 38.78. Row 2: Republicans, 14363, 511, 40.00, 0.77, 42.38, 0.36, 34.62. Row 3: Joe Biden, 14444, 430, 44.00, 1.28, 44.31, 0.37, 36.45. Row 4: Democrats, 14311, 563, 53.00, 0.77, 50.47, 0.36, 34.49. Row 5: Police, 14151, 723, 72.00, 0.51, 64.54, 0.33, 30.75. Row 6: Scientists, 14106, 768, 80.00, 0.26, 75.22, 0.26, 24.62. Row 7: White people, 13912, 962, 81.00, 0.26, 76.37, 0.26, 23.66. Row 8: Asian people, 13990, 884, 83.00, 0.26, 77.46, 0.26, 23.78. Row 9: Black people, 13993, 881, 84.00, 0.26, 77.68, 0.26, 24.37. Row 10: Hispanic people, 13900, 974, 85.00, 0.26, 78.20, 0.25, 23.54.
Appendix C. Results by strength of partisan identity
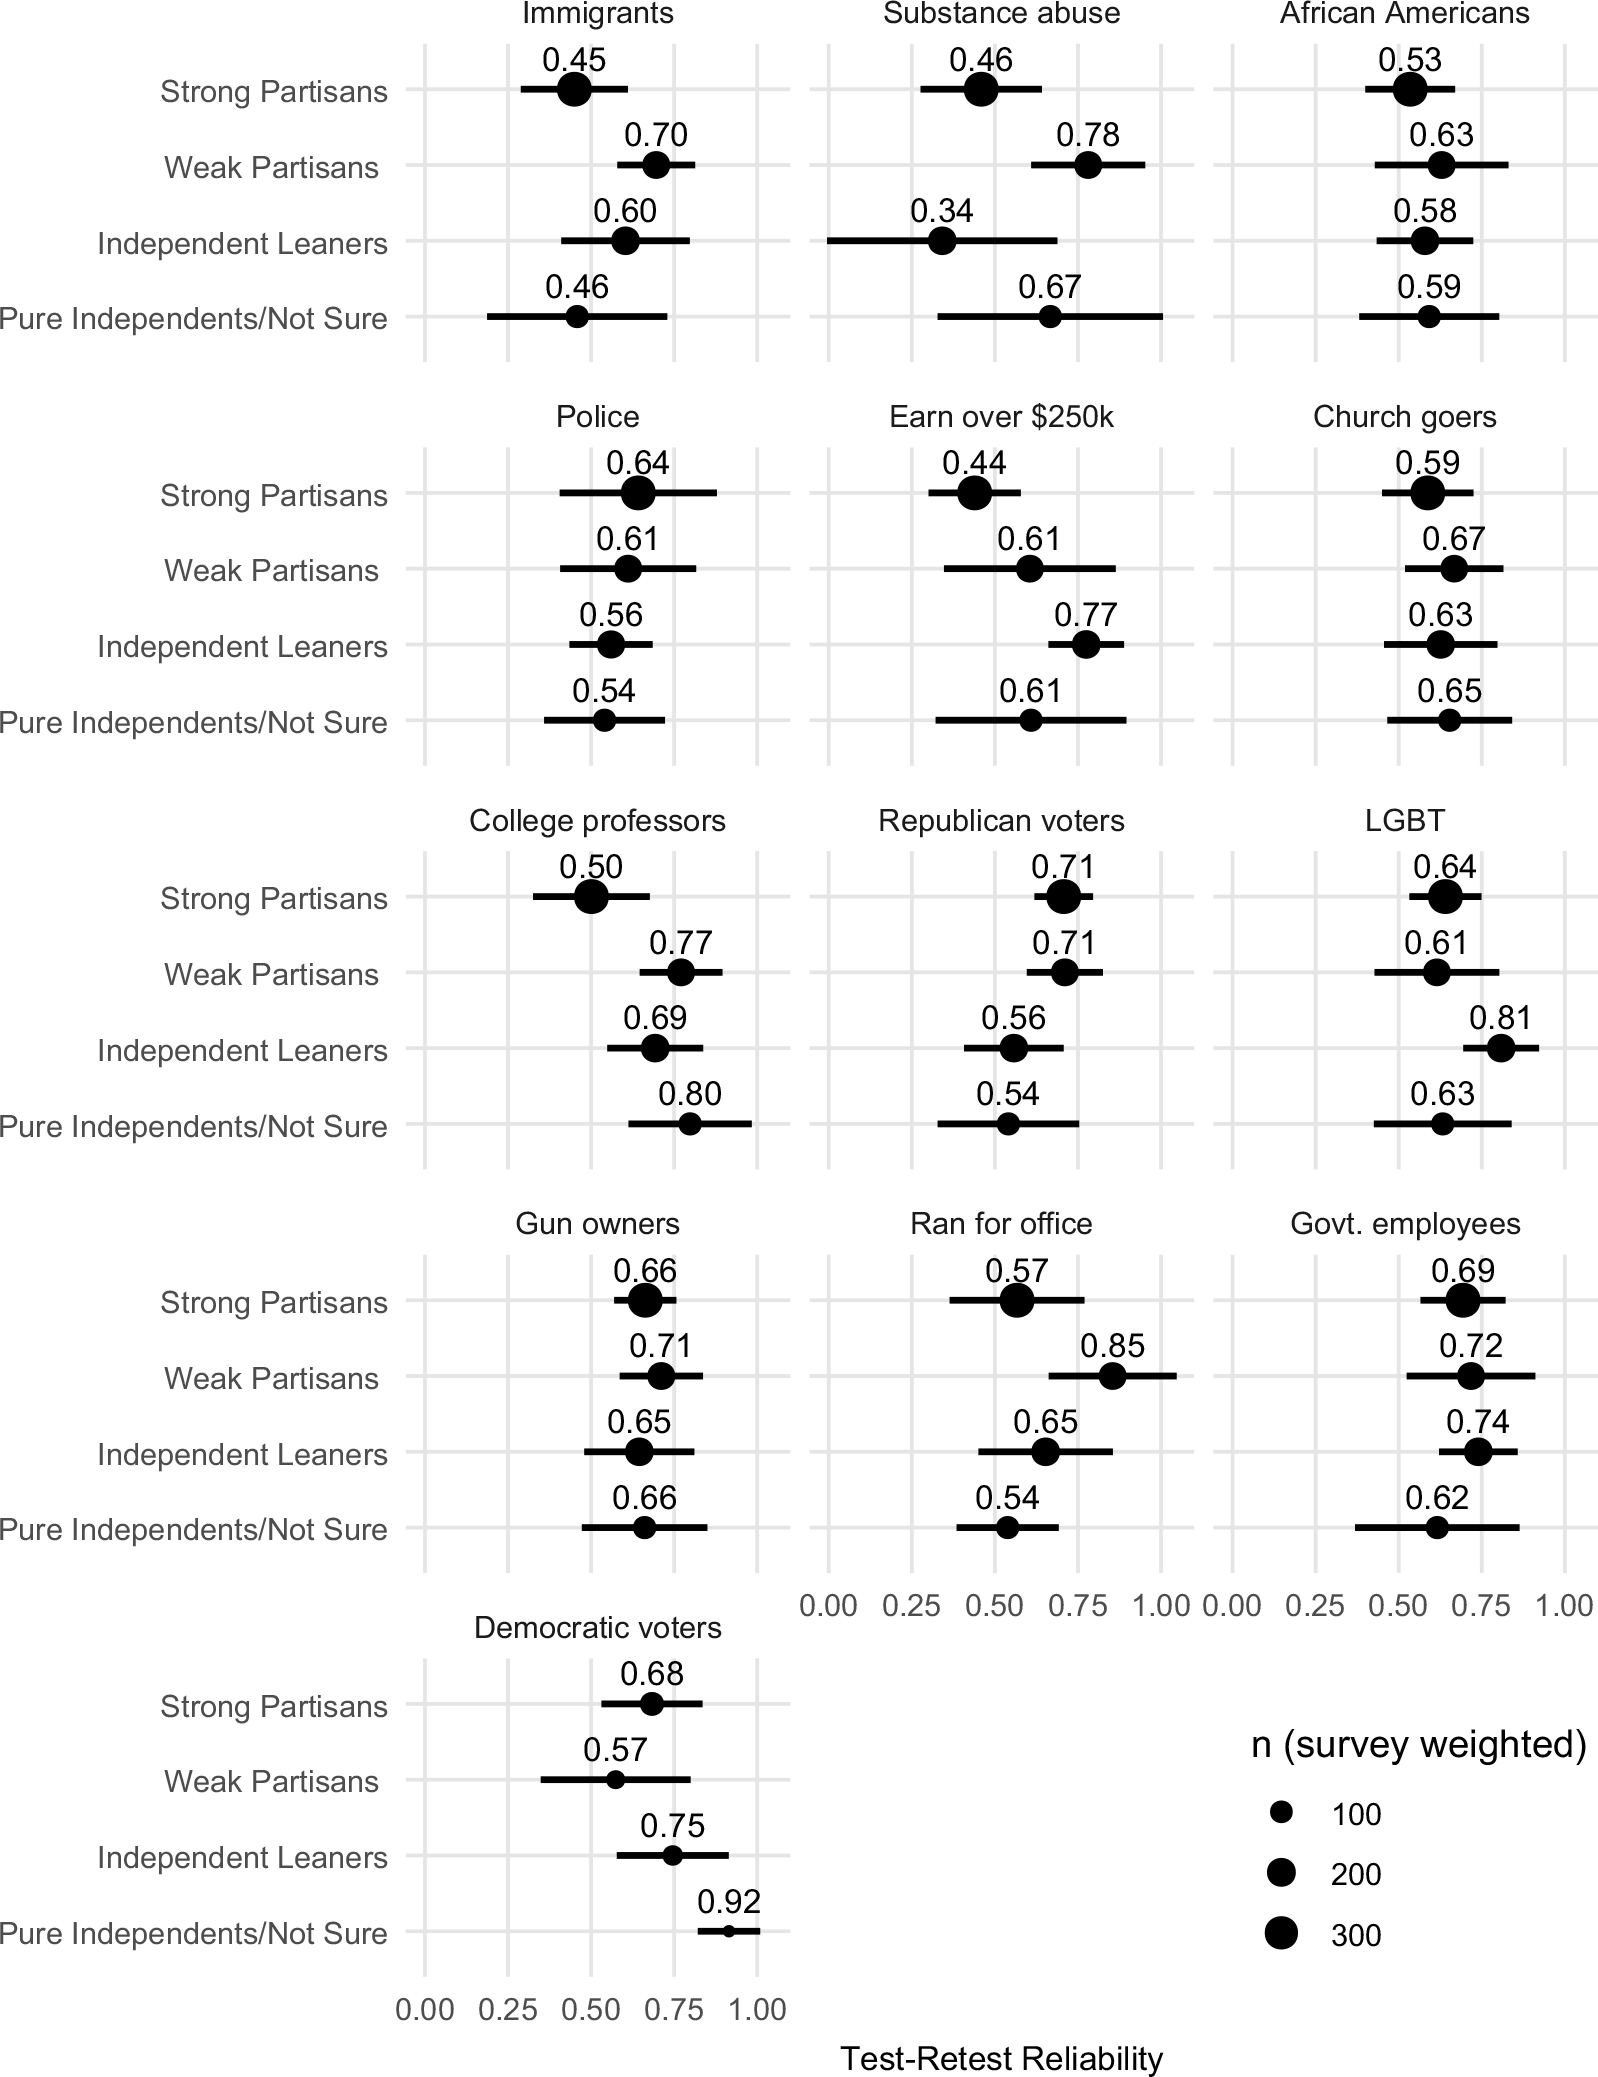
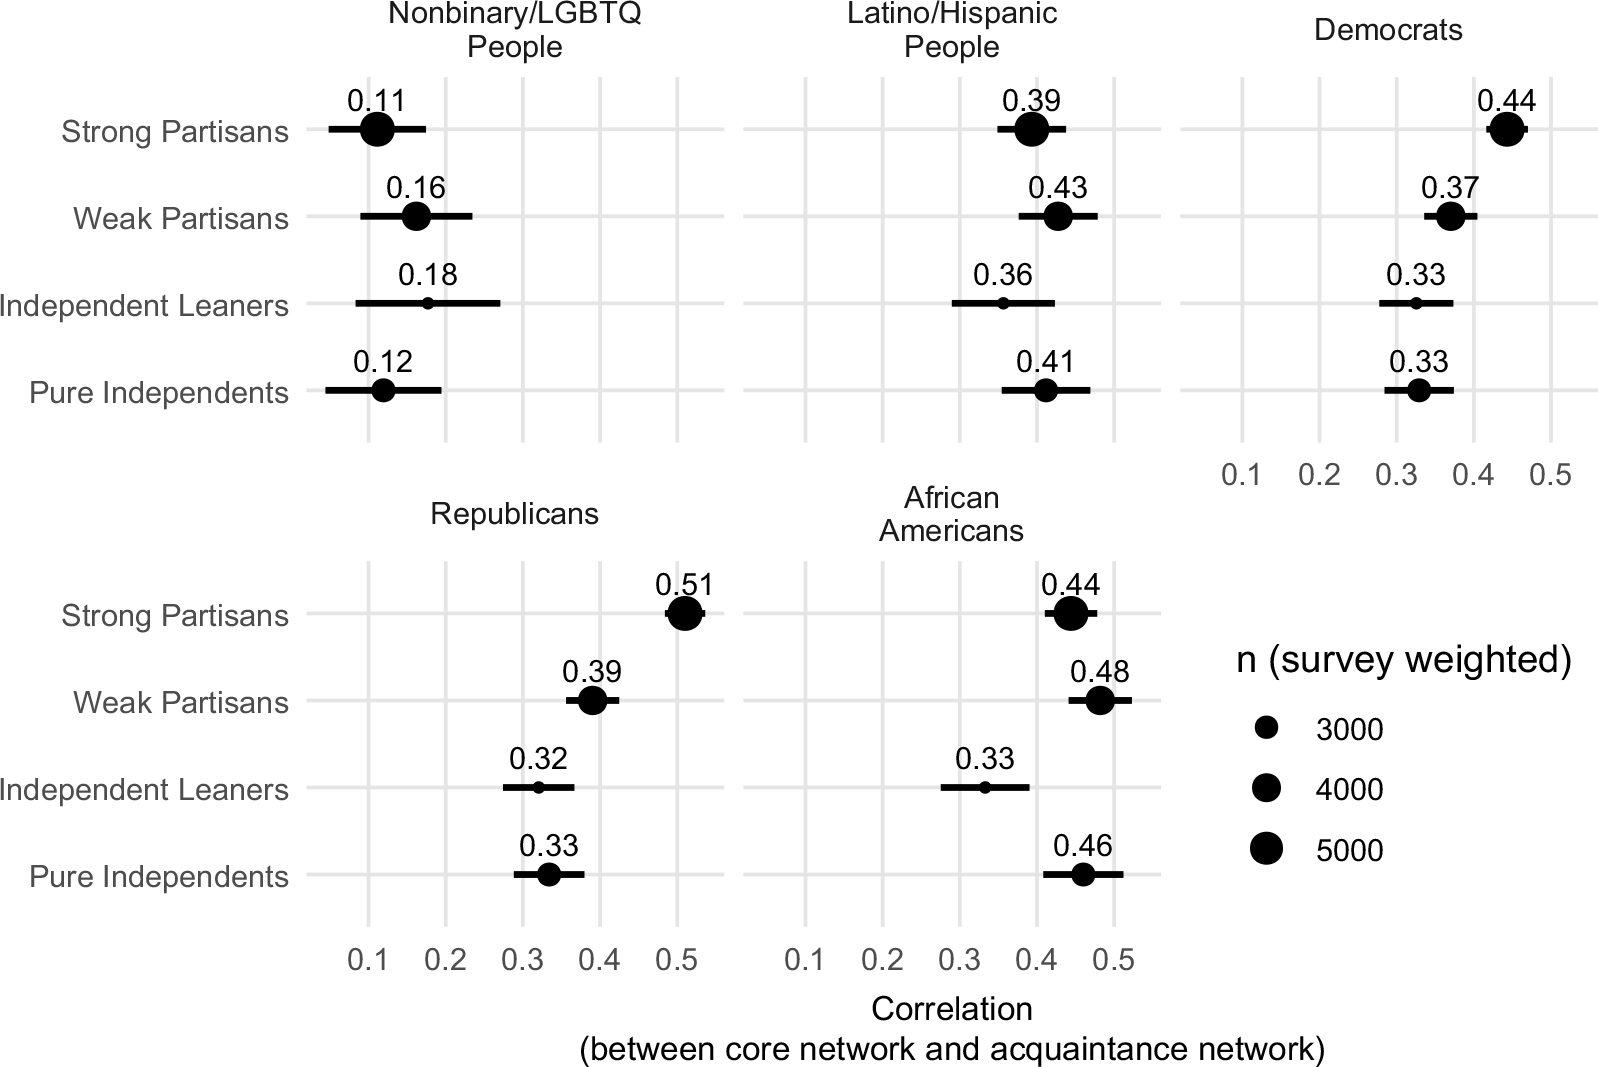
We measure the strength of partisan identity with four values: Strong Partisans, Weak Partisans, Independent Leaners (i.e., individuals who self-report as independents that lean consistently toward one party), and Pure independents. We derive these values from the traditional seven-point partisan identity scale. In the 2024 CES data, we group together pure independents with people who report that they are “Not Sure.” The 2022 CHIP50 data do not provide a “Not Sure” or analogous “Don’t Know” option. We exclude the 60 individuals with missing values for partisan identity in the 2022 CHIP50 data because we cannot determine why they were missing.
Variation in Test–Retest reliability across values of partisan identity strength. The x-axis represents the individual-level correlation between pre- and post-election responses for a given acquaintance item. Data: 2024 CES, FSU module.

Variation in the correlation between core networks and acquaintance networks across values of partisan identity strength. The x-axis represents the individual-level correlation between the number of subpopulation members in the core network and the number of subpopulation members in the acquaintance network. Data: CHIP50, 2022.

 k=4
 k=4
 =0
 =1

 Open access

