1. Introduction
1.1. Background
1.1.1. The paper will be looking at alternative LTC funding models and options around the globe. It will analyse six countries separately and then look at the potential applications for the UK market
1.1.2. LTC in the main refers to the support provided to the elderly as they lose the ability to look after themselves. It is a combination of medical, nursing, custodial, social and community services designed to help people who have disabilities or chronic care needs, including dementia. Services may be provided in the person's home (i.e. domiciliary), in the community, in assisted living facilities or in care homes.
1.1.3. Longevity is increasing as a result of advances in medical technology and treatments. People are living longer but potentially in a more disabled state.
1.1.4. The demand for LTC and the funding thereof is increasing globally. Countries are at various stages of this demand and they have taken different approaches to satisfy this demand.
1.1.5. Countries need to design programmes that provide independence and financial security for their elderly. This will involve varying degrees of public/private partnership and co-operation.
1.1.6. The six countries that are included in the analysis are France, Germany, Japan, Netherlands, UK and US.
1.2. Structure of the paper
1.2.1. This first section provides some background on the growing LTC crisis around the globe.
1.2.2. Section 2 provides a geographic overview comparing the six countries including demographic trends, social changes and health care expenditure.
1.2.3. Section 3 provides more details at a country specific level which includes more details on the demographics, public systems, private systems, partnerships and lessons learned.
1.2.4. Section 4 provides an overview of the UK market and potential overseas applications to the UK.
1.2.5. Section 5 sets out the conclusions of our research and analysis and potential next steps.
1.2.6. Section 6 provides a glossary and summary of abbreviations used in the paper which the reader may find useful.
1.2.7. Section 7 provides the references we used for the research and analysis in our paper.
2. Geographic Overview
2.1. This section sets out a comparison of demographic trends, social changes and healthcare expenditure for each of the six countries (where data was available). The countries were chosen either because they were deemed to be relatively successful in the private LTCI market or for their extremes in public versus private partnership.
2.2. Demographic trends
2.2.1. Population projections
2.2.1.1. Graphs 1 and 2, illustrate the projected demographic pressure as the global population ages.
Projected population age 65+ (% of total population) Source: US Census Bureau, International Data Base

Projected population age 85+ (% of total population) Source: US Census Bureau, International Data Base
2.2.1.2. Japan has the greatest proportion age 65+ in 2010 at 23%. It also has the greatest projected growth where the proportion is projected to almost double by 2050. In contrast the US has the lowest current proportion age 65+ population and the lowest projected growth. In 2010 the range, across the six countries, is from 13% to 23% and the projected range for 2050 is from 21% to 40%.
2.2.1.3. The results for age 85+ are similar with Japan having the highest proportion and the US having the lowest. In 2010 the range, across the six countries, is from 2% to 8% and the projected range by 2050 from 5% to 12%.
2.2.2. Life expectancy trends
2.2.2.1. Graphs 3a and 3b, illustrate the increase in life expectancy over the 20 years from 1990 to 2010.
Female life expectancy at birth and age 65 Source: OECD Stat Extracts
Male life expectancy at birth and age 65 Source: OECD Stat Extracts
2.2.2.2. For females at birth the US has the lowest starting at age 79 in 1990 and increasing to age 81 in 2010. In contrast Japan has the highest increasing from age 82 in 1990 to age 86 in 2010. The UK has the 2nd lowest life expectancy for the six countries analysed.
2.2.2.3. At age 65 the range is not as great as at birth. Japan and France are the highest at about 20 years in 1990 increasing to about 23 years in 2010. The remaining countries are grouped below them at about two to three years less.
2.2.2.4. For males the overall life expectancy at birth is about five to seven years lower than females and at age 65 about three to five years lower than females. This gap may however be narrowing.
2.2.3. Population pyramids
2.2.3.1. Charts 1–6 set out population pyramids for each of the six countries for 2010 and 2050 (projected). The source for all of the charts is from the US Census Bureau, International Data Base. Ages 45 to 60 represent the “baby boomers” which will be moving to the top of the pyramids and hence making them appear “top heavy”.
Population pyramid (France)
Population pyramid (Germany)
Population pyramid (Japan)
Population pyramid (Netherlands)
Population pyramid (UK)
Population pyramid (US)
Sources of payment Source: State Department of Health, Welfare and Sport
2.2.3.2. The projected increase in the elderly population is most pronounced for Japan.
2.2.4. Dependency ratios
2.2.4.1. The dependency ratio measures how much the elderly population is dependent on the working age population. It is defined as:
 $${\rm{Dependency}} \ {\rm{ratio}} \ {\rm{(\% )}}\,{\rm{ = }}\,{\rm{age}} \ {\rm{65}} \ {\rm{ + /ages}} \ {\rm{15}} \ {\rm{to}} \ {\rm{64}}$$
2.2.4.2. Graph 4 illustrates how the dependency ratio has increased over time from 1960 to 2008 for all six countries. The working age population is needing to support an increasing share of the elderly. Japan had the most significant increase from 9% in 1960 to 37% in 2008 (just over four times). The US showed the slowest growth.
Dependency ratios Source: World Bank Group, WDI Online
2.3. Social changes
2.3.1. Graphs 5 and 6, show a decline in marriage rates and an increase in divorce rates which means an increasing number of non-married people. As a result more elderly people may be living on their own and having to rely on care from professional caregivers as opposed to care from a spouse (assuming informal care from another family member or friend is not available).
Marriage rates (per 1000; ages 15–64) Source: US Census Bureau, Statistical Abstract of the US: 2012
Divorce rates (per 1000; ages 15–64) Source: US Census Bureau, Statistical Abstract of the US: 2012
2.4. Expenditure on healthcare and LTC
2.4.1. Graph 7 shows that France and the Netherlands are all publically funded; whereas, Japan, Germany and the US are 86%, 71% and 59% publically funded respectively. UK data was not available at time of printing. This will however be incorporated in the final paper. Also, France figures require further investigation as they appear inconsistent with our knowledge of the LTCI market in France.
Public versus private expenditure on LTC as a % of GDP (2009) Source: OECD Stat Extracts
2.4.2. Graph 8 shows that LTC expenditure as a percentage of total healthcare expenditure ranges from as low as 7% (i.e. 0.6/8.4) in the US to as high as 28% (i.e.2.7/9.5) in the Netherlands.
Public expenditure on healthcare and LTC as a % of GDP (2009) Source: OECD Stat Extracts
3. Country Specific
3.1. France
3.1.1. Demographics
3.1.1.1. France, like most other developed countries, is experiencing an increased demand for long term care. The OECD projects that the cost of care will increase from around 1.4% of GDP in 2007, 1.7% of GDP in 2008 to between 1.9% and 2.6% of GDP by 2050.
3.1.1.2. In 2010:
• France had an end-year population of 65.0 million
• Age 65+ represented 16.1% of the total population
• Age 85+ represented 2.5% of the total population
• Male life expectancy at birth was 78.1 years and 18.9 years at age 65
• Female life expectancy at birth was 84.8 years and 23.4 years at age 65.
3.1.1.3. In 2050:
• France's projected population is 72.3 million
• Projected age 65+ is 25.8% of the total population
• Projected age 85+ is 6.1% of the total population.
3.1.1.4. Healthy life expectancy from age 65 is estimated at 9 years for males and 9.8 years for females. Healthy life expectancy measures the number of years that a person of a specific age is expected to live without any severe or moderate health problems, which means that they can maintain usual activities.
3.1.1.5. 12 million people aged 60 and over (and a third of people aged 75 and over) live in a private home. 28% of the 12 million people aged 60 and over, i.e. 3.2 million (57% of whom are women) are in need of help in their everyday lives. Around 75% of care spend is in institutions and 25% in the home.
3.1.2. Public Systems
3.1.2.1. The French LTC system is based on a mix of the government pays through general taxation (Beveridge) and through national insurance funds (Bismark) models. The French system also relies on families to play a key role in financing and assisting with LTC. Total expenditure was estimated to be as much as €25bn in 2007, with the OECD estimating that public expenditure is 1.7% of GDP in 2008. France is discussing reforms and, potentially, the creation of a fifth social security pillar, so the detail below relates to the current system.
3.1.2.2. The French system operates a decentralised model with most of the decisions being made at the “departmental” level where individuals receive a Personalised Autonomy Allocation (APA). The APA is paid to all individuals over the age of 60 who require assistance with activities of daily living Individuals then use the APA to decide what care to get and where to get it, although expenditure is supervised and only accredited or approved service providers can be hired. It is available to all individuals with no means testing for eligibility; however the amount of benefit is reduced according to an individual's income. There is a maximum of 90% reduction for the highest earners. The monthly cash allowance varies according to the assessed level of dependence between EUR 530 and EUR 1235 (April 2010). The Government sets a national scale for assessing individuals’ needs and the departmental authorities allocate the APA according to these assessments. There were 1.1 million people in receipt of APA in 2008.
3.1.2.3. Around 70% of the APA budget is collected through local government funding. The remaining 30% is received from the central government fund, the “National Solidarity Fund for Autonomy” (CNSA). The Central government also sets the priorities for funding it provides through the CSNA. The CNSA is funded through employers’ social security contributions and from general taxation. Additional funding comes from the “solidarity day” when employees donate a day's wage to fund care. In 2008 the CNSA budget totalled €17bn.
3.1.2.4. The APA is used to meet dependency costs only; individuals must still meet their own hotel costs. Cost sharing for families is an important for LTC financing. The maximum amount of APA does not cover the total costs of care and families or individuals are expected to make up the difference. In 2007 families paid €650 m in co-payments. Individuals in institutional care must meet the full costs for a room, food etc unless they receive housing benefits (paid by the local authority).
3.1.3. Private Systems
3.1.3.1. The private insurance sector developed slowly in France, but has seen larger growth in recent years. According to the OECD less than 1% of LTC spending in France was from private insurance provision in 2007 but by 2010 15% of the population aged over 40 had a LTC policy. This growth has been mostly attributed to the wide discussions taking place in the media on how to fund LTC and the public becoming more aware of the risks and costs involved, and the gaps in public provision described above
3.1.3.2. Indemnity policies are most common and typically pay out a fixed monthly sum based on the level of dependency. Typically, they provide eligible recipients with a fixed level of monthly benefits for life, once the insurer meets criteria set in the policy regarding the level of dependency and waiting period. About 20% of indemnity policies solely cover the risk associated with severe or very severe levels of dependency, while about 80% also cover the risk associated with moderate levels of dependency. A typical policy for a 60 year old would charge an annual premium payment of about EUR 400 and EUR 500 per year (2008 values) to obtain a monthly payment of around EUR 600 in the event of severe or very severe dependency and between about EUR 200 and EUR 400 a month in the event of moderate dependency. Generally, benefits would start to be paid three months after an insured individual qualifies for LTC. Inflation protection is generally provided with both the monthly benefit amount and the premium levels subject to annual increases.
3.1.3.3. Some insurance policies have LTC rider benefits, where benefits are paid out of the death benefit or the accumulated savings build into the policy in the event that the policy holder requires long-term care for an extended period of time. These accounted for around 5% of the French market in 2009
3.1.3.4. The group LTC insurance market is large, representing about 45% of the LTC insurance contracts in 2009). Employees covered under a group insurance plan are generally required to participate in the plan and employers may pay for a portion of the premium on behalf of the employees. They do not provide coverage for future risks once an individual is no longer working
3.1.4. Partnerships
3.1.4.1. There are currently no partnership schemes for LTC in France, other than the mix of public and individual family (sometimes through insurance) can be seen as a social partnership.
3.2. Germany
3.2.1. Demographics
3.2.1.1. Germany has high life expectancy at 77.8 years for males and 82.4 years for females (2011)
3.2.1.2. The total population in 2011 was 81.5 million.
3.2.1.3. Around 20% of the population was aged over 60 (2010) with this percentage projected to exceed 30% by 2050.
3.2.1.4. In 2009 there were 2.4 million of the population with care needs at some level of whom 750,000 were in nursing homes and the remainder at home cared for by relatives (66%) or by care agencies (34%)
3.2.2. Public Systems
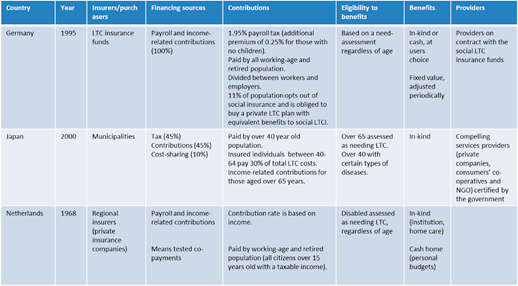
3.2.2.1. The German long term care system is a mixture of different insurance structures including both social insurance funds and private insurance schemes.
3.2.2.2. Social insurance, based on health insurance rather than life insurance principles, was introduced as a compulsory insurance in 1995 with subsequent reform to the structure to enhance the benefits in 2008.
3.2.2.3. In 2010 there were 69 million of the population covered by the compulsory social insurance.
3.2.2.4. As an alternative to the social insurance coverage the high income earners (above 49,000€ in 2011), civil servants and the self-employed may opt for private compulsory insurance coverage instead of the social insurance. 10 million of the population had private compulsory insurance in 2010.
3.2.2.5. Benefit levels (2012) depend on the care needs. For nursing care the benefit varies between 1,023€ per month to 1,850€ per month although a higher benefit of 1,918 may be payable in hardship cases. For care in the home the benefit levels vary between 235€ per month and 700€ per month as a cash allowance.
3.2.2.6. Additional benefits are provided for those with cognitive impairment.
3.2.2.7. Contributions to the social insurance are 1.95% of income or 2.2% if aged between 23 and 65 with no children of which 0.975% is paid by the employer. There is a maximum premium of 3,713€ per month.
3.2.2.8. Contributions to the private compulsory insurance vary by age from 18.87€ per month at age 30 to 59.51€ per month (from 2010) with 50% paid by the employer.
3.2.3. Private Systems
3.2.3.1. Private insurers offer products on both a life insurance basis and a health insurance basis.
3.2.3.2. Life insurance products were introduced from 1985 on a stand-alone basis covering long term care annuities in conjunction with pension and death benefits. From 1992 a further generation of products were offered including waiver of premium benefits, immediate long term care annuities and deferred long term care annuities. Total policies numbered under 140,000 by 2009.
3.2.3.3. Health insurance products were also introduced in 1985 providing daily cash benefits and/or reimbursement of long term care cost. From 1994 further products were introduced to provide top up benefits of additional cost reimbursement and services to the compulsory long term care insurance benefits. Total policies numbered just over 1,600,000 by 2009.
3.2.4. Partnerships
3.2.4.1. The structure of the provision for long term care does enable both public and private systems to exist together but the private system sits alongside, rather than integrated with the public system.
3.3. Japan
3.3.1. Demographics
3.3.1.1. Japan has high life expectancies and low birth rates which combined leads to an ageing population. The dependency ratio has also increased from 9% in 1960 to 35% in 2010 (almost quadrupling).
3.3.1.2. Informal care at home is also reducing which is putting greater pressure on formal care.
3.3.1.3. In 2010:
• Japan had a mid-year population of 127.6 million
• Age 65+ represented 23% of the total population
• Age 85+ represented 3% of the total population
• Male life expectancy at birth was 79.6 years and 18.9 years at age 65
• Female life expectancy at birth was 86.4 years and 23.9 years at age 65.
3.3.1.4. In 2050:
• Japan's projected mid-year population is 107.2 million
• Projected age 65+ is 40% of the total population
• Projected age 85+ is 12% of the total population.
3.3.2. Public systems
3.3.2.1. Japan now has five social insurance programmes which cover medical care, pension insurance, unemployment, occupational accidents and long-term care.
3.3.2.2. Providing care and public assistance to the elderly is seen as a national responsibility in Japan.
3.3.2.3. Japan created its LTC social insurance programme in 2000 responding to the difficult demographic challenges such as high life expectancies, low birth rates and a restrictive immigration policy. It covers home care and institutional care but there are no cash benefits. It is a nationally administered programme where the price and benefits are set by the national government but the assessments are made locally.
3.3.2.4. Their reforms were aimed at meeting the following key objectives:
• Increasing the level of independence for the frail elderly
• Reducing the burden of home care on their families
• More closely aligning benefits and premiums
• Providing more comprehensive care by integrating medical and long-term care programmes
• Reducing the number of hospitalised elderly.
3.3.2.5. It provides coverage to all people aged 40 and over. The coverage for ages 40 to 65 is for age-related diseases such as Parkinson's disease, pre-senile dementia or stroke.
3.3.2.6. It provides benefits based on the level of services required. There are five levels with one being the lowest and five the highest. The levels are based on the amount of time necessary to provide the services. There are monthly caps for home care and daily caps for institutional care.
3.3.2.7. There is a comprehensive assessment of medical and physical status and it is reviewed every six months. They vary by region and are conducted by experts appointed by local government.
3.3.2.8. The programme is designed as a pay-as-you-go system. 90% of the cost of care (regardless of the type of service) is reimbursed provided the services are rendered by a certified provider. The remaining 10% is an out-of-pocket co-payment subject to a maximum which can vary by income level.
3.3.2.9. The 90% is split between a mandatory contribution from those age 40+ and tax revenue (national and local government). The mandatory contribution varies by region and is means tested. For ages 40–64 it is about 1% of salary and for ages 65+ it was USD27 per month in 2010.
3.3.2.10. In 2009 public expenditure on LTC in Japan was 0.7% of GDP compared to private expenditure of 0.1% of GDP.
3.3.3. Private systems
3.3.3.1. There is minimal private LTC insurance in Japan. It is mainly supplemental coverage.
3.3.4. Partnerships
3.3.4.1. It is mainly a publicly funded system in Japan.
3.4. Netherlands
3.4.1. Demographics
3.4.1.1.
• In 2011 the Netherlands had a population of almost 17 million. About 15.2% of the population were over age 65 and 3.9% were 80 years and older
• In 2008 approximately 6.7% of the Dutch population over the age of 65 received long-term care in an institution setting, while 12.9% of this population received long-term care at home
• The Netherlands reported 8.2 long-term care workers per 1000 population over the age of 65 for 2009, this was above the OECD average of 6.4 workers per 1000
• In 2008 there were 69.5 beds per 1000 population over the age of 65, again above the OECD average of 44.5 beds.
3.4.1.2. Going forwards:
• By 2040 the government predicts it will have 4.5 million inhabitants over age 65.
• According to the most recent population projection of CBS, in 2050 the number of persons over the age of 65 will be 4.25 million (or 24.5% of the population) and the number of persons over 80 will be 1.7 million (or almost 10% of the population) i.e. in 2050, the number of persons over 80 will be almost three times as high as 2006
• In 2010 there were 1.3 million employees in the care and welfare sector, over the coming 15 to 20 years at least 400,000 extra care providers will be needed in the care sector alone. These will have to be provided from a declining working population.
3.4.1.3. Life expectancy for those born in 2011 is 78.84 years for males and 83.08 years for females.
3.4.2. Public systems
3.4.2.1. AWBZ (Algemene wet Bijzondere Ziektekosten/Exceptional Medical Expense Act)
• Incepted in 1968, The Exceptional Medical Expenses Act provides for care and support in cases of long-term ill health, handicap or old age, to everyone who lives in the Netherlands.
• It covers home help, nursing, care, treatment and supervision in care homes, nursing homes, or institutions. Care in hospitals and rehabilitation centres also falls under the Exceptional Medical Expenses Act, if the stay last longer than 365 days.
• For most AWBZ functions (not based in an institution), the client can choose between in-kind care and cash benefits via a Personal Budget. The Personal Budget regulation offers the client the possibility of having their own say in the purchase of the care they require. At 2011 130,000 clients made use of a Personal Budget. However, since 2002 the Personal Budget expenditure has risen by 23% annually (from EUR 414 million to EUR 2.2 billion in 2010) whilst the expenditure during the same period on care in-kind rose by an average of 4% annually.
• In 2010 over 600,000 people in the Netherlands made use of long-term care. There are around 150,000 voluntary workers active in long-term care. Over the last 10 years expenditure on the AWBZ care has risen by 66%, from just over EUR 14 billion in 2000 to over EUR23 billion in 2010. Around 340,000 of these received this care in their own home, whether in-kind or by means of a Personal Budget. The remaining clients receive care within an institution.
• Patients who choose the cash-reimbursement scheme receive a personal budget that is 25% lower than the costs of in-kind care. They may choose who should deliver the care and this can include friends and family members. Patients who choose in-kind care do have some say as to which care organisation delivers their care. The responsibility for organising and purchasing this care remains with the regional care offices. The care offices are affiliated with health insurers but run no risk on buying LTC, although they are required to keep costs within the regional and national budgets and to purchase care as efficiently as possible.
3.4.2.2. Wmo (Wet Maatschappelijke Ondersteuning; Law on Social Assistance) - an act covering social services carried out by local councils. This is not an insurance scheme and is affected by the available funds. Home help is provided under the Wmo by a fund which is not ear-marked and therefore encourages efficiency.
3.4.2.3. ZVW (the Health Insurance Act) - all residents of the Netherlands are compulsorily insured according to the Zorgverzekeringswet (Zvw, Health Insurance Act), which means that he or she must take out health insurance. ZVW covers GP care, pharmaceutical care, dental care for under 18's, maternity care, mental health care, medical devices, care provided by medical specialists, paramedical care, hospital care, obstetrics, some transportation. Individuals make income-related contributions (6.9% of the first 32,369 euros of annual taxable income) for which they are reimbursed by their employer, although tax is payable on this benefit. Contributions for the self-employed are individually assessed by the Tax Department.
3.4.2.4. CIZ (Centrum Indicatiestelling Zorg; Centre for Care Assessment)
• Every request for AWBZ care must be assessed by this independent organisation. There are no financial incentives; its financial position is not affected by its decisions. They carry out independent, objective and integral assessments to determine the amount of care that is necessary.
• Assessment for home help (covered under Wmo) is the responsibility of the local council, which has a financial incentive to restrict eligibility. However the majority of these assessments are also carried out by CIZ, although guidelines would be specified by the council.
3.4.2.5. Netherlands spent 3.5% of its GDP on long-term care in 2008, of which 1.2% was for health related long-term care. It spent a total of 10.8% of GDP on Healthcare in 2009 ranking it 23 in the world (USA16.2% (2), UK 9.3% (39))
3.4.2.6. Providers of home-based care are paid an hourly wage for almost all types of care, with the exception of day care in groups. The Dutch Health Authority determines maximum tariffs per hour for the different types of care covered by the AWBZ. The payment for institutional care is based on severity-of-care packages which have fixed prices.
3.4.2.7. Everyone with an income in the Netherlands pays a maximum of EUR 330 per months towards AWBZ care but this only covers 70% of the total expenditure. Co-payments are income-dependent to prevent care users running into severe financial difficulties.
3.4.2.8. Cost-Sharing differs between institutional and non-institutional care. Outside of institutions AWBZ beneficiaries have to pay an hourly rate for care that they receive, with an income and age dependent maximum. Cost sharing for domestic help under the Wmo is structured in the same way but the council can alter the parameters within certain limits.
3.4.2.9. There are two levels of cost-sharing for institutional care; high and low. Costs vary according to the length of time in the institution, whether a spouse is still living independently and level of income. Minimum amounts of remaining income are specified for singles and couples, which they can spend freely on clothes and incidentals.
3.4.2.10. Sources of payment are set out in chart 7 below.
3.4.3. Private systems
3.4.3.1. There are currently no private systems for the provision of LTC in the Netherlands.
3.4.4. Partnerships
3.4.4.1. There are currently no partnership schemes for LTC in the Netherlands.
3.4.5. The future
3.4.5.1. The AWBZ has been in a state of constant evolvement since 1968. The Netherlands are in the process of introducing a number of amendments to the AWBZ and the general provision of LTC:
• Decentralization of AWBZ to the municipal authorities (under the Social Support Act) to offer support more in tune with the client's needs. This is also expected to improve efficiency. Areas to be decentralised include:
○ Extramural supervision
○ Transport to and from external supervision
• From 1 January 2013 Care offices will be closed and the implementation of the Exceptional Medical Expenses Act will be placed in the hands of the insurer, securing a better connection between long-term care and curative care i.e. the client's insurer under ZVW will take over responsibility for contracting with the care provider, making payments and other administrative tasks. Over time the risks associated with the payments will be passed to the insurers but a Risk Equalisation System will be put in place.
• The provision of living accommodation and care will be separated, leading to an increased possibility for clients to choose their own accommodation. Accommodation within an institution was previous covered by the AWBZ for those on a low income. This will no longer be the case; however alternative financial assistance will be available to those in need, to assist with their housing costs.
• Simplifying the indication assessment:
○ An indication decision will become valid for fifteen rather than 5 years.
○ Reduced process for those over 80 applying for accommodation due to their need for care and support.
○ Ensuring indication assessment are centralised and uniform
• Rehabilitation after a health shock (for example a stroke) is currently covered by the AWBZ, except where rehabilitation is in a specialised clinic. From 2013 this service will be covered under the ZVW.
• A budget has been reserved to allow for an annual growth in LTC of 2.5% in addition to structural investment of EUR 852 million to invest heavily in extra personnel and training.
• The Personal Budget expenditures have risen immensely over the last few years and this growth cannot be sustained. Therefore access to the Personal Budget will be limited to those with an indication for intramural accommodation i.e. a life-long need for care that affects every area of their lives.
• Funding should follow the client to a greater extent.
• Financing per treatment will change to financing based on result
• Further professionalization of the governance of LTC is needed
• Rights of the client will be strengthened
• Optimisation of the scale of care institutions to increase efficiency, lower costs, and lead to a higher level of customer satisfaction and care
• The client's need for care will take a more central position.
3.4.5.2. The original philosophy underlying the AWBZ was that every person in the Netherlands should be insured against the very high expenses of necessary care, which very few people could afford out-of-pocket. Experience in other countries has shown that it is difficult to solve this problem with private insurance, due to reasons such as the unpredictable nature of future long-term care costs. Over time the ABWZ scheme has expanded to cover services which cannot be described as catastrophically expensive and costs have ballooned. Debate now centres on limiting the AWBZ entitlements to the most vulnerable persons and the most necessary services. Co-payments are already so high for higher-earners that some services are only used by the less well off. Consideration is now being given to which problems the system should seek to solve.
3.4.5.3. An important weakness in the system relates to the lack of incentive for efficiency, which have contributed to doubts over future sustainability.
3.4.5.4. In the Netherlands, a relatively large proportion of women work part-time and family is considered to be the “natural” provider for children, while the state is thought to be the steward for the elderly. However, the recent changes to the AWBZ could be an indicator that this view may no longer be financially viable over the coming decades. This raises the question of whether some responsibility should be shifted back to the individual and/or their family.
3.4.5.5. Although the Government intended the Personal Budget's use to include the payment of informal caregivers such as friends and family, new Personal Budgets are being restricted to those in Institutional Care to contain the cost of Long Term Care provision. This is despite the fact that the clients could qualify for formal care if their informal care withdraws their help. This may indicate that the true value of informal care was under-estimated and cannot be fully funded.
3.5. United States
3.5.1. Demographics
3.5.1.1. The main data source in this section is from an organisation called “The SCAN Foundation”. It is an independent charitable foundation focused on finding innovative solutions to the healthcare needs of California seniors. It's vision is to create “a society where seniors receive medical treatment and human services that are integrated in the setting most appropriate to their needs and with the greatest likelihood of a healthy, independent life.”
3.5.1.2. Their mission is to, “Advance the development of a sustainable continuum of quality care for seniors. A sustainable continuum of care improves outcomes, reduces the number and duration of acute care episodes, supports patient involvement in decision making, encourages independence, and reduces overall costs. The SCAN Foundation will achieve this mission by encouraging public policy reform to integrate the financing of acute and long-term care, raise awareness about the need for long-term care reform and work with others to promote the development of coordinated, comprehensive and patient-centric care.”
3.5.1.3. In the US, the ageing population combined with the retirement of the baby boom generation (the largest generation in history) has led to an increase in demand for long-term care.
3.5.1.4. In 2010:
• There were 40.3 million age 65 and older (about 13% of the total US population) and 5.5 million were 85 years and older (almost 2% of the total population)
• The majority age 65 and over are female (57%)
• There were 53,364 individuals age 100 and over
• From 2009 to 2010 only about 3% of older Americans lived in a different county or state than they had a year earlier or had moved abroad
• About 44% age 65 and older lived alone.
3.5.1.5. Going forwards:
• The number needing long-term care is expected to increase from approximately 12 million today to 27 million in 2050
• Between 2011 and 2029 baby boomers will turn 65 (about 10,000 per day)
• By 2030, the number age 65 and over is projected to be about 72 million (about 19% of the total US population)
• By 2050, the number age 65 and over is projected to be about 89 million (about 20% of the total US population).
• Those age 85 and older is expected to grow by more than 25% by 2030 and by 126% by 2050
3.5.1.6. Figure 1 summarises these projections.
Older Americans as a percentage of the total US population Source: The Scan Foundation Fact Sheet, June 2012
3.5.1.7. Life expectancy has also increased and is expected to continue to increase. In 1910 life expectancy was only 52 years compared to 79 years in 2010. Life expectancy is higher for women than for men (i.e. 81 versus 76 years in 2010).
3.5.1.8. The projections for those age 65 and over with Alzheimer's Disease are as follows:
• 2012–5.2 million
• 2025–6.7 million
• 2050–11 to 16 million.
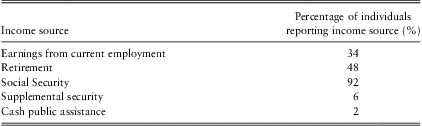
3.5.1.9. The sources of income for those age 65 and older in 2010 are summarised in table 1.
Selected sources of income as reported by Americans age 65+ in 2010
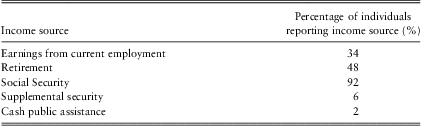
Source: The Scan Foundation Fact Sheet, February 2012
3.5.2. Public systems
3.5.2.1. The US has two government programmes that pay for LTC services as described below.
3.5.2.2. Medicare is:
• the federal health insurance programme for older adults(age 65 and older) and younger people with disabilities, those with end stage renal failure and end-of-life care (via the hospice benefit). It spreads the financial risk (associated with illness) across society to protect everyone. It is funded through payroll tax
• It covers acute care services and pays only for medically necessary skilled nursing home and home health services. Stays in nursing homes are covered for 100 days with a co-payment for days 21 to 100. Home health care is only paid on a limited basis (i.e. only if skilled care is required). It does not pay for custodial care (i.e. personal/social care).
• To be eligible you need to have worked at least 10 years and be 65 years of age or older.
• In 2010 48 million people were covered by Medicare with 40 million for those age 65 and older and 8 million for younger people with disabilities. It covers about half of the healthcare costs for those who are eligible.
3.5.2.3. Medicaid is:
• the largest source of funding for medical and health-related services for people with limited income in the US and is the primary payer of LTC services with a bias towards institutional care
• It is a medical assistance programme jointly funded by the states and the federal government. It is funded through general taxation and is a means-tested welfare-based system.
• It is managed by the individual states and as a result differences in budgets and coverage decisions give rise to different services and spending decisions across the states.
3.5.2.4. Those with low-incomes and few assets rely on Medicaid which operates as a “safety net programme”. The wealthy can afford to fund their care needs themselves or can purchase LTC insurance. Those in the middle tend to rely on informal care provision by family members or friends.
3.5.2.5. The healthcare spending split is set out in figure 2 and the sources of payment for LTC is set out in figure 3.
Healthcare spending split Source: Wikipedia, Medicaid
2008 sources of payment of LTC by payer (excludes informal care) Source: The SCAN Foundation, 2011
3.5.3. Private systems
3.5.3.1. Private LTC insurance in the US provides coverage for both institutional and non-institutional care. The claims trigger is generally based on a combination of activities of daily living or cognitive impairment. They offer benefit periods from up to a few years to lifetime and an elimination period of zero days up to 90 days. Their products also offer inflation protection.
3.5.4. Partnerships
3.5.4.1. Previous partnership schemes were developed in the early 1990s. Unfortunately take-up has struggled to exceed 10%. Four states used two models of asset protection as follows:
• Dollar-for-dollar (CA, IN, CT) – the amount of insurance coverage purchased equals the amount of assets protected from consideration if and when the consumer needs to apply for Medicaid (e.g. a consumer who bought $100,000 of LTCI would get $100,000 of care. If further care were required the individual would be able to apply for Medicaid, while still retaining $100,000 worth of assets)
• Total asset protection (NY) – more comprehensive package as defined by the state. Initially, the state mandated that Partnership policies cover 3 years of nursing home or 6 years of home-health care. Consumers purchasing such a policy could protect all of their assets when applying for Medicaid.
3.5.4.2. A new partnership scheme was being developed called “Community Living Assistance & Support Systems” (CLASS Act). The high level details are as follows:
• State-sponsored national workplace insurance scheme which was passed as part of the 2010 healthcare reform
• Enrolment would be voluntary, available to most working adults and pre-existing medical conditions would not exclude individuals from enrolling. To receive the benefits, people would have to meet specific requirements regarding earnings and premium payments.
• The goal was to begin the scheme in 2013; however, in October 2011, the U.S. secretary of health and human services declared the programme to be actuarially unworkable, and work on the programme's implementation ceased.
4. Applications to the UK
4.1. Overview of the UK
4.1.1. Introduction
4.1.1.1. The long-term care (LTC) environment in the UK is very complex and is currently undergoing a period of re-development as a result of the Dilnot Commission and subsequent recommendations.
4.1.1.2. The key drivers increasing the demand for LTC are:
• expansion in the elderly population (e.g. age 65+ is projected to more than double by 2083)
• changes in the willingness of family members to provide informal care
• changes in the health and dependency levels of very old people
• changes in the expectations of older consumers
• projected growth in the dependency ratio of this older and more infirm segment will mean the cost of providing state funded care will become prohibitive.
4.1.2. Long-term care insurance
4.1.2.1. The LTC insurance market in the UK has been slow to develop relative to markets like the US and France. This is partly due to an incorrect perception that the State will provide and a lack of clarity as to what the State does provide versus what individuals/families are responsible for.
4.1.2.2. In the past there were various forms of LTC insurance, which included pre-funded, immediate needs annuities and investment bonds (i.e. unit-linked LTC insurance). Currently only immediate needs annuities (and variations thereof) are sold. Set out in chart 8 are the historic sales of immediate needs annuities which peaked in 2004 at 1,730 new policies.
Immediate needs annuities sales (policies) Source: ABI new business statistics
4.1.2.3. It is interesting to compare the above new business statistics with the potential market, e.g. self-funders needing residential care. This can be estimated by the following formula:
 $${ & {\rm{(Population}} \ {\rm{age}} \ {\rm{65 + )}}\,\times \,{\rm{(probability}} \ {\rm{of}} \ {\rm{entering}} \ {\rm{a}} \ {\rm{nursing}} \ {\rm{home)}} \cr & {}\,\times \,{\rm{(\% }} \ {\rm{self - funders)}}\,\times \,{\rm{(\% }} \ {\rm{to}} \ {\rm{exclude}} \ {\rm{Scotland}} \ {\rm{which}} \cr & \,{\rm{provides}} \ {\rm{free}} \ {\rm{personal}} \ {\rm{care)}}{\rm{.}} \cr}$$
4.1.2.4. Using GAD population statistics, inception rates from the US Society of Actuaries LTC experience studies (elimination period = 0 days and failure of 3/6 activities of daily living) as a proxy for UK inception rates and Laing & Buisson data to determine the proportion of self-funders in nursing homes the following estimates for potential market size are derived. It indicates a market penetration of less than 1%. See table 2.
Comparison of new business to potential market

4.1.3. The local authority financial assessment level (for those needing permanent residential care) varies in the UK as set out in table 3.
Means test levels in the UK (2011/2012 levels)

4.1.4. A year of consultations – 2011
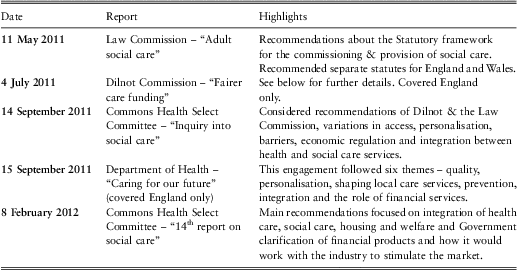
4.1.4.1. Last year was “the year of consultations” on UK social care reform (including the provision of care and the funding thereof). The key consultation documents are summarised in table 4. It is important to note that although this next section on consultations apply to England there is a lot going on in the devolve nations which will be covered later.
Summary of highlights
4.2. England
4.2.1. All of the above fed into the White Paper on social care reform, the Draft Care and Support Bill and the progress report on funding published on 11th July 2012 (discussed later).
4.2.2. The recommendations from the Dilnot Commission's “Fairer care funding” report were actively debated since their publication in July 2011.
4.2.3. The report proposed “a new partnership between the individual and the state – one where individuals need to take reasonable and appropriate responsibility, but the state provides protection for those with the greatest needs”.
4.2.4. The key recommendations in the report that are relevant from a financial services perspective were:
4.2.4.1. Capping of an individual's lifetime contribution towards social care costs. Once a cap is reached, individuals then become eligible for full State support. The suggestion for the cap was set between £25,000 and £50,000, with £35,000 considered the most appropriate and fair figure, along with a suggestion that the cap is updated annually on the same basis as the basic State Pension.
4.2.4.2. An increase in the residential means-tested threshold, above which people become liable for their full care cost from £23,250 to £100,000. The threshold is intended to continue to act a “safety net” to help those who cannot help themselves.
4.2.4.3. People should contribute a standard amount to cover their general living costs, such as food and accommodation, in residential care. They believe a figure in the range of £7,000 to £10,000 per annum would be appropriate.
4.2.4.4. Invest in an awareness campaign.
4.2.4.5. Develop a new information and advice strategy.
4.2.5. Currently lifetime contributions, including care and general living costs, are potentially unlimited. See figure 4 below for an illustration of these costs.
Expected future lifetime cost of care for people aged 65 in 2009/10, by percentile (2009/10 prices) Source: “Fairer care funding” report, page 13
4.2.6. Figure 4 illustrates that 1 in 4 will spend very little on formal social care but 1 in 10 will spend more than £100,000.
4.2.7. Using the lifetime contribution cap of £35,000 for social care, a £10,000 contribution for general living costs, the increased means test of £100,000 and the increased number of assessments the commission estimated that its proposals would cost the State approximately £1.7 billion, which is less than 2% of NHS funding (approximately £100 billion). This figure prompted speculation that the Government might hold back on accepting the recommendations.
4.2.8. However, regardless of what legislative reform follows, the care funding issue for individuals (especially self-funders) will still be there and potentially quite significant. For example, assume the individual lifetime contribution towards the social care cap is £35,000 and the individual per annum contribution towards general living costs is £10,000pa. The local authority is responsible for the assessment and they determine that the cost to place an individual in a care home is £30,000pa; therefore, £20,000 is deemed to be social care costs (i.e. £30,000–£10,000), which contributes towards the cap.
4.2.9. If the individual decides on a care home that costs £30,000pa then the cap would be reached in year two (i.e. £20,000 + £15,000 = £35,000). In year three and onwards the State would pay £20,000pa and the individual £10,000pa.
4.2.10. If however the individual chooses a care home that costs £40,000pa the cap would still be reached in year two but from year three and onwards the State would pay £20,000pa (like above) and the individual would have to pay the remaining £20,000pa (i.e. they pick up the additional general living costs arising from a better quality care home).
4.2.11. It is also important to understand the significant role of the Local Authorities post-Dilnot. They will be responsible for carrying out the care assessment, the means test assessment, determining the contribution towards the cap and metering the cap.
4.2.12. Industry response to the 2011 consultations
4.2.12.1. In response to the consultations, the key messages coming from the financial services industry were the need for reform and the need for clarity and consistency in the system. This is crucial to enable and encourage people to plan and prepare for their care and support needs.
4.2.12.2. The concept of a cap has been viewed favourably as it gives people an amount to plan for; however, there needs to be certainty about the level of the cap. In general a higher cap would mean more expensive premiums, but potentially greater consumer engagement with insurance. A lower cap may mean lower premiums but lower consumer engagement.
4.2.12.3. Any new product development needs to be very flexible to support the different needs of consumers. Private insurance could take many forms such as immediate needs annuities (which are currently available), pre-funded insurance, a link to pensions (e.g. disability-linked annuity) and a link to housing wealth using equity release as a funding mechanism. Private insurance could also cover any additional LTC needs above the cap, for example, funding living costs or the additional costs of a more expensive care home. It is important to note that the public perception is that the cap will include the “hotel” costs; therefore, the industry needs to play its part it getting the message across about how much the individual still will need to pay even after Dilnot.
4.2.13. Responses to the Law Commission and the Dilnot recommendations - 2012
4.2.13.1. On 11th July 2012 the Department of Health published three papers. The proposals are the most radical reform to social care since 1948. The papers were:
- Caring for our future: reforming care and support (the “White Paper”)
- Draft Care and Support Bill
- Caring for our future: progress report on funding reform.
4.2.13.2. Caring for our future: reforming care and support (the “White Paper”)
4.2.13.2.1. The White Paper sets out the vision for a reformed care and support system – transforming it from a service that reacts to crises to one that focuses on preventative care and is built around the needs and goals of people. “Dignity and respect” will be at the heart of the reform.
4.2.13.2.2. The new system will:
• focus on people's wellbeing and support them to stay independent for as long as possible
• introduce greater national consistency in access to care and support
• provide better information to help people make choices about their care
• give people more control over their care
• improve support for carers
• improve the quality of care and support
• improve integration of different services.
4.2.13.3. Draft Care and Support Bill
4.2.13.3.1. This bill creates a single law for adult care and support, replacing more than a dozen different pieces of legislation. It provides the legal framework for putting into action some of the main principles of the White Paper, “Caring for our future: reforming care and support”, and also includes some health measures (e.g. Health Education England, Health Research).
4.2.13.4. Caring for our future: progress report on funding reform
4.2.13.4.1. The report sets out that the Government agrees the principles of the Dilnot Commission's model – financial protection through capped costs and an extended means test – would be the right basis for any new funding model. It is the government's intention to base a new funding model on the principles if a way to pay for it can be found. However, whilst it is the right thing to do, given the size of the structural deficit and the economic situation the country faces, the government is unable to commit to introducing a new system at this stage. Funding reform needs to be considered alongside other priorities and the right place to do this is at the next Spending Review. Decisions will be taken then. The Government will continue to work with stakeholders to consider in more detail variants under the principles of the Dilnot Commission's model, before coming to a final view at the next Spending Review.
4.2.13.4.2. At the last Spending Review the Government took the decision to prioritize adult care and support by allocating an additional £7.2 billion to the system over the four years to 2014/15 to support local authorities in delivering care. They are now making available an additional £300 million over 2013/14 and 2014/15 to support local areas to further develop innovative, integrated services that support care and support and benefit people's health and wellbeing.
4.2.13.4.3. They are introducing a Universal Deferred Payments scheme for residential care from April 2015. The draft Care and Support Bill includes the necessary powers to implement the scheme (subject to parliamentary agreement). This will extend the current discretionary scheme to a full national offer. Currently local authorities cannot charge interest, but the Government agrees that interest or charges should apply and the draft Bill will allow this. In 2013 and 2014, they will work with the care sector on how the scheme would work, including exactly when someone should be eligible and what interest or charges would be appropriate.
4.2.13.4.4. They are introducing a national eligibility threshold for adult care and support from April 2015. The draft Care and Support Bill includes the necessary powers to implement the scheme (subject to parliamentary agreement).
4.2.13.4.5. They have committed to providing a clear, universal and authoritative source of national information about the health and care and support system, setting up an expert working group with financial services and the care sector to ensure the right information is available to help people plan ahead for later life and clarifying the tax treatment of disability-linked annuities (working with the ABI; due by September 2012).
4.2.13.4.6. The White Paper will take forward portability of care assessments, legislating to transform the support for carers, by extending the right to a carer's assessment and provide an entitlement to public support and publishing a framework for improved integration between health and care.
4.2.14. Conclusions
4.2.14.1. The need for people to make provision for their care and support needs is going to be a major theme for the financial services industry going forward. The Dilnot report has been a long time coming and it is hoped that the recommendations will stimulate policy makers to revitalise the market in new directions, which in turn needs to build confidence within financial services companies to invest scarce capital. The onus now has switched to the Government to shape the reports and proposals into a structure capable of meeting the needs of generations to come.
4.3. Northern Ireland
4.3.1. The Health and Social Care services are in the process of being transformed in Northern Ireland (NI) as a result of the significant and growing pressures on the Health and Social Care system, including a growing and ageing population.
4.3.2. In June 2011, the Minister for Health, Social Services and Public Safety, Mr Edwin Poots MLA, announced a review of the provision of health and social care services in Northern Ireland. A Review Team of independent experts was assembled, chaired by John Compton, Chief Executive of the Health and Social Care Board. They were asked to bring forward recommendations for the future shape of services.
4.3.3. Transforming Your Care (TYC) - the 10 major areas of care that were examined by the Review Team were:
• Population health and well-being
• Older people
• People with long-term conditions
• People with a physical disability
• Maternity and child health
• Family and child care
• People using mental health services
• People with a learning disability
• Acute care
• Palliative and end of life care.
4.3.4. The areas of particular interest for adult social care are “older people” and “palliative and end of life care”.
4.3.5. With the individual at the centre of the future care model the team looked at how changes could be made across different “Programmes of Care” (PoC) to deliver the vision.
4.3.6. There were 99 recommendations in their report “Transforming Your Care – A Review of Health & Social Care in Northern Ireland” (issued 13th December 2011), with a number of key areas emerging:
• More diverse provision of services, delivered closer to home
• A focus on delivery of services through “Integrated Care Partnerships” (ICP)
• Reconfiguration of the hospital network to ensure safe, resilient and quality services into the future
• Greater personal choice and control for patients
• Greater use of technology
• Increased involvement and role for the independent, voluntary and community sectors.
4.3.7. The report used a series of case studies to illustrate the future care model. One of the case studies was for “Older People” which focused on a more joined up assessment of needs and more control over an individual's own budget.
4.3.8. The review proposed a model of health and social care which would drive the future shape and direction of the service and puts the individual at the centre with services becoming increasingly accessible in local areas. The proposed model is set out in figure 5.
TYC model of health & social care Source: Department of Health, Social Services and Public Safety, Transforming Your Care website
4.3.9. The main sections of the proposals impacting on adult social care were “adult people” and “palliative and end of life care”.
4.3.10. Under “older people” the main recommendations were:
• Home as the hub of care for older people, with more services provided at home and in the community
• A major reduction in residential accommodation for older people, over the next five years
• Introduction of reablement to encourage independence and help avoid unnecessary admissions of older people into hospital
• A greater role for nursing home care in avoiding hospital admissions
• More community-based step-up/step-down and respite care, provided largely by the independent sector
• A focus on promoting healthy ageing, individual resilience and independence
• More integrated planning and delivery of support for older people, with joined up services and budgets in health and social care, and pilots to explore budgetary integration beyond health and social care
• A holistic and consistent approach to assessment of older people's needs across NI and an equitable range of services
• A diverse choice of provision to meet the needs of older people, with appropriate regulation and safeguards to ensure quality and protect the vulnerable
• Personalised care designed to deliver the outcomes care users and their families want, with increasing control over budgets, and access to advocacy and support if needed
• A policy review of carers’ assessments and more practical support for carers including improved access to respite provision
• An overhauled financial model for procuring independent and statutory care, including exploring the potential for a price regulator, a certificate of need scheme and financial bonds for new entrants.
4.3.11. Under “palliative and end of life care” the main recommendations were the development of a register to enable speedy transfer of information required to those providing such care, enhanced support to the nursing home sector for end of life care, individual assessment, planning, delivery and co-ordination of end of life care needs by a key worker, electronic patient records, targets to reduce the level of inappropriate hospital admissions and people in the dying phase of an illness and palliative and end of life care for children considered as part of the proposed review of paediatric services.
4.3.12. The Strategic Implementation Plan (SIP) describes a planned approach for the delivery of the 99 TYC recommendations over the next three years. The SIP provides a coherent, controlled and managed framework which brings existing programmes together and adds new ones in a well-integrated way. The draft was issued in June 2012 and the consultation will be published in September 2012.
4.4. Scotland
4.4.1. Demographics
4.4.1.1. Scotland has similar demographics to the rest of the UK. In 2010, Scotland had an end-year population of 5.2 million, age 65+ represented 16.8% of the total population and age 75+ represented 7.8% of the total population.
4.4.1.2. In 2035, Scotland's projected population is 5.75 million, projected age 65+ is 24.9% of the total population and projected age 75+ is 12.8% of the total population.
4.4.2. Public Systems
4.4.2.1. Scotland has a similar structure to the funding of care to the rest of the UK apart from an entitlement for over 65's to get free personal care and all ages to get free nursing care, if found eligible after a care assessment.
4.4.2.2. Means Testing for permanent residents of care homes – the capital test
4.4.2.2.1. The means testing is very similar to the test within England. If an individual has capital above £24,750 they are deemed to be able to pay the standard rate for care themselves out of this capital. If their capital is between £15,250 and £24,750 they make some individual contribution and below £15,250 they do not need to pay out of capital. An individual's home is taken into account in the assessment, but only if they were the sole owner living in it before they went into care, and only after they have been in care for 12 weeks. The value of the former home must be ignored for the purposes of the financial assessment the home continues to be lived in by one or more of the following - a spouse, civil partner or someone who lived with the individual as if they were married or civil partners, a relative who is aged 60 or over, a relative who is aged under 60 but is incapacitated, a child under the age of 16 whom the care home resident is liable to maintain a divorced or estranged partner, who is a lone parent with a dependent child.
4.4.2.3. The means testing for permanent residents of care homes – the income test
4.4.2.3.1. Generally pension income, from private or state sources, are included as income and will be assessed as being able to contribute towards the cost of care, including hotel costs. There is a complex assessment of pensions and savings credit that allows an individual to retain some of their savings. In addition, individuals are allowed to retain a Personal Expenses Allowance. The current rate from April 2012 is £23.50 per week and is increased annually in line with average earnings. This allowance is intended for personal items such personal toiletries, gifts for friends and family, stationery and other minor items.
4.4.2.4. The means testing for permanent residents of care homes – deferring the costs of residential care
4.4.2.4.1. Deferred payments were introduced in July 2002. They allow people to avoid selling their homes up-front to meet their care home fees by entering into a legal agreement to have part of their fees paid by their local authority and the balance settled from their estate. They are operated individually by local authorities, but the Scottish Government sets out a national framework from which they expect the local authority to operate the scheme. They can be used to cover the hotels costs of care and also top ups for a higher level of service than the council will provide.
4.4.2.5. Free Personal Care and Nursing Care - since July 2002 everyone aged 65 and over, regardless of income or assets, who are assessed as needing care in a care home are eligible to claim personal care payments, which contribute towards the cost of their care. People of any age, regardless of income or assets, who need nursing care, are eligible for nursing care payments. The amount the council pay towards care costs is currently (April 2012) £163 per week for personal care, £74 per week for nursing care and £237 to cover personal care and nursing care. The local councils only need to pay this personal and nursing care once an individual has made a contract with a care home. For a “self- funder” only personal and nursing care is paid by the local authority and they have to pay hotel costs themselves, whereas the local authority would make a contribution towards hotel costs for all those failing the means test.
4.4.2.6. Domiciliary care - individuals aged 65 and over can no longer be charged for personal care services provided in their own home. They can however be charged for domestic services such as help with shopping or housework but any charge would be subject to a financial assessment.
4.4.2.7. Public expenditure - in August 2012 the Scottish government released the latest figures of take up and expenditure on free personal and nursing care, fully covering up to the end of financial year 2010–11, with some limited statistics for 2011–12. The key relevant points of the report are as follows:
4.4.2.7.1. Care homes - there were just under 30,580 people aged 65 and over in care homes in 2011–12. This represents 3.5% of the population aged 65 and over. This number has gone down by around 1,300 since 2003–04. The number of people in Scotland receiving Free Personal Care and/or Free Nursing Care (FPNC) payments to help pay their Care Home fees increased steadily since its introduction in 2002. In 2011–12 there were nearly 9,700 people receiving Free Personal Care payments, compared 8,350 in 2003–04. This represent about a third of care home residents. Around two-thirds of people receiving the Free Personal Care payments also receive the Free Nursing Care payment (just over 6,000 residents in 2011–12). The remaining two thirds of residents in care homes are fully publicly funded. These residents contribute to their care home fees from their pensions and any other income they may have and the local authority funds the balance which will be greater than the free personal and/or nursing care payments received by self-funding residents. In 2010–11 net expenditure in care homes for older people was £626.8 m. Of this £85.3 m was spent on free personal care payments for self- funders, and £23.1 m on free nursing care for self- funders. This total on free personal and nursing care has risen from £86 m in 2003–04, out of a total of £429.8 m.
4.4.2.7.2. Home care - in 2010–11 there were 51,760 home care clients, representing 5.9% of the population aged 65 and over. Of these, 46,720 were receiving personal care services, around 5.3% of the aged 65 and over population. This has risen from 32,870 in 2003–04. As mentioned above, since July 2002, Local Authorities in Scotland can no longer charge for these services. This large increase in people receiving services in their own homes reflects an increasing older population and a move away from long-term care in hospital and care homes toward providing care in a person's own home for as long as possible. In addition to the increase in numbers receiving personal care at home, the average hours an individual receives has increased from 6.9 to 8.1 per week between 2003–04 and 2011–12. In 2010–11 net expenditure on home care services for individuals aged 65 and over was £406.7 m, with £342.1 m of this on personal care at home. This compares with a total in 2003–04 of £223.8, with £132.8 m on personal care. The Scottish government believes the more than doubling of spend on free personal care since its introduction is reflected in the shift away from care being provided in either care homes or hospitals towards more care being provided in peoples own homes. At the same time there has been an increase in the proportion of clients receiving personal care services as home and care workers are increasingly providing personal care services rather than domestic services.
4.4.2.8. Private systems - Scotland currently has the same insurance products as the rest of the UK, with Immediate Needs Annuities being the only actively sold products at this time. With the introduction of the free personal and nursing care top ups for individuals who have been assessed as self- funders it will be interesting to see if this has had an effect on the overall take up of INA's.
4.4.2.9. The future - like the rest of the UK, the Scottish Government recognises the ever spiralling cost of care, particularly with the projected aging population. It estimated that the spending on Health and social care would increase from a total of £4.5Billion in 2007–08, to £5.6Billion in 2016 from the effect of ageing alone. It therefore launched “Reshaping Care for Older People - A Programme for Change 2011–2021” which aimed to provide a long term and strategic approach to delivering change to achieve the government's vision for future care for older people in Scotland. Within the program document it was stated that additional resources to support care services “…might require the state to raise more money or to look at a range of options, and these options will be influenced by the UK Government's response to the recommendations of the Dilnot Commission in July 2011.”
4.4.2.10. Lessons learned – it is clear that the rest of the UK can learn a lot from the 10 years of experience of free provision of care to the elderly, as the rest of the UK has similar demographics and financial profile of individuals. In 2006, the University of Stirling commissioned a study of the lessons that could be learned from Scotland. Some of the main conclusions and comments were:
4.4.2.10.1. The introduction of free personal care did not reduce the level of informal caring
4.4.2.10.2. Differences between Scotland and the rest of the UK in the public costs of personal and nursing care are smaller than popularly assumed. In Scotland, residential clients no longer receive Attendance Allowance. In the rest of the UK, care home residents continue to receive Attendance Allowance and more generous provision for nursing care.
4.4.2.10.3. Free personal care can support clients’ wishes for person-centred care sensitive to individual needs.
4.4.2.10.4. Confusion about the care system remained widespread among clients.
4.4.2.10.5. A transfer of the free personal care policy from Scotland to the rest of the UK would not be a simple matter due to implications for other components of care provision.
4.4.2.11. Nevertheless, the Scottish policy offers wider lessons including its affordability in relation to overall public spending, its role as a catalyst in changing the balance of care towards care at home, the need for improved co-ordination of benefits and social care systems and the positive impact for clients, particularly those of modest means.
4.5. Wales
4.5.1. Social services and social care
4.5.1.1. Social services are delivered by 22 local authorities and around 1,800 private and independent organisations. They support 150,000 people covering adult and child care, support and advice, grants and community voluntary care.
4.5.1.2. The basis for the Welsh Government's Social Services and Social Care work is the 10 year strategy “Fulfilled Lives, Supportive Communities”, which covers 2008–2018. It outlines that local authorities are responsible for strategic planning, arranging the provision of services to meet needs, for undertaking assessments and care management for those who need help and support and for safeguarding vulnerable adults and children.
4.5.1.3. The strategy is intended to deliver social services that are strong, accessible accountable, in tune with citizens’ and communities’ needs and promote independence and social inclusion.
4.5.2. Adult social services
4.5.2.1. Social services currently supports around 100,000 adults
4.5.2.2. Responsibility is shared between central and local government. The local authorities have the statutory responsibility for the planning, assessment, commissioning and delivery of social services.
4.5.2.3. Social services authorities are required to assess people who might require community care services and to decide what, if any, services meet their needs. The services range from advice and counseling to care and support in their own homes, either residential, nursing care or elsewhere.
4.5.2.4. Informal carers provide about 70–80% of all the care provided, and small changes in their contribution and commitment could have far-reaching implications for the demand on formal care services. Recent changes in legislation have enhanced support for carers, and supporting them to continue in their caring role is a key new responsibility for social services.
4.5.2.5. Health Boards and local authorities have a joint statutory responsibility to produce the local Health, Social Care and Well-being Strategy. In support of this, social services departments work in partnership with the health bodies responsible for improving the health of their resident population in planning, commissioning and providing services.
4.5.2.6. An individual with both social care and health needs should be jointly assessed by health and social services professionals working together, and a joint care plan developed and delivered. It is particularly important that, where needed, general practitioners and community nurses are involved. There are legal powers allowing local authorities and the NHS to share budgets, provide joint services and delegate commissioning.
4.5.2.7. The overall aim is to encourage integrated planning, commissioning and delivery of services as well as to improve multi-disciplinary working, remove duplication and increase accountability.
4.5.3. Charging for social services
4.5.3.1. Residential care - under the National Assistance Act 1948 local authorities are required to arrange for the provision of residential care (in a residential home or a nursing home) to individuals assessed as requiring care and who meet the local authority's eligibility criteria.
4.5.3.1.1. Under the National Assistance Act 1948, local authorities are also required to charge for the accommodation and personal care they arrange. The aim is then to recover as much as possible the costs whether directly provided or with an independent home.
4.5.3.1.2. The Act also means that local authorities have the legal responsibility for commissioning the accommodation and personal care an individual requires. As a result, it is the responsibility of each local authority to determine the level of fees it will pay for this. The level of fees it will base upon a variety of factors; for example, the dependency needs of residents, location and facilities of the home and the operating costs of the home.
4.5.3.1.3. To ensure local authorities apply the principles of residential charging consistently, the Welsh Government has issued Charging for Residential Accommodation Guidance (CRAG). This sets out the basis on which authorities should make charges but does not set the level of those charges. Under the guidance, the contribution a person makes to their residential accommodation and personal care costs is assessed by taking account income (including most benefits and pensions) and capital (such as savings, investments and the value of any property owned). Each resident will therefore undergo a financial assessment by their local authority to calculate their financial means and the level of any charges to be made.
4.5.3.1.4. In undertaking this assessment, authorities will use a single capital limit set by the Welsh Government to determine the level of local authority financial support to which a resident may be entitled. Residents with capital over the capital limit are expected to meet the full cost of their accommodation and personal care from their own money. Residents who have capital below the capital limit receive maximum financial support from their authority and only contribute whatever income is considered appropriate by the financial assessment. The capital limit is set out in CRAG and reviewed in April each year.
4.5.3.1.5. When calculating a resident's charges local authorities must allow residents to keep an amount of their weekly income for their personal expenses, known as the Personal Expenses Allowance (PEA). The PEA is determined by the Welsh Government and set out in CRAG. It is increased in April each year.
4.5.3.2. Non-residential care - to receive such care a person must be assessed by their local authority to determine if there care needs meet the council's local eligibility criteria for services. The “Social Care Charges (Wales) Measure 2010” gives local councils a discretionary power to charge for these services. This became effective 11th April 2011. Where councils decide to charge adults for their non-residential social services certain arrangement must occur which include:
4.5.3.2.1. Councils must issue an invitation for a means assessment (a financial assessment) to those receiving services for the first time where it plans to make a charge. They must also issue an invitation to existing service users where it plans to alter a charge as a result of a change in the service they receive or in their finances;
4.5.3.2.2. Councils must undertake this assessment where service users request one and provide the information needed to do this;
4.5.3.2.3. Councils cannot charge for particular services. This includes transport to attend a day service, where attending this and transport to it are included in the agreed services to be provided;
4.5.3.2.4. Councils also cannot charge for providing information about their services or the charges they set for these. In addition, they cannot charge for undertaking assessments of care needs or means assessments;
4.5.3.2.5. In setting charges councils must allow service users to keep at least the amount of their Income Support, Employment and Support Allowance or Pension Credit Guarantee Credit plus 35% of that amount. They must also allow service users to keep a further 10% as a contribution towards their daily living costs which may be higher as a result of a disability or medical condition;
4.5.3.2.6. Councils must not take into account any money earned by a service user;
4.5.3.2.7. Councils cannot set charges that are more than £50 per week for all of the services a service user receives (except where they charge a flat rate for a service such as meals);
4.5.3.2.8. Councils must operate a scheme where service users can ask for charges set to be reviewed.
4.6. Discussion on how each country's system could apply to the UK (to be discussed at meeting on 22nd October)
4.6.1. Infrastructure:
4.6.1.1. How it would integrate with current LTC and healthcare provision
4.6.1.2. Readiness of private sector to fill gaps
4.6.1.3. Collection of publicly financed element
4.6.2. Cost:
4.6.2.1. Total Cost of public element ( now and in 20, 40 yrs etc) - build simple model of each countries system and apply to UK demographics
4.6.2.2. Total Cost of private provision - to show the size of market available for insurers
4.6.2.3. Cost to individuals - examples of cost an individual might make
4.6.3. Probability of success:
4.6.3.1. How ready/willing would government be to implement (without giving a political view)
5. Conclusions
5.1. Generic lessons
5.1.1. Shifting from a means-tested design to an insurance model appears to be workable and quite popular in some countries.
5.1.2. LTC costs are increasing more rapidly than expected in those nations that have adopted reforms; however, it has been manageable in most cases.
5.1.3. Reduce unnecessary hospitalisation for the elderly.
5.1.4. Aging populations with growing incidences of disabilities, looser family ties, and more two-worker households are all factors driving the increased demand for LTC. Countries around the world must develop more comprehensive strategies to address this multidimensional problem. It will require reframing existing challenges in a manner that facilitates progressive change to the roles of public and private resources and fosters more innovative approaches.
5.1.5. Countries with LTC programs that are funded primarily with public money might consider increasing public and private partnerships (through the use of private insurance or other risk-sharing arrangements). At the same time, all countries should continue to offer incentives and improve support to LTC providers and informal caregivers to ensure quality and access in the face of growing demand.
5.1.6 Graph 9 indicates that financial sustainability is the most important policy priority for LTC systems in the OECD.
Policy priorities for LTC systems in the OECD, 2009–10 Source: “Help Wanted? Providing and Paying for LTC”, OECD 2011
5.1.7. Table 5 summarises the universal LTC insurance schemes for three of the OECD countries studied in this paper.
Universal LTC insurance schemes in OECD countries
Source: “Help Wanted? Providing and Paying for LTC”, OECD 2011
5.2. Country specific
5.2.1. France
5.2.1.1. The strategy for the financing of care is set at a national level; however, the implementation of care is devolved to the local level, whilst ensuring a level of national consistency.
5.2.1.2. The public/individual partnership has introduced a growing insurance market as individuals have become more aware of their own obligations to share the cost of care and have looked to indemnify themselves form burdening costs.
5.2.1.3. An individual receives a sum of money from the public financing and is therefore empowered to make their own choices on the style and level of care they receive. This also gives the government an element of control as they can vary these payments to individuals and pass on a greater share to the individual should care costs spiral out of control.
5.2.1.4. In addition to the main care financing France has also introduced plans to tackle one specific cause of long term care need, Alzheimer's. The third Alzheimer plan was launched on 1 February 2008 by President Sarkozy, who pledged EUR 1.6 billion to the five-year programme. The original objectives were updated and integrated into four main activity groups - improve diagnosis, provide better treatment and support, provide help more effectively and speed up research. Included within this was a budget of over £1 Billion Euros to particularly tackle the care aspects.
5.2.2. Germany
5.2.2.1. It is possible to create a market where both public and private provisions operate on an insurance basis. The private market has grown because it is compulsory to have private insurance if you opt out of the state scheme.
5.2.2.2. Compulsory cover can still leave scope for discretionary products or top-ups to be developed.
5.2.2.3. Even with compulsory systems benefit and contribution levels need regular review.
5.2.3. Japan
5.2.3.1. Reducing the number of hospitalised elderly
5.2.3.2. Integrating medical care and long-term care
5.2.3.3. Even retired people contribute to it so it is not only the employees and employers.
5.2.4. Netherlands
5.2.4.1. One of the most important strengths of the system is that every resident of the Netherlands is insured against situations involving catastrophic expenses. This makes long-term care accessible for people who need it.
5.2.4.2. People do not have to save a large amount of money for LTC expenses, or spend down when they become care users, or fear they may become destitute in their old age.
5.2.4.3. Through AWBZ, the risks are shared between people who need a large amount of LTC over their lifetime and persons who need a small amount.
5.2.4.4. An important weakness in the system relates to the lack of incentive for efficiency, which has contributed to doubts over future sustainability.
5.2.5. US
5.2.5.1. Integration of the financing of acute and long-term care
5.2.5.2 Co-ordinating comprehensive and patient-centric care.
6. Glossary/Abbreviations
Activities of daily living (ADL) – include washing, dressing, mobility, toileting, feeding and transferring. Often they are referred to as “personal care”.
CLASS Act – Community Living Assistance and Support Systems
CRAG – Charging for Residential Accommodation Guidance (Wales)
Custodial, personal, social care – assistance with activities of daily living
Deferred period – also referred to as an elimination period. It's the period of time and individual needs to pay for their own LTC before the insurance benefits commence.
Formal care – includes all care services that are provided in the context of formal employment regulations, such as through contracted services, by contracted paid care workers, declared to social security systems.
FNPC – Free Personal Care and/or Free Nursing Care
GAD – Government Actuaries Department
Informal carers – is used often to refer to family carers, but strictly speaking this category also includes “paid” caregivers who are undeclared to social security and therefor work outside the context of formal employment regulations.
ICP - Integrated Care Partnerships
Institutional care - nursing home/residential care
Instrumental activities of daily living – include help with housework, meals, shopping and transportation. They can also be referred to as “domestic care or home help”.
Long-term care (LTC) – in the main refers to the support provided to the elderly as they lose the ability to look after themselves. It is a combination of medical, nursing, custodial, social and community services designed to help people who have disabilities or chronic care needs, including dementia. Services may be provided in the person's own home (i.e. domiciliary), in the community, in assisted living facilities or in care homes.
Non-institutional care = home care
PEA - Personal expense allowance
POC - Programmes of care
PHA - Public Health Agency
SIP – Strategic Implementation Plan (NI)
Skilled care = qualified nursing care TYC – Transforming Your Care (NI)
7. References
Global data sources
American Academy of Actuaries, Contingencies
CIA: The World Factbook
OECD Health Data
OECD Health System Accounts
PECD – “Help Wanted? Providing and Paying for LTC”
The SCAN Foundation
The World Bank Group
WDI Online
World Health Reports
Country specific data sources
France
• INSEE, Government of France. “Bilan démographique 2010”. http://www.insee.fr/fr/themes/document.asp?ref_id=ip1332#inter1
• Eurostat, the statistical office of the European Union –”Health in the EU27 in 2010” http://epp.eurostat.ec.europa.eu/cache/ITY_PUBLIC/3-19042012-AP/EN/3-19042012-AP-EN.PDF
• OECD: Help Wanted? Providing and Paying for Long-Term Care. http://www.oecd.org/els/healthpoliciesanddata/helpwantedprovidingandpayingforlong-termcare.htm
• http://www.alzheimer-europe.org/Policy-in-Practice2/National-Dementia-Plans/France#fragment-1
Germany
• Federation of Private Health Insurance (PKV)
Japan
• MOHLW
• Statistics of Life Insurance in Japan
Netherlands
• ANCIEN – The Dutch System of LTC – Esther Mot, Ali Aouragh, Marieke de Groot, Hein Mannaerts, CPD Netherlands Bureau for Economic Policy Analysis
• Programme letter, concerning LTC – the State Secretary for Health, Welfare and Sport (1 June 2011)
United Kingdom
England
Law Commission – “Adult Social Care” (May 2011)
Dilnot Commission – “Fairer Care Funding” (July 2011)
Commons Health Select Committee – “Inquiry into social care” (September 2011)
Department of Health – “Caring for our future” engagement (September 2011)
Commons Health Select Committee – “14th report on social care” (February 2012)
“The Actuary”, May 2012, Social Care Reform – A Year in Review (by Sue Elliott)
The White Paper – “Caring for our future: reforming care and support” (July 2012)
Draft Care and Support Bill (July 2012)
Caring for our future: progress report on funding (July 2012)
Northern Ireland
DHSSPS (NI) website – TYC
DHSSPS (NI) website - SIP
Scotland
Free Personal and Nursing Care Scotland 2010–11 http://www.scotland.gov.uk/Resource/0039/00399515.pdf
Age Scotland Factsheet 10s: Council charging procedures for care homes http://www.ageuk.org.uk/PageFiles/18187/Factsheet%2010s%20-%20Council%20charging%20procedures%20for%20care%20homes.pdf
Age Scotland Factsheet 46s: Paying for care and support at home http://www.ageuk.org.uk/PageFiles/18187/Factsheet%2046s%20-%20Paying%20for%20care%20and%20support%20at%20home.pdf
DEFERRED PAYMENTS AND OTHER FUNDING ARRANGEMENTS WHICH ALLOW CARE HOME RESIDENTS TO DELAY SELLING THEIR HOMES http://www.sehd.scot.nhs.uk/publications/CC2004_13.pdf
Reshaping Care for Older People - A Programme for Change 2011 – 2021 http://www.scotland.gov.uk/Resource/0039/00398295.pdf
Lessons from the funding of long-term care in Scotland http://www.jrf.org.uk/sites/files/jrf/0036.pdf
Wales
Welsh Government website – Social Services and Social Care
United States
• The SCAN Foundation