INTRODUCTION
Sustainable agriculture requires rational management of nitrogen (N) fertilizer in crop production; the precise diagnosis of plant N status is vital for achieving this objective. Nevertheless, the traditional Kjeldahl method of determining leaf N content is time-consuming, costly and complicated (Wolf Reference Wolf1982), which limits its wide application. The chlorophyll (Chl) content of plant leaves is closely related to leaf N content because photosynthetic apparatus accounts for more than half of the N in a leaf (Evans Reference Evans1989). Therefore, several sensor-based devices have been introduced during the past few decades to determine plant N status in situ through estimating leaf Chl content. These sensors measure transmittance of light through leaf tissues at two wavelengths (Chl meters such as SPAD, CCM, etc.), or light reflected by the leaf surface (Greenseek, Yara N-Sensor, etc.) (Berntsen et al. Reference Berntsen, Thomsen, Schelde, Hansen, Knudsen, Broge, Hougaard and Hørfarter2006; Samborski et al. Reference Samborski, Tremblay and Fallon2009). Among these, SPAD has been the most commonly used tool for plant N status diagnosis. Site-specific nutrient management (SSNM) was developed by the International Rice Research Institute (IRRI) and has been used to improve N use efficiency since 1997 (Peng et al. Reference Peng, Buresh, Huang, Zhong, Zou, Yang, Wang, Liu, Hu, Tang, Cui, Zhang, Dobermann, Lichtfouse, Hamelin, Navarrete and Debaeke2011). At present, the N requirement of rice N is usually determined by averaging 30 SPAD readings from the uppermost leaves in a plot, and N rate is then adjusted accordingly (Huang et al. Reference Huang, He, Cui, Buresh, Xu, Gong and Peng2008). However, leaf position procedure may affect the result and a large number of measurements are required to ensure accuracy.
In addition, plant N content could also be estimated using leaf polyphenolics (Phen), which are a wide range of molecules with a phenolic chemical structure concentrated in the epidermal layers. Under N deficiency, the carbon-nutrient balance hypothesis (CNBH) (Bryant et al. Reference Bryant, Chapin and Klein1983) forecasts that carbohydrates will accumulate in plant tissues, and the increase in carbohydrate content will stimulate synthesis of carbon-based secondary metabolites such as Phen and terpenes (Hamilton et al. Reference Hamilton, Zangerl, DeLucia and Bernebaum2001). Jones & Hartley (Reference Jones and Hartley1999) generated a protein competition model (PCM), which indicated that the amino acid phenylalanine is a joint precursor for protein (N-based) and Phen (C-based) synthesis, so under N deficiency, the rate of protein synthesis declines as the rate of Phen synthesis increases. Therefore, measurements of Phen, as well as Chl, could be promising methods for assessing plant N status and may reveal more ecophysiolgical information about the plant.
The previous techniques based on light absorbance or reflectance could not measure Phen, but strategies have recently been proposed for synchronous estimation of Chl and Phen contents in leaves, based on the measurement of Chl fluorescence (ChlF) (Tremblay et al. Reference Tremblay, Wang and Cerovic2012). Leaf Phen has typical ultra-violet (UV) absorption maxima in the UV-A and UV-B regions (Cerovic et al. Reference Cerovic, Ounis, Cartelat, Latouche, Goulas, Meyer and Moya2002), and most UV radiation is absorbed by Phen in the epidermis, while visible radiation arriving at chloroplasts in the mesophyll is almost unattenuated (Krause et al. Reference Krause, Gallé, Gademann and Winter2003). Therefore, accumulation of Phen in the epidermis will reduce ChlF under UV beam excitation, without affecting the ChlF under visible beam excitation. By comparing the ChlF under both wavelengths, the Phen content in leaf can be assessed optically (Barthod et al. Reference Barthod, Cerovic and Epron2007).
A series of commercial fluorimeters measuring emission of fluorescence have been developed, including Dualex® and the latest Multiplex® (FORCE-A, France) series (Tremblay et al. Reference Tremblay, Wang and Cerovic2012). Dualex® assesses Phen content by measuring far-red fluorescence (FRF) under UV (375 nm) and red (650 nm) light excitation (Goulas et al. Reference Goulas, Cerovic, Cartelat and Moya2004). Compared with the use of SPAD only readings, the ratio of SPAD to Dualex® has been confirmed as a more precise indicator for crop N deficiency, because Chl and Phen are inversely dependent on crop N (Cartelat et al. Reference Cartelat, Cerovic, Goulas, Meyer, Lelarge, Prioul, Barbottin, Jeuffroy, Gate, Agati and Moya2005; Tremblay et al. Reference Tremblay, Wang and Bélec2010). Dualex® readings could also be applied to screening and predicting plant susceptibility to pathogens (Agati et al. Reference Agati, Cerovic, Marta, Di Stefano, Pinelli, Traversi and Orlandini2008).
Multiplex® is a proximal optical instrument based on light-emitting diodes (LEDs) excitation and filtered-photodiodes detection (Tremblay et al. Reference Tremblay, Wang and Cerovic2012). Through measuring fluorescence emission, multiple parameters are calculated to assess the content of Chl, several families of Phen including flavonoids (FLAV) and anthocyanins (ANTH) (Lejealle et al. Reference Lejealle, Evain, Cerovic and Khosla2010; Tuccio et al. Reference Tuccio, Remorini, Pinelli, Fierini, Tonutti, Scalabrelli and Agati2011). Unlike SPAD or Dualex®, obtaining readings merely at one point of a single leaf, Multiplex® carries out measurements based on the entire crop canopy, which will greatly improve efficiency and accuracy in field research. Hitherto, only limited related research has been conducted (Zhang & Tremblay Reference Zhang, Tremblay and Khosla2010), and more detailed work needs to be performed.
In the present paper, a field study was conducted with rice at two densities and treated with six different N rates. The aim was to determine the influence of N fertilization on rice leaf fluorescence emission, and to attempt evaluation and selection of more suitable fluorescence-based indices for the precise assessment of rice canopy N status.
MATERIALS AND METHODS
Multiplex® sensor
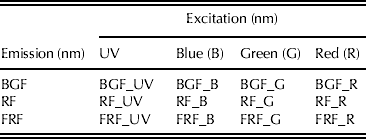
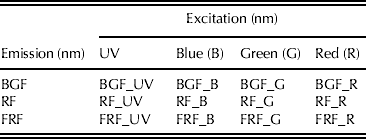
A Multiplex® 3 (FORCE-A, Orsay, France) was used in the present study. It was equipped with light sources (LED) of four wavelengths for exciting fluorescence: UV (375 nm), blue (470 nm, B), green (530 nm, G) and red (630 nm, R) and three filtered synchronized detectors for fluorescence recording: blue–green fluorescence (447 nm, BGF), red fluorescence (685 nm, RF) and far-red fluorescence (735 nm, FRF) (Ghozlen et al. Reference Ghozlen, Cerovic, Germain, Toutain and Latouche2010; Tremblay et al. Reference Tremblay, Wang and Cerovic2012). A total of 12 fluorescence emissions can be recorded by the instrument (Table 1). The following indices were used to assess plant N status:
 $${\rm SFR}\_{\rm R}\ ({\rm Simple}\ {\rm fluore} {\rm scence} \ {\rm ratio}) = {\rm FRF} {\hbox {-}} {\rm R}/{\rm RF} {\hbox {-}} {\rm R}$$
 $${\rm FLAV}\; ({\rm Flavonoid}) = {\rm Log}_{{\rm 1}0} \,({\rm FRF} {\hbox {-}} {\rm R}/{\rm FRF} {\hbox {-}} {\rm UV})$$
 $${\rm NBI}\_{\rm R} \; ({\rm Nitrogen}\;{\rm balance}\;{\rm index}) = {\rm FRF} {\hbox {-}} {\rm UV}/{\rm RF} {\hbox {-}} {\rm R}$$
Simple fluorescence ratio reflects leaf Chl content based on re-absorption of Chl fluorescence (Gitelson et al. Reference Gitelson, Buschmann and Lichtenthaler1999), FLAV is the logarithmic ratio of FRF-R/FRF-UV, which reflects flavonoid content and NBI_R is the Chl-to-flavonoid ratio computed by the ratio of FRF_UV/RF_R.
Nomenclature of Multiplex® signals
Field experiment
A field experiment was conducted with a completely randomized split plot design in Liantang Town, Qingpu district of Shanghai, China (121°00′N, 30°58′E, 3 m asl), during 2011. Seedlings of rice (O. sativa L.) cvar Xiushui 28 with five fully expanded leaves were transplanted into plots (4 × 5 m) on 28 June. Treatments were arranged in a completely randomized split-plot design with three replications. The main plot treatments were N application rates of 0, 75, 150, 225, 300 and 375 kg N/ha (applied as urea), with sub-plot treatments being two hill densities of 200 × 150 mm and 200 × 100 mm. Superphosphate (225 kg/ha) and potassium chloride (75 kg/ha) were incorporated into each plot on the day of transplanting and another 75 kg potassium chloride/ha was top-dressed 40 days after transplanting (DAT). Each rate of N was applied in four doses at the following rice growing stages: 0·2 of the N dose on 3 July (plant reviving), 0·3 on 10 July (tillering), 0·3 on 6 August (panicle initiation) and the final 0·2 of the N dose on 30 August (grain filling). The paddy field had loam soil with organic matter content of 40·50 g/kg and total N of 2·13 g/kg.
Single leaf fluorescence emission of leaf adaxial and abaxial sides
The Multiplex® 3 illuminates an 80-mm diameter area in which fluorescence emission is sensed. On 3 August, 65 of the uppermost leaf blades were randomly chosen, cut into pieces and laid on a black metal plate, firstly with leaf adaxial and then abaxial sides facing the Multiplex® sensors. The fluorescence emissions of the two sides were recorded separately.
Extraction of phenolic compounds
On 15 August, the uppermost leaves with sheaths were removed and the fluorescence emission of the adaxial side was recorded immediately prior to storing samples in an icebox at 4 °C. After freeze-drying, all samples were ground in a mortar and passed through a 0·5 mm sieve. Phenolic compounds were extracted according to Barthod et al. (Reference Barthod, Cerovic and Epron2007). Briefly, the leaf powder was extracted with 8 ml of a mixture containing methanol and chloroform (2/2, v/v). Samples were vortexed and kept for c. 30 min for complete solvent extraction. The addition of 2 ml water into the methanol/chloroform mixture produced a chloroform phase containing chlorophylls and carotenoids, and a methanol/water phase on the top containing the soluble Phen compounds. The methanol/water phase was collected with a Pasteur pipette and filtered through syringe filters.
Absorbance spectra (250–400 nm)
Absorbance of 10-fold-diluted leaf extracts were scanned from 250 to 400 nm (UV-2401PC, Shimadzu, Japan). UV absorbance values at 305 and 375 nm (A305 and A375), were also used to measure soluble phenolic compounds absorbing in the UV-B and UV-A spectral region, respectively (Barthod et al. Reference Barthod, Cerovic and Epron2007).
Quantification of total Phen content
Total soluble Phen content was determined using the Folin–Ciocalteu assay (Barthod et al. Reference Barthod, Cerovic and Epron2007): 475 μl of 0·25 N Folin–Ciocalteu reagents (Shanghai Labaide Biotechnology Co. Ltd., Shanghai, China) and 475 μl of a 7% sodium carbonate solution were added to 50 μl of the sample and the mixture was kept for 15 min. Detection of total phenolic compounds was performed at absorbance maxima (755 nm). Phenolic content was standardized against coumaric acid (Barthod et al. Reference Barthod, Cerovic and Epron2007).
Determination of Chl content
On 22 August, 65 of the uppermost leaves in each plot were taken randomly and the fluorescence emission was measured. The Chl was extracted by 96% (V/V) ethanol and total Chl contents were determined by measuring absorbance at 649 and 665 nm (Fritschi & Ray Reference Fritschi and Ray2007).
Canopy Multiplex® and SPAD reading
From 25 DAT, ten hills (a rice hill is composed of two rice seedlings transplanted at one spot) in a plot were chosen randomly and the canopy fluorescence emission was recorded at intervals of c. 12 days by placing the leaves between the device and a black metal plate so as to ensure that the blades were fully flattened and the leaves covered the measuring surface of the Multiplex® completely. Then a SPAD-502 (Konica Minolta, Japan) was used to assess canopy N status. A minimum of ten SPAD readings were taken at the middle of leaf blades and averaged to assess rice N status. On 10 August, one or two hills per plot were chosen at random to determine the canopy's SPAD reading (15 replicates) and fluorescence emission (five replicates). The hills measured were harvested and the leaves dried at 70 °C till constant weight. After grinding into powder and passing through a 0·5 mm sieve, leaf N contents were determined by an elemental analyser (Vario EL III, Germany) with duplicate samples.
Statistical analysis
SPAD and FLAV values of rice plant with different densities were compared by Pair-Sample t test.
RESULTS
Rice leaf FLAV of adaxial and abaxial sides
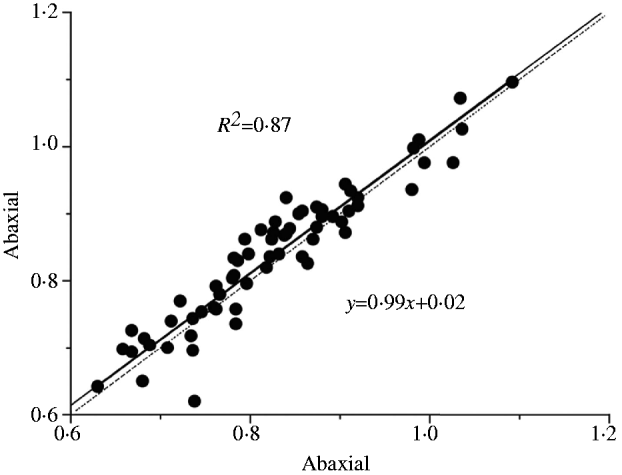
Flavonoid content of the adaxial and abaxial sides of the uppermost leaves were highly related (Fig. 1), with the linear regression of abaxial FLAV on adaxial FLAV being: y = 0·99x + 0·02 (R 2 = 0·87, P < 0·01). It is evident that the FLAV of both sides were similar. This was inconsistent with the results reported by Barthod et al. (Reference Barthod, Cerovic and Epron2007), who measured UV absorbencies of trees, including Acer platanoides L. and Fraxinus excelsior L., by Dualex® and found that the Dualex®-derived UV absorbance of the adaxial side was higher than that of the abaxial side. Since the FLAV of both sides of the rice leaves in the present study were the same, only the fluorescence emissions of the adaxial leaf side were recorded.
Linear relationship between the FLAV (Log10(FRF-R/FRF-UV)) of adaxial and abaxial surfaces of rice leaves. n = 65, P < 0·01. Solid line was linear regression of abaxial FLAV on adaxial FLAV.

Relationship between UV absorbance of phenolic compounds with fluorescence emission
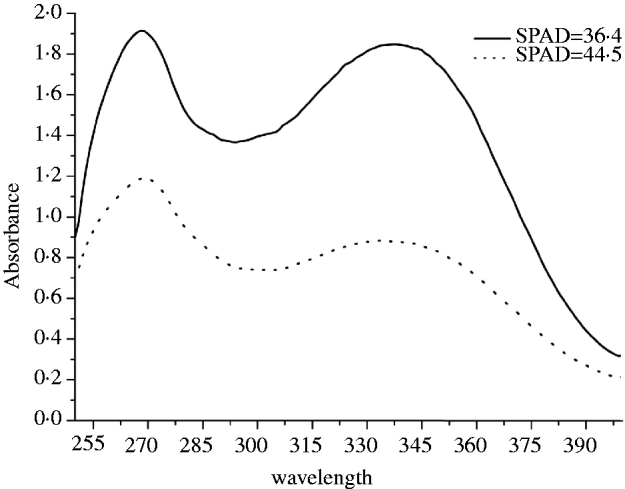
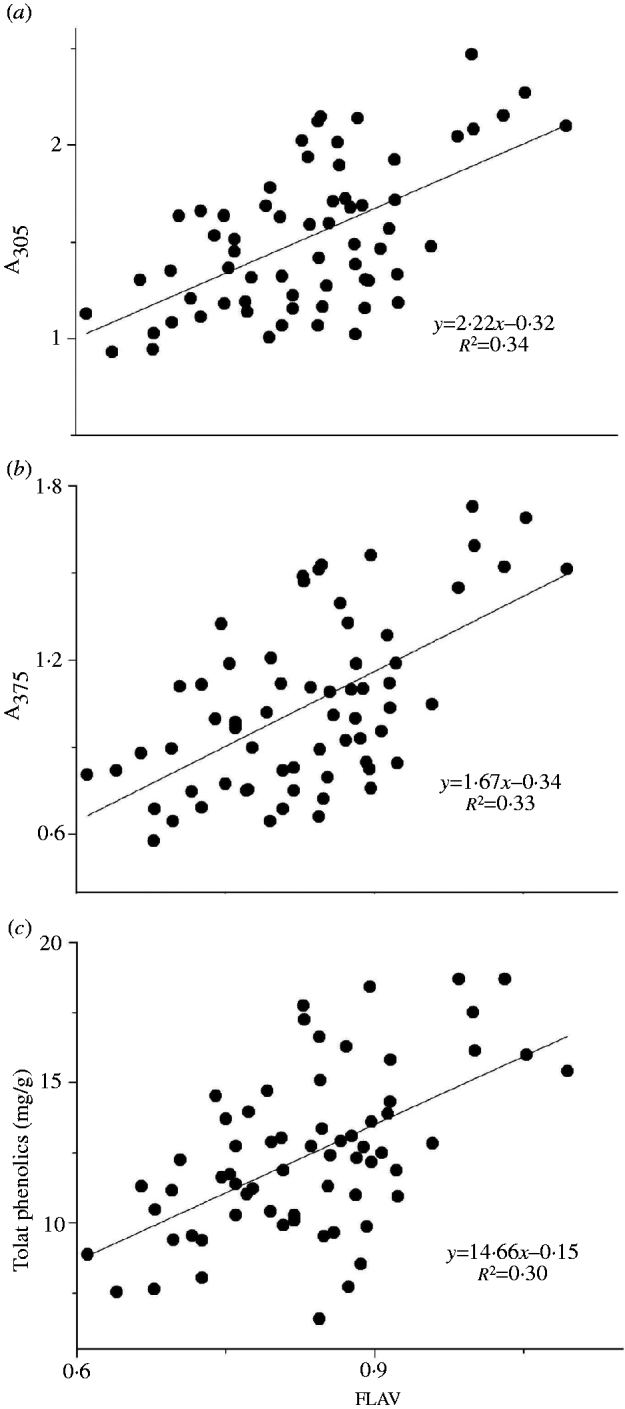
The absorbance spectra of rice leaves with different Chl contents exhibited two distinguishable maxima at c. 268 and 338 nm (Fig. 2). It was found that leaf containing more Chl had lower UV absorbance, and leaf extracts had higher absorbance in the UV-B than the UV-A region. There were significant correlations between FLAV and leaf absorbance at 305 and 375 nm (R 2 = 0·34, 0·33, respectively, P < 0·01) (Figs 3a and b), with the slope of regression for A305 (absorbance at 305 nm) on FLAV being significantly higher than that of A375 (absorbance at 375 nm) on FLAV (P < 0·01). Moreover, FLAV was significantly related to contents of total phenolic compounds in leaves (R 2 = 0·30, P < 0·01).
UV absorbance of rice (O. sativa L.) leaves with different Chl content (SPAD unit). n = 5.
Linear relationships between FLAV (Log10(FRF-R/FRF-UV)) of Multiplex® and absorbance of leaf extract at (a) 305 nm (A305) and (b) 375 nm (A375) and (c) total leaf phenolic content. n = 65, P < 0·01.
Relationship between SFR_R and Chl content
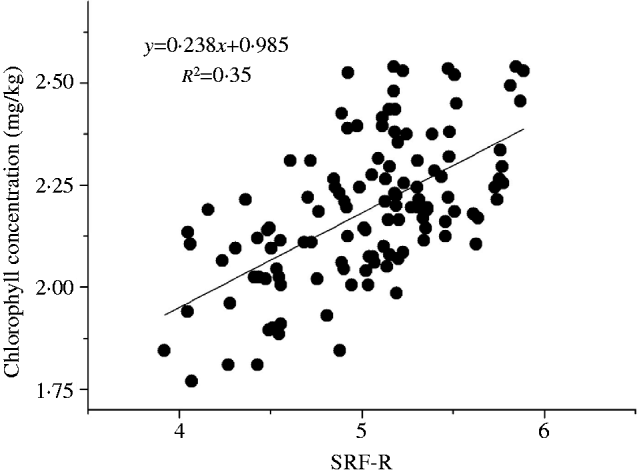
Chl content could be predicted by the simple fluorescence ratio under red light excitation (SFR_R), but the accuracy was lower (Fig. 4, y = 0·238x + 0·985, R 2 = 0·35, P < 0·01). There was no significant relationship between SFR-G and Chl content (data not shown).
Linear relationship between SFR-R (FRF-R/RF-R) and Chl content. y = 0·238x + 0·985, R 2 = 0·35, P < 0·01 n = 120.
The effects of plant densities on rice SPAD and FLAV values under different N rates
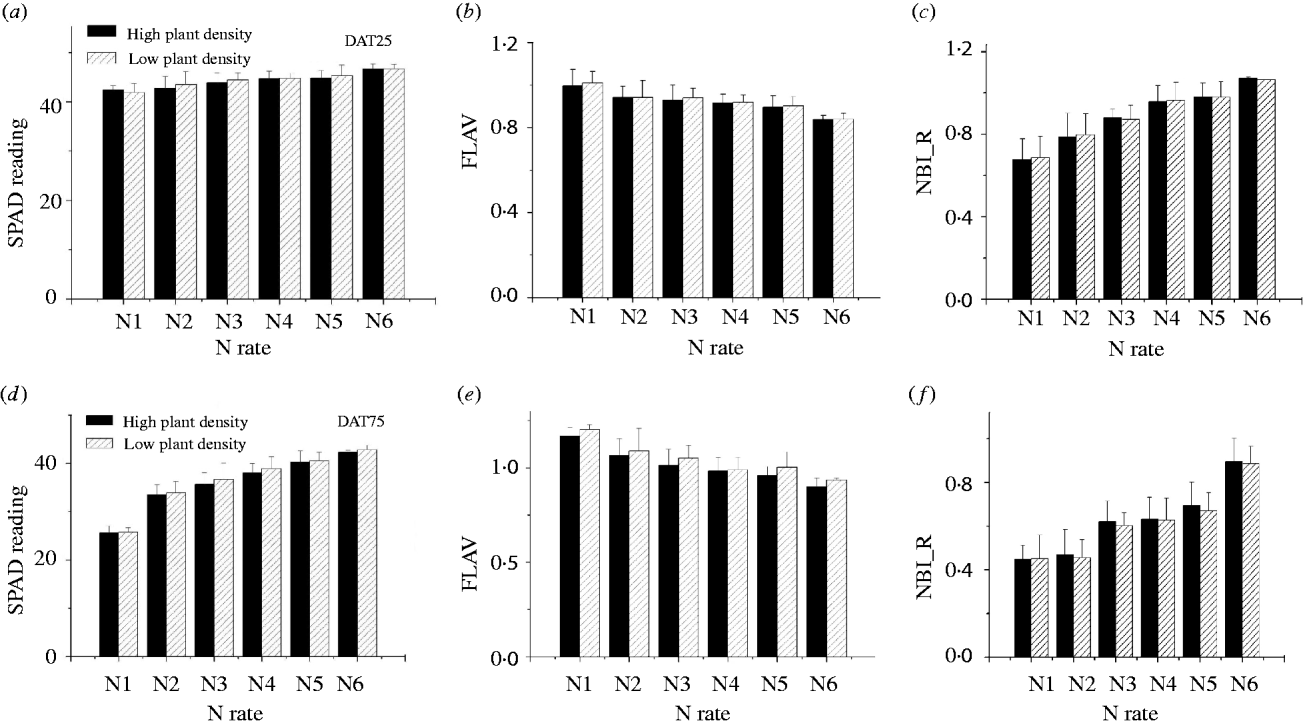
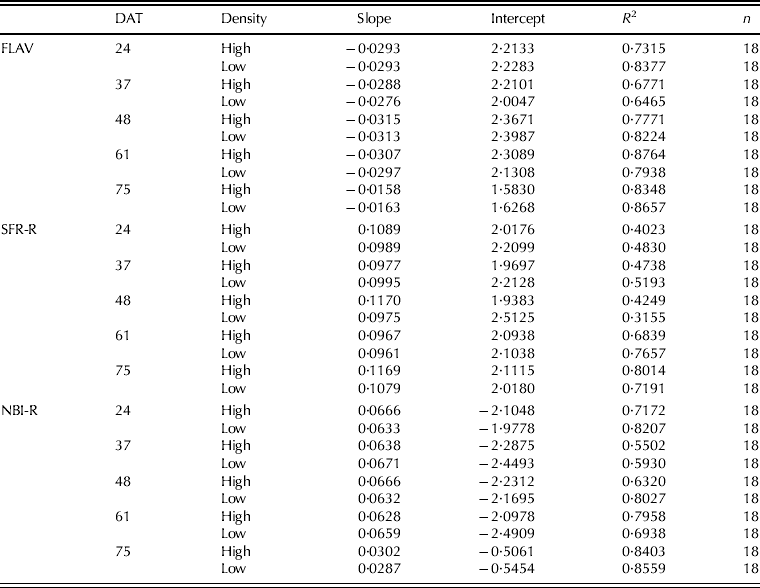
At 24 and 75 DAT, the SPAD readings and NBI_R of the rice canopy increased whereas FLAV values decreased with N top dressing (Fig. 5). A paired-sample t test indicated that at 24 DAT, plant density did not affect the SPAD, FLAV or NBI_R values significantly, but at 75 DAT both SPAD and FLAV of rice plants at high densities were significantly lower than those of plants at lower densities (P < 0·05), whereas NBI_R were significantly higher (P < 0·05) .
Canopy average SPAD, FLAV (Log10(FRF-R/FRF-UV)) and NBI_R (FRF-UV/RF-R) of rice with two plant densities under six N rates. Data were measured at 24 (a–c) and 75 DAT (d–f) respectively. Each bar was an average of 60 data. The vertical line represents the standard deviation (s.d.).
The temporal dynamics of fluorescence emission and SPAD values under different N rates
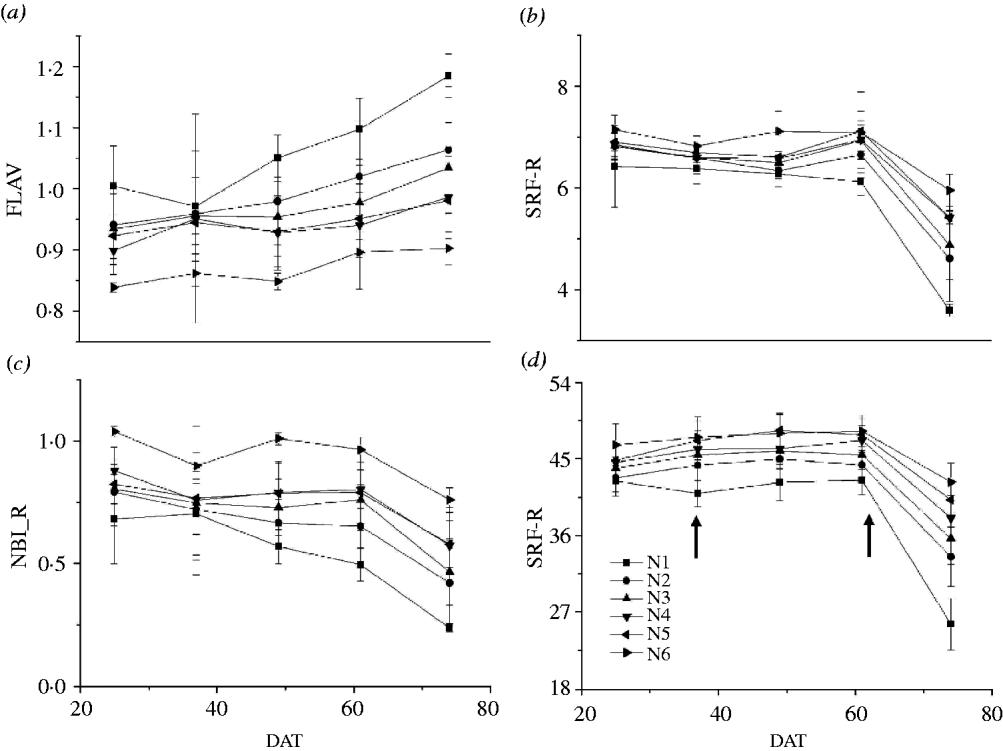
There were c. 17 leaves in total on effective stem tillers of Xiushui 28. At 55 DAT, nearly all leaves grew out and no further leaves appeared. Application of N significantly changed FLAV SFR_R, NBI_R and SPAD readings, but did not change their dynamic trends (Fig. 6). With increasing N rate, FLAV was reduced dramatically, but it was also found that from 60 DAT the FLAV values increased gradually as the canopy aged (Fig. 6a). The SFR_R was improved by N application (Fig. 6b), but decreased significantly from 70 DAT. The NBI_R and SPAD values performed in the same manner as SFR_R (Figs 6c and d).
The dynamics of (a) FLAV (Log10(FRF-R/FRF-UV)), (b) SFR-R (FRF-R/RF-R), (c) NBI-R (FRF-UV/RF-R) and (d) SPAD of rice under different N application rates. Each datum was an average of 120 data. The arrows in Fig. 6(d) were fertilization times.
The relationship between leaf N content and fluorescence emission-based indices or SPAD readings, and the relationship between average fluorescence emission-based indices and SPAD reading of rice canopy
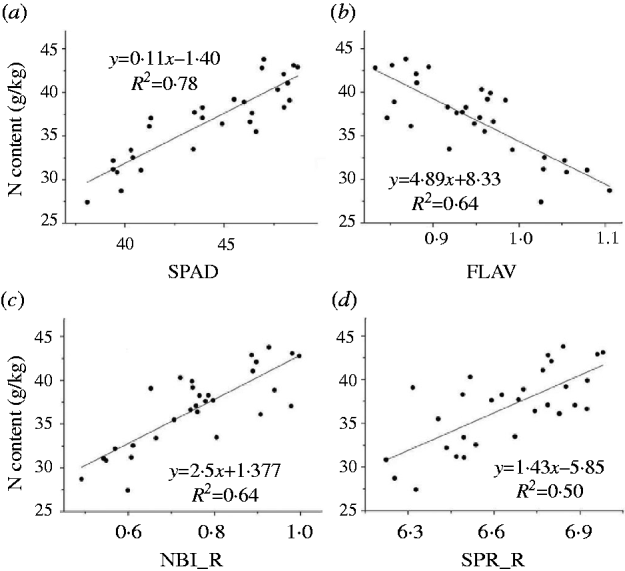
It was found that SPAD reading, FLAV NBI_R and SFR_R could all be used to indicate canopy N status (Figs 7a–d). The SPAD readings predicted the total canopy leaf N content precisely (Fig. 7a, R 2 = 0·78, P < 0·001), while FLAV was negatively related to N content and its accuracy was lower than SPAD reading (Fig. 7b, R 2 = 0·64, P < 0·001) and equal to that of NBI_R (Fig. 7c, R 2 = 0·64, P < 0·001). The SFR_R predicted N status with relatively lower accuracy than the rest (Fig. 7d, R 2 = 0·50, P < 0·001). However, FLAV, SFR_R and NBI_R were all significantly related to SPAD values at each stage (Table 2): FLAV was negatively related to SPAD readings, whereas NBI_R and SFR_R were positively related.
Linear relationship between (a) SPAD, (b) FLAV, (c) NBI_R, (d) SFR_R and leaf N content. n = 30, P < 0·01. The regression equations were: y = 0·11x–1·40, R 2 = 0·78, P < 0·01; y = 4·89x + 8·33, R 2 = 0·64, P < 0·01; y = 2·5x + 1·77, R 2 = 0·64, P < 0·01; y = 1·43x–5·85, R 2 = 0·50, P < 0·01.
Slopes and intercepts of linear regressions of canopy average FLAV, SFR-R and NBI-R on SPAD. Each datum was an average of 10 data
DISCUSSION
The similarity of FLAV obtained from leaf adaxial and abaxial sides may be attributed to the relatively vertical aspect of the uppermost leaf blade of rice grown in a paddy field, since it has been reported that the content of phenolic compounds is related to light intensity (Barthod et al. Reference Barthod, Cerovic and Epron2007). The leaves of trees such as A. platanoides L. and F. excelsior L., studied by Barthod et al. (Reference Barthod, Cerovic and Epron2007), are horizontal. Therefore, the amount of solar irradiance captured by each side of leaves from these trees is different, whereas both sides of the rice leaf experience similar levels of light intensity. As a result, there are similar contents of phenolic compounds in both the adaxial and abaxial epidermis of the rice leaf.
Because of the UV-screening capacity of phenolic compounds in the epidermis, the phenolic compound content can be indicated by the intensity of far-red ChlF under UV (FRF-UV). The Multiplex®-derived FLAV could predict the rice leaf UV-screening capacity and total phenolic content, but its accuracy was somewhat poor compared with Dualex®-derived FLAV's, as seen by the greater accuracy achieved in UV-screening capacity and total phenolic compounds in F. excelsior L. and A. platanoides L. by Barthod et al. (Reference Barthod, Cerovic and Epron2007). One reason for this may be that depending on species and growing conditions, the different proportion between FLAV in the epidermis and total leaf phenols may contribute to different absorbance at 305 or 375 nm.
The regression slopes were much higher when FLAV was regressed against A305 than against A375. This was expected, since most of the UV-absorbing compounds have a much greater absorption in the UV-B region than in the UV-A. The present study confirmed the CNBH model, which states that if N is deficient the carbon-based metabolites, namely the phenolic compounds, increase (Bryant et al. Reference Bryant, Chapin and Klein1983). The higher SPAD and FLAV values at lower plant densities might be attributed to the higher photosynthetic photon flux density (PPFD) distributed in the canopy. It is well known that plants with higher PPFD will have higher N and phenolic compound contents (Barthod et al. Reference Barthod, Cerovic and Epron2007; Posada et al. Reference Posada, Lechowicz and Kitajima2009). Within an individual plant, the PPFD declines exponentially with cumulative leaf area index (LAI), resulting in strong gradients of PPFD within the canopy (Monsi & Saeki Reference Monsi and Saeki1953). With canopy development and the increase of LAI, the PPFD in the canopy of rice plants grown at higher densities gradually becomes less than the PPFD in canopies at lower plant densities. Therefore, for acclimating higher PPFD, rice leaves in low-density plants capturing more PPFD will have higher N and phenolic compound content. The higher NBI_R of crowded rice plants might be due to higher ratios of N to phenolic compounds in crowded rice plants.
Both SPAD reading and fluorescence emission-based indices can be used to predict rice leaf N content. The SPAD is the most commonly used tool for determining plant N status. It has been reported that the rice area-based N content (Na) at different rice growth stages could be precisely predicted by SPAD readings without being affected by leaf thickness (Li et al. Reference Li, Yang, Li, Fei, Guo, Ge and Chen2011). The fluorescence emission-based indices, including SFR_R, NBI_R and FLAV, were able to reflect the canopy N status from different perspectives, and they could be used as an accurate alternative to SPAD, as a new N-diagnosis tool.
As the NBI_R was able to reflect the dynamics of Chl and Phen simultaneously, it could be more sensitive to N application compared with the SPAD reading or FLAV (Lejealle et al. Reference Lejealle, Evain, Cerovic and Khosla2010). With SFR_R, the measuring principle is based on the Chl process of re-absorption of the emitted fluorescence at 690 nm; the fluorescence emission spectrum overlaps with the Chl absorption spectrum. Consequently, the re-absorption of Chl depends on the Chl density in the leaf (Tremblay et al. Reference Tremblay, Wang and Cerovic2012). However, SFR_R is also affected by environmental stress so it should be used with care to determine plant N status (Tremblay et al. Reference Tremblay, Wang and Cerovic2012). Disappointingly, the simple fluorescence ratio for green (SFR-G) does not seem suitable for the same role as SFR_R, which may be because of Chl's low absorbance in green light and weak RF and FRF under green excitation (data not presented).
In conclusion, fluorescence emission-based indices derived from Multiplex® could predict leaf Chl and Phen contents accurately and effectively. The FLAV of rice leaf adaxial and abaxial epidermis were almost identical. Comparing with the contact Dualex® or SPAD sensors operating with leaf clips, Multiplex® has the advantage of being able to assess plant N status at the canopy level. The fluorescence emission-based indices, including SFR_R, NBI_R and FLAV, could all be used to determine rice N status. The present study testifies that the usage of rice plant N status based on fluorescence emission will greatly benefit N management of paddy fields.
The research was funded by the National Public Benefit Research Foundation of China (grant no. 200903056), the Integration and Demonstration of Key Technologies of the Control of Non-point Pollution in Upper Reach of Huangpu River, (grant no. 0909391910500) and the Foundation of Key Laboratory of Urban Agriculture (South) (grant no. 10UA010).