Introduction
Efficient seed storage is a shared concern among the growing number of seed banks established for crop improvement or ex situ conservation. Gómez-Campo (Reference Gómez-Campo2006) recently considered how the seed storage container contributes to overall operating efficiency of a seed bank. Dr Gómez-Campo points out that seed bank operators seldom consider the container as an important factor in the outcome of seed storage experiments. However, container properties greatly affect seed interactions with the environment and the overall cost and success of seed banking operations. So, what criteria should seed bank operators consider when choosing containers?
There are numerous material properties and other considerations that contribute to the overall suitability of seed containers (Table 1). At our seed bank in Fort Collins, Colorado, USA, the electrical costs of running freezers are high, and we take exceptional measures to increase packing efficiency to optimize the use of limited freezer space. Thin, durable packaging that compresses around seeds minimizes void volume and increases our seed storage capacity by several fold. Moisture control is also an important consideration in our seed bank; however, the high elevation above sea-level (1525 m) and low ambient relative humidity [yearly average c. 35% relative humidity (RH)] at our location, as well as the low temperature at which we store seeds ( − 18°C), make moisture movement a less critical concern. Each seed bank must weigh the importance of various material properties, and then decide which type of container is best suited to accomplish the mission of cost-effective seed storage. Strategies are likely to vary among seed banks, depending on local conditions, resources and the time frame that seeds are expected to remain viable.
Properties of seed storage containers that affect overall operating efficiency

Gómez-Campo (Reference Gómez-Campo2006) points out that the rate that water enters (or leaves) a seed storage container is a critical factor determining seed longevity. Indeed, water flux can adversely affect seed moisture level, one of the critical determinants of seed longevity. Factors besides water content, such as storage temperature, also strongly influence seed life spans. The average longevity of about 50 years that we reported (Walters et al., Reference Walters, Wheeler and Grotenhuis2005) is a result of storage under refrigerated conditions (5°C), and reducing the storage temperature to − 18°C dramatically increases seed lifespans (Walters et al., Reference Walters, Wheeler and Stanwood2004). The type of container does not contribute to this improvement. Thus, we are at some odds with Dr Gómez-Campo's statement, ‘the main reason for the failure to maintain high germination rates is the widespread use of inadequate containers’ (Gómez-Campo, Reference Gómez-Campo2006).
Maximizing seed longevity requires precise control of seed moisture levels. Long-term experiments on the interaction of water content, temperature, RH and seed longevity will reveal exactly how much water should be within the seed container (e.g. Ellis, Reference Ellis1998; Engels and Engelmann, Reference Engels and Engelmann1998; Walters, Reference Walters1998a, Reference Waltersb; Walters and Engels, Reference Walters and Engels1998). Once water content is adjusted, the storage container serves as a moisture barrier to keep water that is in the seed from leaking out and water that is in the surroundings from leaking in. Several factors affect moisture flux into and out of seed containers. Gómez-Campo (Reference Gómez-Campo2006) alluded to two of these factors, namely the permeance of the container material to water and the surface area of leaks in the container, and more information about these factors is considered in this paper. Also important are the water vapour pressure inside and outside the container and the storage temperature. The study of pressure and temperature in air–water vapour mixtures is called psychrometrics, and a review of some of the basic principles will facilitate decisions about appropriate seed storage containers and various options to optimize efficiency.
Psychrometrics
There are two mechanisms by which water vapour passes through a water vapour barrier – diffusion and unrestricted flow through leaks. The rate of water diffusion or flux through the material (M), is classically described by

The rate of water flow through leaks (L) is described by

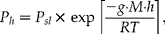
where Perm is the water permeance of the container (a performance factor described below); SA is the surface area of the container; and SAleak is the surface area of gaps, fractures or pinholes in the material or seam; VelT is the velocity of ‘still’ water movement at temperature T; and R is the universal gas constant (Harriman, Reference Harriman1990; Parsons, Reference Parsons1997). Water vapour in the surroundings and within the container is calculated from water partial pressure, which is a function of the air pressure at altitude (P h)Footnote 1, temperature (T, in Kelvin) and relative humidity (RH). The difference in water pressure inside and outside the container (ΔVP) is calculated from the RH difference and the vapour pressure of water at saturation (i.e. VP at 100% RH = VPsat), such that ΔVPsl = (RHout–RHin)÷100 × VPsat, where sl indicates the special case when elevation = 0 m above sea-level. The temperature dependency of VPsat is depicted graphically using psychrometric charts or calculated by a combination of theoretical and empirical modelsFootnote 2 (Table 2).
Saturation water vapour pressure (VPsat) at sea-level and different temperatures from a psychrometric chart (Harriman, Reference Harriman1990; Parsons, Reference Parsons1997; Wikipedia, 2007c, e). Values are given in mmHg or kPa for air over liquid water or ice. The relationships are also calculated using the Goff–Gratch and Clausius–Clapeyron equations using standard values for constants (Atkins, Reference Atkins1982; Parsons, Reference Parsons1997; Wikipedia, 2007b, d). The Clausius–Clapeyron model assumes constant heat of vaporization (over liquid water) or sublimation (over ice) and so is less accurate

Material permeance
Gómez-Campo (Reference Gómez-Campo2006) describes differences in water flux among containers and points out that there are different grades of polyethylene. Differences in performance of materials and containers are commonly expressed as the water vapour transmission rate (WVTR) (Harriman, Reference Harriman1990; Parsons, Reference Parsons1997)


where variables are as described in equations (1) and (2). In commercial applications, ΔVP is controlled by specific conditions (e.g. 38°C and 90% RH), and WVTR is expressed as the amount of water that crosses a barrier of known surface area in a specified time (e.g. g m− 2 d− 1). WVTR is the common parameter used to describe product specifications and quality assurance metrics for water barriers.
Permeance [Perm in equation (1)] is the vapour barrier performance of the material that modulates WVTR (Harriman, Reference Harriman1990; Parsons, Reference Parsons1997). Materials with high and low permeance equilibrate rapidly and slowly, respectively, with the surroundings. Analogous to the ‘R’ factor in thermal insulation tests, permeance has similar units to WVTR, except that it is expressed in terms of the difference in water vapour pressure on either side of the barrier (for example g m− 2 h− 1 kPa− 1). Permeance is calculated from the water vapour permeability (WVP) and the material thickness,

where t is thickness in appropriate units. Thus, permeance decreases (is less permeable) as the thickness of the material increases, and a better water vapour barrier can be created by simply making a container with thicker walls. WVP [expressed as perm-inch (US units) or perm-cm (metric units)] is an intrinsic property of the material and the basis for comparing resistance to water flow among specific film formulations: the lower the WVP, the greater the barrier to water diffusion. Table 3 is a compilation of WVP values calculated for thermal plastics and other materials (permeance of materials is usually measured at, or above, room temperature, and permeance at temperatures used for seed storage is largely unreported). Permeability among the listed materials differs by many orders of magnitude, with paper being among the most permeable materials (WVP = 0.46 g·cm m− 2 h− 1 kPa− 1), and metal foil and glass being virtually impermeable if there are no fractures or pinholes.
Water vapour permeability (WVP) of thermal plastics and other materials used for protective coatings or packaging. WVP is calculated based on material properties obtained from an Internet search ending on 26 February 2007. Units for WVP for all studies were converted to g·cm m−2 h−1 kPa−1, which expresses the mass of water (g) that diffuses through a barrier thickness (cm) over a specified surface area (m2) in a specified time (h) as a result of a specified water pressure difference (kPa). The conversions required to assemble Table 3 made assumptions to calculate g water (using STP if water flux was expressed in volume, and T and P were not specified) and ΔVP (use of equation (2) and Table 2; conversion of mmHg used 750 mmHg to 1 bar), temperature was assumed to be 25°C if not reported, and atmospheric pressure at sea-level. Materials are listed in order of decreasing permeability, and classified by comparison to air (essentially no barrier)

Composite packaging combines layers of materials with different properties (Table 1) to optimize performance. Water permeance of the composite is calculated by summing the reciprocal permeance of each layer:

where Permtot is the total permeance [Perm in equation (1)] and Permln is the permeance of each layern (Harriman, Reference Harriman1990; Parsons, Reference Parsons1997). For example, the total permeance of a trilaminate material composed of 0.003 cm layers of polyethylene terephthalate (PET, e.g. mylar) to resist puncturing, polytetrafluorethylene (PTFE, e.g. Teflon) to limit water permeation and low-density polyethylene (LDPE) to seal is 0.018 g m− 2 h− 1 kPa− 1, with all layers contributing some water barrier properties (Table 4, formulation A).
Calculated permeance of composite packaging materials

Container defects: pinholes, fractures and poor seals
No container is perfectly impermeable and so moisture will flow in or out until the system reaches equilibrium with the surroundings. Permeance describes permeation through a film or membrane [equation (1)]. Water also moves unimpeded through holes or openings, and the size of these leaks contributes directly to the effectiveness of a water vapour barrier [equation (2)].
Glass and metal are nearly impermeable to water (Table 3). However, these materials are brittle and subject to defects when they are formed into very thin layers. The relationship between thickness (t) of the metal foil or silica layer and the number and size of pinholes and fractures was used to derive an exponential relationship between thickness and surface area of holes (SAhole), such that

Empirical measurements found during internet searches (ending in April 2007) were used to calculate the coefficients a and b: − 3263 and 2.41 × 10− 5 m2, respectively, for aluminium foil and − 4536 and 7.09 × 10− 7 m2, respectively, for fused silica. Using this relationship and equating equations (1) and (2), ‘functional’ values for Perm [equation (1)] of foil and glass show that metal or silica layers just 100 nm thick offer superior resistance to water movement (Table 5).
‘Functional’ permeance values for thin aluminium and silica glass layers, based on the total surface area of pinholes and fractures produced during layer deposition. Permeance values will change during handling, as these materials are fragile

A lightweight product with excellent resistance to water flux can be produced by laminating a thin layer of foil with thermal plastics that have better flexibility and fusibility properties (Table 1). For example, at the National Center for Genetic Resources Preservation (NCGRP), we use a 4-ply pouch comprised of a 23 μm polyethylene terephthalate (PET) layer; a 20 μm layer of low-density polyethylene (LDPE); a 12 μm layer of aluminium; and a 95 μm layer of LDPE. Permeance for this composite package is tenfold greater than permeance calculated for the hypothetical composite described above [Table 4 (compare formulations A and B)], and is consistent with the manufacturers' specifications of a WVTR of < 0.03 g m− 2 d− 1 when measured at 38°C and 90% RH.
The effect of pinholes and fractures in the packaging material is minor compared to leaks in packages that are improperly closed. Like keeping the front door of a well-insulated house open in winter, a poor seal minimizes the effectiveness of containers with otherwise low permeance to the environment. Water flux is high in poorly sealed containers, such as screw lids without gaskets (Gómez-Campo, Reference Gómez-Campo2006), and the WVP (Table 3) and life span (unreported, but known to degrade) of gaskets are important factors in the quality of well-sealed packages. The importance of good seals is simulated using the example of a 14 × 16 cm packet with 0.004 cm thick sides made of high-density polyethylene HDPE (Fig. 1). [Seed storage vaults are expected to have relatively ‘still’ air (600 m h− 1 at 25°C), and a Q10 of 1.3 was used to model the effects of temperature changes on air velocity within seed storage vaults.] When the sides of the pouch are appressed but not sealed, the entire opening leaks (proportion = 1 on abscissa), and the packet has virtually no resistance to water vapour (Fig. 1a, scenario at far right). Permeation through a perfectly sealed packet of the same composition and dimensions is 0.17 g H2O d− 1 at 25°C when RH inside and out are 25 and 90%, respectively (Fig. 1a, circle on vertical axis). Water flux is lower at higher altitude (Fig. 1a, dashed line), lower ambient RH (Fig. 1a, thinner line) and lower storage temperature (not shown).
(a) The initial rate of water vapour diffusion into 14 × 16 cm packet made of high-density polyethylene with 0.004 cm thick walls, as a function of the quality of the seal. Seal opening was assumed as twice the thickness of the material (0.008 cm) × the width of the package opening (14 cm). Flux rates at 25°C are calculated for inside RH = 25% and surrounding RH = 90% and 50% (indicated), and elevation = 0 (solid) and 1645 m (dashed lines). (b) The initial rate of water vapour diffusion into a glass jar (7.6 cm diameter, 13.2 cm height, 0.01 cm thick) with a polytetrafluoroethylene (PTFE) lid (0.01 cm thick) as a function of the thickness of the air layer between jar and lid. Inside RH is 25%. Scenarios are given for 25°C, 0 m elevation, surrounding RH = 90% (solid line); and for 5°C, 1645 m elevation and surrounding RH = 50% (dashed line). The perfectly sealed polyethylene packet allows a flux of 0.172 g H2O d− 1 (WVP÷thickness × SA × ΔVP) for 25°C, 0 m, 90% RH [circle on vertical axis in (a)], and is comparable to a 0.003 cm gap between jar and lid [dashed box and arrow in (b)].

HDPE used in the example (Fig. 1a) has good, not excellent, water barrier properties (Table 3). However, a bad seal can mask even superior water vapour barrier properties of materials. This is demonstrated in Fig. 1b, using the example of silica glass, which has an extremely low WVP (Table 5; Gómez-Campo, Reference Gómez-Campo2006). In this scenario, environmental conditions (25°C, 90% RH outside, 25% RH inside) and surface area of HDPE (Fig. 1a) and glass (Fig. 1b) containers are comparable; the glass is >0.01 cm thick (i.e. negligible permeance) and is topped with a polytetrafluorethylene (PTFE, e.g. Teflon) lid (0.01 cm thick, Perm = 0.0058 g m− 2 h− 1 kPa− 1). The jar and lid do not fuse, and the effect of a hypothetical gap with variable thickness (horizontal axis) on water flux (vertical axis) can be predicted (Fig. 1b). Water flux decreases proportionally to gap thickness. Water flux is comparable to the perfectly sealed HDPE container (0.17 g H2O d− 1, circle on vertical axis in Fig. 1a) when the gap between glass and PTFE is 0.0003 cm (Fig. 1b). Water flux is comparable to a perfectly sealed foil laminate package (0.004 g H2O d− 1 for formulation B; Table 4) when the gap between glass and PTFE is 0.000005 cm (50 nm) (data not shown). The actual contribution of container defects to vapour flux should be evaluated in replicated experiments.
Anecdotal observations attest to the presence of packaging defects. For example, at our facility, visible evidence of air movement into packages was occasionally reported when gusseted bags ‘puffed’ upon warming, after being stored for about 20 years at − 18°C. The gussets made the bags easy to fill, but caused fractures in the foil layer that allowed cold air to enter over time. We have also noticed that about 5–10% of sealed glass tubes and hermetically sealed cans used in long-term storage experiments have lost a vacuum over time (Went and Munz, Reference Went and Munz1949; Bass et al., Reference Bass, Clark and James1962). Finally, we report the dangerous influx of liquid nitrogen into hermetically sealed cans during cryogenic storage (unpublished observations, NCGRP staff, 1990–2000).
Water flux when the package is opened
Working collections routinely monitor seed viability and distribute germplasm to grateful users. Opening seed storage containers to perform these critical functions temporarily eliminates all moisture barriers. Modifications to equation (2) predict the effect of opening and resealing the seed container on water gain:

where D is the duration that the container is opened, and SAopening is the surface area of the container opening. In the glass jar example, 0.6 g of water passes through the container every minute the jar is open. Any benefit from moisture-proof packaging is lost if the container is opened often or for a long time. In this case, it is process-level decisions, not inadequate containers, that limit seed longevity.
Air and water vapour pressure
Papers by Gómez-Campo (Reference Gómez-Campo2006) and I consider how moisture barriers affect water flux into seed storage containers. However, the importance of package permeance properties must be viewed in the context of the amount of water that is available to move and whether that movement will pose a serious risk to seed longevity. Pressure, temperature and RH variables in equations (1) and (2) define the amount of water in the system and the tendency of that water to move from high to low relative concentrations.
The factors that define the concentration of water vapour in the surrounding environment are the total atmospheric pressure (a function of altitude), temperature and ambient RH. The lower density of air at higher altitudes1 gives proportionally lower water vapour pressures, and so seed banks located at high altitude have a distinct advantage over seed banks located at sea level or in caves beneath the earth (Fig. 1a, dashed line). If all other factors were equal (which they are not), moisture flux in Fort Collins, Colorado, USA (1525 m) will be 15% lower than in New Orleans, Louisiana, USA (0 m). Lower temperatures reduce the water-holding capacity of air2 (Table 2), and, ΔRH being equal (which it is not), storing seeds in the freezer compared to the laboratory bench will reduce water flux tenfold. Differences in RH drive water movement, and so water flux increases when the difference between ambient and within-package RH increases. The interaction between ambient RH (horizontal axis) and temperature on water permeation rates is modelled in Fig. 2, using the 0.004 cm thick HDPE film with inside RH = 25%. This model shows WVTR = 2 g of water m− 2 d− 1 at ambient conditions of 25°C and 60% RH, and double that amount if the outside RH increases to 95% or the temperature rises to 36.5°C.
Rate of water vapour diffusion (WVTR) through 0.004 cm thick, high-density polyethylene (HDPE), as a function of the surrounding relative humidity and temperature. Inside RH is 25% and elevation = 0 m. Units used in Fig. 1a can be obtained by multiplying the ordinate by package surface area (SA). In Fig. 1a, the package SA is 0.0448 m2.

Seeds that equilibrate to higher RH die faster than seeds that equilibrate to lower RH. An important illustration of this is the poor longevity reported for seeds in ‘open’ storage in temperate climates (Priestley et al., Reference Priestley, Cullinan and Wolfe1985), compared to the exceptional longevity reported for seeds stored in paper envelopes in a filing cabinet in Cheyenne, Wyoming, USA (annual RH is 40%) (Roos and Davidson, Reference Roos and Davidson1992). Thus, seed banks situated in humid locales face higher risks of poor longevity and greater challenges to find adequate water barriers. These risks and challenges multiply for seed banks situated in warm, humid, low-altitude locales.
Container performance
Low water vapour permeance ‘buys time’ needed to keep seeds at a desired moisture level. The time required for seed moisture to change can be estimated for the various packages described in this essay using permeance values (Tables 3 and 4) and water sorption isotherms (e.g. Vertucci and Roos, Reference Vertucci and Roos1993b). For example, the time for humidity within packages to increase from 25 to 90% RH at 25°C is calculated to be < 1, 4, 39, ~140, ~2600 and ~3400 years for the HDPE container (Fig. 1a), composite formulation A (Table 4, hypothetical), composite formulation B (Table 4, currently used at NCGRP), perfectly sealed glass jar with PTFE lid (Fig. 1b), composite formulations C and D (soon to be available), and an imperfectly sealed glass jar with a 1 nm gap surrounding the lid (also made of glass), respectively. The range of calculated equilibration times supports Dr Gómez-Campo's (Reference Gómez-Campo2006) thesis that container quality varies, but also points out the tremendous opportunities to customize package properties by combining thermal plastics and water vapour barriers, and by manipulating layer thicknesses.
Well-sealed glass containers are effective water vapour barriers (Gómez-Campo, Reference Gómez-Campo2006), but are breakable and inefficient with precious space in the refrigerator or freezer. New foil laminate technologies also provide excellent protection against high humidity environments. These packages are lightweight, easily compressed for efficient packing, and can be transparent (using aluminium oxides rather than foils). For most practical applications, it is now a question of how well containers seal and whether normal seed processing damages the thin layers of a package. These questions are best addressed using quantitative, empirical methods.
The previous discussion points out that ‘one bag does not fit all’ seed banks or seed storage situations. A ‘moisture load audit’ will help seed bank managers and researchers decide on the appropriate storage platform for their site by considering time that the sample remains on site, frequency that it will be accessed, container properties, power failures, thermal insulation of refrigeration equipment, and ambient environmental conditions. Tighter control of water vapour permeance may not always improve efficiency or seed longevity.
In addition to using water impermeable packaging, precise control of seed water content can be achieved through conditioning the room environment or adding RH buffers to the storage container (such as saturated salt solutions or the desiccant silica gel). Some researchers have also advocated excessive drying of seeds, which extends the time spent at lower, more amenable water contents, rather than preventing changes in seed hydration levels per se. Any of these strategies can be used in concert, and their separate benefits can be modelled and implemented in diverse storage strategies.
Fluctuating relative humidity despite constant water content
The water content of seeds can be maintained precisely using a moisture-proof container (e.g. Gómez-Campo, Reference Gómez-Campo2006; the present paper) [assuming containers are the appropriate volume; seed water content changes when seed volume < < container volume (Smith, Reference Smith1992)]. However, the relative humidity within the moisture-proof container fluctuates with any change in temperature. This truth, which has been debated as part of the controversy on ultra-dry seed storage, can be deduced from the psychrometric calculations presented here and water sorption isotherms (e.g. Vertucci and Roos, Reference Vertucci and Roos1993b). A simple experiment also illustrates the point. Using a data logger placed within a well-sealed glass jar filled with pea seeds of known water content, we monitored the RH when the jar was moved from the laboratory bench, to the freezer, to a 45°C oven and then back to the bench over a 4 d period (Fig. 3a). The RH was 48% when the jar was on the bench (arrows 1), decreased to c. 36% when the jar was placed in the freezer (arrow 2), and increased to 54% when the jar was placed in the oven (arrow 3) (Fig. 3b). RH tightly tracked temperature changes, as can be seen by the transient increase in RH during the defrost cycle of the freezer, the overshoots when temperature changed abruptly, and the greater amplitude in RH fluctuations when there were minor temperature fluctuations in the freezer or oven.
Time, (a) temperature and (b) relative humidity recorded by a data logger within a 400 ml glass jar containing 200 g of pea seeds, sealed with a screw cap metal lid wrapped with Teflon tape. The jar was moved from the laboratory bench (arrows 1) to the freezer ( − 18°C) (arrow 2) to an oven (45°C) (arrow 3).

Fluctuating RH in sealed containers has profound implications for seed storage. If temperature increases, the RH also increases, and seeds are potentially exposed to unsuitable storage conditions. If warm storage conditions are inevitable, the only option is drying seeds to extreme levels to prevent RH from increasing unacceptably. Although hardly noted by its proponents, this is the basic principle of ultra-dry technology. The utility of ultra-dry technology is not really debated for the special case when seeds are dried at lower temperatures than they are stored. Most often, however, the temperature for drying seeds is greater than the storage temperature. Under this more usual circumstance, the RH within the package will be lower than the RH used to dry the seeds. Hence, drying below a critical RH is simply wasting energy and can be potentially damaging (Vertucci and Roos, Reference Vertucci and Roos1990, Reference Vertucci and Roos1993a, Reference Vertucci and Roosb; Walters, Reference Walters1998a, Reference Waltersb; Walters and Engels, Reference Walters and Engels1998).
Conclusions
Prolonging seed lifespans requires control of temperature and RH. Mechanical air conditioning is expensive, and passive control of seed storage conditions will conserve energy. An ideal environment would be a place that is naturally very cold and very dry, with low air pressure and background radiation. Seeds in equilibrium with this environment can survive for many years. There are few, if any, places on Earth that are ideal for seed storage; the amount of energy consumed to take and retrieve seeds to/from these necessarily remote places may far exceed the cost savings of the passive environmental control.
RH control during seed storage can be quasi-passive if moisture-proof containers are used. The need and effectiveness of this strategy depend on ambient humidity and other factors described in this paper. There are a number of ways to optimize efficiency of seed storage and obtain desired longevity. Knowledge of psychrometric principles can be used to avoid false economy or overkill.