I. INTRODUCTION
Graphene, a single atomic layer of sp2-bonded carbon atoms in a honeycomb lattice, exhibits extraordinary electrical as well as mechanical properties. Reference Geim and Novoselov1–Reference Castro Neto, Guinea, Peres, Novoselov and Geim3 It has attracted much interest in both academia and industry. To realize technologically feasible graphene-based electronic, optoelectronic, chemical- and bio-sensing devices, progress is needed in the large-scale production of high quality graphene thin films and the modification of their electronic properties. Intensive research efforts have been devoted since the groundbreaking experiments regarding the two-dimensional material graphene reported in 2004. Reference Novoselov, Geim, Morozov, Jiang, Zhang, Dubonos, Grigorieva and Firsov4 The aim of this feature paper is to provide an overview of our work to grow high quality epitaxial graphene (EG) on SiC(0001) and to modify its electronic properties via surface adsorption. Reference Chen, Xu, Liu, Gao, Qi, Peng, Tan, Feng, Loh and Wee5–Reference Huang, Wei, Sun, Wong, Feng, Castro Neto and Wee25 All the measurements are taken in two ultrahigh vacuum (UHV) systems with base pressures better than 2 × 10⁻¹⁰ mbar: a custom-built multichamber system housing an Omicron low-temperature scanning tunneling microscopy (STM), and a multichamber endstation at the surface, interface and nanostructure science beamline, Singapore synchrotron light source. Reference Yu, Wilhelmi, Moser, Vidyaraj, Gao, Wee, Nyunt, Qian and Zheng26 This article consists of seven sections: I—introduction, II—bottom-up growth of EG on SiC(0001), III—surface transfer doping of EG, IV—organic molecules on IG and EG, V—semiconducting Bi(110) nanoribbons on EG, VI—atomically precise armchair graphene nanoribbons (AGNRs), VII—summary.
II. BOTTOM-UP GROWTH OF EG ON SiC(0001)
There are many approaches to fabricating single or few layer graphene thin films, including the micromechanical exfoliation from bulk graphite using Scotch tape, Reference Novoselov, Geim, Morozov, Jiang, Zhang, Dubonos, Grigorieva and Firsov4,Reference Novoselov, Jiang, Schedin, Booth, Khotkevich, Morozov and Geim27 chemical exfoliation from bulk graphite powders, Reference Li, Zhang, Bai, Sun, Wang, Wang and Dai28 chemical vapor deposition of hydrocarbons on transition metal substrates Reference Land, Michely, Behm, Hemminger and Comsa29–Reference Coraux, N'Diaye, Engler, Busse, Wall, Buckanie, Heringdorf, van Gastel, Poelsema and Michely36 such as Cu, Ni, Ru, Ir, Pt, etc., and thermal sublimation of commercial silicon carbide (SiC) substrates in vacuum or under atmospheric pressure conditions. Reference Berger, Song, Li, Li, Ogbazghi, Feng, Dai, Marchenkov, Conrad, First and de Heer37,Reference Emtsev, Bostwick, Horn, Jobst, Kellogg, Ley, McChesney, Ohta, Reshanov, Rohrl, Rotenberg, Schmid, Waldmann, Weber and Seyller38 Among them, EG films thermally grown on SiC can be conveniently patterned using CMOS-compatible nanolithography methods, making it compatible with current semiconductor technology and hence present a promising growth process for future graphene-based devices. Reference Bostwick, McChesney, Ohta, Rotenberg, Seyller and Horn39,Reference First, de Heer, Seyller, Berger, Stroscio and Moon40 In particular, high performance devices such as field-effect transistors (FET), Reference Moon, Curtis, Bui, Hu, Gaskill, Tedesco, Asbeck, Jernigan, VanMil, Myers-Ward, Eddy, Campbell and Weng41 photodetectors, Reference Singh, Nalla, Chen, Wee and Ji42 and chemical sensors Reference Nomani, Shishir, Qazi, Diwan, Shields, Spencer, Tompa, Sbrockey and Koley43 have been demonstrated using EG on SiC.
The formation of crystalline graphite layers on SiC via thermal heating at high temperature in UHV was first observed by van Bommel et al.
Reference Van Bommel, Crombeen and Van Tooren44
Berger et al.
Reference Berger, Song, Li, Li, Ogbazghi, Feng, Dai, Marchenkov, Conrad, First and de Heer37
subsequently demonstrated that EG on SiC has nearly identical properties to free-standing graphene and compatible with CMOS-compatible lithography process for device fabrication. Single crystalline graphene with controlled number of atomic layers can be epitaxially grown on SiC, depending only on the annealing temperature and time. At high temperatures, Si atoms start to evaporate from the surface. C atoms segregate on the surface to form C-rich surface layers, starting from the interfacial graphene (IG) or buffer layer, to single layer EG (SLG), bilayer EG (BLG), and few layer EG.
Reference Novoselov, Geim, Morozov, Jiang, Zhang, Dubonos, Grigorieva and Firsov4,Reference Chen, Chen, Qi, Gao and Wee6,Reference Poon, Chen, Tok and Wee9,Reference Chen, Chen, Ni, Huang, Qi, Gao, Shen and Wee18
This growth process involves a series of surface reconstructions and has been characterized by in situ low-energy electron diffraction [LEED; Figs. 1(a)–1(e)] and atomically resolved STM [Figs. 1(f)–1(h)].
Reference Chen, Chen, Qi, Gao and Wee6
Interestingly, the IG layer has a reconstructed
 $6\sqrt 3 \times 6\sqrt 3 R30^\circ$
honeycomb lattice related to the atomic structure of EG, which results in different electronic properties. It is revealed by angular-resolved photoemission spectroscopy (ARPES) measurements, suggesting partial coupling between the carbon π orbitals in IG and the dangling bonds of SiC(0001).
Reference Emtsev, Speck, Seyller, Ley and Riley45
The LEED patterns (a–d) and corresponding STM images (e–h) of annealing-induced 6H–SiC(0001) surface reconstructions: (a, e) 3 × 3, (b, f)
 $\sqrt 3 \times \sqrt 3 R30^\circ$
, (c, g)
 $6\sqrt 3 \times 6\sqrt 3 R30^\circ$
, and (d, h) with SLG. Reproduced with permission from Ref. Reference Chen, Qi, Gao and Wee12. @2009, ELSEVIER.

EG on SiC(0001) undergoes a bottom-up growth mode. Reference Poon, Chen, Tok and Wee9 Figures 2(a) and 2(b) are large-scale and corresponding zoomed-in STM images showing the coexistence of single layer and BLG. The superimposed line profile shows that the interlayer height difference is only 0.07 ± 0.01 nm. Figure 2(b) is the zoomed-in image from the black square in Fig. 2(a) and shows atomically resolved images of both SLG and BLG. The atomic structure of graphene can be better resolved at low tunneling bias conditions, as shown in Fig. 2(d). It clearly shows that the top graphene layer is physically continuous from the single layer region to the bilayer region. The inseted images in Fig. 2(b) reveals a 6-fold honeycomb structure in the single layer region, and a triangular lattice in the bilayer region, as highlighted by hexagons. The bilayer or thicker EG involves the Bernal stacking of bulk graphite, which breaks the symmetry of the graphene hexagonal lattice resulting in two inequivalent carbon atoms per unit cell. As such, STM reveals a three-fold symmetry pattern for BLG. The honeycomb in the inset at the upper-right corner highlights two inequivalent carbon atoms in one unit cell. This transition from a honeycomb lattice to a 3-fold symmetry pattern is used to differentiate single layer and bi- or multilayer EG on SiC. The local electronic properties of 1–4 layer graphene are revealed by scanning tunneling spectroscopy (STS) data, as shown in Fig. 2(c), indicating the Dirac point (E D) shift toward the Fermi level (E F) as the thickness increases. Reference Lauffer, Emtsev, Graupner, Seyller, Ley, Reshanov and Weber46
STM image showing the coexistence of single layer and bilayer graphene (a: V t = 1.78 V; b: V T = 0.5 V) as well as the physical continuum at the domain boundaries (d: V t = −0.1 V). (c) STS data taken from 1–4 layer EG, respectively. (a), (b), and (d) reproduced with permission from Ref. Reference Huang, Chen, Chen and Wee10. @2008, American Chemical Society. (c) Reproduced from with permission from Ref. Reference Lauffer, Emtsev, Graupner, Seyller, Ley, Reshanov and Weber46. @2008, American Physical Society.

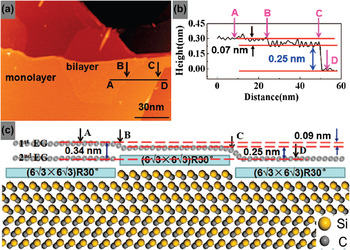
The surface density of C atoms in a graphene layer (3.82 × 1015 cm−2) is triple that in a SiC bilayer (1.22 × 1015 cm−2). This suggests the consumption of three consecutive SiC bilayers to form a graphene layer. Reference Chen, Chen, Qi, Gao and Wee6,Reference Chen, Chen, Ni, Huang, Qi, Gao, Shen and Wee18 Figure 3 illustrates the bottom-up growth mechanism of EG. The line profile in Fig. 3(b) taken along line AD in the STM image in panel a reveals a 0.07-nm-high step and a 0.25-nm-high step. The latter is attributed to a SiC bilayer step. The former is much smaller than the SiC bilayer height and the interlayer spacing in bulk graphite (0.335 nm) but is in good agreement with the difference between them. As such, the model in Fig. 3(c) is proposed to illustrate the atomic structure of neighboring single layer and BLG. A single SiC bilayer thermally decomposes underneath the IG of SLG, accompanied by the sublimation of Si species from the interface and the release of carbon species to form a new IG layer. This leads to the transformation of the original IG layer to a new first EG layer atop the newly formed IG, thereby resulting in a transition from single layer to BLG. From this bottom-up growth model, the top EG layers of the neighboring bilayer and SLG remain continuous as they originate from the same EG layer. This explains the observed physical continuum at the boundary between single layer and BLG. The lowering of the EG layer due to the decomposition of the underlying SiC bilayer is compensated by the formation of a second EG layer with an interlayer spacing of 0.34 nm, consistent with the measured height difference between the monolayer and the BLG (i.e., 0.07 ± 0.01 nm).
(a) Large-scale STM image (V T = 1.5 V) of the epitaxial single layer and bilayer graphene on SiC(0001); (b) line profile alone the white line AD in panel a; (c) proposed model. Reproduced with permission from Ref. Reference Huang, Chen, Chen and Wee10. @2008, American Chemical Society.

III. SURFACE TRANSFER DOPING OF EG
For the development of EG-based nanoelectronic devices, e.g., FET, precise control of the carrier type and concentration in EG is required. However, doping EG using traditional ion implantation method will produce large amounts of defects and hence degrade the device performance. Alternatively, surface transfer doping is an effective method to avoid structural damage. Reference Gao, Chen, Liu, Chen, Wee, Nomoto, Yagi, Soda and Yuhara11 Because of the strong charge transfer between SiC and IG layer, the first few layers of EG are n-type doped, Reference Lauffer, Emtsev, Graupner, Seyller, Ley, Reshanov and Weber46 as shown in Fig. 2(c). Atomic hole doping of EG by metal contacts or atoms has been demonstrated. Reference Gierz, Riedl, Starke, Ast and Kern47,Reference Giovannetti, Khomyakov, Brocks, Karpan, van den Brink and Kelly48 Here, we have shown that using organic and inorganic charge acceptor materials, EG can be p-type doped by surface transfer doping using adatoms and molecules. Reference Chen, Xu, Liu, Gao, Qi, Peng, Tan, Feng, Loh and Wee5,Reference Chen, Chen, Huang, Gao, Qi, Wang and Wee16
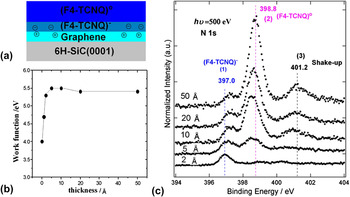
As a strong electron-withdrawing molecule, tetrafluorotetracyanoquinodimethane (F4-TCNQ) has been widely used to tune the hole concentration, thereby improving device performance. Therefore, electron transfer from EG into F4-TCNQ molecules is expected to form an electron accumulation layer in F4-TCNQ and a depletion layer in EG at the interface, as proposed in Fig. 4(a), leading to p-type doping of EG. Reference Chen, Xu, Liu, Gao, Qi, Peng, Tan, Feng, Loh and Wee5 The changes in sample work function with F4-TCNQ thickness are plotted in Fig. 4(b). Upon deposition of 0.1-nm F4-TCNQ, the work function increased from 4.0 eV (clean EG) to 4.7 eV. It increased to 5.3 eV when the thickness was 0.2 nm, confirming a strong charge transfer from EG to F4-TCNQ. Figure 4(c) shows representative N 1s core-level spectra as a function of F4-TCNQ thickness on EG. With 0.2-nm F4-TCNQ, N 1s is dominated by the component [peak (1)] centered at a binding energy of 397.0 eV. Upon increasing the thickness to 0.5 nm, a new component [peak (2)] at a higher binding energy of 398.8 eV appears. Further deposition leads to an intensity increase in peak (2) and a gradual attenuation of peak (1). It confirms the electron transfer from the first EG layer to F4-TCNQ at the interface. The strong charge transfer results in band bending to lower binding energy by 0.5 eV both in EG-related C1s component and in EG-related valence states.
(a) Schematic drawings of the charge transfer at the F4-TCNQ/EG interface. Electron transfer from EG to F4-TCNQ only occurred at the interface, F4-TCNQ in multilayers remains uncharged. (b) The plot of the sample work function of EG as a function of the F4-TCNQ thickness. (c) The evolution of N 1s core-level spectra as a function of F4-TCNQ thickness on EG. Reproduced with permission from Ref. Reference Chen, Chen, Qi, Gao and Wee6. @2007, American Chemical Society.

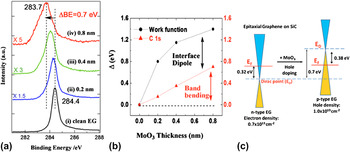
The high work function transition metal oxide of MoO3 has been used at metal/organic interfaces in organic electronic devices for improved hole injection or collection. At the interface between MoO3 thin film and EG, the large work function difference between MoO3 (6.8 eV) and EG (4.0–4.3 eV) could drive spontaneous electron transfer from EG to MoO3, facilitating the formation of a hole accumulation layer in EG, resulting in effective hole doping. Reference Chen, Santoso, Wang, Xie, Mao, Huang, Wang, Gao, Chen, Ma, Wee and Chen17 Figure 5(a) shows the representative C 1s PES spectra as a function of MoO3 thickness on EG. For clean EG, C 1s peak centered at a binding energy of 284.4 eV. A gradual shift of C 1s peak toward lower binding energy was observed as a function of the MoO3 coverage. The EG-related C 1s peak is shifted by 0.7–283.7 eV at a MoO3 thickness of 0.8 nm, confirming p-type doping of EG. The changes in sample work function with MoO3 thickness are plotted in Fig. 5(b). The observed large vacuum level shift of 1.4 eV originates from the convolution of upward band-bending (0.7 eV) in EG and the interfacial dipole formed at the MoO3/EG interface. Due to the charge transfer from the SiC substrate, the as-grown BLG on SiC is electron-doped (n-type) with E F located 0.32 eV above E D (measured by ARPES). At 0.8-nm MoO3 coverage, the EG band is lifted by 0.7 eV with respect to the E F due to surface transfer p-type doping and hence E F moves to 0.38 eV below E D, as shown by the schematic energy diagrams in Fig. 5(c). The charge carrier and its concentration are tuned accordingly.
(a) Synchrotron-based C 1s core-level spectra during the deposition of MoO3 on EG. All spectra are measured with a photon energy of 350 eV. (b) The plot of the sample work function and C 1s of EG as a function of the MoO3 coverage. (c) Schematic energy diagrams show the effective surface transfer hole doping of EG using MoO3 thin films. Reproduced with permission from Ref. Reference Chen, Santoso, Wang, Xie, Mao, Huang, Wang, Gao, Chen, Ma, Wee and Chen17. @2010, American Institute of Physics.

We have also performed first-principle calculations based on density functional theory (DFT) to demonstrate the electronic structure tuning of graphene by organic molecules and charge-transfer complexes. Reference Huang, Chen, Gao, Chen and Wee13,Reference Lu, Chen, Feng and He14 Furthermore, it is predicted that the spin splitting of partially filled π* orbital of the organic molecules will induce spin density in the graphene layer, which has been experimentally confirmed recently in the TCNQ-graphene/Ru (0001) system. Reference Garnica, Stradi, Barja, Calleja, Diaz, Alcami, Martin, Vazauez de Parga, Martin and Miranda49
IV. ORGANIC MOLECULES ON IG AND EG
Although IG and EG are both in honeycomb structures and inert, due to partial coupling between the carbon π orbitals in IG and the dangling bonds of SiC(0001), IG shows different electronic structures compared to EG. Reference Emtsev, Speck, Seyller, Ley and Riley45 Thus, organic molecules show different behaviors on IG and EG.
The inertness of EG hinders the growth of high quality oxide thin films for top-gating FETs. The carboxylic acid derivative of PTCDA layer can improve the reactive sites on mechanically exfoliated graphene for atomic layer deposition of Al2O3. Reference Wang, Tabakman and Dai50 Therefore, it is necessary to understand the PTCDA film growth mechanism to fabricate pinhole-free PTCDA layers on graphene for the development of high quality gate oxide films on top.
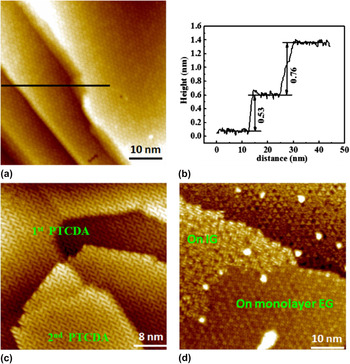
PTCDA usually forms an in-plane herringbone structure because of intermolecular hydrogen bonding. EG is continuously over SiC step edges due to its bottom-up growth mechanism. Reference Poon, Chen, Tok and Wee9 Thus, the EG-covered SiC step edges would not hamper the carpet-like PTCDA growth. Reference Chen, Qi, Gao and Wee12,Reference Wang and Hersam51 As demonstrated in Figs. 6(a) and 6(b), monolayer PTCDA in herringbone arrangement follows EG continuously over bi- and tri-SiC bilayer steps. The second PTCDA layers are also in herringbone arrangement and continuous over the mono-SiC-bilayer step edges, as shown in Fig. 6(c). Figure 6(d) shows a monolayer PTCDA island formed continuously over the boundary between IG and EG. This confirms the possibility to grow a pinhole-free PTCDA monolayer on EG. Our synchrotron-based PES investigation reveals weak charge transfer and weak interactions between PTCDA and EG. It is important for the functionalization of the EG surface using PTCDA derivatives to enhance the adhesion of a gate dielectric layer on EG, facilitating the growth of defect-free ultrathin dielectric layers in graphene-based electronic devices.
(a) Occupied state STM image (V T = 1.5V) showing that PTCDA follows EG continuously over multiple SiC bilayer steps, (b) the corresponding line profile taken along the black line in panel a shows the step height, (c) unoccupied state STM image (V T = −2.2 V) showing ∼1.4 monolayer PTCDA on EG, with the first and second layer PTCDA continuously over single SiC bilayer steps, (d) occupied state STM image (V T = 1.8 V) showing PTCDA continuously over the boundary between IG and EG. While PTCDA on EG appears HOMO-like, those on IG appear LUMO-like. (a–c) Reproduced with permission from Ref. Reference Huang, Chen, Gao, Chen and Wee13. @2009, American Chemical Society.

PTCDA on EG appears HOMO-like (LUMO-like) in occupied (unoccupied) state STM images, as shown in Figs. 6(a) and 6(b). Interestingly, one can observe LUMO-like PTCDA on IG in the occupied STM image in Fig. 6(d). This is attributed to the strong charge transfer from IG to PTCDA. Pentacene on IG appears as three bright protrusions in occupied STM images, Reference Sun, Lu, Chen, Feng and Wee15 far away from the HOMO and LUMO, and can also be understood by charge transfer. Further theoretical calculations are required to understand how the charge transfers from IG to adsorbed molecules (PTCDA, pentacene) and whether the spin-related partially filled π* orbital exists. Reference Huang, Chen, Gao, Chen and Wee13,Reference Garnica, Stradi, Barja, Calleja, Diaz, Alcami, Martin, Vazauez de Parga, Martin and Miranda49
Due to the nature of partial covalent bonding to the truncated SiC(0001) surface, IG resembles a quasi-honeycomb structure with an average side length close to 1.85 nm Reference Wong, Huang, Chen and Wee22 and is referred to as the “SiC nanomesh,” following hexagonal boron nitride (h-BN) nanomesh. Reference Dil, Lobo-Checa, Laskowski, Blaha, Erner, Osterwalder and Greber52 Figure 7(a) shows an optimized model of the SiC nanomesh. Reference Varchon, Mallet, Veuillen and Magaud53 The boundaries of the nanomesh correspond to regions where C atoms are not commensurate with SiC, and hence are suspended on top of it without any covalent bond formation (highlighted in green); whereas the holes correspond to regions where the C-honeycomb is covalently bonded to the underlying SiC via Si–C σ-bonds (highlighted in red). Such covalent bonding breaks the hexagonal network of π-orbitals but preserves the σ-bonds of sp2 hybridization, making the SiC nanomesh semiconducting. The resulting charge transfer from SiC to the corrugated graphene-like carbon layer is uneven and is localized in the hole regions close to the interface, which results in a perpendicular dipole in each hole pointing from the carbon layer into SiC, as shown by a green arrow in the proposed model in Fig. 7(d).
(a) Calculated model of IG on SiC(0001). STM images from the same area before (b, V T = −2.60 V) and after (c, V T = 3.3 V) ClAlPc configuration change showing that while almost all the Cl-up molecules reside in the holes, the Cl-down molecules reside off the centers of the corresponding host holes and close to the boundary. (d) Proposed models and mechanism of ClAlPc in Cl-up and Cl-down configurations on IG. The red arrow indicates the inherent dipole of ClAlPc, the green arrow indicates that of IG. (e) STM image of the CuPc single-molecular array (V T = 1.9 V) on IG. (f) Statistics of the in-plane orientations of CuPc molecules. (a–d) Reproduced with permission from Ref. Reference Huang, Wong, Sun, Chen and Wee23. @2012, American Chemical Society. (e) and (f) Reproduced with permission from Ref. Reference Chen, Chen, Huang, Gao, Qi, Wang and Wee16. @2010, American Chemical Society.

Can IG be used for the construction of single molecular arrays, like the h-BN nanomesh, Reference Dil, Lobo-Checa, Laskowski, Blaha, Erner, Osterwalder and Greber52 for possible applications such as biosensors and data storage? We investigated this question using chloroaluminum phthalocyanine (ClAlPc) Reference Kera, Yamane, Honda, Fukagawa, Okudaira and Ueno54 with an electric dipole moment pointing from a Cl atom to Al atom [indicated by a red arrow in Fig. 7(d)], perpendicular to the phthalocyanine plane as a model system. Figure 7(b) and 7(c) are molecular-resolved STM images taken from the same area before and after ClAlPc molecule inversion stimulated by scanning at V T = −4 V, where two defects are marked by green circles, respectively, as reference. Detailed inspections reveal that while all the Cl-up molecules reside at the center of the holes, the Cl-down molecules locate close to the boundaries of the host nanomesh. It can be attributed to the interaction between the inherent dipole of ClAlPc and that of the substrate. Thus, the downward periodic surface dipole of IG immobilizes ClAlPc molecules with inherent dipoles to form a well-ordered noninteracting single-molecular dipole array. For comparison, copper phthalocyanine, a planar molecule without an out-of-plane dipole, is deposited on IG. Although both the spatial location and orientation of CuPc are confined by IG as shown in Figs. 7(e) and 7(f), there is less ordering. Reference Sun, Lu, Chen, Feng and Wee15 Such self-assembly provides a pathway to atomically precise nanopatterning of the ClAlPc and similar dipole molecules on IG.
IG has the reconstructed
 $6\sqrt 3 \times 6\sqrt 3 R30^\circ$
honeycomb structures as compared to EG. Quasi-free-standing EG (QFSEG) can be achieved when the dangling bonds of a truncated SiC(0001) surface are saturated.
Reference Riedl, Coletti, Iwasaki, Zakharov and Starke55
C60F48 is a known fluorinating agent that allows the safe introduction of fluorine. Upon annealing, F atoms dissociate from C60F48. After four cycles of depositing C60F48 on IG–EG sample followed by annealing, in the regions outlined with blue circles [in Fig. 8(a)], IG was no longer observable under STM [in Fig. 8(b)], whereas the preexisting EG is intact.
Reference Huang, Wong, Tin, Luo, Shen, Chen and Wee20
It is clear that the two surfaces are the same continuous layer. In addition to the structural transformation, there is also a significant change in the electronic structure of the decoupled graphene, as shown by STS in Fig. 8(c). While the E
D of EG is located at 0.5 eV below E
F, that of QFSEG is located at the charge neutrality point. In the PES results, an obvious Si–F related component is observed in the Si 2p core-level spectrum, whereas the C–F signal is not detected in the C 1s core-level spectrum. Figure 8(d) clearly illustrates the intercalation process. After annealing, the dissociated fluorine atoms from C60F48 break the Si–C bonds between IG and SiC(0001), releasing the buffer layer to form QFSEG and forming a passivating Si–F interfacial layer. The QFSEG remains stable in ambient atmospheres for up to 5 months with no change detected in core-level PES, STM, and STS measurements. This stability under ambient conditions indicates its robustness for implementation in devices.
(a) Large-scale STM image from surface with quasi-free-standing graphene which are circled in blue. (V t = −2.0 V). (b) Zoomed-in STM image showing intercalation-induced QFSEG monolayer joined continuously with preexisting EG (V T = −0.35 V). (c) Averaged dI/dV spectra taken on (i) preexisting EG and (ii) QFSEG at points away from point defects. (d) Schematic model describing C60F48 molecules deposited on a surface having both EG and IG (upper) and continuous surface of QFSEG and EG after (lower) annealing at temperatures of 850 °C. Reproduced with permission from Ref. Reference Wong, Huang, Wang, Cao, Qi, Santoso, Chen and Wee21. @2011, American Chemical Society.

V. SEMICONDUCTING BI(110) NANORIBBONS ON EG
EG is proven a good substrate for the preparation of high quality topological insulators (e.g., Bi2Se3) because of the atomic flat, chemically inert, and structurally simple surface.
Reference Song, Wang, Jiang, Zhang and Chang56
We show that EG can serve as a superb substrate for growing semiconducting Bi(110) nanoribbons.
Reference Huang, Wong, Sun, Chen and Wee23
Bismuth was deposited in situ from a Knudsen cell (MBE-Komponenten, Germany) onto EG substrates at room temperature. At low coverage, Bi aggregates into islands with an apparent height of 1.5 ± 0.1 nm (4 monolayers) with Bi(110) parallel to SiC(0001), i.e., the basal plane of EG. Figure 9(a) shows a representative STM image of a 4-ML Bi nanoribbon with an aspect ratio of about 15. The stripe direction
 $[11\bar 20]$
Bi is aligned with the armchair direction [
 $11\bar 20$
] of EG, as indicated by the arrow. Figure 9(b) shows the corresponding differential STM image scaled up from the blue square in panel a. The atomic structures of the Bi(110) nanoribbon edge and the hexagonal lattice of the underlying monolayer EG are clearly distinguishable. The inset shows the geometric relationship between Bi and EG. The profiles taken along the corresponding lines in panel b clearly reveal that reconstructions occur at the Bi(110) nanoribbon edges, as shown in Fig. 9(c). STS measurements shown in Fig. 9(d) reveal four characteristic features of Bi(110) as well as an energy gap of ∼0.4 eV around the vicinity of E
F. DFT calculations confirm that such edge reconstructions, which can facilitate edge strain energy release, are responsible for the band gap opening. A model showing the edge reconstruction based on DFT calculation is proposed in Fig. 9(e).
(a) Large-scale STM image (V
T = −2.5 V) of the 4-ML Bi(110) nanoribbon on EG. The arrow indicates the [
 $11\bar 20$
] direction of EG. The boundary between Bi on EG and Bi on IG is highlighted by a dotted curve. (b) The differentiated STM image from the blue square showing the atomic structure of step edges. The inset shows a model of ultrathin Bi on EG (without reconsctructions). (c) Line profiles along the edge (red line) and terrace (green line) in panel b. (d) STS measurements on a typical 4-ML Bi(110) nanoribbon. The characteristic peaks are denoted by labels. (e) Simulated STM images of a reconstructed monolayer Bi(110) film. Reproduced with permission from Ref. Reference Sun, Huang, Wong, Gao, Feng and Wee24. @2012, American Physical Society.

VI. ATOMICALLY PRECISE ARMCHAIR GRAPHENE NANORIBBONS
The challenge of making graphene semiconducting is crucial for applications in electronic devices. A promising approach is to reduce its dimensionality to 1D to open a band gap. Reference Son, Cohen and Louie57 Surface-assisted bottom-up fabrication of atomically precise AGNRs is one such approach, where the AGNRs have widths of a few nanometers. Reference Sun, Huang, Wong, Gao, Feng and Wee24,Reference Cai, Ruffieux, Jaafar, Bieri, Braun, Blankenburg, Muoth, Seitsonen, Saleh, Feng, Mullen and Fasel58 Using 10,10′-dibromo-9,9′-bianthryl as a precursor, semiconducting 7-AGNRs with an energy gap of ∼2.6 eV have been fabricated successfully on Au (111). Reference Ruffieux, Cai, Plumb, Patthey, Prezzi, Ferretti, Molinari, Feng, Mullen, Pignedoli and Fasel59–Reference Linden, Zhang, Timmer, Aghdassi, Franke, Zhang, Feng, Mullen, Fuchs, Chi and Zacharias61 We demonstrate that 7-, 14-, 21-, and 28-AGNRs can be fabricated on Ag (111) in the same way. Line profiles reveal 7-, 14-, 21-, and 28-AGNRs with widths of ∼1.5 nm, ∼2.4 nm, ∼3.3 nm, and ∼4.2 nm, respectively and in an apparent height of ∼0.19 nm. Reference Sun, Huang, Wong, Gao, Feng and Wee24 Figure 10 displays STM images of electron scattering patterns (ESPs) in 7-, 14-, and 21-AGNRs (left column) as well as the corresponding DFT simulations (middle column). It is obvious that while the ESPs in 7- and 21-AGNRs are in a localized ring-like shape with a (√3 × √3)R30° unit cell, those in 14-AGNRs are in one-dimensional delocalized striped patterns parallel to the lateral direction of 14-AGNRs. The good agreement between experiment and theoretical predictions Reference Son, Cohen and Louie57 confirms the metallic nature of 14-AGNR and the semiconducting nature of 7- and 21- AGNRs. The corresponding STS data in Fig. 10 (right column) reveal their unoccupied features. Due to the electronic interactions with the metallic substrate, the STS data of all the AGNRs are finite and similar to that of exposed Ag (111) in the tip bias range from 0 to 1.0 V. One can deduce that the energy gaps of 7- and 21-AGNRs are greater than 1.8 and 1.2 eV, respectively. Reference Van Bommel, Crombeen and Van Tooren44 For metallic 14-AGNRs, the observed peak at −380 meV is attributed to the first Van Hove singularity at the unoccupied states, which is broadened due to the hybridization with Ag (111). Reference Odom, Huang, Kim and Lieber62,Reference Clair, Kim and Kawai63 These initial investigations on the electronic properties of such AGNRs give us a better understanding of this extraordinary class of materials and help advance theoretical predictions on systems such as intraribbon quantum dots, GNR switches, and magnetic devices based on specific GNR edge states.
STM images (left column) and corresponding DFT simulations (middle column) as well as STS measurements on 7-, 14-, and 21-AGNRs. Reproduced with permission from Ref. Reference Huang, Wei, Sun, Wong, Feng, Castro Neto and Wee25. @2012, Nature Publishing Group.

VII. SUMMARY
In the past few years, we investigated the preparation and modification of EG on SiC(0001). We show the detailed reconstructions of SiC(0001) and the bottom-up growth of EG on SiC(0001). Surface transfer p-type doping of EG using organic or inorganic adsorbates, as well as IG influence on organic molecules (PTCDA, Pentacene, AlClPc and CuPc) are demonstrated. We also show that semiconducting Bi(110) nanoribbon can be fabricated on EG. As a new approach, we have further investigated the surface-assisted bottom-up fabrication of AGNRs. Although all the investigations are carried out in ideal UHV conditions, we expect these model systems will provide important guidance for future practical applications of graphene nanodevices.
ACKNOWLEDGMENTS
We acknowledge the financial support from NRF-CRP Grant Nos. R-143-000-360-281: “Graphene and Related Materials and Devices” and R-144-000-295-281: “Novel 2D materials with tailored properties – beyond graphene”. Dr. Han Huang acknowledges the “Shenghua Professorship” startup funding from Central South University.