


Individuals differ systematically in how they make decisions. In recent decades, studies in psychology and economics have demonstrated that the degree to which individuals use certain decision heuristics, or are subject to various choice anomalies, is predicted by factors such as age, gender, personality traits, education, cultural background, social environment, and domain expertise (Gilovich, Griffin, and Kahneman Reference Gilovich, Griffin and Kahneman2002; Kahneman Reference Kahneman2011; List Reference List2003). In political science, these insights on individual-level decision making are frequently used to explain heterogeneity in opinion formation, vote choice, and turnout, as well as receptivity to political messaging (e.g., Druckman Reference Druckman2004; Gerber et al. Reference Gerber, Huber, Doherty and Dowling2011; Green, Palmquist, and Schickler Reference Green, Palmquist and Schickler2004; Zaller Reference Zaller1992). We know that individual differences in reasoning matter for citizens’ political decisions, and for voter behavior in particular. We also know that citizens’ political choices reflect well-documented choice anomalies, such as negativity bias, loss aversion, preference for the status-quo, discounting of future outcomes, representativeness, and overconfidence. Voter behavior, it appears, is often more closely in line with spontaneous, “System I” thinking than with a complete and purposive deliberation of choices and actions (Druckman and Lupia Reference Druckman and Lupia2000; Kahneman Reference Kahneman2011; Mercer Reference Mercer2005; Soroka Reference Soroka2014).
On this backdrop, it is remarkable how little we know about the biases and anomalies that characterize decision making by elected politicians—those who have the greatest impact on most policy outcomes. Until recently, research on elite behavior with data collected directly from politicians consisted mostly of small-n individual case studies and qualitative investigations (e.g., DiRenzo Reference DiRenzo1967; Greenstein Reference Greenstein2004; Kingdon Reference Kingdon1989; Putnam Reference Putnam1976). Psychological case studies of leader behavior have also been the focus of an extensive literature in international relations. (See Levy Reference Levy2013 for a comprehensive review.) However, large-scale, directly collected empirical evidence on the basic choice characteristics of politicians is almost completely absent.Footnote 1 Many studies of elected politicians’ decision making ascribe to them known choice anomalies, to be sure—but this is often done by adopting terminology and insights obtained from studies conducted with nonelite samples, and whether what is known on the effects of such traits and biases similarly applies to elected politicians is by and large not addressed (for example, Jervis Reference Jervis2015; Jones and Baumgartner Reference Jones and Baumgartner2005a; Kanwisher Reference Kanwisher1989; see Miler Reference Miler2009 for a review). Equally important, there is still a considerable body of work in political science that describes high-level elected politicians as strategic, cool-headed, purposive utility maximizers with full knowledge, stable and transitive preferences, and with close-to-unlimited time and attention resources when making decisions. (The literature is vast, but see, e.g., Axelrod Reference Axelrod2015; Baron and Ferejohn Reference Baron and Ferejohn1989; Bueno de Mesquita Reference Bueno de Mesquita2013; Dewan and Spirling Reference Dewan and Spirling2011; Dunleavy Reference Dunleavy2014; Fearon Reference Fearon1999.) Such accounts make an assumption—implicitly or explicitly—that politicians operate in an environment that motivates “better,” higher-quality decision making, compared to how they would operate elsewhere, or compared to nonpoliticians. In political science, the evidence for such claims is mostly circumstantial.Footnote 2 Outside of political science, studies in economics and psychology provide some evidence that domain-specific expertise can improve decision quality (List Reference List2003), but whether we should expect this to apply to political expertise depends on whether politics is an environment that allows for accurate feedback calibration by decision makers, which is an open question (Butler and Dynes Reference Butler and Dynes2016; Hogarth Reference Hogarth2002; Mellers et al. Reference Mellers, Stone, Atanasov, Rohrbaugh, Metz, Ungar, Bishop, Horowitz, Merkle and Tetlock2015; List and Mason Reference List and Mason2011; Tyszka and Zielonka Reference Tyszka and Zielonka2002).
This state of affairs, we argue, is theoretically unjustified and empirically unsupported. Several disjoint strands of the political science literature highlight a different theoretical landscape, suggesting that elected representatives, as a group, may be subject to similar biases and heuristics in their decision making. Indeed, there are several reasons to expect that the choice anomalies that characterize citizens’ decision making may even be enhanced amongst representatives.
First, studies on the personality determinants of political ambition and motivation, and especially those that examine the personalities of incumbent politicians, find that individuals who decide to run for office (let alone those who win it) have systematically different personality profiles when compared to those who stay out of politics. Several unique features are found in elected officials across countries and levels of government, such as being more extraverted and open to experience, and these features are associated with exhibiting higher levels of decision traits such as loss aversion, choice overconfidence, and escalating commitment (Best Reference Best2011; Caprara et al. Reference Caprara, Francescato, Mebane, Sorace and Vecchione2010; Dietrich et al. Reference Dietrich, Lasley, Mondak, Remmel and Turner2012).Footnote 3
Second, the literature on motivated reasoning by politicians in the face of retrospective voting (and public opinion in general) documents behaviors suggesting that politicians are incentivized to adopt particular heuristics and cognitive shortcuts when performing specific tasks, whether as a result of learning or, more generally, through acquired experience (Arnold Reference Arnold1992; Bueno de Mesquita and Siverson Reference Bueno de Mesquita and Siverson1995; Healy and Malhotra Reference Healy and Malhotra2013; March and Olsen Reference March and Olsen1995; Miler Reference Miler2009; Weaver Reference Weaver1986). Closely related is the literature on political accountability, which documents the behavioral implications of operating in an environment where decisions are open to public scrutiny and sanction, and where those making them are dependent on public approval when seeking re-election (Ashworth Reference Ashworth2012; Downs and Rocke Reference Downs and Rocke1994; Lerner and Tetlock Reference Lerner and Tetlock1999; Przeworski, Stokes, and Manin Reference Przeworski, Stokes and Manin1999). In these accounts, the basic premise is that having to stand for re-election and to operate in public view alters preferences and motivates the adoption of predictable decision-making patterns, such as heavily discounting future events, or preferring risk taking in face of potential electoral losses.
There are thus good reasons to expect that at least some of the choice anomalies readily apparent amongst citizens will be evident in the behavior of elected politicians as well. Efforts to systematically identify and assess such traits in politicians are, however, still nascent. (See Hafner-Burton, Hughes, and Victor Reference Hafner-Burton, Hughes and Victor2013 for an extensive discussion.) So too are efforts to directly compare choice anomalies in both citizens and their representatives. What accounts for this critical gap in the literature? We suspect that it is largely the result of two factors—one ontological and the other methodological.
First, when explaining policy outcomes, political scientists have traditionally ascribed a relatively small role to individual-level elite preferences relative to institutional and structural factors. This is especially true in work on international conflict, political economy, party politics, and public policymaking (Hall and Taylor Reference Hall and Taylor1996; McDermott Reference McDermott2004; Pierson Reference Pierson2000). Of course, domains that involve mass participation, such as electoral behavior or mobilization, lend themselves more readily to individual-level-based explanations (and direct empirical investigation), which perhaps explains why more realistic assumptions about (and testing of) human reasoning are common in these subfields (Druckman and Lupia Reference Druckman and Lupia2012). Nevertheless, influential studies in international affairs, party and parliamentary dynamics, and public policymaking often conceptualize elite decision makers as more simple utility maximizers, operating under constraints that are determined by higher-order conditions (Jones Reference Jones2003; McDermott, Fowler, and Smirnov Reference McDermott, Fowler and Smirnov2008; Tsebelis Reference Tsebelis2002).
Second, finding out whether politicians operate differently from the general population requires studying the decision making of both groups in a controlled and comparable manner, ideally in an experimental setting in which large numbers of participants from both groups perform the same tasks (Druckman et al. Reference Druckman, Green, Kuklinski and Lupia2006; Fréchette Reference Fréchette2011; Mintz, Redd, and Vedlitz Reference Mintz, Redd and Vedlitz2006; Morton and Williams Reference Morton and Williams2010). This remains a difficult undertaking despite the recent proliferation of experiments in political science, mainly due to the difficulty of recruiting a sufficiently large number of incumbent politicians. And external validity is lost when using convenience samples for the reasons noted above. As Druckman and Lupia (Reference Druckman and Lupia2012, 1178) explain, “typical experimental subjects often lack the experience needed to act ‘as if’ they were professional legislators; yet, legislators themselves are often reluctant to participate in experiments as subjects.” Indeed, aside from a few notable examples (Broockman and Butler Reference Broockman and Butler2017; Butler and Dynes Reference Butler and Dynes2016; Enemark et al. Reference Enemark, Gibson, McCubbins and Seim2016; Miler Reference Miler2009),Footnote 4 most experimental studies that involve politicians as subjects usually do so using indirect methods, such as observing variation in communications received from politicians’ offices in response to different kinds of stimuli, or tracing legislative behavior (see, for example, Kalla and Broockman Reference Kalla and Broockman2016; Butler, Karpowitz, and Pope Reference Butler, Karpowitz and Pope2012; Grose, Malhotra, and Parks Van Houweling Reference Grose, Malhotra and Van Houweling2015; Loewen and MacKenzie Reference Loewen and MacKenzie2017). In fact, the only two studies of elected politicians that we are aware of that attempted to asses one of the traits we examine here (stability of risk preferences) were conducted with underpowered samples of N = 32 (Fatas, Neugebauer, and Tamborero Reference Fatas, Neugebauer and Tamborero2007) and N = 46 (Linde and Vis Reference Linde and Vis2017), making valid statistical inference from their findings difficult.Footnote 5
These ontological and methodological constraints are surmountable. We begin a systematic investigation here, focusing on four well-documented choice anomalies that are fundamental in political decision making, and prominently featured in theories of elite politics and policy-related reasoning. First, future time discounting is elemental in numerous studies of political spending decisions, specific policy choices (especially on environmental policies), public opinion, and electoral behavior of both elites and constituents (Jacobs Reference Jacobs2011; Loewenstein and Elster Reference Loewenstein and Elster1992; Nordhaus Reference Nordhaus1975; Streich and Levy Reference Streich and Levy2007). Second, risk management, and in particular, how risk preferences change in face of different issue and choice frames, are crucial in political decision making, where risk underlies almost any action, and indeed have been shown to dominate public opinion formation and, subsequently, the decision making of policy actors (Arceneaux Reference Arceneaux2012; Druckman and McDermott Reference Druckman and McDermott2008; Levy Reference Levy2003; Slovic Reference Slovic2000). Third, the status-quo bias is strongly connected to phenomena such as the incumbency advantage, to political inaction, and to individual choices that result in institutional entrenchment processes and legislative gridlock, among others (Pierson Reference Pierson2000; Quattrone and Tversky Reference Quattrone and Tversky1988; Samuelson and Zeckhauser Reference Samuelson and Zeckhauser1988). Finally, the escalation of commitment in face of sunk costs is seen as the central behavioral disposition accounting for prolonged armed conflict and for decisions to extend spending on failed programs and policies (Dur Reference Dur2001; Heath Reference Heath1995; Sleesman et al. Reference Sleesman, Conlon, McNamara and Miles2012).
While far from being the only commonly observed choice anomalies, we regard these four as most central to the kinds of decisions that politicians must make. We explore each through vignette experiments with several hundred incumbent members of the national and regional parliaments of Belgium, Canada, and Israel (max N = 382). Moreover, and central to our interest in comparing politicians with citizens, we compare politicians’ performance on these tasks to that of voting-age citizens in each country, using representative samples of the general population. Our design has several advantages. First, we obtain direct measures of elite choice preferences by collecting responses from politicians in person, rather than by email or by phone; we consequently know that any differences between politicians and nonpoliticians are the result of the decisions of our elite subjects and not of their staff/advisers. Second, our sample is large enough to allow for well-powered statistical inference in the modules we employ. It also represents a sizable proportion of the entire population of Members of Parliament (MPs) in the parliaments we study. Third, because we collect data on citizen performance on the exact same tasks, we are able to measure elite–nonelite differences directly, without having to rely on convenience samples or on performance in different tasks. Finally, our three-country design allows us to examine whether the patterns we see in MPs are sustained across different institutional settings. Indeed, an important feature of our results is that most of the patterns we observe obtain similarly for politicians across three different electoral systems and party systems, despite the presence of distinct institutional incentives.
EMPIRICAL APPROACH
This study was conducted as part of an ongoing project in which incumbent politicians were extensively interviewed with the purpose of studying the determinants of their information processing and actions.Footnote 6 The core data collected in this project were obtained in two rounds, in 2014 and 2015. In both rounds, we conducted hour-long, in-person interviews with members of national and regional parliaments in Belgium, Canada, and Israel.
We are focusing in this project on established parliamentary democracies, where elected representatives play a central role in policymaking, budgeting, and government control (let alone being part of governments), and where many of them can and do become career politicians. The scope of the project mandated a focus on a small number of parliament cases. Within the context of parliamentary democracies, we chose country cases that had substantial variation in terms of federalism (federal–unitary), electoral systems (majoritarian–proportional), and the political importance of geographic dispersion. While obviously not a perfect or entirely generalizable design—for example, we are not studying elected politicians in newer democracies nor in competitive authoritarian regimes—we believe that our case selection strategy makes the study design well-positioned to make inferences on elite-citizen differences in the choice anomalies we study. We emphasize that this design, while well-suited for documenting the existence (or absence) of such differences, does not attempt to answer causal questions on their origin. We further address this point in the Conclusion.
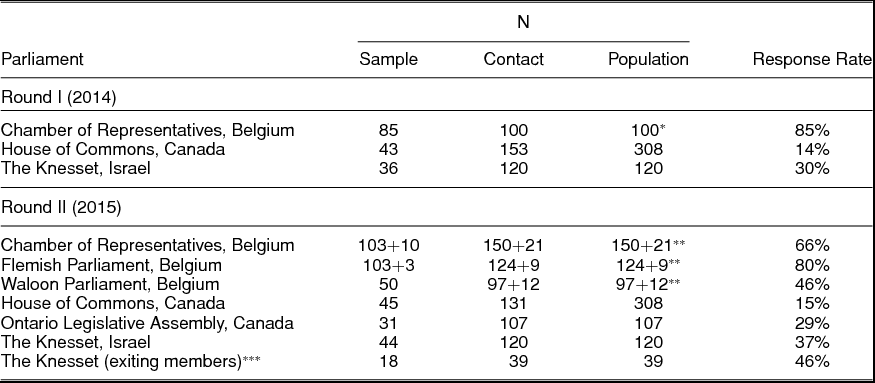
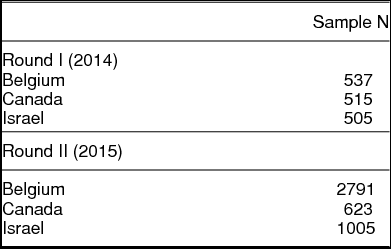
In Canada, we interviewed members of the Federal House of Commons and the Legislative Assembly of Ontario. In Belgium, we interviewed members of the Federal Chamber of Representatives, and also members of the regional parliaments (Walloon and Flanders). In Israel, we interviewed members of the Knesset, Israel’s national (and only) parliament. Participating politicians answered open-ended questions and completed a survey on tablet computers that contained closed questions and several experimental protocols.Footnote 7 Details on sample sizes and response rates for the MP surveys are included in Table 1. [See Supplementary Material (SM) for full breakdowns by party.] Similar information for the accompanying citizen surveys is included in Table 2.Footnote 8 In both rounds, the surveys and questions presented to MPs in all three countries were direct translations to the local language(s) of the same modules (originally written in English). Question phrasing remained identical, barring minor adjustments such as referring to monetary sums using the local currency.
Elected politicians participating in the study, by parliament

Sample N—number of participating MPs. The effective N for each module is slightly lower than the overall participation N per round as some respondents skipped modules for various reasons. (Effective N per module is reported in the paper.) Contact N—overall number of MPs targeted. Where not all MPs were contacted, the contact list was randomly drawn. Population N—overall MPs in parliament at the time of interviews. Response rate— $\frac{Sample N}{Population N}$. Some MPs were interviewed in both rounds. *—the Belgian Chamber of Representatives has 150 members, but only members of Flemish parties were targeted in the first round, resulting in a population N of 100. **—in Belgium, sampling included all members of parliament plus government ministers and state secretaries who are not part of parliament by definition. We also sampled leaders of parties represented in parliament who themselves were not MPs at the time of the interview. ***—in addition to incumbent Members of the Knesset (MKs), MKs who were not re-elected in the May 2015 Israeli general election were also targeted.
Citizen samples, by country

Samples are nationally representative in terms of age and gender distributions, and also geographically in Belgium and Canada. In Canada, the Round II sample consists of a nationally representative sample of ~400 and an Ontario representative sample of ~200, to provide for valid comparisons to both the House of Commons and the Ontario Legislative Assembly.
As outlined above, we focus on four behavioral traits that are fundamental to elite political decision making: risk preference, escalating commitment in face of sunk costs, future time discounting, and a biased preference for the status-quo. Risk preferences are assessed using the classic “Asian disease” experiment (Tversky and Kahneman Reference Tversky and Kahneman1981), which was administered to MPs participating in the first round of interviews (N = 154). The other three traits were assessed using modules administered during the second round (N varies, see below). In all cases, MP interviews were accompanied by survey experiments with representative samples of the voting-age populations of each country, where the same modules were administered. The large majority of MPs completed all three modules in the second wave of interviews, with completion rates ranging between 82% to 93%. The Asian disease module was administered separately in the first round; the completion rate for that module was 97% of participating MPs. (See SM for full figures.)
Vignette experiments administered to politicians are inevitably an exercise in hypotheticals, and because politicians face a big stakes incentive environment, replicating it in a controlled fashion is inherently difficult. Nevertheless, we believe that the modules we used did motivate politicians to engage with them seriously, and that their recorded reactions provide valid measures of our constructs of interests. First, choices observed in similar vignette experiments are correlated with consequential real-world behaviors (e.g., Barbosa, Gerhardt, and Kickul Reference Barbosa, Gerhardt and Kickul2007; Ghadim, Pannell, and Burton Reference Ghadim, Pannell and Burton2005 on risk-taking; Caprara et al. Reference Chabris, Laibson, Morris, Schuldt and Taubinsky2008; Meier and Sprenger Reference Meier and Sprenger2012 on time discounting), which supports the external validity of these tests. Second, the anomalies we study are similarly observed in studies with and without incentives, further substantiating the expectation that politicians think about such choices as they would had there been tangible material incentives in play (Camerer et al. Reference Camerer, Hogarth, Budescu and Eckel1999). Finally, we used very well-known designs that have been administered dozens of times. There is a very large body of empirical findings that substantiate the validity of results obtained from such modules, and we know that people’s behavior changes in predicted ways in response to them.Footnote 9
We note that this design is vulnerable to the potential problem of confounding in survey experiments, identified by Dafoe and colleagues (Dafoe Reference Dafoe2011; Dafoe, Zhang and Caughey Reference Dafoe, Zhang and Caughey2016). In short, this is the concern that experimental manipulations contain information that can serve to change beliefs about background features of the scenario, beyond the belief of interest that is intended to be manipulated, thus possibly confounding one’s ability to make inferences about that belief’s effect. This is a design concern in survey experiments more broadly, and we believe that the majority of treatments we introduce here are less susceptible to potential confounding, although this is potentially an issue for accountability treatments.Footnote 10 In our view, this concern still represents a reasonable cost given the benefits of the modules we used, but this feature underscores the importance of future replications of the findings presented here.
The sections that follow introduce experiments and review results for each of our four common choice anomalies in turn.
STUDY 1: RISK PREFERENCE AND FRAMES
In this first module, we are interested in whether elected politicians exhibit higher or lower levels of risk-seeking as nonpoliticians on the same tasks, and whether their risk preferences are more (or less) stable in face of choice frames. The classic rational choice expectations are that (a) individuals are risk-neutral, in that they are indifferent between certain and risky choices with the same expected utility, and that (b) this risk-neutrality is invariant (Levy Reference Levy2003; Shepsle and Bonchek Reference Shepsle and Bonchek1997). As has been demonstrated countless times, this does not hold empirically, with the most persistent deviation being that people tend to be risk-seeking when they believe they are facing potential losses, and risk-averse when they believe they are facing potential gains, even if the choices themselves remain the same (Tversky and Kahneman Reference Tversky and Kahneman1992; see Kühberger Reference Kühberger1998 for an extensive review). This is an inherent part of prospect theory, and has been originally demonstrated using the Asian disease framing experiment (Tversky and Kahneman Reference Tversky and Kahneman1981).
Despite the now-dominant place this perspective takes in the study of human psychology, its integration into models of political choice has been more gradual, and whether it applies to elected politicians is still a matter of debate: some accounts make the argument that politicians should be expected to respond strongly to gain/loss frames, either because their susceptibility to cognitive biases is similar to the general population (Boettcher Reference Boettcher2004; Druckman Reference Druckman2004; Levy Reference Levy1997; McDermott, Fowler, and Smirnov Reference McDermott, Fowler and Smirnov2008), or because having to stand for re-election makes their risk preferences erratic (Jervis Reference Jervis1992, 190-1). Other accounts imply that elected politicians are more resistant to framing effects, particularly because elected representatives operate in an environment in which they are constantly facing attempts to frame the issues they deal with. They are in continuous interaction with the news media, interest groups, businesses, and lobbyists—all of whom are involved in attempts to “sell” a frame that benefits their interests to political decision makers (Baumgartner and Jones Reference Baumgartner and Jones1993; Edwards and Wood Reference Edwards and Wood1999). Further, politicians are themselves strategic and purposive instigators of issue frames (Chong and Druckman Reference Chong and Druckman2007), and so should be able to put their reactions to them in check. Of special importance in representative democracy is the ability of actors to frame actions and issues as potential losses or gains, given the substantial impact that these features have on opinion formation—and thus on politicians’ public standing and re-election prospects (Druckman Reference Druckman2004). Such constant exposure to and involvement in framing attempts implies that politicians may be less susceptible to them.
Method
We use a modified version of the Asian disease experiment, which captures both within-group average risk-seeking preferences, and examines how they change in response to different task frames. In this protocol, subjects are presented with a hypothetical scenario in which an exotic disease is expected to kill 600 people. Two proposals for combating this epidemic are presented. Choice A, the riskless option, has the certain result of 400 people dying and the remaining 200 people being saved. Choice B involves risk: there is a 1/3 chance of no one dying, and a 2/3 chance of everyone dying. In the experiment, following directly on Tversky and Kahneman's (Reference Tversky and Kahneman1981) work, the framing of the two choices is manipulated such that half of subjects are presented options framed as potential gains (“200 people will be saved”) and the other half are presented with the same options, framed as potential losses (“400 people will die.”). We note the explicitly political nature of this question, namely that decisions about public and not private matters are being made. Subjects were randomized to one condition.
We further include a second treatment: we randomly vary the scenario’s level of political accountability by changing the hypothetical location of the disease threat, and thus the personal importance of the decision that the subjects are asked to make. In the low accountability condition, the disease was said to be threatening a country geographically removed from the politician’s country (Germany in the Canadian case, and the United States in the Belgian and Israeli cases), and the politician was asked what she/he would do. In the high accountability condition, the politician was told the disease was in their country, and that they were on the health committee making a final vote over the two options. This manipulation produces one variant in which the likelihood of electoral sanction is low (that is, when there are no direct consequences of the decision for the politician’s electorate), and another in which the likelihood of electoral sanction is much more likely. Subjects were randomized to one condition, independent of their assignment to gain-loss frames, thus resulting in a 2 x 2 between-subjects experimental design.
Results
We report two quantities.Footnote 11 First, by observing the average response of subjects across conditions, we can recover the stability of risk choices by politicians in the face of gains versus loss frames.Footnote 12 We can also compare this stability of risk preferences on this task to those recovered from the general population samples using the same module. Second, by observing differences across our political accountability conditions, we can estimate whether politicians make different decisions when their choices plausibly involve more tangible consequences for them and for their constituents. If we find that politicians are less risk-seeking overall, or are less susceptible to frames when considering a (hypothetical) situation for which they could face sanction, that is, their vote on a health committee, then this provides evidence that the task environment plays a role in accounting for decision-making differences between politicians and nonpoliticians.
We begin with some basic descriptives. The overall three-country risk-seeking rate by MPs is 62.5%, compared with 53.8% for nonpoliticians—a substantively large difference that nears conventional levels of statistical significance (two-sided t-test p = 0.07). Figure 1 presents overall rates of risk-seeking in this task by MPs and citizens across the sample and in each country. Our results suggest that the overall risk-seeking rates of politicians do not vary substantially across the three cases (Belgium = 63.8% (95% ci 50, 76), Canada = 58.7% (95% ci 42, 75), Israel = 61.3% (95% ci 43, 79). In all cases, politicians consistently demonstrate a greater preference for risk than citizens, but these differences are never statistically significant within each country (two-sided t-tests: Belgium p = 0.12, Canada p = 0.68, Israel p = 0.37).
Proportion of risky choices made by politicians and citizens in the Asian disease experiment, in Belgium, Canada, and Israel.

Figure 2 shows the rates of risk-seeking across framing conditions for MPs and citizens. Overall and in each country, a loss frame induces more risk-seeking. The percent change in risk-seeking preference when moving from the gains frame to the losses frame is +38 percentage points for MPs (one-sided t-test p = 0.00) and +35 percentage points for citizens (p = 0.00). The framing effect for Israeli MPs does not reach conventional levels of statistical significance, and is substantively small: the change in preference for risk-taking when moving from gains to losses is +42 percentage points in Belgium (p = 0.00), +45 in Canada (p = 0.00), but only +16 in Israel (p = 0.20). However, a logistic regression model with country dummy variables suggests that Israeli MPs’ reactions do not differ significantly from the effects seen in Belgium and Canada (see SM).
Proportion of risky choices made by politicians and citizens in the Asian disease experiment, by gains/losses frames, in Belgium, Canada, and Israel.

Figure 3 illustrates the impact of low and high accountability levels on risk-taking. Accountability levels have a variable effect on MPs’ choices across our cases: in Belgium, high levels of political accountability lead to reduced risk-seeking by MPs (-20 percentage points, two-sided t-test p = 0.06); increased political accountability is associated with more risk-seeking in Canada (+16 percentage points, p = 0.30); and accountability levels are unrelated to Israeli MPs’ risk preferences (change <0.5 percentage points, p = 0.98). Results among citizens confirm no systematic effect for the accountability treatment (see SM). We revisit these and related findings in a concluding section. For the time being, we note that while the impact of accountability is complex, the results above suggest that elected officials exhibit framing-induced preference reversal at the same rate—and, if anything, slightly more—than citizens in each country, on the task we evaluate.
Proportion of risky choices made by politicians and by citizens in the Asian disease experiment, by low/high accountability treatments, in Belgium, Canada, and Israel.

STUDY 2: ESCALATING COMMITMENT IN FACE OF SUNK COSTS
Escalating commitment as a result of sunk costs is an anomaly that has been studied extensively in multiple disciplines (see Sleesman et al. Reference Sleesman, Conlon, McNamara and Miles2012 for a comprehensive review). Its implications are especially consequential in high-level decision making on spending programs and projects, and susceptibility to it is often seen as having a relationship with being held accountable to a decision (McAfee, Mialon, and Mialon Reference McAfee, Mialon and Mialon2010; Simonson and Nye Reference Simonson and Nye1992; Teger Reference Teger1980). However, political science and economics theories make contrasting arguments on whether heightened accountability results in an escalation of commitment in face of a failed course of action or, conversely, in de-escalation and an attenuated susceptibility to sunk cost bias (Dur Reference Dur2001; Heath Reference Heath1995; Lerner and Tetlock Reference Lerner and Tetlock1999). Direct empirical evidence of politicians’ tendency to exhibit this tendency is absent—it is unclear whether politicians are better than nonpoliticians at ignoring sunk costs, in line with the rational choice approach to elite decision making, or if they are subject to escalating commitment just as nonpoliticians are. An extensive political science literature has documented policy patterns that conform with elites exhibiting escalating commitment, such as continued spending on failed or financially overrun projects, and cases of prolonged armed conflict. In addition to such indirect evidence, other studies have investigated sunk cost effects in the context of politics through experiments with nonelite convenience samples (Boettcher and Cobb Reference Boettcher and Cobb2009; Downs and Rocke Reference Downs and Rocke1994; Fearon Reference Fearon1997; Simonson and Staw Reference Simonson and Staw1992; Taliaferro Reference Taliaferro2004). It remains unclear what the balance is between the individual tendencies of elites and institutional incentives towards escalation in accounting for these policy patterns.
Method
We follow classic work on the subject (Arkes and Blumer Reference Arkes and Blumer1985; Thaler Reference Thaler1980) by presenting a typical sunk-cost decision scenario, adapted for a parliamentary environment. (See SM for full instrument texts.) Respondents were required to decide on whether to support a (hypothetical) one-year extension of a five-year-long small business government loans plan that was supposed to return its original $500 million investment, but by the end of its approved period has fallen short of covering these costs. Extending the program is projected to cost another $100 million, and the relevant government bureaucrats in charge of the program are projecting that, by the end of the extension, the entire investment plus the extra $100 million will be recovered. We manipulate the amount of money lost in the original investment ($200/$50 million). We also separately manipulate the implied level of accountability of the decision, either presenting the question as a hypothetical, or informing the respondents that the situation is happening a month before the upcoming election and that the media is interested in their position. The outcome of interest is whether respondents decided to support the proposed extension of the program or not.
This module was implemented in the second round of MP interviews, in 2015 (N = 382, Belgium—254; Canada—75; Israel—54). It was also administered to general population samples from each country in an online survey. (N = 2791, 619, 1005 in Belgium, Canada, and Israel, respectively.)
Results
We report three quantities. First, by observing the overall rate of extension approval among MPs and comparing it to the population base rate, we can determine to what degree MPs exhibit higher escalating commitment in this scenario. Second, by looking at variation across the two sunk-cost conditions (the program falling short of full returns by either $200/$50 million) we can observe to what degree politicians’ reasoning is conditioned by the scale of the sunk cost. Third, by looking at variation in rates of escalating commitment by each accountability treatment, we obtain a direct estimate of the effect of heightened accountability on the likelihood of committing to the failed financial course of action we presented.
Figure 4 presents a comparison of overall rates of escalating commitment by both MPs and citizens. Results are predicted probabilities obtained using Clarify, and reported separately for each country and as an aggregate figure. Escalating commitment is measured by whether respondents chose to support the extension of the small business loan program. Overall, MPs exhibit a substantively very high tendency to support the extension of the program—significantly more so relative to citizens, across all conditions (83.7% and 71.1%, respectively, two-sided t-test p = 0.00). This obtains also within Belgium (84.7% for MPs vs. 69% for citizens, p = 0.00) and Canada (75.2% vs. 59.9%, p = 0.01). In Israel, the difference is not statistically significant(89.8% vs. 83.6%, p = 0.22).
Proportion of politicians and citizens voting to extend a small loan program in the sunk cost experiment.

Manipulating the size of the sunk cost—that is, changing the investment that has still not been returned—results in noticeable, albeit nonsignificant differences: MPs’ support for the extension is 85.9% when the return has fallen short by $50 million, and it drops to 80.6% when the shortfall is $200 million. For citizens, there is a much smaller drop, from 71.5% to 70.4%. Neither difference is statistically significant. The left panel in Figure 5 illustrates these results using predicted probabilities. In line with Heath (Reference Heath1995), these findings suggest a de-escalation of commitment in face of higher sunk costs among politicians in this scenario.
Proportion of politicians and citizens voting to extend a small loan program in the sunk cost experiment, by experimental treatment.

Finally, the right panel in Figure 5 demonstrates the effect of the accountability treatment on MPs and citizens. MPs exhibit a lower willingness to extend the program when accountability is primed—81.1% compared to 85.7% in the low accountability treatment—but this effect does not meet conventional levels of statistical significance (two-sided t-test, p = 0.21). This is similar to the effect observed in citizens, where the same trend holds, although the percentage point change is smaller—69.6% compared to 72.4% in the low accountability condition. This smaller difference, however, is statistically significant (p = 0.03). The impact of heightened accountability on escalating commitment by MPs is negative in Belgium (7.5 percentage points decrease) and in Canada (4.5 percentage points), but is reversed in Israel (6.5 percentage points increase).Footnote 13
Overall, MPs exhibit very high levels of escalating commitment in face of (hypothetical) sunk costs, with only weak evidence for responsiveness to the magnitude of the sunk cost. This tendency to “throw good money after bad” is significantly higher than that of nonpoliticians faced with the same scenario, and is consistent across all three countries in our sample. Priming accountability moderates the escalation of commitment by politicians in this task, but not to a degree that meets conventional levels of statistical significance.
STUDY 3: FUTURE TIME DISCOUNTING
Our third experiment is focused on the degree to which elected politicians discount future benefits relative to those available to them immediately. A positive discount rate in the general population—that is, a devaluation of future payoffs relative to present payoffs—is the overwhelming empirical consensus in the literature. Nevertheless, actual discount rates vary greatly by study: in an extensive meta-analysis on time preference, Frederick, Loewenstein and O’Donoghue (Reference Frederick, Loewenstein and O’Donoghue2002) list results that place annual discount rates of individuals at anywhere between −6% to 55,700%. This variation is due in part to different measures and designs, but it highlights the difficulty in obtaining valid baselines for comparison with politicians.
In the context of policy-related decision making, it is unclear where politicians are found on this spectrum. Extant studies that deal with designing long-term policy or with political business cycles usually assume an arbitrary level of future time discounting by politicians—often increasing in face of elections—but that rate is rarely specified, and is never directly assessed (famously, Alesina Reference Alesina1987; Nordhaus Reference Nordhaus1975; see also Drazen Reference Drazen2000; Jacobs Reference Jacobs2008; Levy Reference Levy2013). In essence, we have no direct evidence on the relationship elite decision makers have with time-dependent policy choice: Do they discount the future, on average, equally as much as nonpoliticians do? Or are they subject to personality or situational effects that makes them value the future differently? And if so, as is often assumed, then to what degree? The potential long-term policy implications of having present- or future-oriented politicians are profound, especially because we know voters substantially discount the future and are impatient about postponed outcomes. As Galle (Reference Galle2012, 6) points out, “if both voters and officials are impatient, then there are few obvious market-clearing mechanisms by which present-biased officials would be driven from office.” Such a future discounting profile by politicians, in turn, increases the likelihood of myopic policymaking and suboptimal resource allocation across time.
One factor that is suspected of contributing to time discounting by politicians is the future uncertainty introduced by having to stand for re-election (and, more generally, having to solidify one’s political survival). This is a central motivating factor in many theories that consider temporal factors in economic policymaking (Brender and Drazen Reference Brender and Drazen2008; Drazen Reference Drazen2000; Franzese Jr. Reference Franzese2002; Geddes Reference Geddes1996). In this context, elections are particularly consequential for whether long-term policies are adopted, especially when political competition is strong (Garrett Reference Garrett1993; Kayser Reference Kayser2005). We are interested here in directly assessing the impact that the presence or absence of elections has on politicians’ time preference given a specific choice task.
Method
We employ a “choice game” vignette, commonly used in economics (Harrison, Lau, and Williams Reference Harrison, Lau and Williams2002; Harrison et al. Reference Harrison, Lau, Rutström and Sullivan2005), administered as part of the second wave of our MP interviews during 2015 (overall module N = 300). We also presented the same module to citizens across the three country cases (module N = 3083). In a time discounting choice task, participants are presented with a series of choices between a proximate-time payoff X and a higher payoff X + C (C > 0), to be received at a predetermined time further in the future—two years, in the current study. In each subsequent choice in the vignette the future payoff is greater—that is, the value of C increases in each line. The policy scenario we use revolves around allocating funds to build a community centre in the MP’s locality—either a fixed sum that will result in the community centre being opened within six months, or waiting two years in promise of a higher investment that will result in more facilities and programs offered by the centre.
The choices in this kind of module reveal the degree to which subjects are willing to wait for future benefits, and therefore offer an estimate of how much they discount future payoffs given such a scenario, in a way that does not require introspection or self-report (Fowler and Kam Reference Fowler and Kam2006, 114). If a participant prefers the present payoff over some future payoff X + C l, but in the subsequent decision prefers the higher future payoff X + C l′, then we infer that the value this individual places on the present over waiting two years is contained within the segment [Cl, C l′].
According to the formulation of hyperbolic discounting used by Thaler (Reference Thaler1981), if the “break point” is exactly at C l, then the annual discount rate for that individual i is given by the value of d i that solves X = (X + Cl) × (e−t*di), where t is the time horizon. For example, if for a given individual the value above which she will pass on $100 today and agree to wait two years is $120, we solve 100 = 120 × (e2di) and infer an annual discount rate of d i = 2.4%.
Below is the full text of the instrument used. We randomly assign participants to either an election or a no-election treatment. The square brackets contain the different texts of the two treatments: the no-election prime is the text to the left of the “/” sign; the election prime is the text to the right of the sign:
“Suppose there is a need in your community for a new community building, which will include various recreational facilities, like a swimming pool and gymnasium, and services for families, such as a day care, art classes, and after school programs. There are two options for building the community centre. The first is to build a $10 million centre, which would be opened in 6 months. The other option is [to wait for 2 years/to wait for 2 years, until after the next election], and dedicate more money to the facility. [Within these 2 years, no election will take place./(empty)] The more money that is dedicated to the facility, the larger the facilities and the more programming it will be able to offer.
For each of the scenarios below, please tell us whether you would support building the community centre to open in 6 months, or [in 2 years/in 2 years, after the elections].”

Results
Our main quantity of interest is the future value for which respondents decide to (theoretically) wait two years rather than build the (smaller scale) centre to open in six months. We report how politicians and nonpoliticians differ on it.Footnote 14
In this task, the mean amount for which MPs decide to wait two years over receiving $10 million in funding at present is $14.3 million. This is similar to a mean value of $14.63 observed in the general population, and the difference is not statistically significant (two-sided t-test p = 0.20). The resultant annual future discount rates are 18% for MPs and 19% for citizens. However, the distribution of tipping points in the population of MPs is markedly different from that of citizens. Figure 6 plots the proportion of respondents who, in this task, choose to wait two years, by the promised two-year investment size and by the election treatment conditions. The overall proportion of MPs who at some point opt to switch and “wait” two years, across treatments, is 75.18%, while the same figure for citizens is 53.95%. This difference is remarkably large, suggesting that there is a larger proportion of citizens for whom the two-year present-equivalent value is higher than $25 million, or, put differently, who have an annual future discount rate higher than 45% when faced with this decision. This puts the similarity in mean break values between politicians and nonpoliticians into perspective: it is strongly conditional on the set of options available to participants.
Time-Discounting Module: Proportion of politicians and citizens choosing to wait two years for added funding for a community centre, by the two-year guaranteed investment, split by election treatment.

The dissimilarity between politicians and nonpoliticians is further borne out when examining the pattern of discounting more closely: a large proportion of MPs decide to switch at or close to the $14M mean, across both treatment conditions: moving from a future payoff of $12M to $17M, the overall proportion of MPs choosing the future payoff increases from 26.1% to 67.7%—a 41.6 percentage point increase. For citizens, the equivalent increase is only 25.4 percentage points, and the overall shift is much more gradual. This illustrates that while MPs and citizens on average have similar future discount rates in this task, discount rates in the general population are distributed more uniformly, while MPs’ discount rates are closer to being normally distributed around the $14M mean. A possible interpretation of this result is that politicians conform more closely to a specific “type” of future time preference, while nonpoliticians have more heterogeneous preferences. The distributions of the minimal future-switching values are indeed substantially different, with a Kolmogorov-Smirnov equality of distributions test returning a value of p = 0.06, suggesting that the time discounting patterns exhibited by politicians and nonpoliticians—at least, on this specific task—differ significantly (Massey Jr. Reference Massey1951).
Figure 7 presents the effect of the election treatment on the mean amount for which politicians and citizens indicate that they would wait two years.Footnote 15 For politicians, priming election increases the mean value from $14 million to $14.64 million (one-sided t-test p = 0.07). Put differently, and as Figure 6 illustrates, introducing an election between present and future choices results in a reduced willingness by politicians to wait two years for the same future payoffs, regardless of the payoff. The imputed annual discount rate exhibited by politicians increases from 16.8% to 19% when elections are primed, serving as a preliminary quantification of the effect that election-related uncertainty has on politicians’ future discount rates. A similar, albeit much smaller, effect obtains for nonpoliticians, where the election treatment increases the mean value from $14.52 to $14.74 million, also losing statistical significance (one-sided t-test p = 0.14). Importantly, for both MPs and citizens, in both a stripped-down model and one with controls for gender, age, and country fixed effects, the election treatment effect does not meet conventional levels of statistical significance (see full regression results in the SM). Essentially, we find that, in this specific task, elections have a smaller impact on future discount rates by politicians than is commonly assumed. This experiment uses a hypothetical task and so its external validity–and, in particular, our ability to make a broader claim regarding elections and discount rates—is limited, as is characteristic of other time-discounting measures. Nevertheless, as this is a first direct investigation of this trait with elected politicians who actually engage in elections, and because we did observe an effect for this treatment, these results highlight the value of further testing how elections alter intertemporal preferences by representatives.
Time-Discounting Module: Mean value of the guaranteed future investment on which respondents opt to wait two years, by election treatment, country and sample type.

Finally, there is substantial variation across our country cases in politicians’ mean discount rates: means range from $13.8M in Canada and $14.02M in Belgium to $16.63M in Israel. The overall observed distribution pattern of discount rates among politicians (and nonpoliticians) remains similar across country cases, as demonstrated in Figure 8. The effect of the election frame on politicians is similar in direction across country cases: mean switch values increase by +$0.43M in Belgium, +$0.64M in Canada, and +$0.36M in Israel. Neither effect is statistically significant.
Time-Discounting Module: Proportion of politicians and citizens choosing to wait two years for added funding for a community center, by the two-year guaranteed investment, across country cases and election treatment conditions.

Overall, these results demonstrate that politicians steeply discount the future—as measured by their willingness to wait two years for more funding—but do so much less than nonpoliticians. These discount rates increase when there is a (hypothetical) election between the present and the time of the future outcome, but this increase in future devaluation is substantively small on this specific task, and far in magnitude from what would be expected if politicians were solely vote-maximizing with short time horizons.Footnote 16
STUDY 4: STATUS-QUO BIAS
A preference for maintaining the status-quo is a persistent choice anomaly in virtually any decision-making domain, and has been consistently shown to impact a wide variety of outcomes (Kahneman, Knetsch and Thaler Reference Kahneman, Knetsch and Thaler1991). The effect of the status-quo bias on public policy and politics was argued to be especially profound when it was first identified (Samuelson and Zeckhauser Reference Samuelson and Zeckhauser1988), and since then the list of potentially affected political outcomes has grown: status-quo bias is one of the sources of the incumbency advantage (Quattrone and Tversky Reference Quattrone and Tversky1988); it is seen as responsible for adverse economic performance, and for the retention of failed and/or harmful policies (Crandall et al. Reference Crandall, Eidelman, Skitka and Morgan2009; Fernandez and Rodrik Reference Fernandez and Rodrik1991; Howitt and Wintrobe Reference Howitt and Wintrobe1995; Samuelson and Zeckhauser Reference Samuelson and Zeckhauser1988)Footnote 17; and an innate preference for—and justification of—the status quo carries potentially long-term implications for disadvantaged groups in society, as their discriminated status is entrenched by the impact of status-quo preference on system justification (Jost, Banaji, and Nosek Reference Jost, Banaji and Nosek2004).
In this literature, elite decision making is assumed to be strongly influenced by a status quo preference. Yet, at the same time, numerous other scholars make the opposite argument by describing politicians as strongly motivated to abandon or modify existing policies. This predisposition towards a platform of change has been claimed to be both a successful campaigning strategy and a frequently observed in-office policymaking style (Aragonès, Postlewaite, and Palfrey Reference Aragonès, Postlewaite and Palfrey2007; Cai et al. Reference Cai and Treisman2009; Capelos Reference Capelos2005; Fu and Li Reference Fu and Li2014; Majumdar and Mukand Reference Majumdar and Mukand2004).
We are interested in estimating the degree to which politicians are indeed likely to abandon what is presented as the present state policy for a different one: Are they more inclined to favor change or inaction relative to nonelites? Following up on the argument made by Tetlock and Boettger (Reference Tetlock and Boettger1994), we are also interested in evaluating whether accountability in public policy-related decision making amplifies the status-quo effect.
Method
We use a design similar to the original modules used by Samuelson and Zeckhauser (Reference Samuelson and Zeckhauser1988; see also Anderson Reference Anderson2003), where participants are asked to make a choice between two alternatives. We manipulate which of the two is presented as the default/current state of the world, and participants are randomly assigned to either treatment. We employ a scenario where MPs are required to adopt one of two policy plans, each having different GDP growth and deficit projections—either 3% growth and 3% deficit (“3 + 3”), or 5% growth and 5% deficit (“5 + 5”). We add an additional accountability treatment by adding or removing text that describes the situation as happening a month before an upcoming election and notes that there is press pressure to know the respondent’s position on the issue.
The experiment was administered as part of the second wave of our MP interviews during 2015 (overall module N = 377). We also presented the same module to citizens across the three country cases (module N = 4375)
Below are the full texts of the module used. The square brackets contain the low/high accountability treatments; the different status-quo frames are listed separately:
1. Status quo—3 + 3:
“[Imagine that / Going into the coming elections,] your party has to adopt an economic policy plan. The party has to choose between two plans: plan A will keep the rate of economic growth and budget deficit at their current levels. The rate of economic growth is currently 3% and the budget deficit is 3%. Plan B would increase the rate of economic growth by 2% while also increasing the budget deficit by 2%.
[(empty)/A month before the elections, reporters ask you which plan you would support.]
Which plan would you vote for?”
2. Status quo – 5 + 5:
“[Imagine that/Going into the coming elections,] your party has to adopt an economic policy plan. The party has to choose between two plans: plan A will keep the rate of economic growth and budget deficit at their current levels. The rate of economic growth is currently 5% and the budget deficit is 5%. Plan B would decrease the rate of economic growth by 2% while also decreasing the budget deficit by 2%.
[(empty)/A month before the elections, reporters ask you which plan you would support.]
Which plan would you vote for?”
Results
Our quantities of interest are the proportions of respondents choosing the policy plan that is presented as the status quo under different conditions. Overall, only 67.3% of MPs chose the plan presented as the status-quo, while 32.7% chose to abandon for the nondefault plan. The rate of status-quo preference in the general population is lower overall—64.1%—but not significantly so (two-sided t-test p = 0.20). This similarity between politicians and citizens holds in Belgium (65% and 64%, respectively) and in Israel (67.7% and 64.1%). In Canada, politicians are significantly more likely to adhere to the status quo compared to citizens (76.4% of MPs choosing the status quo compared with 60% of citizens (two-sided t-test p = 0.01).
The left panel of Figure 9 plots the effect of the different plans on adherence to the status quo. Politicians tend to strongly favor the status-quo plan regardless of its content: 68.9% opt for the alternative when the status-quo is the 3+3 plan, and 65.8% do so when the default is the 5+5 plan—a statistically insignificant difference (p = 0.46). In contrast, nonpoliticians are more averse to the 5+5 plan, choosing it 59.9% of the time when it is presented as the status-quo option, compared with 67.9% of respondents who choose the 3+3 plan when it is the default (p = 0.00).
Proportion of politicians and citizens choosing the economic plan presented as the status quo, by experimental treatments.

Priming accountability somewhat increases politicians’ likelihood of overcoming their preference for the status-quo plan in this task, but this change is far from meeting conventional levels of statistical significance. In the low accountability condition, the status-quo is chosen 69.5% of the time, and when accountability is high this figure drops by 4.6 percentage points to 64.9% (two-sided t-test p = 0.32). This conforms with an absence of an accountability effect for citizens (64% vs. 63.7% preference for the status quo in the low/high conditions, respectively). The right panel of Figure 9 plots these results for politicians.
Finally, Figure 10 plots the rates of abandoning the status-quo plan by country case. Overall, politicians are either equally biased towards the choice that is presented as status-quo in this module, or, as in Canada, are even more likely than nonpoliticians to prefer it.
Proportion of politicians and citizens choosing the economic plan presented as the status quo, by country case.

CONCLUSION
Elected politicians are far from being the ideal decision makers they are often modeled to be. When making policy choices, politicians appear to be as much—if not more—subject to known choice anomalies as nonpoliticians.
In this three-country study we find that national-level and subnational-level incumbent politicians exhibit a strong tendency to escalate commitment to a failed course of action in the face of hypothetical sunk costs—significantly more so than nonpoliticians—and that priming accountability only marginally reduces this tendency. These politicians also adhere very strongly to policy choices in vignettes where they are presented as the status quo, above and beyond the substantive content of the policy. We further find that politicians favor risk-seeking when faced with policy choices with varying levels of uncertainty—consistently more so than the citizens who elect them across our country cases. We also observe that, like nonpoliticians, politicians’ risk calculus when making such choices is strongly subject to framing effects. Finally, these elected politicians exhibit a distinct future time-discounting preference when faced with a scenario that involves present–future spending tradeoffs. This preference is surprisingly similar across the three country cases examined in this paper, and it consistently distinguishes politicians from the general populations that elect them. The patterns we observe also hold when we limit our citizen comparison group to individuals who were propensity-matched to MPs based on age and gender (see full analysis in the SM), suggesting that demographic-based selection effects do not alone account for these results.
Do our results point to contexts in which we should expect politicians’ decision-making to reflect fewer choice anomalies or more classically “rational” decision-making? We have explored at least one potential source of variation in politicians’ incentives here; namely, accountability. The impact of accountability is in each case inconclusive, however. In the scenarios we evaluated, accountability decreases only slightly the status-quo bias; it appears to matter little for future time discounting or for sunken costs; and while it reduces risk-seeking among Belgian MPs, it increases risk-seeking among Canadian MPs, and has no impact on Israeli MPs. We have captured accountability in only one way in each instance, of course, and future tests may well yield more powerful evidence of the impact of accountability on the prevalence of choice anomalies. For the time being, there are few indications here of conditions that might augment or diminish the impact of these choice anomalies on elected officials’ decision making.
The impact of accountability is just one of many areas in which future work is warranted. We have explored each of four choice anomalies through just four modules, after all. We have varied policy domains from one task to the next, but we still cannot be sure that our results for each choice anomaly will hold for all possible policy domains. Nor can we be fully confident that our results do not vary across different political/electoral systems. We see some between-country differences here, but they are, for the most part, small; and, in any case, while our use of three countries allows for some claims about the generalizability of our findings, it does not provide the leverage necessary to explore the impact that political institutions may have on choice anomalies. Do proportional systems in which incumbent politicians may have longer political careers encourage politicians to have lower time-discounting rates? We cannot answer this, nor many related questions, here.
We have nevertheless demonstrated the potential significance of choice anomalies to understanding political decision making. Our results provide a first direct comparison of common choice anomalies between politicians and nonpoliticians. In so doing, they highlight potential inadequacies in political science theories that do not take into account such patterns—either by assuming that elite decision makers are optimally strategic and rational as their starting point (influential examples include Dewan and Dowding Reference Dewan and Dowding2005; Downs and Rocke Reference Downs and Rocke1994; Fearon Reference Fearon1995, Reference Fearon1997; Putnam Reference Putnam1988; Rogoff Reference Rogoff1990; Tsebelis Reference Tsebelis1990, Reference Tsebelis2002) or by ascribing to them behavioral patterns observed in convenience samples without accounting for potential systematic differences between them and the politicians under study (Jones and Baumgartner Reference Jones and Baumgartner2005b; Jervis Reference Jervis1992; Jones Reference Jones2001; McDermott Reference McDermott2001). Updating such assumptions can be particularly useful to our understanding of the causes of important political outcomes. If politicians do not have stable risk preferences, then the likelihood of engaging in international armed conflict, or of escalating domestic crises, is probably more complex to predict and should involve a closer inspection of decision frames and reference points than what is present in several current accounts. If politicians discount the future less than some models assume, then phenomena that are normally explained by relying on this tendency, such as electoral business cycles, may warrant an examination of additional causes. And if politicians have a strong status-quo preference—even stronger than that of citizens—then models of the policy process that see elites as indifferent to, or even eager for, change (like the arguments for public responsiveness and dynamic representations) should revisit the motivation for their expectations and the factors that produce them in light of these findings.
Looking forward, our understanding of elite behavior would benefit from several extensions: there is still a long list of behaviors for which we might expect differences between politicians and nonpoliticians, and that would therefore benefit from direct measurement with elites, such as levels of other-regarding thinking, choice overconfidence, and cooperative behavior (Hafner-Burton, Hughes, and Victor Reference Hafner-Burton, Hughes and Victor2013); and there is much to learn by expanding the scope of this kind of research to different institutional environments—whether in different countries or other levels of government. In undertaking this challenge, future studies would benefit from addressing concerns regarding confounding in survey experiments with elites, as much as possible.
Importantly, there is much to explore in terms of understanding the determinants of the patterns we observe. The extant literature fleshes out three categories of factors that feed into the unique ways in which politicians employ heuristics and are subject to decision biases. First, how politicians conduct themselves in office may be the result of selection effects that increase the likelihood of specific types of people winning office and subsequently exhibiting more (or less) of a certain bias or heuristic in their decision making. This is important not only in the context of differences in fundamental personality profiles, but also when looking at socioeconomic and demographic determinants of selection into office that are known to affect the behavior of elected politicians, such as gender (Swers Reference Swers2002; Wängnerud Reference Wängnerud2009), race, education, socialization, and economic attainment (Broockman Reference Broockman2014; Grose Reference Grose2011; Lawless Reference Lawless2012; Norris and Lovenduski Reference Norris and Lovenduski1995)—some of which are significant predictors of the outcomes we report here. This kind of subgroup analysis is an important and natural extension of our line of research. Second, learning and expertise that is accumulated while in office can alter representatives’ behavior in systematic and predictable ways. This experience-based differentiation is too an important predictor of differences in decision-making preferences within the population of elected politicians, and its discussion is beyond the scope of this paper. Third, causes related to the unique environment politicians operate in—and specifically the idiosyncratic effect of being held publicly accountable as a political office holder—can incentivize the adoption of some of the behaviors we observe. Pinning the exact causal weight of each of these three categories on behaviors that politicians engage in while in office can contribute greatly to our understanding of decision making by incumbents. Subsequently, these findings can and should inform ongoing efforts to reshape institutions to improve decision-making quality, responsiveness, and accountability.
SUPPLEMENTARY MATERIAL
To view supplementary material for this article, please visit https://doi.org/10.1017/S0003055417000569.
Replication materials can be found on Dataverse at https://doi.org/10.7910/DVN/E7OQEY.




Comments
No Comments have been published for this article.