I. INTRODUCTION
A wide range of products has made use of semiconductor memories and the demand for them is expected to expand. However, they suffer from several problems such as size reduction, access speed, and power consumption. Conceptually new nonvolatile memory devices need to be fabricated to accomplish the high performance that is expected. Resistance random access memories (ReRAMs) have been actively investigated in the research field of nonvolatile memories as a likely candidate for universal memories. They have the potential of yielding high functionality with a large change in resistance as well as high-speed access and nonvolatility.Reference Liu, Wu and Ignatiev1–Reference Sawa5 As ReRAMs have a simple capacitor structure that is metal/insulator/metal, they are scalable to nanometer size. The resistance switching of ReRAMs between two stable conditions of a high-resistance state (HRS) and a low-resistance state (LRS) is operated by simply applying voltage. The current-voltage (I-V) feature exhibits hysteresis characteristics that can be exploited as nonvolatile resistance switching. ReRAMs are expected to use multivalued or logic memories in the future.
Many materials have been applied to ReRAMs such as perovskite-type oxides (Pr0.7Ca0.3MnO3 (PCMO),Reference Liu, Wu and Ignatiev1–Reference Kaji, Kondo, Fujii, Arita and Takahashi3 SrTiO3Reference Sawa5), binary-type oxides (NiO,Reference Baek, Lee, Seo, Lee, Seo, Suh, Park, Park, Kim, Yoo, Chung and Moon4–Reference Kondo, Kaji, Fujii, Hamada, Arita and Takahashi7 TiO2,Reference Yoshida, Tsunoda, Noshiro and Sugiyama8 and CuOReference Fujiwara, Nemoto, Rozenberg, Nakamura and Takagi9), and solid electrolytes (Ag-Ge-S,Reference Kozicki, Park and Mitkova10–Reference Kamalanathan, Russo, Ielmini and Kozicki13 Cu-Ge-S,Reference Kozicki, Balakrishnan, Gopalan, Ratnakumar and Mitkova11 Cu2S,Reference Sakamoto, Sunamura, Kawaura, Hasegawa, Nakayama and Aono14 Ag2SReference Terabe, Hasegawa, Nakayama and Aono15, Reference Xu, Bando, Wang, Bai and Golberg16) to find the best set of materials to use. The switching characteristics of these materials can be classified into several categories. For example, resistance switching is caused by alternating or not alternating the polarity of voltage. Polarity-dependent resistance switching is called bipolar switching. The switching of perovskite-type oxides or solid electrolytes is in this category. However, unipolar switching has no dependence on polarity. Many binary oxides belong to this category. While such classifications have empirically been well established, a crucial problem remains. The physical mechanism for resistance switching is not yet clearly understood, although various models have been proposed. Resistance switching in NiO films is believed to occur due to the formation of a conducting path when voltage is applied.Reference Baek, Lee, Seo, Lee, Seo, Suh, Park, Park, Kim, Yoo, Chung and Moon4–Reference Kondo, Kaji, Fujii, Hamada, Arita and Takahashi7 The modulation of Schottky-like barriers is attributed to the change in resistance in perovskite-type oxides.Reference Sawa, Fujii, Kawasaki and Tokuda2, Reference Kaji, Kondo, Fujii, Arita and Takahashi3, Reference Sawa5 In another model, the diffusion of oxygen vacancies is believed to play an important role in resistance switching in PCMO.Reference Sawa5, Reference Tsui, Baikalov, Cmaidalka, Sun, Wang, Xue, Chu, Chen and Jacobson17, Reference Nian, Srozier, Wu, Chen and Ignatiev18 As compared with binary and perovskite oxides, the switching mechanism in solid electrolytes is relatively well known.Reference Kozicki, Park and Mitkova10–Reference Kozicki, Ratnakumar and Mitkova12, Reference Waser and Aono19, Reference Waser, Dittmann, Staikov and Szot20 The mechanism for resistance switching is attributed to the formation and disappearance of conductive filaments in solid electrolytes. Many previous studies have reported resistance switching in solid electrolytes such as Ag-Ge-S,Reference Kozicki, Park and Mitkova10–Reference Kamalanathan, Russo, Ielmini and Kozicki13 Cu-Ge-S,Reference Kozicki, Balakrishnan, Gopalan, Ratnakumar and Mitkova11 Cu2S,Reference Sakamoto, Sunamura, Kawaura, Hasegawa, Nakayama and Aono14 Ag2S,Reference Terabe, Hasegawa, Nakayama and Aono15, Reference Xu, Bando, Wang, Bai and Golberg16 Ta2O5,Reference Tsujii, Sakamoto, Banno, Hada and Aono21, Reference Sakamoto, Lister, Banno, Hasegawa, Terabe and Aono22 Cu-SiO2,Reference Schindler, Staikov and Waiser23 and bilayer types Reference Tada, Sakamoto, Banno, Aono, Hada and Kasai24, Reference Aratani, Ohba, Mizuguchi, Yasuda, Shiimoto, Tsushima, Sone, Endo, Kouchiyama, Sasaki, Maesaka, Yamada and Narisawa25 that support the filament model.
Based on this model of solid electrolytes, the ions generated at the anode migrate toward the cathode because of bias voltage. The ions undergo reduction and become metal atoms forming conductive filaments.Reference Sakamoto, Sunamura, Kawaura, Hasegawa, Nakayama and Aono14 In contrast, the opposite voltage dissolves metal composing filaments into the solid electrolyte.Reference Sakamoto, Lister, Banno, Hasegawa, Terabe and Aono22 Therefore, the analysis of conductive filaments should provide important information that enables this switching mechanism to be understood. Conductive filaments not only in cation-type but also in anion-type electrolytes have recently been observed. Filaments in some reports have been observed by means of scanning electron microscopy before and after voltage has been applied.Reference Fujiwara, Nemoto, Rozenberg, Nakamura and Takagi9, Reference Kozicki, Balakrishnan, Gopalan, Ratnakumar and Mitkova11, Reference Yasuhara, Fujiwara, Horiba, Kumigashira, Kotsugi, Oshima and Takagi26 While a single bridge-like path has been confirmed, detailed investigations into what is inside the bridge are necessary. In addition, real-time observations on the formation of filaments would be very helpful in allowing the switching mechanism to be better understood.
In situ transmission electron microscopy (TEM), where TEM observations and physical (e.g., electrical) measurements have been simultaneously performed,Reference Ohnishi, Kondo and Takayanagi27–Reference Fujii, Arita, Takahashi and Fujiwara37 has attracted a great deal of attention to satisfy this demand. The numbers of such studies using piezo-controlled TEM holders have been increasing in the past few years. For example, studies have been done on the appearance and disappearance of superstructures in PCMO by applying voltage,Reference Jooss, Hoffmann, Fladerer, Ehrhardt, Beetz, Wu and Zhu30 I-V hysteresis of PCMO in TEM,Reference Fujii, Kaji, Kondo, Hamada, Arita and Takahashi31 filament-like structural changes in TiO2,Reference Kwon, Kim, Jang, Jeon, Lee, Kim, Li, Park, Lee, Han, Kim and Hwang32 and dynamical forming processes in NiO.Reference Fujii, Arita, Hamada, Kondo, Kaji, Takahashi, Moniwa, Fujiwara, Yamaguchi, Aoki, Maeno, Kobayashi and Yoshimaru33 More detailed experimental results that would confirm the conduction mechanism during the switching process are required to enable the switching mechanism to be better understood.
The previously mentioned in situ TEM using a piezo-controlled specimen holder was applied to solid electrolyte Cu-Ge-S to find the switching mechanism for a solid electrolyte in this work. Real-time observations of the formation of filaments and erasure process were carried out. We also clarified the structure and composition of filaments using selected area diffractometry (SAD) and energy-dispersive x-ray spectroscopy (EDX). As a result, we clarified that Cu-based filaments were formed and erased during the switching process. The model for conductive-filament formation reported thus farReference Kozicki, Park and Mitkova10–Reference Kozicki, Ratnakumar and Mitkova12, Reference Waser and Aono19, Reference Waser, Dittmann, Staikov and Szot20 was confirmed through experiments.
II. INSTRUMENTATIONReference Fujii, Arita, Hamada, Kondo, Kaji, Takahashi, Moniwa, Fujiwara, Yamaguchi, Aoki, Maeno, Kobayashi and Yoshimaru33
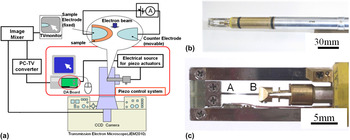
There is a schematic of the experimental system we used in Fig. 1(a). The TEM instrument was a JEM 2010 microscope (JEOL, Tokyo, Japan; 200 kV and Cs = 0.5 mm) equipped with a custom-made TEM holder, a control system for the piezo actuator, a current measurement unit, and a charge-coupled device (CCD) camera system.Reference Arita, Okubo, Hamada and Takahashi29, Reference Fujii, Arita, Hamada, Kondo, Kaji, Takahashi, Moniwa, Fujiwara, Yamaguchi, Aoki, Maeno, Kobayashi and Yoshimaru33, Reference Hirose, Arita, Hamada and Takahashi36 The vacuum during observations was ∼10−5 Pa. Figures 1(b) and 1(c) are photographs of the TEM holder we used in this work. It had three functions. The first function enabled an electrode to be positioned with sub-nanometer scale accuracy. Two sharp electrodes were placed at A and B in Fig. 1(c). The Pt-Ir electrode covered by the Cu-Ge-S sample was fixed at position-A, where the electrode was used as a substrate on which the solid electrolyte layer was to be deposited. However, the Pt-Ir counter electrode at B could be moved.Reference Fujii, Arita, Hamada, Kondo, Kaji, Takahashi, Moniwa, Fujiwara, Yamaguchi, Aoki, Maeno, Kobayashi and Yoshimaru33, Reference Hirose, Arita, Hamada and Takahashi36, Reference Fujii, Arita, Takahashi and Fujiwara37 The second function enabled the current to be measured down to less than nanoamps. There was an electric circuit composed of coaxial cables and a built-in amplifier (gain: 103–105) inside the TEM holder. The amplifier could be switched off to measure currents that were larger than microamps. The third function enabled load to be measured using a semiconductor sensor of the order of less than micronewtons. While this function was not frequently used in this work, mechanical contact between two electrodes could easily be detected. One Pt-Ir tip was used as the substrate and the other was used as a counter electrode. The conduction properties could be measured between the Pt-Ir counter electrode and the Cu-Ge-S/Pt-Ir by selecting a satisfactory location for the fixed Cu-Ge-S/Pt-Ir sample. The I-V measurements were carried out using a source measurement unit (SMU, Yokogawa GS820, Tokyo, Japan) with sufficient current compliance to prevent the sample from being destroyed. The voltage was defined as the potential of the substrate relative to the counter electrode. The horizontal axis in each I-V graph denotes the output voltage of SMU but not the actual voltage applied to the substrate. While the voltage output mode was used for the measurements, the operation mode of SMU was automatically converted to the current output mode when the current magnitude reached the compliance value. Therefore, in this case, the actual voltage applied to the substrate was smaller than the indicated voltage value. For example, under the condition “d” of Fig. 4, the voltage applied to the substrate was about 3 V instead of output voltage of about 6 V.
(a) Schematic of experimental system, (b) TEM specimen holder, and (c) margin of holder where specimens were placed.

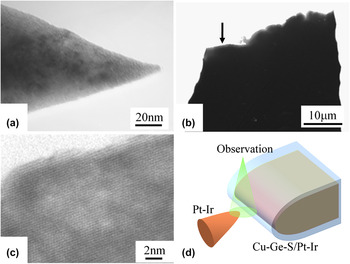
Very sharp counter electrodes had to be used to obtain I-V data from nanoregions. To achieve this purpose, Pt-Ir STM tips were further sharpened using ion milling as well as the ion shadow method.Reference Hirose, Arita, Hamada and Okada38 An example has been shown in Fig. 2(a). The apex of the tip-shaped Pt-Ir electrode was ∼10 nm or less. The Pt-Ir substrate electrode covered with Cu-Ge-S had to be sufficiently wide and thin to enable multiple investigations in one batch. To achieve this, the Pt-Ir tip was mechanically ground into the shape of a wedge. After that, it was polished by conventional ion milling. There is an example of this in Figs. 2(b) and 2(c). The electrode was ∼50 μm wide and thin enough for TEM observations. The geometric configurations for these electrodes during in situ TEM experiments are schematically shown in Fig. 2(d). The TEM images were recorded with a CCD video camera.
TEM images of the Pt-Ir (a) counter electrode and (b) substrate for sample deposition. Area indicated by arrow in (b) is magnified in (c). Substrate was thin enough to observe TEM lattice fringes. (d) Schematic image of sample alignment to measure I-V characteristics in TEM.

For easy operation of in situ TEM investigations, we introduced a special geometry using tip-shaped and wedge-shaped electrodes. While this geometry is different from that of the planar stack used in usual ReRAM devices, we think this method is sufficient to obtain primitive characteristics in the film during application of voltage. Following the filament model reported so far, small metallic deposits (e.g., Ag or Cu) appear at the interface between the solid electrolyte and the cathode. The appearance of deposits lowers flatness of the interface and introduces concentrated electric field nearby. Ag or Cu ions are gathered preferentially to the deposits and they grow to become conducting filament after the redox reaction. The tip of the counter electrode in this work can be considered to have an analogous shape of these deposits.
III. SAMPLE PREPARATION AND CHARACTERIZATIONReference Fujii, Arita, Takahashi and Fujiwara37
Cu-Ge-S thin films were deposited at room temperature by co-sputtering on the Pt-Ir substrate. Since the substrate and the counter electrode of Pt-Ir had different shapes, the structure of Pt-Ir/Cu-Ge-S/Pt-Ir was asymmetric while it was electrochemically symmetric. This structure where the solid electrolyte was sandwiched between inert electrodes is different from the usual device structure (e.g., Pt/solid electrolyte/Cu). It was introduced for easy operation of EDX. One of the purposes of this work is to prove the growth of Cu filament during voltage application. To prevent possible Cu signal from the substrate, we did not use Cu substrates. In this case, the Cu ion source was the Cu-Ge-S film layer itself, which contains limited amount of Cu. Therefore, Cu was added to the film as much as possible. The atomic composition of the sample layer was analyzed by means of EDX. The proportion of Cu:Ge:S was 4:4:2 as will be described later. The film thickness was between 8 and 60 nm, and no outstanding differences depending on thickness could be identified.
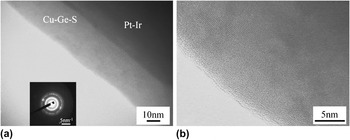
There is a TEM image of the Cu-Ge-S layer we obtained on the Pt-Ir substrate tip in Fig. 3. We confirmed that the Cu-Ge-S layer had been smoothly deposited on the Pt-Ir tip [Fig. 3 (a)]. The inset of Fig. 3(a) is a corresponding SAD pattern. It is composed of a halo pattern with a faint Debye ring. This indicates that Cu-Ge-S was in an amorphous phase including the nanocrystals. This was also identified in the enlarged TEM image in Fig. 3(b). Amorphous contrast and faint lattice fringes were also identified. The crystal size was about several nanometers or less. As will be described later, the crystal phase was thought to be Ge but not Cu. Therefore, the amorphous phase, which may work as the solid electrolyte, is thought to contain less Ge than the value described above.
(a) TEM image and SAD pattern (inset), (b) magnified high resolution TEM image of Cu-Ge-S on Pt-Ir tip. Amorphous Cu-Ge-S layer containing crystalline nanoparticles can be identified.

In general, amorphous chalcogenides are thought to be easily detected by TEM observations. To check this possibility, we carefully performed TEM observations. As a result, no structural changes were observed during high-resolution TEM observations, where the beam current density at the sample was ∼170 fA/nm2. The in situ TEM experiments in this work were undertaken with lower beam current than this value. Thus, the influence of the electron beam should have been negligible.
IV. SWITCHING PROPERTIESReference Fujii, Arita, Takahashi and Fujiwara37
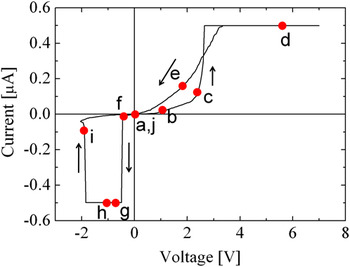
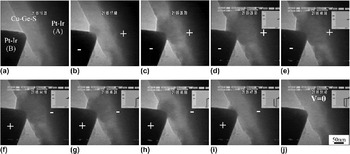
Figure 4 has the I-V characteristics obtained during the in situ TEM observations. The current compliance was set at 0.5 μA by SMU. The output voltage to the substrate was swept from 0 to 7 V, from 7 to −2 V, and back to 0 V. The I-V curve indicates hysteresis characteristics, which were similar to those found in other studies on solid electrolyte ReRAMs.Reference Kozicki, Park and Mitkova10–Reference Xu, Bando, Wang, Bai and Golberg16, Reference Waser and Aono19–Reference Aratani, Ohba, Mizuguchi, Yasuda, Shiimoto, Tsushima, Sone, Endo, Kouchiyama, Sasaki, Maesaka, Yamada and Narisawa25 A set of TEM images corresponding to those in Fig. 4 have been presented in Fig. 5 for comparison. Just after the counter electrode contacted Cu-Ge-S layer, there was no special contrast within the Cu-Ge-S layer [Fig. 5(a)]. The resistance gradually began to change from HRS to LRS at around 1 V (point-b in Fig. 4), and this transfer was quickly completed at ∼2.6 V (just after point-c in Fig. 4). This is thought to be the “Set” operation, which we are interested in. A small deposit gradually appeared in the same way, which revealed dark contrast in the TEM images. This was ∼30 nm in size [Fig. 5(b)]. While applying positive voltage, the size of the deposit was enlarged in degrees, as shown in Fig. 5(c), (∼160 nm in width). The deposit almost stopped growing after current increased [∼170 nm in width in Figs. 5(d) and 5(f)] even though the level of current and the resistance changed up and down according to the voltage scan. Even if the size of the deposit was almost constant in this process, some changes occurred around it. We confirmed that the diffraction spots during SAD twinkled continuously during the voltage scan. The I-V curve between positions-d and -g of Fig. 4 was abnormal as compared with the curves of usual ReRAMs. The LRS was not kept constant, and the curve was not linear indicating nonmetallic conduction. In addition, the resistance suddenly increased at about −0.5 V. This change was caused by over accumulation of Cu around the counter electrode because the amount of Cu was limited in the present experiment. This is special for the sample without the Cu substrate and is not the “Set” or “Reset” switching phenomenon. The mechanism of this over accumulation will be discussed later in detail. Continuing the negative voltage application, the deposit slightly contracted [150 nm in Fig. 5(g)]. Afterwards, it quickly reduced in size [Figs. 5(h) and 5(i)], and the sample resistance returned to HRS as can be seen at position-i in Fig. 4. This is the “Reset” switching which we are interested in. Finally, the deposit entirely disappeared [Fig. 5(j)]. The size of the deposit and the current value corresponded. Though the deposit position along the electron beam (perpendicular to images) is hard to be determined using these TEM images, the deposit seems to appear both at the inside and the surface of the solid electrolyte layer. We concluded from the results in Figs. 4 and 5 that the deposit observed in Fig. 5 constituted a conducting path. The dependence on polarity in this work may be attributed to the asymmetry of the electric field caused by the different shapes between the substrate and the counter electrode as can clearly be seen in Fig. 5. When positive voltage was applied to the substrate, the Cu ions may be gathered at the counter electrode because of the concentrated electric field near the tip apex. On the other hand, when negative voltage was applied to the substrate, the electric flux was dispersed towards the substrate because the area of the substrate is much larger than the apex of the counter electrode. Therefore, though Cu is thought to be gathered at the substrate–film interface, its density is not high to form the filament connecting electrodes. Actually when we used output voltage of about −10V, the deposits did not appear. With voltage more than −10 V, the Cu-Ge-S film was broken-down.
I-V characteristics measured with TEM instrument. Voltage swept from 0 to 7 V, 7 to −2 V, and back to 0 V with current limit of 0.5 μA. Note that the horizontal axis denotes the output voltage of SMU but not the actual voltage applied to the substrate.

Series of TEM images during application of voltage. Plus “+” and minus “−” indicate polarity of voltage. Each figure corresponds to points-a to -j in Fig. 4. Region denoted by Pt-Ir(A) is substrate and that denoted by Pt-Ir(B) is counter electrode. (a) Cu-Ge-S contacted by the Pt-Ir (B). (b and c) Deposit appeared and grew in the Cu-Ge-S with the application of positive voltage. The resistance gradually decreased. (d and e) The resistance rapidly decreased when the deposit connected between two Pt-Ir tips. The deposit size was saturated. (f–h) No change was confirmed in the deposit. (i) The deposit was suddenly shrunk with the increasing negative voltage. Disconnected deposit caused to high resistance. (j) Complete disappearance of the deposit.

V. CRYSTALLOGRAPHY AND CHEMICAL COMPOSITION OF DEPOSIT CONTAINING FILAMENTSReference Fujii, Arita, Takahashi and Fujiwara37
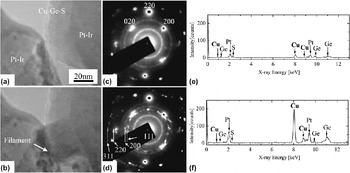
The crystal structure and chemical composition of the deposit were studied by observing real-time SAD patterns and by real-time EDX during application of voltage (Fig. 6). After the counter electrode had been positioned on the Cu-Ge-S [Fig. 6(a)], a voltage of 1 V was applied to the substrate. A clear deposit appeared as seen in Fig. 6(b). Its width was ∼40 nm. The SAD patterns corresponding to Figs. 6(a) and 6(b) are in Figs. 6(c) and 6(d). Here, the SAD patterns were from the wide area where the Pt-Ir substrate and the counter electrode were situated. The SAD pattern before voltage was applied [Fig. 6(c)] was composed of a faint background and Debye rings. This corresponded to the characteristics found in the TEM image [Fig. 3(b)], i.e., amorphous with nanocrystals. The clear spots in this pattern were caused by Pt-Ir. Using these spots as references, we concluded that the faint rings corresponded to the 111, 220, and 311 reflections from the Ge. During application of 1 V to the substrate, sharp spots appeared in the SAD patterns in addition to those in Fig. 6(c). They twinkled a great deal. This indicates that well-crystallized nanocrystals were generated by applying voltage, and their orientation frequently changed as the deposit grew. To analyze this process in detail, 1152 frames of video images for a total of 35 s were superposed as seen in Fig. 6(d). Relatively sharp spots that formed rings were identified. These rings had d-values similar to those of the 111, 200, 220, and 311 reflections from the Cu. These results clearly indicate that the main material forming the deposit was nanocrystals of Cu or diluted Cu alloy with either Ge and/or S.
(a and b) are TEM images before and during voltage was applied (1 V), respectively. (c and d) are corresponding SAD patterns. While voltage was applied, filament-like deposit and appearance of fine and sharp diffraction spots forming Debye-rings were identified. They were thought to be from Cu nanocrystals, four of which corresponded to reflection indices in (d). (e) Is EDX spectrum before and (f) is that during application of voltage (1 V). Relative concentration was estimated to be Cu:Ge:S = 4:4:2 in (e) before voltage was applied. This changed to Cu:Ge:S = 7:2:1 in (f) while voltage was applied.

The EDX spectra of the area obtained before and during the application of positive voltage (1 V), are shown in Figs. 6(e) and 6(f). While the sample position does not correspond to that in Figs. 6(a)–6(d), the deposit can be identified in Fig. 6(f) but not in Fig. 6(e). The sample was 8-nm-thick Cu-Ge-S, and the beam size for the EDX measurements was ∼10 nm. Therefore, the Pt peaks of the electrodes in the obtained spectra were superposed. The intensity of the Cu peak greatly increased when voltage was applied. By assuming thin foil approximation, the estimated composition of the deposit for Cu:Ge:S was 7:2:1 [Fig. 6(f)], while it was 4:4:2 without the deposit [Fig. 6(e)]. In summary, the deposit was an agglomeration of crystals with a relatively large amount of Cu.
VI. DISCUSSION ON SWITCHING MECHANISM
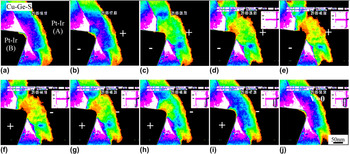
The pseudo color images in Fig. 5 were formed like those in Fig. 7, which gives us some details on the deposit. The color sequence is white, purple, blue, aqua blue, green, yellow, red, and black from bright to dark. The contrast in these TEM images may be influenced by several factors. First, the local density of the film needs to be mentioned. Of all the elements in the film, Cu has the largest atomic number. Therefore, the region with high Cu concentration is dark in contrast. Second, the thickness along the TEM electron beam (i.e., perpendicular to the image plane) may be another factor. The morphologic shape around the deposit in this experiment changed when voltage was applied. Thus, the growing deposit may have increased the thickness and darkened contrast in the local image. Third, Bragg reflection contrast is another factor. As previously described, Cu nanocrystals were formed and their orientation frequently changed when voltage was applied. Dark contrast appeared in the bright field TEM images that were observed in this work when the nanocrystals satisfied the Bragg condition. Twinkling in local contrast could be identified by carefully checking the movie images. Whatever the main factor was in determining image contrast, there must have been filaments containing a large amount of Cu in the regions with darker contrast.
Pseudo color images of Fig. 5. Color sequence from bright to dark is white, purple, blue, aqua blue, green, yellow, red, and black. (a and b) The aqua blue region expanded just at the top of the counter electrode. (c) The growth continued and the green region touched the substrate (just before the “Set” process). (d) The green region made perfect contact with the substrate (after the “Set” process). (e and f) The yellow and red regions simultaneously expanded from the counter electrode side. (g and h) The size of the deposit decreased by applying negative voltage. (i) The resistance changed to HRS (after the “Reset” process). (j) The image reverted almost to that of the original.

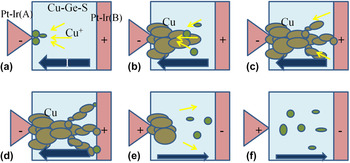
Starting from Fig. 7(a), the aqua blue region expanded just at the top of the counter electrode [Fig. 7(b)]. The growth continued when voltage was applied, and the green region touched the substrate [Fig. 7(c)]. The current magnitude reached the compliance value just afterwards [Fig. 7(c)], and the green region made perfect contact with the substrate [Fig. 7(d)]. The yellow and red regions simultaneously expanded from the counter electrode side and formed filament-like contrast even though the total area of the deposit did not demonstrate remarkable expansion [Figs. 7(e) and 7(f)]. The width of the filament-like red region was ∼10 nm. Although the details on the pseudo color map were altered by changing coloring conditions, this value may give some insights into the filament size included in the deposit. The size of the deposit decreased by applying negative voltage [Figs. 7(g) and 7(h)]. After Fig. 7(h), where the green region was almost detached from the substrate, the resistance changed to HRS even though the deposit still remained near the tip of the counter electrode [Fig. 7(i)]. Finally, the image reverted almost to that of the original [Fig. 7(j)]. The phenomenon that occurred in this procedure may be explained using Fig. 8 and taking these results into consideration. An electric field was generated by applying positive voltage to the substrate relative to the counter electrode and the Cu ions dispersing in Ge-S moved to the counter electrode (i.e., cathode). As a result, a small metallic deposit appeared at the top of the counter electrode [Fig. 8(a)]. As voltage continued to be applied, the deposit expanded toward the substrate and finally touched it [Figs. 8(b) and 8(c)]. At this stage, the conductive filament was connected to the counter electrode and the substrate, and the resistance state of Cu-Ge-S changed to LRS. By applying further voltage, the several filaments increased even though the overall size of the conductive region did not expand [Fig. 8(d)]. After this, the Cu-based filaments were dissolved into the solid electrolyte and shrank toward the counter electrode [Figs. 8(e) and 8(f)] by alternating the polarity of the voltage. Thus, the layer reverted to HRS. Resistance switching occurred at the substrate surface based on this model. The model explained here is one that has been proposed in previous reports.Reference Kozicki, Park and Mitkova10–Reference Kozicki, Ratnakumar and Mitkova12, Reference Waser and Aono19, Reference Waser, Dittmann, Staikov and Szot20 In other words, the switching mechanism proposed earlier was experimentally confirmed in this work.
Schematics of resistance switching. Yellow and dark-blue arrows correspond to flow of Cu ions and current flow, respectively. Plus (+) and minus (−) indicate polarity of electrodes. (a–d) Formation process of Cu-filaments connecting anode and cathode. (e and f) Erasure process of the filament by polarity change. For details, see text.

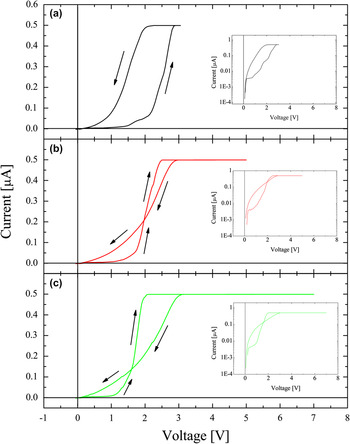
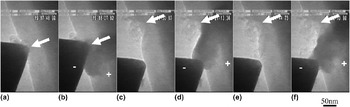
In the discussion above using Fig. 7, we explained that the sample reverted almost to the original state after the voltage cycle. However, the sample after the voltage cycle seemed to be slightly different from its initial state. Figure 9 plots the I-V curves for the first, second, and third cycles from the initial state. The retention properties of the material we studied were not good enough to be used for actual switching devices, and the deposit formed by positive voltage disappeared by keeping it at 0 V for ∼7 s. The resistance in LRS automatically changed to HRS without negative voltage. In this experiment, the Cu substrate was not used. Thus, the amount of Cu within the solid electrolyte must be depleted by forming Cu filaments. This is thought to be a reason of a short retention time. The threshold voltage in the first cycle, where resistance quickly started to change to LRS, was ∼2.25 V [Fig. 9(a)]. Here, the resistance ratio between HRS and LRS was ∼10 [at 1 V: inset of Fig. 9(a)]. The threshold voltage in the succeeding cycles was lowered to 1.83 V for the second and 1.50 V for the third cycles [Figs. 9(b) and 9(c)], while the resistance ratio at 1 V remained almost unchanged. This reduced threshold voltage indicated that the inside of the Cu-Ge-S layer had changed after the voltage cycle. Indirect information about this phenomenon was also obtained from TEM observations (Fig. 10). The positions indicated by the arrows in the images correspond. After a deposit had been formed and erased in the first voltage cycle [Figs. 10(a) and 10(b)], the contact position has slightly been moved to a neighboring region [Fig. 10(c)]. A deposit appeared [Fig. 10(d)] by applying positive voltage to the substrate. The deposit did not reach the substrate near the counter electrode but elongated into the region where it had formed during the first cycle. Iterative measurements were conducted without changing the contact position, and the deposit appeared at the same place [Figs. 10(e) and 10(f)]. Taking both the results in Figs. 9 and 10 into consideration, the regions where the deposit had initially formed had priority in resistance switching. As can be seen from Figs. 8(e) and 8(f), extremely small metallic nanocrystals (or embryosReference Hamada and Fujita39), which cannot easily be detected by SAD or conventional TEM, may have remained as residues after the deposit had been erased. These residual materials are thought to have acted as the nuclei of filaments and to have reduced the threshold voltage to form conductive filaments.
I-V curves of (a) 1st, (b) 2nd, and (c) 3rd cycles from initial state. Insets are graphs with logarithmic current as vertical axes. Note that the horizontal axis denotes the output voltage of SMU but not the actual voltage applied to the substrate.

TEM images of (a and b) 1st, (c and d) 2nd, and (e and f) 3rd cycles from initial state. The arrows indicate the corresponding position. Deposit appeared almost in same place in all cases even though contact position was changed between (b) and (c).

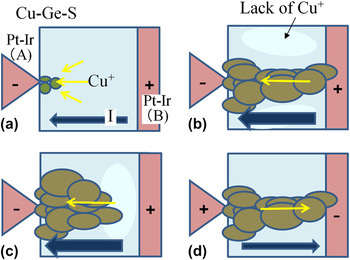
Looking at Fig. 4, the I-V curve indicates a crossover in the first quarter. This has not been reported in earlier works. The time to apply positive voltage was varied according to Fig. 9 where the maximum voltage was changed with a constantly increasing speed to discover why this phenomenon appeared. After the current magnitude reached the compliance value, the voltage actually applied to the sample should not be increased because of automatic change of the operation mode of SMU as described in Sec. II. Therefore, the main difference in these three curves relates to the time when voltage was applied and the deposit continued to grow. The voltage was applied for 12, 20, and 28 s in Figs. 9(a)–9(c). In Fig. 9(a), where voltage reverted to 0 V just after the current magnitude reached the compliance value, the voltage at which the current became smaller than the compliance value was much lower than the threshold voltage to obtain LRS, and there was no crossover. When the deposit expanded further [Figs. 9(b) and 9(c)], on the other hand, this voltage was higher than the threshold voltage, and there were crossovers in the I-V curves. This phenomenon can be explained as follows. The source of the material in this experiment that formed conductive filaments was only Cu ions diluted in the solid electrolyte Ge-S because electrodes made of highly ionizable materials (e.g., Cu and Ag) were not used. Therefore, the amount of Cu ions was limited, and a region with fewer Cu ions may have appeared near the deposit. This situation is different from that in the typical experiments that have been reported thus far.Reference Kozicki, Park and Mitkova10–Reference Kozicki, Ratnakumar and Mitkova12, Reference Waser and Aono19, Reference Waser, Dittmann, Staikov and Szot20 When voltage started to be applied, Cu ions gathered near the Pt-Ir electrode-A and were metallized as the deposit shown in Fig. 11(a). As growth continued, the deposit reached electrode-B, and resistance was LRS. The Cu content in the neighboring region was simultaneously diluted because no Cu ions were dissolved from electrode-B [Fig. 11(b)]. When the voltage was swept back from this condition, the connection between the two electrodes remained. However, further growth of the filaments introduced over-accumulated Cu around electrode-A [Fig. 11(c)]. Cu in this situation continued to move toward the electrode even after the state in Fig. 11(b), and the filaments within the deposit narrowed or were disconnected from electrode-B. As a result, resistance became higher than that in LRS. This was the origin of the crossover in the I-V curves. By applying weak negative voltage to electrode-B, there was a slight release of over accumulation, and the filaments may have connected two electrodes before erasure [Fig. 11(d)]. This is thought to be the reason as to why we observed a sudden increase in current at position-g in Fig. 4. The phenomena described here are characteristics of the present experiments using Cu-dispersed electrolytes and electrodes made of noble metals.
Schematics to explain over accumulation of Cu ions toward cathode. Yellow and dark-blue arrows correspond to flow of Cu ions and current flow, respectively. Plus (+) and minus (−) indicate polarity of electrodes. (a and b) By applying voltage, Cu ions are gathered near the cathode and enabled to form conducting filament. (c) Continuing voltage application, Cu ions continued to move toward the electrode and were over accumulated. The depletion region of Cu appears near the anode. (d) Release of over accumulation. Connection between two electrodes is recovered. For details, see text.

VII. SUMMARY AND CONCLUSION
We investigated the mechanism responsible for ReRAM switching using in situ TEM. Resistance switching in Cu-Ge-S films was clearly identified during the TEM observations. The formation and the erasure of a deposit containing conductive filaments inside a solid electrolyte clearly corresponded to on-and-off switching operations. The conductive filaments consisted of nanocrystals composed mainly of Cu. This indicates Cu ions moved when voltage was applied. In conclusion, the model of conductive-filament formation was experimentally demonstrated to occur by means of real-time observations.
For easy performance of experiments, we introduced the special constitution of ReRAM samples, such as high Cu concentration in the solid electrolyte, a tip-shaped electrode, nonuse of Cu electrode as a source of Cu ions. While this satisfies to realize our purpose of this work studying the dynamic formation and characterization of conductive filaments, in situ TEM studies using more realistic ReRAM devices are expected in the future to understand the switching phenomenon in detail. Experiments at low temperature will also be effective to reduce the influence by TEM electron beam.
ACKNOWLEDGMENTS
We wish to thank Mr. S. Yasuda (Sony Corporation) for his collaboration in fabricating the devices, and Drs. M. Moniwa, T. Yamaguchi, and M. Yoshimaru (Semiconductor Technology Academic Research Center) for the productive discussions we had with them. We are grateful to Dr. K. Hamada for developing our piezo TEM holder. The TEM-EDX analyses were performed at the Center for Advanced Research of Energy and Materials (CAREM) of Hokkaido University with the kind support of Prof. N. Sakaguchi, to whom also we are grateful. Our research was partially supported by a grant from the Global COE Program, “Center for Next-Generation Information Technology Based on Knowledge Discovery and Knowledge Federation,” made available by The Ministry of Education, Culture, Sports, Science and Technology (MEXT) of Japan, and by Grants-in Aid for Scientific Research (KAKENHI) from MEXT and the Japan Society for the Promotion of Science (JSPS) (Grant Nos. 21560681 and 22240022)