Implications
We evaluated temporal changes in fermentation characteristics and microbial community composition in rumens of sheep grazing a temperate pasture allocated at two distinct times in the day. Dynamic changes in relative abundances of particular bacterial groups, in synchrony with a substantial variation in ammonia concentration during the early stages of fermentation, can potentially alter how the grazing ruminant utilises nitrogen (N). Excess ammonia N in the rumen is often a major source of N in urine, and a reduction in urinary N is highly desirable since it is a major cause of N losses to water and air.
Introduction
Perennial ryegrass (Lolium perenne)-based pastures remain the largest source of nutrients for ruminants in many temperate regions across the globe, such as New Zealand and southern Australia. Herbage from these pastures often supplies excess N and moderate-to-low concentrations of water-soluble carbohydrates (WSC), which are major constraints for improving nitrogen use efficiency (NUE) at the animal level in pastoral farming. The fermentation process leading to enhanced NUE is often characterised by reduced ruminal ammonia concentrations and increased proportions of glucogenic volatile fatty acids (VFA) precursors (Gregorini et al., Reference Gregorini, Gunter and Beck2008). Reduced ammonia concentrations have been associated with potential reductions of urinary urea N excretion (Kingston-Smith and Theodorou, Reference Kingston-Smith and Theodorou2000), whereas greater proportions of glucogenic precursors are associated with the supply of additional energy, available to the animal as glucose (Huntington and Archibeque, Reference Huntington and Archibeque2000).
Concentrations of ammonia in the rumen are a consequence of various simultaneous processes. These include ruminal deamination of amino acids and degradation of plant N constituents, synthesis of microbial protein from ammonia, hydrolysis of urea from saliva, diffusion of urea across the rumen wall and absorption of ammonia from the rumen (De Visser et al., Reference De Visser, Valk, Klop, Van Der Meulen, Bakker and Huntington1997). Both the extent to which ammonia is produced and the extent to which ammonia is used for microbial protein synthesis (MPS) have important implications for N retention by ruminants (Nolan and Dobos, Reference Nolan and Dobos2005). Enhanced MPS can be expected from a more balanced consumption of fermentable carbohydrates and N by grazing ruminants. For example, increased in vitro MPS has resulted from using afternoon- v. morning-harvested forage (Brito et al., Reference Brito, Tremblay, Lapierre, Bertrand, Castonguay, Belanger, Michaud, Benchaar, Ouellet and Berthiaume2009).
This latter observation is of interest, because temperate forage species are known to change composition over the day. Diurnal increases in WSC concentrations in plant leaves as the day progresses, are often at the expense of NDF and CP concentrations (Delagarde et al., Reference Delagarde, Peyraud, Delaby and Faverdin2000), and often result in greater organic matter digestibility (OMD) and overall herbage nutritive value (Gregorini et al., Reference Gregorini, Gunter and Beck2008) in herbage offered to grazing ruminants later in the day.
Temporal changes in forage composition could change microbial activity in the rumen, and so affect NUE. However, the complex interactions between the different forms and amounts of plant N and plant fermentable carbohydrates within the rumen, particularly under grazing conditions, is far from being fully understood. The microbial community within the rumen is capable of adapting its degradation capability in response to changes in feed composition via changes in microbial composition and by changes in gene expression within a fixed community (Liu et al., Reference Liu, Zhang, Xue, Zhu and Mao2016; Mayorga et al., Reference Mayorga, Kingston-Smith, Kim, Allison, Wilkinson, Hegarty, Theodorou, Newbold and Huws2016). The objective of this study was to evaluate the effects of afternoon v. morning allocation of fresh herbage on time-related changes in measures of ruminal metabolism and microbial community composition in sheep grazing a ryegrass-based sward. These sets of measures include small subunit ribosomal RNA (rRNA) gene-based sequencing to characterise the composition of the bacterial, archaeal and ciliate protozoal communities in the rumen, to get a first insight into what is expected to be a complex set of relationships. We hypothesised that ruminal ammonia concentrations during the early stages of fermentation would be smaller, and glucogenic to lipogenic VFA concentrations would be greater, from sheep grazing a fresh strip of pasture during the afternoon, as a consequence of a more balanced ratio of fermentable carbon (C) to metabolisable N offered during this time of the day.
Material and methods
Animals and experimental design
The experiment was conducted during the spring of 2009 (October and November) at the Grasslands Research Centre, AgResearch Ltd, Palmerston North, New Zealand (NZ). Eight ruminally cannulated Romney wethers (52.3±1.8 kg live weight) were used to examine the effects of morning (AM; from 0800 h; n=4) v. afternoon (PM; from 1600 h; n=4) allocation of a new strip of grass, as described in Vibart et al. (Reference Vibart, Burke and Pacheco2011). Wethers grazed on the same strip for 24 h and were offered the same daily allowance (i.e. pre-grazing herbage mass). Wethers were offered fresh herbage daily, monitored closely by measurements of post-grazing height (mean ± SE: 6.1±0.4 cm). Estimates of daily dry matter (DM) intake, obtained from pre- and post-grazing herbage mass, were similar amongst allocation groups (1.2 kg DM/wether; 22.1 g DM/kg live weight) (Vibart et al., Reference Vibart, Burke and Pacheco2011).
After a 2-week adaptation phase, ruminal digesta samples were collected from all animals on days 15, 16 and 17 of the experiment, according to the following schedule. Samples were collected over the 3-day period at 0800h (immediately before new AM herbage allocation), 1200h, 1600h (immediately before new PM herbage allocation), 2000h, 2400h on day 15; at 0400, 1000, 1400, 1800, 2200h on day 16; and at 0200 and 0600 h on day 17. Ruminal fermentation data from the adaptation phase have been presented elsewhere (Vibart et al., Reference Vibart, Burke and Pacheco2011), and the focus of this paper is on the 3-day sampling phase. Temporal changes over a full 24-h day, with data points every 2h, were investigated by combining the data collected over this intensive sampling phase.
Weather data were obtained from the local weather station (AgResearch, Grasslands Research Centre, Palmerston North). A total of 85 mm of rainfall occurred during the experimental period, with daily air temperatures (±SE) of 15.5±0.45°C maximum, 6.7±0.88°C minimum and 3.9±0.78 h/day sunshine. Only 5 out of 16 days had more than 5 h of sunshine.
Herbage and ruminal digesta sampling
Herbage samples from the ryegrass-based pasture (81% perennial ryegrass, 19% white clover, DM basis) were collected immediately before new herbage allocation (0800 and 1600 h). Estimates of plant chemical composition (organic matter, WSC, CP, NDF, ADF) and digestibility (OMD) were obtained by near IR reflectance spectroscopy (NIRS; FeedTECHTM, Palmerston North, NZ).
Ruminal digesta samples (liquid + solid; mid-rumen) were collected via ruminal cannulas equipped with a sampling tube that remained in site at all times. The sampling tube comprised a polyurethane tube (27 cm, 8 mm O.D., 5.5 mm I.D.) connected to a perforated stainless steel tube (9 cm) which remained immersed in the rumen. Samples were obtained by gentle suction using a 50 ml syringe connected to the outer end of the tube. Samples were placed in ice, and immediately transported to the laboratory. Once there, rumen fluid pH was measured using a MeterLab® PHM210 (Radiometer Pacific Limited, Copenhagen, Denmark), calibrated immediately before each set of readings using pH 4.0 and 7.0 standards. For ammonia analysis, subsamples (1.0 ml) were collected from strained liquor (squeezed through two layers of cheesecloth), acidified with 15 µl of concentrated hydrochloric acid, mixed and centrifuged (14 000×g for 15 min at 4°C). The supernatant was transferred and frozen (–20°C) for ammonia determination (Weatherburn, Reference Weatherburn1967). For VFA analysis, subsamples (1.5 ml) of strained liquor were acidified with phosphoric acid (H3PO4; 0.1 ml of 8.2%, w/w) in microcentrifuge tubes and centrifuged (14 000×g for 15 min at 4°C). The supernatant was transferred and frozen (–20°C). Volatile fatty acids were determined by GLC (Carlo Erba 5380, capillary column, 15 m×0.53 mm ID, 1.00 µm film; Carlo Erba, Milan, Italy) (Attwood et al., Reference Attwood, Klieve, Ouwerkerk and Patel1998).
Nucleic acid extraction, amplification and pyrosequencing of bacterial, archaeal and ciliate protozoal small subunit ribosomal RNA marker genes
Ruminal digesta samples were collected at the same time and following the same collection procedure as described above, placed in ice, and frozen at −20°C within 15 min of collection. Total nucleic acids were extracted from 30 mg of freeze-dried and homogenised ruminal digesta samples using combined bead beating with phenol–chloroform–isoamyl alcohol followed by a column purification protocol (Kittelmann et al., Reference Kittelmann, Seedorf, Walters, Clemente, Knight, Gordon and Janssen2013). Extracted DNA was quantified and normalised before PCR amplification of bacterial and archaeal 16S rRNA and ciliate protozoal 18S rRNA genes using a unique barcoded primer for each template and each microbial group, as described by Kittelmann et al. (Reference Kittelmann, Seedorf, Walters, Clemente, Knight, Gordon and Janssen2013). The primer pairs used were Ba9f and Ba515Rmod1 for bacteria, Ar915aF and Ar1386R for archaea, and Reg841F and Reg1302R for ciliate protozoa (Kittelmann et al., Reference Kittelmann, Seedorf, Walters, Clemente, Knight, Gordon and Janssen2013). More details provided in Supplementary Table S1. PCR products were verified by agarose gel electrophoresis, quantified, normalised and pooled into the three microbial groups. Each pool was loaded onto an agarose gel. The excised bands were purified using a gel slice column extraction kit, quantified, normalised and mixed at a ratio of 5 : 1 : 1 (bacteria : archaea : protozoa). The final mixed pool was sent to MWG Eurofins (Ebersberg, Germany) for 454 Titanium pyrosequencing.
Sequence data were processed and analysed using QIIME software as described by Caporaso et al. (Reference Caporaso, Kuczynski, Stombaugh, Bittinger, Bushman, Costello, Fierer, Peña, Goodrich, Gordon, Huttley, Kelley, Knights, Koenig, Ley, Lozupone, McDonald, Muegge, Pirrung, Reeder, Sevinsky, Turnbaugh, Walters, Widmann, Yatsunenko, Zaneveld and Knight2010). Reads of >400nt from bacteria and archaea, and >200 nt from protozoa, were included in the analyses. Sequences were assigned to samples by the unique barcode, quality checked, filtered and clustered into operational taxonomic units (OTUs) based on sequence similarity (Kittelmann et al., Reference Kittelmann, Seedorf, Walters, Clemente, Knight, Gordon and Janssen2013). Clustering of sequences into OTUs was at a 97% threshold using the UCLUST method (Edgar, Reference Edgar2010) for bacteria and archaea, and at 100% using QIIME’s prefix–suffix method for ciliate protozoa. Small subunit rRNA gene sequences were assigned to taxonomic groups by BLAST, using SILVA 123 for bacteria (Quast et al., Reference Quast, Pruesse, Yilmaz, Gerken, Schweer, Yarza, Peplies and Glöckner2013), which contains modified taxonomic identifiers for rumen bacteria (Henderson et al., Reference Henderson, Yilmaz, Kumar, Forster, Kelly, Leahy, Guan and Janssenaccepted), RIM-DB for archaea (Seedorf et al., Reference Seedorf, Kittelmann, Henderson and Janssen2014) and a custom database for ciliate protozoa based on the phylogenetic and taxonomic scheme by Kittelmann et al. (Reference Kittelmann, Devente, Kirk, Seedorf, Dehority and Janssen2015).
Repset sequences from selected OTUs were aligned with reference 16S rRNA gene sequences using ClustalW (Thompson et al., Reference Thompson, Higgins and Gibson1994) in MEGA6 (Tamura et al., Reference Tamura, Stecher, Peterson, Filipski and Kumar2013), with a gap penalty of 15, a gap extension penalty of 6.66 and a transition weight of 0.5. The alignment was then manually checked and misaligned nucleotides were corrected. The alignment was trimmed to only the 361 nucleotide region that was covered by the amplicons, corresponding to positions 61 to 418 of the 16S rRNA gene sequence of Kandleria vitulina RL2 (GenBank accession NR_041305.1). Evolutionary distances were calculated using the Jukes and Cantor (Reference Jukes and Cantor1969) method giving equal weight to all positions, and a phylogenetic tree constructed using the Neighbor-Joining method (Saitou and Nei, Reference Saitou and Nei1987), with bootstrap analysis to estimate the robustness of the branch points (Felsenstein, Reference Felsenstein1985).
Quantitative PCR (qPCR) was used to assess the abundance of bacterial 16S rRNA genes (Kittelmann and Janssen, Reference Kittelmann and Janssen2011). A sample of the extracted DNA for each sample was measured with three different dilutions, each in duplicate (Kittelmann et al., Reference Kittelmann, Seedorf, Walters, Clemente, Knight, Gordon and Janssen2013) using a Rotor-Gene 6000 analyser (Corbett Life Science, Concorde, New South Wales, Australia). Absolute gene copy numbers in the samples were calculated using standard curves and expressed relative to the amount of freeze-dried rumen sample used for the DNA extraction.
Statistical analysis
Dependent variables (i.e. ruminal fermentation characteristics, microbial relative abundance and 16S rRNA gene copies determined by qPCR) were analysed using SAS software (version 9.4; SAS Institute Inc., Cary, NC, USA). A mixed model procedure was used in SAS; the model included time of allocation (AM, PM), day of sampling (days 15, 16, 17), time of sampling relative to feed allocation (0 to 24 h) and corresponding interactions as fixed effects, with animal as a random effect. The model term day of sampling was deemed non-significant for all fermentation characteristics and most microbial relative abundance variables tested, and was therefore withdrawn from the model.
If the relative abundance of an archaeal, bacterial or ciliate protozoal taxon exceeded 1% of the community in at least one of the 96 samples, that taxon was included in the statistical analyses. Following this criterion, five of the nine archaeal taxa that included >99.98% of total archaeal sequence reads, 52 of the 460 bacteria taxa and 93.91% of the bacterial sequences, and six of the 17 ciliate protozoal taxa and 99.95% of the ciliate protozoal sequence reads, were retained. To evaluate significant abundance of taxa between time of allocation across time of sampling after allocation (0 to 24 h), taxon abundance data generated in QIIME were exported into Microsoft Excel (Microsoft Corp., Redmond, WA, USA). Student’s t-tests using a two-tailed distribution were performed. P-values<0.05 were considered statistically significant (with smaller values providing stronger evidence for significance) and P-values ⩾0.05 and <0.10 were considered a trend.
Canonical correlation (CC) analysis was conducted to examine the multivariate associations between two sets of variables. The first set of variables (8) included ruminal fermentation characteristics such as acetate, propionate, butyrate, valerate, isobutyrate and isovalerate concentrations, ammonia concentration and digesta pH. The second set of variables consisted of the relative taxonomic abundance of selected bacteria, archaea and ciliate protozoa. The associated ‘canonical scores’ for each individual in the data were obtained and explored via scatterplots. Moreover, ‘association’ scores between pairs of variables in the two sets were computed in the chosen CC space and visualised as clustered image maps (heatmaps) (González et al., Reference González, Cao, Davis and Déjean2012).
Discriminant analyses (partial least squares) of fermentation characteristics and of bacterial, archaeal and protozoal community composition data were used to identify the impact of the ‘early v. late’ ruminal sample collection (González et al., Reference González, Cao, Davis and Déjean2012); details can be found in the Supplementary material (the ‘Effect of timing of sample collection relative to feeding’ section).
Results
Diet composition, intake and ruminal fermentation
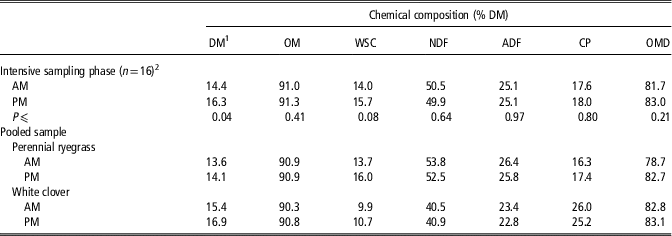
Herbage DM (P=0.04), and to a lesser extent WSC concentration (P=0.08), were greater for the PM group; all other chemical composition variables were similar (Table 1). These values were consistent with those of the individual species in the sward (i.e. perennial ryegrass and white clover), but the use of a pooled sample for chemical analysis of individual species (i.e. n=1) precluded statistical analysis.
Chemical composition of herbage from a ryegrass-based pasture offered to sheep either in the morning (AM) or in the afternoon (PM)

DM=dry matter; OM=organic matter; WSC=water-soluble carbohydrates; OMD=organic matter digestibility.
1 Per cent of wet weight.
2 Number of forage samples collected from each allocation group.
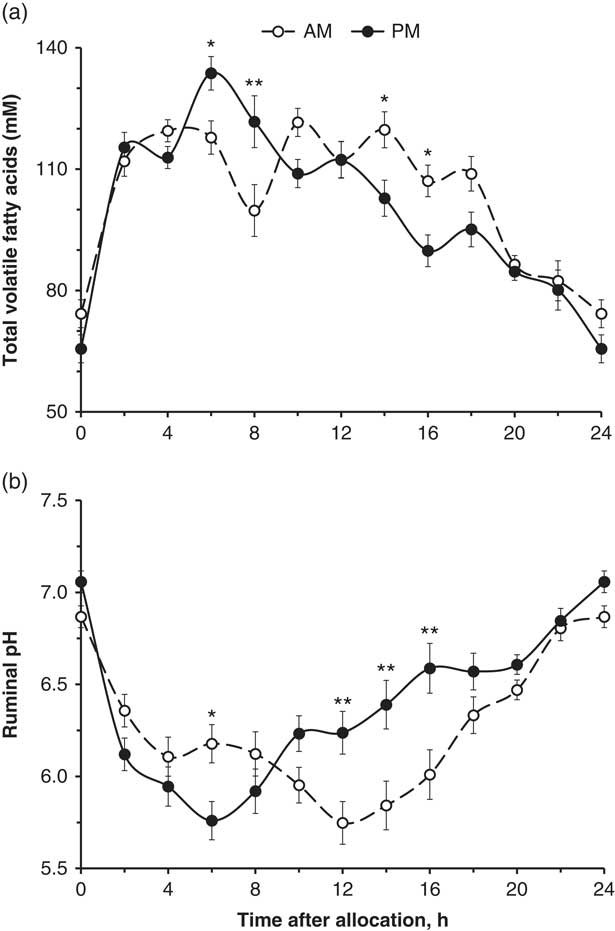
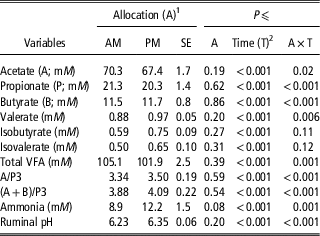
Despite the relatively similar chemical composition of the herbage, mean ammonia concentrations tended (P=0.08) to be greater for the PM group (Table 2), but the 24-h pattern (time relative to allocation) varied considerably for all variables measured (P⩽0.001). There was a significant interaction between time of allocation and time of sampling relative to feed allocation for a number of variables measured. For example, total VFA concentrations from the PM group were greater at 6 h (P=0.04) and 8 h (P=0.004) after a new allocation (‘post-allocation’), whereas total VFA concentrations from the AM group were greater at 14h (P=0.03) and 16 h (P=0.02) post-allocation (Figure 1a). The daily pattern of ruminal pH mirrored the daily VFA pattern; ruminal digesta pH values were smaller from the PM group at 6 h (P=0.02) post-allocation, whereas smaller pH values from the AM group were found at 12h (P=0.006), 14h (P=0.002) and 16 h (P=0.001) post-allocation (Figure 1b).
Twenty-four-hour patterns of total volatile fatty acids (mM) (a) and ruminal pH (b) from sheep grazing a ryegrass-based pasture allotted either in the morning (AM; ○) or in the afternoon (PM; ●). Patterns described relative to the time of new allocation of pasture. The full length of the error bars (above and below mean values) represents 2 SE. *P<0.05; **P<0.01; ***P<0.001.

Mean ruminal fermentation characteristics of sheep grazing a ryegrass-based pasture offered either in the morning (AM) or in the afternoon (PM)

1 Time of allocation of a fresh strip of pasture (AM 0800 h v. PM 1600h).
2 Time of sampling relative to allocation (0 to 24 h).
3 Measures of non-glucogenic to glucogenic volatile fatty acids (VFA)=ratios of acetate to propionate and (acetate + butyrate) to propionate.
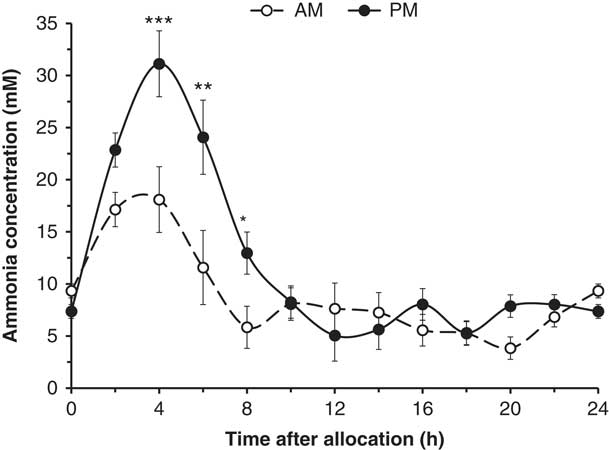
A significant interaction between time of allocation and time of sampling relative to feed allocation (P<0.001) was also found for ammonia. Ammonia concentrations from the PM group were greater at 4h (P<0.001), 6h (P=0.001) and 8 h (P=0.05) post-allocation of new herbage, whereas concentrations were similar for all the other time points measured (Figure 2).
Twenty-four-hour patterns of ammonia concentration (mM) from sheep grazing a ryegrass-based pasture allotted either in the morning (AM; ○) or in the afternoon (PM; ●). Patterns described relative to the time of new allocation of pasture. The full length of the error bars (above and below mean values) represents 2 SE. *P<0.05; **P<0.01; ***P<0.001.

Concentrations of the branched-chain VFA isobutyrate and isovalerate differed significantly with time of sampling relative to fresh herbage allocation (P<0.001), but the interaction between time of allocation and time of sampling relative to feed allocation (AM v.PM) was not significant (P=0.11 and P=0.12 for isobutyrate and isovalerate, respectively) (Table 2). Greater numerical values were found for the sheep receiving the PM allocation for both branched-chain VFA during most of the 24-h period (Supplementary Figure S1).
Microbial community composition
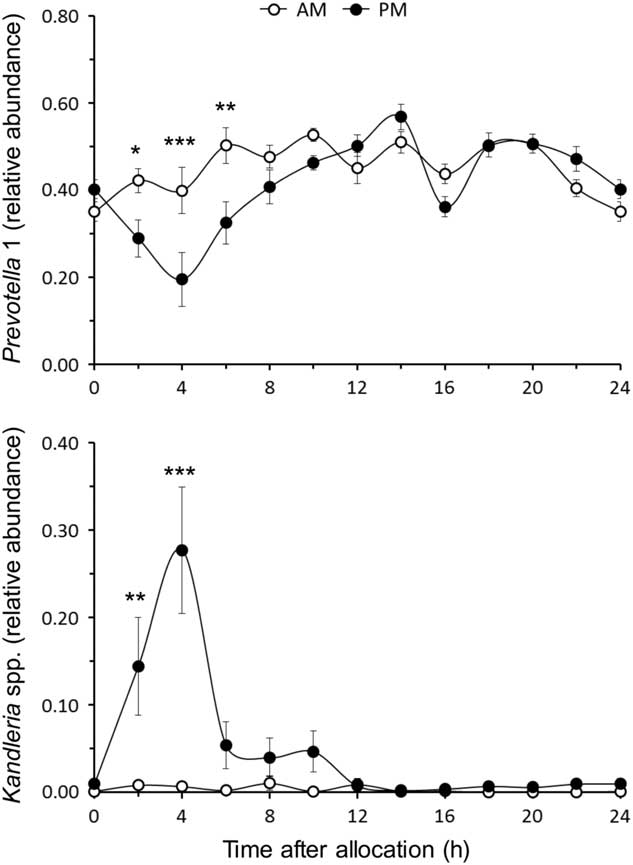
Fourteen bacterial taxa were detected at mean relative abundances of >1%, based on amplified 16S rRNA gene sequences (Supplementary Table S2). The relative abundances of Prevotella 1 (the most abundant bacteria present) (P=0.04), Bacteroidales RF16 group (P=0.005) and Fibrobacter spp. (P=0.008) were greater for the AM group, whereas the relative abundance of the genus Kandleria spp. was greater (P=0.04) for the PM group. Of these taxa, only Prevotella 1 (P=0.04) and Kandleria (P<0.001) showed a significant interaction between time of allocation and time of sampling relative to feed allocation (Supplementary Table S2).
Bacterial community composition (i.e. relative abundances) showed the greatest changes in pattern during the first 8 h post-allocation of a fresh strip of herbage. Relative abundances of Prevotella 1 were greater at 2 h (P=0.05), 4 h (P=0.003) and 6 h (P=0.01) after AM allocation of new herbage, whereas relative abundances of Kandleria were greater at 2 h (P=0.003) and 4 h (P<0.001) after PM allocation (Figure 3). In total, 636 OTUs were assigned to Kandleria spp., with e-values of 0 to 1×10−93. 16S rRNA gene sequences from the 6 largest OTUs assigned to Kandleria spp., making up 89.4% of all Kandleria reads, were used to construct a phylogenetic tree that included sequences from cultured isolates. This confirmed the close relationship of the amplified genes to those of Kandleria spp. (Supplementary Figure S2).
Twenty-four-hour patterns of relative abundance of Prevotella 1 and Kandleria spp. in rumens of sheep grazing a ryegrass-based pasture allotted either in the morning (AM; ○) or in the afternoon (PM; ●). Patterns described relative to the time of new allocation of pasture. The full length of the error bars (above and below mean values) represents 2 SE. *P<0.05; **P<0.01; ***P<0.001.

Of the bacteria that had mean abundances of <1%, only the genus Ruminococcus 2 was significantly different between the allocation groups, and was more abundant in the PM group (P=0.04). This genus also showed a significant interaction between time of allocation and time of sampling relative to feed allocation (P=0.008).
Sheep from the PM group showed a trend (P=0.08) towards a greater relative abundance of members of the Methanobrevibacter ruminantium clade compared with the AM group (Supplementary Table S2). The relative abundances of selected ciliate protozoa were similar across allocation groups. The 24-h pattern (time relative to allocation) varied considerably for most archaea and all ciliate protozoa (P⩽0.05).
Bacterial 16S rRNA genes were quantified using qPCR to estimate the total number of bacterial cells present in each sample. Mean bacterial gene copies per gram of dried rumen contents were similar (3.9 ×10¹¹ v. 4.2×10¹¹ copies for the AM and PM groups, respectively).
Canonical correlation analyses
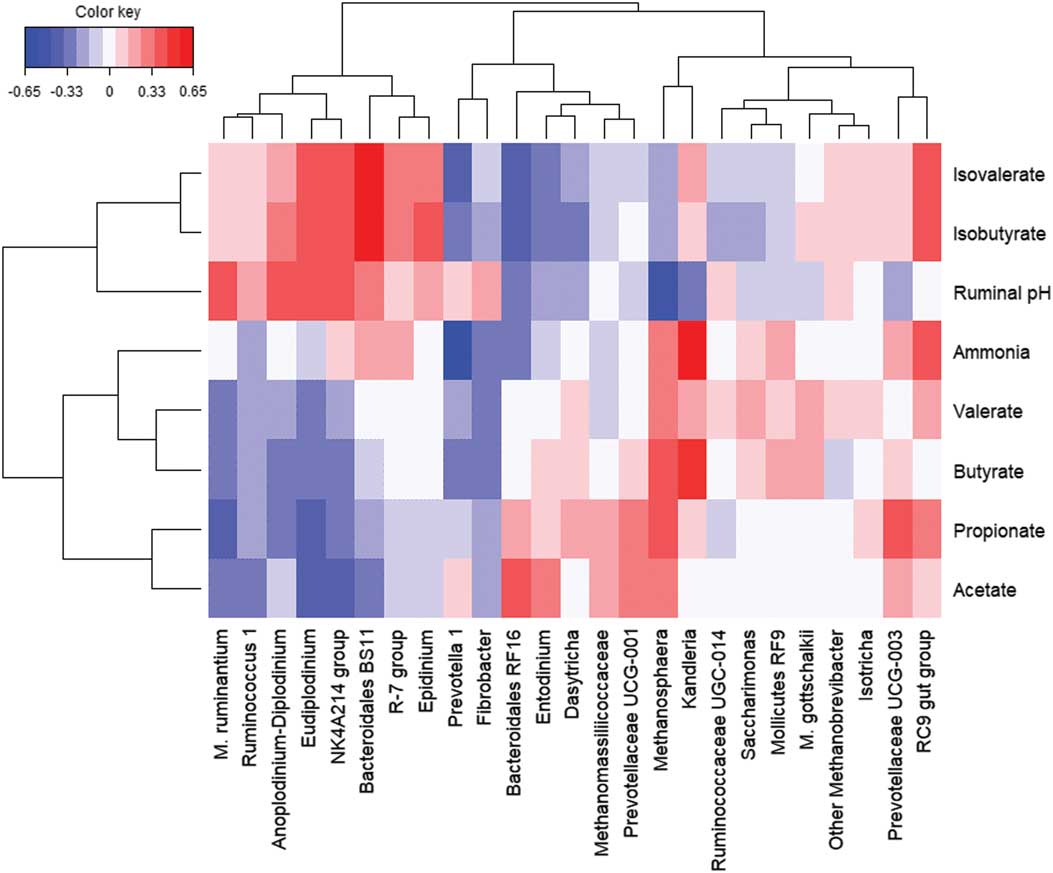
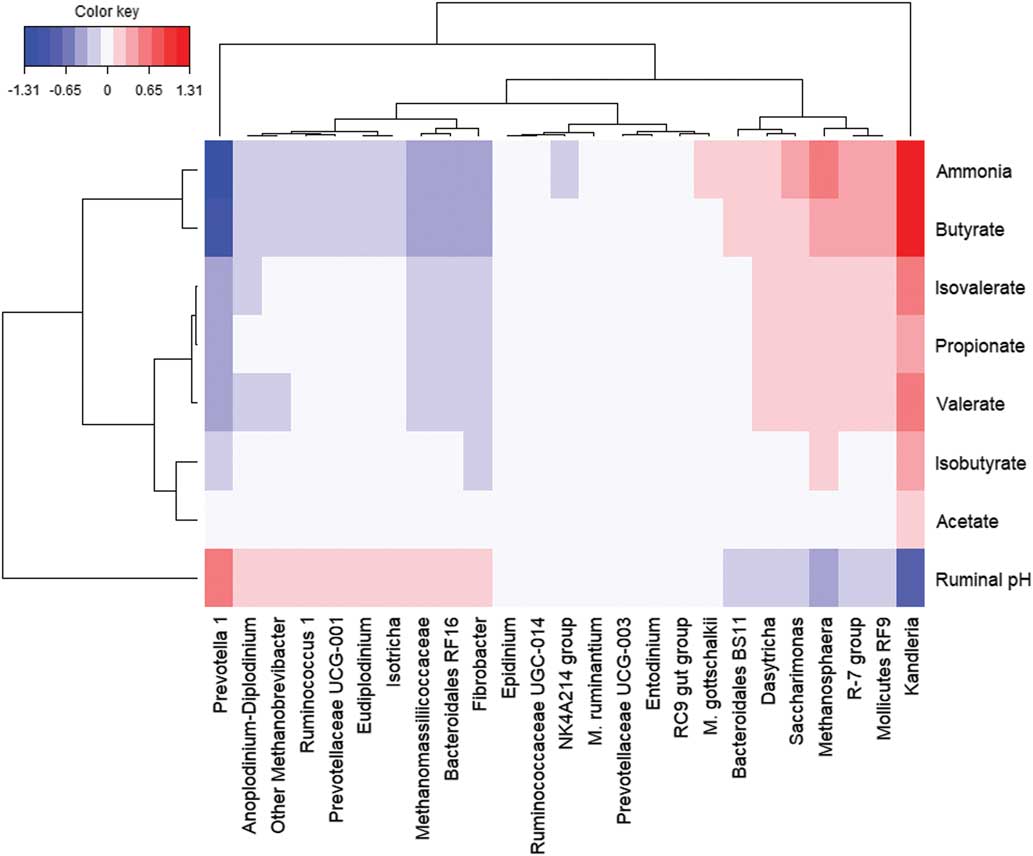
We looked for correlations between the relative abundances of microbial taxa and rumen parameters. For this, we restricted the analysis to bacterial taxa with mean relative abundances of >1%, reasoning that these were likely to be the largest contributor to product formation in the rumen. Moderate-to-low pairwise correlations (−0.61 to 0.65) were obtained between ruminal fermentation characteristics (i.e. acetate, propionate, butyrate, valerate, isobutyrate and isovalerate concentrations, ammonia concentration and digesta pH) and relative taxonomic abundance of predominant bacteria, archaea and ciliate protozoa (Figure 4). Despite these moderate to low pairwise correlations, the first four CC were high; 0.92, 0.88, 0.81 and 0.79 for CC one to four, with the remaining CC<0.75. Across both sets of variables (fermentation characteristics and microbial abundance), the first canonical dimension showed a strong contrast between Prevotella 1 and Kandleria spp. in terms of digesta pH, in clear contrast with ammonia and butyrate concentration (Figure 5).
Clustered image map of pairwise correlations between measures of sheep ruminal fermentation (i.e. concentrations (mM) of acetate, propionate, butyrate, valerate, isobutyrate, isovalerate and ammonia, and digesta pH) and relative abundance of selected bacteria, archaea and ciliate protozoa.

Clustered image map of canonical associations between measures of sheep ruminal fermentation (i.e. concentrations (mM) of acetate, propionate, butyrate, valerate, isobutyrate, isovalerate and ammonia, and digesta pH) and relative taxonomic abundance of selected bacteria, archaea and ciliate protozoa. Only canonical correlation (CC) dimension 1 is shown (CC=0.92).

Discriminant analysis separated early (i.e. samples collected ⩽8 h) and late (samples collected ⩾14 h) rumen sampling periods after a new allocation of a fresh strip of grass (Supplementary Figure S3). Details can be found in Supplementary material (the ‘Effect of timing of sample collection relative to feeding’ section).
Discussion
Hypothetically, allocating PM v. AM fresh herbage from pasture would result in a divergent fermentation process because of a more balanced ratio of fermentable C to metabolisable N offered to ruminants. Changes in diurnal nutritive value have been attributed to an increase in photosynthates, particularly in the upper layers of the sward. These changes often lead to a passive dilution of NDF and CP concentrations. Although results found in this experiment sustain this premise, minimal increases in afternoon DM and WSC concentrations were offset by minimal reductions in NDF, but not by CP concentrations (Table 1). Unseasonal weather conditions during the trial (reduced hours of sunshine in particular) were associated with smaller differences in WSC accumulation than expected.
Although daily averages of the fermentation characteristics and most of the microbial groups were minimally affected by time of allocation, most variables measured showed highly dynamic temporal changes throughout the 24-h period. All measures of fermentation and most microbial community composition data showed dynamic changes in concentrations and population dynamics, respectively, with substantial temporal changes occurring within the first 8h of allocating a new strip of herbage. The dynamic changes in the relative abundances of bacterial groups (Kandleria in particular and to a lesser extent Prevotella 1) in synchrony with the substantial diurnal variation in ammonia concentrations, has potential effects on the efficiency by which N is utilised by the grazing ruminant.
In addition, the frequency of sample collection and timing relative to the time of allocation of a new strip of herbage in rotationally grazed systems needs to be emphasised, to avoid using daily average data that prevents us from capturing the highly dynamic nature of these temporal changes. Both concepts are discussed in more detail below.
Herbage characteristics and ruminal fermentation
In our study, the changes in ruminal fermentation were minimal in response to the herbage allocation groups; only mean ammonia concentrations tended to be greater for the PM group (Table 2). Added to the trend for increased PM ammonia concentrations, increased numerical concentrations of the protein-derived branched-chain VFA isobutyrate and isovalerate (from the metabolism of valine and leucine, respectively) support either increased ruminal degradation of plant N constituents or decreased synthesis of microbial protein from ammonia occurring during the first 2 to 8 h post-allocation.
Microbial community composition and ruminal fermentation
We examined the temporal changes in the relative taxonomic abundance of bacteria, archaea and ciliate protozoa in the rumen of wethers by sequencing small subunit rRNA genes. Members of Bacteroidales (Prevotella 1, BS11 group, RC9 gut group, RF16 group, and other Prevotella), Clostridiales (R-7 group, Ruminococcus 1), Erysipelotrichales (Kandleria spp.), Fibrobacterales (Fibrobacter spp.) and Mollicutes (RF9 group) were present at high abundances in ruminal digesta samples. Of these, Prevotella 1 was the most abundant bacterial group, and comprised 46% (AM group) and 42% (PM group) of the bacterial rRNA gene copies in the samples. These results are in agreement with previous ruminal characterisations of the bacterial population in ruminants fed forage-based diets (Liu et al., Reference Liu, Zhang, Xue, Zhu and Mao2016).
Although daily mean values of most of the fermentation variables measured were similar, relatively small changes in forage chemistry, and larger changes in the relative abundance of the microbial community, appeared to affect the daily pattern of fermentation. Notably, both sets of variables (fermentation characteristics and microbial relative abundances) showed substantial changes occurring during the first 8 h post-allocation. Substantial changes in liquid- and solid-associated bacterial communities have been reported during both primary (1 and 2 h) and secondary (4 to 8 h) colonisation of fresh perennial ryegrass in vitro (Belanche et al., Reference Belanche, Newbold, Lin, Stevens and Kingston-Smith2017).
Most notably amongst ruminal fermentation characteristics, ammonia concentrations in the rumen showed a substantial temporal variation (Figure 2). Ammonia concentrations exhibited a sharp rise in concentration during the first 8 h after fresh feed allocation, and this rise was considerably greater for digesta contents from the PM group. Mean ammonia concentrations in rumen of the PM group rose from approximately 7 to 23 mM in the first 2 h, and then to 31 mM at 4 h post-allocation (peak concentration), whereas the AM group rose from 9 to 17 mM in the first 2 h, and then to 18 mM at 4 h post-allocation. Concentrations of ammonia were 1.7-, 2.0- and 2.2-fold greater in the rumen of PM wethers at 4, 6 and 8 h after allocation, respectively, compared with AM wethers. At these time points, ammonia concentrations in the ruminal fluid (PM group in particular) vastly exceeded those required for maximal rates of fermentation (Mehrez et al., Reference Mehrez, Ørskov and McDonald1977).
Varying bacterial community composition (i.e. relative abundances) in ruminal digesta contents from the two allocation groups may have contributed to differences in ammonia concentrations via proteolytic activity and/or microbial metabolism and growth patterns. A crucial aspect of the N cycle in ruminal bacteria is that ammonia is the preferred N source for growth (Pittman and Bryant, Reference Pittman and Bryant1964). An early post-allocation rise in ammonia concentrations in PM rumens occurred simultaneously with sharp increases in the relative abundance of Kandleria spp. and with a decline in the relative abundance of Prevotella 1 (Figure 3). A high ammonia concentration during the primary fermentation stage of fresh grass (up to 2 h after feeding) has been associated with early prevalence of Prevotella 1 in the bacterial community (Belanche et al., Reference Belanche, Newbold, Lin, Stevens and Kingston-Smith2017), acting synergistically with ammonia-hyperproducing bacteria degrading fresh temperate herbage (Attwood et al., Reference Attwood, Klieve, Ouwerkerk and Patel1998). The predominant genus Prevotella has major roles in carbohydrate and nitrogen metabolism, with a known nutritional versatility to support growth (Stevenson and Weimer, Reference Stevenson and Weimer2007).
The secondary fermentation stage, in contrast, showed a sharp rise in the relative abundance of Kandleria in rumens of the PM group (Figure 3), in synchrony with a sharp rise in ammonia concentration (Figure 2). Kandleria spp. ferment carbohydrates to produce lactic acid (Salvetti et al., Reference Salvetti, Felis, Dellaglio, Castioni, Torriani and Lawson2011). Homolactate fermenters like Kandleria generate a net gain of only two ATP per glucose, and recent analyses of four isolates and five genomes appear to confirm this assumption (Kumar et al., Reference Kumar, Treloar, Teh, Henderson, Attwood, Waters, Patchett and Janssen2018). In contrast, net ATP yields by ruminal Prevotella spp. are predicted to be three or more per glucose (Howlett et al., Reference Howlett, Mountfort, Turner and Roberton1976). Net ATP formation is the means of coupling fermentation to cell growth and division, and greater net ATP yields are associated with the formation of greater cell numbers by a population of microbes. Assuming Kandleria conserve only two ATP per mol of glucose, less N capture by microbial growth is expected at this stage from the PM group. Conversely, when Prevotella spp. are more abundant, their greater growth yields are postulated to result in greater N flowing to microbial biomass formation, reducing ruminal ammonia, perhaps by direct use or by increased uptake of amino acids that are then not deaminated. Other species with similar metabolisms are also likely to be involved. Taken together, these results along with the consistently greater (numerically) isobutyrate and isovalerate concentrations suggest that the findings from the PM group are the result of lower MPS, rather than greater protein degradation of plant N constituents. Associated with these changes, the PM herbage with a numerically greater concentration of highly fermentable carbohydrates may have increased the relative number of bacteria associated with the production of larger quantities of lactic acid (not measured in our study) and total VFA, with a consequent drop in pH at the earlier stages of fermentation (Figure 1).
There was also an association between Kandleria abundance and butyrate concentration, although culture- and genome-based studies showed that these bacteria do not form butyrate (Kumar et al., Reference Kumar, Treloar, Teh, Henderson, Attwood, Waters, Patchett and Janssen2018). A similar link to increased butyrate formation associated with increased populations of Sharpea spp. was reported in sheep fed alfalfa pellets (Kamke et al., Reference Kamke, Kittelmann, Soni, Li, Tavendale, Ganesh, Janssen, Shi, Froula, Rubin and Attwood2016). Sharpea is closely related to Kandleria and do not form butyrate (Kumar et al., Reference Kumar, Treloar, Teh, Henderson, Attwood, Waters, Patchett and Janssen2018), but a plausible explanation is that lactate formed by Sharpea is further metabolised to butyrate by yet other bacteria (Kamke et al., Reference Kamke, Kittelmann, Soni, Li, Tavendale, Ganesh, Janssen, Shi, Froula, Rubin and Attwood2016).
The clustered image map of canonical associations between measures of fermentation and microbial community composition (bacteria, archaea and ciliate protozoa) shows a different pattern between AM and PM groups (Supplementary Figure S4). The above-mentioned association between Prevotella, Kandleria and ammonia concentration in rumens of the PM group is distinct from the association of the branched-chain VFA isobutyrate and isovalerate, and the bacteria of the BS11, Ruminococcaceae NK4A214 and Prevotellaceae UCG-001 groups. Alternatively, rumens of the AM group had greater relative abundances of Prevotella 1, Bacteroidales RF16 group and Fibrobacter spp. Fibrobacter is a fibre (cellulose) digesting genus, associated with the solid phase of rumen contents as it attaches to the plant cell wall (Béra-Maillet et al., Reference Béra-Maillet, Ribot and Forano2004). These bacteria are found in a well-adapted rumen with a constant supply of food and water, heavily buffered by saliva. These characteristics are consistent with a steadier intake rate throughout the day from allocating of a new strip of herbage in the morning compared with the afternoon (Orr et al., Reference Orr, Penning, Harvey and Champion1997).
The archaeal community structure did not vary between allocation groups, and only three clades of methanogens (M. ruminantium clade, Methanosphaera spp. and family Methanomassiliicoccaceae) showed significant temporal (i.e. time of sampling relative to time of allocation) changes. The dominance of Methanobrevibacter gottschalkii and Methanobrevibacter ruminantum clades in our study are in agreement with rumen archaea of sheep fed pasture (Seedorf et al., Reference Seedorf, Kittelmann and Janssen2015).
The relative abundances of ciliate protozoa communities were similar across allocation groups. Changes in herbage chemistry may not have been sufficient to override differences in the protozoal communities from individual animals. Protozoal communities in the rumen of dairy cows were similar across two distinct diets such as a pasture and a total mixed ration (forage-to-concentrate ratio 56 : 44) (de Menezes et al., Reference de Menezes, Lewis, O’Donovan, O’Neill, Clipson and Doyle2011). Even these dietary changes were unable to override differences amongst individual animals, most likely attributable to the selective retention of protozoans in the rumen (Jouany et al., Reference Jouany, Demeyer and Grain1988).
In conclusion, under the grazing conditions tested in this study, the greatest rumen microbial community differences between allocation groups were seen in bacteria. Relative abundances of the different bacterial groups demonstrated connectivity between timing of fresh herbage allocation, pasture composition and fermentation characteristics, ammonia concentration in particular. An association between a transient, increased abundance of Kandleria, largely at the expense of Prevotella 1, in synchrony with increased ammonia concentrations during the early stages of PM allocation fermentation has been established, and further studies with a larger number of animals are clearly warranted. Potential temporal changes in intake rate along with changes in digesta pH, ammonia concentration/production and shifts in lactic acid-producing bacteria remain to be fully elucidated. Ruminal losses of N can account for up to 30% of ingested N, and represent a major environmental liability. Interest in understanding the conditions for efficient ammonia utilisation has been renewed due to excess ammonia N in the rumen often appears as a major source of N in urine. A reduction in urinary N excretion is highly desirable in grazing systems since urinary N causes N leaching to groundwater, and nitrous oxide emissions are implicated in climate change. The driver behind the increase in Kandleria and ruminal ammonia concentrations remains to be clearly identified. If it is due to an increased abundance of rapidly fermentable plant components, this could explain the spike in Kandleria abundance. This suggests that increasing the proportion of fermentable carbohydrate in feed may not always lead to increased microbial utilisation of ammonia and so may not always reduce N losses to the environment.
Acknowledgements
Pastoral 21 (Feeds platform), the Foundation for Research, Science and Technology (Contract 10×0604) and the Tertiary Education Commission funded this project. The authors thank Kate Lowe, Stefan Muetzel, Mike Tavendale, John Koolaard, Catherine McKenzie and Eric Altermann for their valuable contributions. Preliminary findings of this work have been published elsewhere (Vibart et al., Reference Vibart, Burke and Pacheco2011 and Reference Vibart, Tavendale, Burke and Pacheco2012).
Declaration of interest
No conflicts of interest.
Ethics statement
The Grasslands Animal Ethics Committee (AgResearch Ltd. Palmerston North, NZ; Approval No. 11908) approved all procedures, animal use and animal handling.
Software and data repository resources
No official repository at this time. Data available upon request.
Supplementary material
To view supplementary material for this article, please visit https://doi.org/10.1017/S1751731119000168