I. INTRODUCTION
Reduced activation ferritic/martensitic (RAFM) steels are regarded as the preferred structural material in the fusion energy systems owing to their low activation and favorable behavior in high dose fusion reactor environment. Reference Knaster, Moeslang and Muroga1–Reference Gilbert and Forrest4 In the past several decades, a large number of RAFM steels have been developed in many countries, such as F82H steel in Japan, EUROFER 97 steel in Europe, 9Cr2WVTa steel in USA, the China Low Activation Martensitic (CLAM) steel in China. Reference Ehrlich5–Reference Huang, Baluc, Dai, Jitsukawa, Kimura, Konys, Kurtz, Lindau, Muroga, Odette, Raj, Stoller, Tan, Tanigawa, Tavassoli, Yamamoto, Wan and Wu7 Carbon content is important to control the precipitation behavior of carbonitrides and mechanical properties of RAFM steels. Fine MN replaces MC, precipitating densely along boundaries in the steels containing carbon content 0.002%, which improves the precipitation strengthening. Reference Taneike, Sawada and Abe8 Nanometre-size MX carbonitride particles are achieved for the martensitic 9% Cr steel containing 0.049% nitrogen by reducing carbon concentration to 0.002% and their low coarsening rate at increased temperatures gives rise to excellent creep strength at 650 °C. Reference Taneike, Abe and Sawada9
Hot forming is more suitable for fabricating some components of blanket structure because of the high-strength and low plasticity of RAFM steel. Therefore, the understanding of hot deformation behavior of RAFM steels has great benefit for designers to conduct hot rolling and forging. During the hot deformation process, dynamic recrystallization plays the main role in the microstructure evolution of the steels. Reference Taylor and Hodgson10 The flow behavior is significant indicator to evaluate the applied load in the actual process of hot deformation. In metallurgy, constitutive equations incorporating the effects of forming temperature and strain rate can be achieved from the data of hot deformation experiment, which can describe the high temperature flow behavior of steels. Reference Akbari, Mirzadeh and Cabrera11,Reference Badjena12 So far, the high temperature flow behavior of different steels has been investigated. Zhang et al. Reference Zhang, Zhang, Shen, Liu, Xia and Li13 investigated the hot deformation of medium carbon Cr–Ni–Mo alloyed steel. Y. Zhou et al. Reference Zhou, Liu, Zhou, Liu, Yu and Li14 and Wang et al. Reference Wang, Guo, Huang, Tao, Li and Pei15 have studied the flow behavior of austenitic heat-resistant stainless steel and CLAM steel, respectively. Zhang et al. Reference Zhang, Mishin, Tao and Pantleon16,Reference Zhang, Zhang, Mishin, Tao, Pantleon and Jensen17 investigated the dynamic plastic deformation of 9Cr–1Mo steel. For RAFM steels, some high temperature behaviors have been investigated, such as the high temperature creep resistance and aging resistance. Reference de Carlan, Alamo, Mathon, Geoffroy and Castaing18–Reference Liu, Zhang, Xia and Yang20 However, little detailed information is available on the hot deformation behavior of low carbon RAFM steel. Therefore, it is absolutely necessary to study the hot deformation behavior of RAFM steel. In addition, the constitutive equation derived from the true stress-true strain curves is very significant, which can provide theoretical guidance for actual hot forming. In the process of establishing constitutive equation, some research showed the constitutive equation which ignored the influence of strain could describe the hot deformation behavior under certain strain, Reference Banerjee, Robi, Srinivasan and Kumar21–Reference Mirzadeh, Cabrera, Prado and Najafizadeh23 while other research recently indicated that the constitutive equation needs to consider the strain compensation because strain had important influence on materials hot deformation constants. Reference Wang, Guo, Huang, Tao, Li and Pei15,Reference Lin, Xia, Chen and Chen24,Reference Li, Wei, Hu, Li and Chen25 In this work, the hot compression tests were conducted in a wide range of strain rates and temperatures. The constitutive equation was established on the consideration of strain compensation. The main goal of the present work is to investigate the microstructural evolution and constitutive equations for hot deformation behavior of the low carbon RAFM steel so that it can be regarded as a reference for actual hot forming process.
II. MATERIALS AND EXPERIMENTAL METHODS
The chemical compositions of the low carbon RAFM steel are shown in Table I. The low carbon RAFM steel was cast in a vacuum induction furnace into an ingot weight 25 kg, the steels have been remelted three times to guarantee a high degree of homogeneity, then forged into cylinder bars (120 mm in height and 60 mm in diameter). Figure 1 shows the initial optical micrograph of specimen before hot deformation. It is martensitic microstructure with a small amount of δ-ferrite. The volume of δ-ferrite is about 5%. The average grain size is determined as 20 μm. RAFM steel specimens were machined to cylinder with a size of 10 mm in diameter and 15 mm in height. The specimens were heated up to 1050 °C with a heating rate of 200 °C/min and held for 10 min to obtain homogeneous microstructure before hot deformation. After that, the specimens were cooled down to 850, 900, 950, and 1000 °C with a cooling rate of 200 °C/min, respectively. The hot compression tests were conducted on Hydrawedge module of Gleeble-3500 thermo-simulation machine (Dynamic Systems Inc., Poestenkill, New York) at the temperature of 850, 900, 950, 1000, 1050 °C with the strain rates of 0.01, 0.1, 1, 10 s−1 followed by air cooling to room temperature. Under Hydrawedge module, the control mode is set to obtain true stress and true strain. The reduction in height is 60% for all the specimens at the end of compression test. To minimize the frictions during the hot deformation, tantalum foils with thickness of 0.1 mm were used between anvils and both ends of the specimens. The compressed specimens were sectioned parallel to the compressing direction, selecting the center region of the section plane for the observation of the microstructure. The specimens for optical metallographic examination were mechanical polished and etched in an abluent solution of saturated picric acid (2 mL abluent, 100 mL water, 2 g picric acid). The etching condition was the temperature of 70 °C and 3 min. The linear intercept method was adopted in three different directions to measure the prior austenite grain sizes.
Chemical composition of the low carbon RAFM steel at wt%.

Optical micrograph of low carbon RAFM steel before hot deformation.

III. RESULT AND DISCUSSION
A. Flow curves
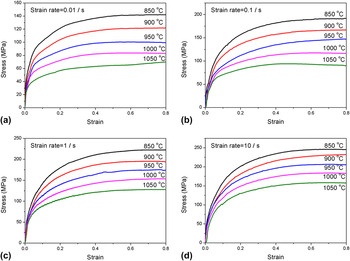
Figure 2 shows the true stress–true strain curves of the low carbon RAFM steel specimens. It can be observed that the stress rapidly increases first and then slows down until reaching a steady state in the process of hot deformation. The work hardening and dynamic softening occur simultaneously during the hot deformation process. The work hardening plays dominated role at the primary stage of hot deformation. The generation and motion of dislocation are the unique way to compensate the external deformation rate within the metals. The dislocation density continuously increases with the increase of strain, which can effectively inhibit the motion of dislocations owing to the interaction of dislocation. Therefore, the effect of work hardening exceeds that of the dynamic softening, leading to the rapid increase of stress. However, when the strain reaches a critical value, the nucleation and growth of recrystallized grains lead to the reduction of dislocation. Work hardening effect is gradually compensated by the dynamic softening. Figure 2 also shows that the flow stress is very sensitive to the strain rate and hot deformation temperature. Under the same strain rate, the flow stress positively decreases with the increase of deformation temperature. Lower strain rate decreases the flow stress at same temperature. Under lower strain rates and higher temperatures, the time for energy accumulation is longer, and the mobilities of boundaries for the nucleation and growth of dynamically recrystallized grains and dislocation annihilation are higher, leading to the decrease of the flow stress. Reference Lin, Chen and Zhong26 In addition, the local maximum value between 0.4 and 0.5 in strains under the deformation condition of “950 °C & 1 S−1” may be caused by the fluctuations of instrument.
True stress–strain curves of low carbon RAFM steel under different hot deformation conditions: (a) 0.01 s−1 & 850–1050 °C; (b) 0.1 s−1 & 850–1050 °C; (c) 1 s−1 & 850–1050 °C; (d) 10 s−1 & 850–1050 °C.

B. Microstructural features
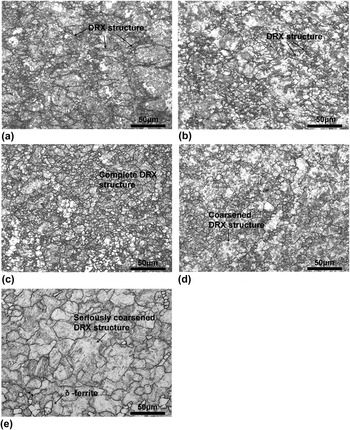
The structure after hot deformation is martensitic microstructure with a small amount of δ-ferrite. The cooling rate has very little influence on the microstructure, and the maximum cooling rate to form ferrite was 10–12 K/min, Reference Wu, Zheng, Huang, Liu and Han27 which is far below the air cooling rate in our work. The δ-ferrite can be observed in Fig. 3(e). However, in our study, the specimens for optical metallographic examination were mechanical polished and etched in an abluent solution of saturated picric acid. This etched method is used to obtain prior austenite grain size (PAGS) rather than martensitic microstructure.
Microstructure of low carbon RAFM steel at strain rate of 0.01 s−1 and temperature of (a) 850 °C; (b) 900 °C; (c) 950 °C; (d) 1000 °C; (e) 1050 °C.

Figure 3 shows the microstructures of the RAFM steel specimens deformed under the strain rate of 0.01 s−1 in the temperature range of 850–1050 °C. It can be seen that the complete dynamic recrystallized structure is obtained at 950 °C, as presented in Fig. 3(c). Figures 3(a) and 3(b) show the microstructures of 850 °C and 900 °C, respectively. The equiaxed and small dynamic recrystallized (DRX) grains are along the boundaries of larger grains, forming the “necklace” type microstructure, which indicates that the dynamic recrystallization is incomplete at relatively low deformation temperature. Figure 3(d) shows a tendency of growing up for partial recrystallized grains at 1000 °C. Besides, a lot of recrystallized grains become larger when the temperature reaches 1050 °C. The growth of recrystallized grains is due to high mobility of the grain boundaries under high temperatures.
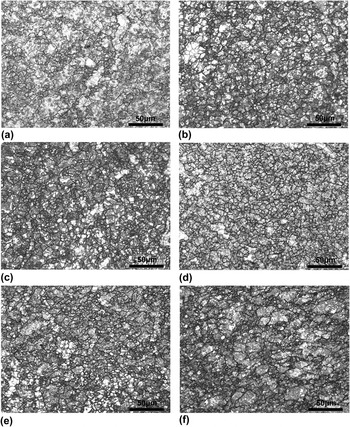
The effect of strain rates on the microstructure of RAFM steel is investigated at 1000 °C under different strain rates (0.01, 0.1, 1, 10 s−1), as shown in Figs. 4(a)–4(d). It can be seen that the complete recrystallization at 1000 °C occurs regardless of the strain rate. The recrystallized grains slightly decrease with the increase of strain rate. The average grain size of specimens deformed at 1000 °C under different strain rates (0.01, 0.1, 1, 10 s−1) is 12.7 μm, 9.8 μm, 8.5 μm, 7.3 μm, respectively. This leads to finer recrystallized grains at 1000 °C & strain rate (0.1, 1, 10 s−1) than that under 1000 °C & 0.01 s−1, as shown in Figs. 4(a)–4(d). Higher strain rate would generate more deformation energy and nucleation sites, this can make the grains finer at this temperature. However, when the deformation condition is 950 °C & 0.1 s−1, the incomplete recrystallization can be observed, as presented in Fig. 4(f), which can be explained that the high strain rate does not provide sufficient time for the nucleation and growth of dynamically recrystallized grains at a relatively low temperature. Reference Lin, Chen and Zhong28
Microstructure of low carbon RAFM steel at temperature of 1000 °C and strain rate of (a) 0.01 s−1; (b) 0.1 s−1; (c) 1 s−1; (d) 10 s−1; (e) 950 °C and 0.01 s−1; (f) 950 °C, and 0.1 s−1.

C. Constitutive equation
The combined effect of temperature, strain rate, and flow stress can be represented through the constitutive equation. Reference Sellars and McTegart29 As follows:
 $$\dot \varepsilon = AF\left( \sigma \right)\exp \left( { - {Q \over {RT}}} \right)\quad ,$$
where
 $\dot \varepsilon$
is strain rate (s−1), R is the gas constant [8.314 J/(mol K)], T is the hot deformation temperature (K), and Q is the deformation activation energy (kJ/mol). F(σ) is the function of flow stress and A is the materials constant. Three types of expression are mostly used as follows:
 $$F\left( \sigma \right) = \left\{ {\matrix{ {{\sigma ^{{n_1}}}} & {\alpha \sigma \lt 0.8} \cr {\exp \left( {\beta \sigma } \right)} & {\alpha \sigma > 1.2} \cr {\sinh {{\left( {\alpha \sigma } \right)}^n}} & {{\rm{for\ all\ }}\sigma } \cr} } \right.\quad ,$$
where n 1, β, α, n are the materials constants (α = β/n 1), σ is the flow stress at a fixed strain.
To study the correlations between strain (ε) and materials constants (α, n, A, and Q), the values of α, n, A, and Q under different strains (ε) are evaluated and then linear fitted by least square method. Accordingly, the strain (ε = 0.3) is taken as an example to describe the specific methods of evaluating the values of α, n, Q, and A. The correlations between strain rate and stress can be expressed by Eqs. (3) and (4). Eqs. (3) and (4) are applied under low level stress (ασ < 0.8) and high level stress (ασ > 1.2), respectively.
 $$\dot \varepsilon = A{\sigma ^{{n_1}}}\exp \left( { - {Q \over {RT}}} \right)\quad .$$
 $$\dot \varepsilon = A\exp \left( {\beta \sigma } \right)\exp \left( { - {Q \over {RT}}} \right)\quad .$$
Taking natural logarithm on both sides of Eqs. (3) and (4), the correlation between strain rate and stress are as follows:
 $$\ln \dot \varepsilon = \ln A + {n_1}\ln \sigma - {Q \over {RT}}\quad .$$
 $$\ln \dot \varepsilon = \ln A + \beta \sigma - {Q \over {RT}}\quad .$$
Values of n 1 and β can also be derived from Eqs. (5) and (6) at the deformation temperature as follows:
 $$\left\{ \matrix{ {n_1} = {\left[ {{{\partial \ln \dot \varepsilon } \over {\partial \ln \sigma }}} \right]_T} \hfill \cr \beta = {\left[ {{{\partial \ln \dot \varepsilon } \over {\partial \sigma }}} \right]_T} \hfill \cr} \right.\quad .$$
The relationships between the strain rate (
 $\dot \varepsilon$
) and flow stress (σ) under the strain (ε = 0.3) can be obtained by substituting the values of the strain rate (
 $\dot \varepsilon$
) and flow stress (σ) into Eqs. (5) and (6), as presented in Figs. 5(a) and 5(b). It can be approximately expressed as linear mode. The lines are almost parallel. The values of n
1 and β could be evaluated at different temperature through linear fitting the slope of the lines in Figs. 5(a) and 5(b). The relative R
2 values which are used to evaluate the degree of fitting of each linear regression are marked in Fig. 5, which shows the high accuracy of each linear regression. The final values of n
1 and β under the strain (ε = 0.3) is the average of the values of n
1 and β at different temperature, n
1 = 10.4161 and β = 0.07912, respectively. Correspondingly, the value of α is 0.007596.
Linear relationships between: (a)
 $\ln \dot \varepsilon$
and ln σ; (b)
 $\ln \dot \varepsilon$
and σ; (c)
 $\ln \dot \varepsilon$
and ln[sinh(ασ)]; (d) ln[sinh(ασ)] and T
−1.

For all the range of stress levels, the relation between temperature, strain rate, and flow stress can be transformed to the following form:
 $$\dot \varepsilon = A\sinh {(\alpha \sigma )^n}\exp \left( { - {Q \over {RT}}} \right)\quad .$$
Taking natural logarithm on both sides of Eq. (8), Eq. (8) can be expressed by Eq. (9):
 $$\ln \dot \varepsilon = \ln A + n\ln \left[ {\sinh \left( {\alpha \sigma } \right)} \right] - {Q \over {RT}}\quad .$$
Assuming that temperature and strain rate (
 $\dot \varepsilon$
) are both constant, Eqs. (10) and (11) can be derived by Eq. (9):
 $$n = {\left\{ {{{\partial \ln \dot \varepsilon } \mathord{\left/ {\vphantom {{\partial \ln \dot \varepsilon } {\partial \left[ {\ln \sinh \left( {\alpha \sigma } \right)} \right]}}} \right. \kern-\nulldelimiterspace} {\partial \left[ {\ln \sinh \left( {\alpha \sigma } \right)} \right]}}} \right\}_T}\quad .$$
 $$Q = Rn{\left\{ {{{\partial \left[ {\ln \sinh \left( {\alpha \sigma } \right)} \right]} \mathord{\left/ {\vphantom {{\partial \left[ {\ln \sinh \left( {\alpha \sigma } \right)} \right]} {\partial \left( {{1 \mathord{\left/ {\vphantom {1 T}} \right. \kern-\nulldelimiterspace} T}} \right)}}} \right. \kern-\nulldelimiterspace} {\partial \left( {{1 \mathord{\left/ {\vphantom {1 T}} \right. \kern-\nulldelimiterspace} T}} \right)}}} \right\}_{\dot \varepsilon }}\quad .$$
The relationships between ln[sinh(ασ)] and
 $\ln \dot \varepsilon$
can be obtained by substituting the values of the strain rate (
 $\dot \varepsilon$
) and flow stress (σ) under the strain (ε = 0.3) into Eq. (9). The value of n was determined as 7.7775, by investigating the average of slop rates at different temperature in Fig. 5(c). According to Eq. (9), the value of A was calculated as 1.29 × 10¹⁵. Figure 5(d) shows the linear relationships between ln[sinh(ασ)] and 1/T under different strain rates. The mean value of all slope rates in Fig. 5(d) is considered as Q/nR, which can be computed as 5920.63493. Therefore, the value of Q can be evaluated as 382.842 kJ/mol, which is close to the value reported in Ref. Reference Wang, Guo, Huang, Tao, Li and Pei15.
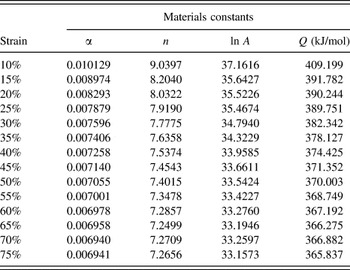
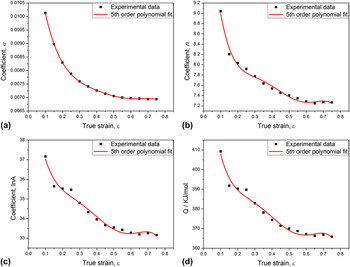
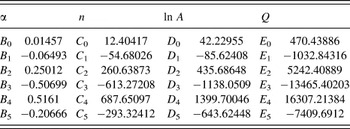
So far, all materials constants under 30% strains have been calculated. To describe the hot deformation behaviors of RAFM steel comprehensively, the constitutive equation was established by considering the strain compensation. The values of α, n, A, and Q are calculated at different strains (from 10% to 75% with the interval of 5%) through the method mentioned above. The result is presented in Table II. The values are then fitted by fifth order polynomial, as shown in Fig. 6. The polynomial fitting equations and coefficients are given by Eq. (12) and shown in Table III, respectively. Now, the constitutive equation can be obtained by substituting the materials constants (α, n, A, and Q) which have been calculated out.
 $$\left\{ \matrix{ \alpha = {B_0} + {B_1}\varepsilon + {B_2}{\varepsilon ^2} + {B_3}{\varepsilon ^3} + {B_4}{\varepsilon ^4} + {B_5}{\varepsilon ^5} \hfill \cr n = {C_0} + {C_1}\varepsilon + {C_2}{\varepsilon ^2} + {C_3}{\varepsilon ^3} + {C_4}{\varepsilon ^4} + {C_5}{\varepsilon ^5} \hfill \cr \ln A = {D_0} + {D_1}\varepsilon + {D_2}{\varepsilon ^2} + {D_3}{\varepsilon ^3} + {D_4}{\varepsilon ^4} + {D_5}{\varepsilon ^5} \hfill \cr Q = {E_0} + {E_1}\varepsilon + {E_2}{\varepsilon ^2} + {E_3}{\varepsilon ^3} + {E_4}{\varepsilon ^4} + {E_5}{\varepsilon ^5} \hfill \cr} \right.\quad .$$
Values of α, n, ln A and Q for RAFM steel under different strains.

Relationships between: (a) α; (b) n; (c) ln A; (d) Q and true strain by 5th order polynomial fit of low carbon RAFM steel.

Values of the polynomial fitting for α, n, ln A and Q of RAFM steel.

D. Verification of constitutive equations of RAFM steel
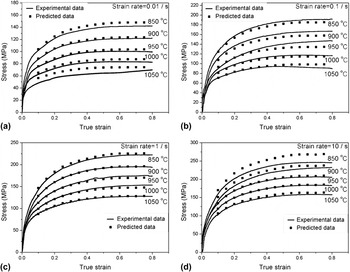
To prove the constitutive equation whether or not could accurately predict the flow behavior of RAFM steel, the predicted values of stress calculated from the constitutive equation and the experimental ones are plotted in Fig. 7. It can be found that the predicted data shows a good agreement with the experimental data for RAFM steel in most experimental conditions. However, there is different level of variation between predicted values and experimental values for flow stress in three deformation conditions (1050 °C & 0.01 s−1, 850 °C & 10 s−1 and 950 °C & 0.1 S−1). The degree of variation is assessed by average absolute relative error (AARE). The expression of AARE is Eq. (14). The value of AARE for three deformation conditions is 13%, 8%, and 4%, respectively. Therefore, the notable variation appears in the former two deformation conditions. For the first notable variation, the recrystallized grains grow up, as shown in Fig. 3. The effect of flow softening is more evident than work hardening because of the low dislocation density and higher energy accumulation caused by lower strain rate and high mobility of the grain boundaries and dislocation annihilation produced by higher temperature in the process of hot deformation. Besides, excessive temperature can reduce critical shear stress, improving the average kinetic energy of atoms and the mobility of dislocations. Reference Wang, Guo, Huang, Tao, Li and Pei15 For the latter, there is less test time for the heat caused by hot deformation to transfer at high strain rates which leads to a significant part of flow softening. Reference Lin, Chen and Zhong26
Comparison between predicted values and experimental values for flow stress at different hot deformation conditions: (a) 0.01 s−1 & 850–1050 °C; (b) 0.1 s−1 & 850–1050 °C; (c) 1 s−1 & 850–1050 °C; (d) 10 s−1 & 850–1050 °C.

The correlation between predicted and experimental values for flow stress at different hot deformation conditions with strains (from 10% to 75% with the interval of 5%) can be seen in Fig. 8. The linear fitting was adopted for a more intuitive description of correlation between predicted and experimental stress. The value of slope is 1.02, which suggests the applicability of constitutive equations. The correlation coefficient (R) which is commonly used to provide correlation information about the linear fitting relationship between experimental and predicted values and AARE were applied to quantitatively assess the accuracy of the established constitutive equation. The AARE was computed through a term-by-term comparison of the relative error and therefore is an unbiased statistical parameter for measuring the predictability of a model/equation. Reference Srinivasulu and Jain30 The R between experimental and predicted values for flow stress is 0.9958. In addition, the value of AARE is as low as 2.27%. These indicate that the established constitutive equation could accurately predict the high temperature flow behavior of RAFM steel.
 $$R = {{\sum\limits_{i = 1}^N {\left( {{E_i} - \bar E} \right)\left( {{P_i} - \bar P} \right)} } \over {{{\left[ {\sum\limits_{i = 1}^N {{{\left( {{E_i} - \bar E} \right)}^2}} \sum\limits_{i = 1}^N {{{\left( {{P_i} - \bar P} \right)}^2}} } \right]}^{1/2}}}}\quad ,$$
 $${\rm{AARE}}\% = {1 \over N}\sum\limits_{i = 1}^N {\left| {{{{E_i} - {P_i}} \over {{E_i}}}} \right|} \times 100\quad ,$$
where E
i
is the experimental value, P
i
is the predicted value obtained from the constitutive equation.
 $\bar E$
and
 $\bar P$
are the average values of E
i
and P
i
, respectively. N is the number of data used in the investigation.
Correlation between predicted values and experimental values for flow stress at different hot deformation conditions.

IV. CONCLUSIONS
-
(1) The true stress-true strain curves of the low carbon RAFM steel are obtained through hot compression test. The stress rapidly increases first and then slows down until reaching a steady state.
-
(2) For low carbon RAFM steel, the increase of temperature is good for attaining the complete dynamic recrystallization (DRX). Higher strain rate leads to finer recrystallized grains. However, excessive temperature results in the growth up of dynamic recrystallized grain.
-
(3) The materials constants (α, n, A, and Q) are calculated through a fifth order polynomial fitting by considering the effect of strain. Especially, the increase of strain causes the decrease of the value of Q, indicating the DRX occurs more easily. In addition, the constitutive equation is established by substituting the above materials constants which have been calculated out.
-
(4) The constitutive equation could accurately predict the high temperature flow behavior of RAFM steel in most given ranges of experimental conditions.
ACKNOWLEDGMENTS
The authors are grateful to the China National Funds for Distinguished Young Scientists (granted No. 51325401), the National Natural Science Foundation of China (granted No. 51501126), the National Magnetic Confinement Fusion Energy Research Program (granted No. 2015GB119001), and the Key Project of Natural Science Foundation of Tianjin (granted No. 14JCZDJC38700) for grant and financial support.