


1 Introduction
The survey of online phonetic studies indicates that acoustic characteristics of vowels of some languages are well investigated, having attracted the attention of relatively many phonetic researchers (Peterson & Barney Reference Peterson and Barney1952, Clopper, Pisoni & de Jong Reference Clopper, Pisoni and de Jong2005, Fox & Jacewicz Reference Fox and Jacewicz2009, Williams, Escudero & Gafos Reference Williams, Escudero and Gafos2018). On the other hand, vowels of other languages seem understudied, lacking adequate data on their acoustic features. For instance, Oromo, a Cushitic language widely spoken in the Horn of Africa, has vowels that are not well researched (Tujube Amansa Reference Amansa2018). There is a paucity of data on the acoustic characteristics of vowels of the language and thus the extent to which acoustic characteristics of its vowels can be affected by vowel quality and gender is not clearly known. The current study, therefore, examines the effects of vowel quality and gender on acoustic properties of Oromo vowels using sets of acoustic measures extracted at more than one-time point.
1.1 Acoustic characteristics of vowels
Acoustic description of vowels involves a few parameters such as duration, fundamental frequency (f0) and the first three formant frequencies (F1, F2, F3). Vowel duration may vary with vowel quality, age, gender, dialect, phonetic environment and speech style (Clopper et al. Reference Clopper, Pisoni and de Jong2005, Fox & Jacewicz Reference Fox and Jacewicz2009). For instance, low vowels can have the longest duration across languages due partly to the long time it takes for articulators to reach their targets (Solé & Ohala Reference Solé, Ohala, Cécile Fougeron, D’Imperio and Vallée2010, Derib Ado Reference Ado2011). Studies of vowel duration in different languages indicate that vowels could be longer when they are produced by child and female speakers, before voiced consonants and in clear speech or slow speech (Lee, Potamianos & Narayanan Reference Lee, Potamianos and Narayanan1999, Hillenbrand, Clark & Nearey Reference Hillenbrand, Clark and Nearey2001, Ferguson & Kewley-Port Reference Ferguson and Kewley-Port2007). On the other hand, fundamental frequency is derived from the vibration of the vocal folds and affected by age, gender, dialect, and vowel quality (Tujube Amansa Reference Amansa2018, Williams et al. Reference Williams, Escudero and Gafos2018). Children and female speakers have comparatively higher fundamental frequency due to the anatomy of their vocal folds, which are thinner and shorter (Simpson Reference Simpson2001, Pisanski et al. Reference Pisanski, Fraccaro, Tigue, O’Connor, Susanne Röder, Andrews, DeBruine, Jones and Feinberg2014). While previous studies reported significant effects of such factors on vowel acoustic attributes, they seem to have paid less attention to the proportion of variances explained by these factors (Abelson Reference Abelson1995).
F1, F2 and F3 are linked to vowel quality and previous studies have used these acoustic measures to conduct acoustic analyses of languages, namely English, Dutch, Greek, German and Siwu (Peterson & Barney Reference Peterson and Barney1952, Jongman, Fourakis & Sereno Reference Jongman, Fourakis and Sereno1989, Hillenbrand et al. Reference Hillenbrand, Getty, Clark and Wheeler1995, Adank, van Hout & Smits Reference Adank, van Hout and Smits2004, Kpodo Reference Kpodo2013). Their use is motivated by the close link between the acoustic features and articulatory parameters such as vowel height, backness and lip rounding. F1 and F2 correspond to height and backness respectively, with the high and back vowels having the lowest F1 and F2. In other words, F1 is inversely related to height while F2 is inversely related to backness but the association between F1 and height is comparatively stronger (Ximenes, Shaw & Carignan Reference Ximenes, Shaw and Carignan2017, Williams et al. Reference Williams, Escudero and Gafos2018, Lawson, Stuart-Smith & Rodger Reference Lawson, Stuart-Smith and Rodger2019). The formant frequencies are influenced by gender, age, dialect, language and vowel quality. Female speakers, children and clear speech have greater formant frequencies and this variation is known to occur cross-linguistically (Simpson Reference Simpson2001, Pisanski et al. Reference Pisanski, Fraccaro, Tigue, O’Connor, Susanne Röder, Andrews, DeBruine, Jones and Feinberg2014, Leung et al. Reference Leung, Jongman, Wang and Sereno2016). Though the general patterns of formant frequencies are similar across languages and easily predictable, the same vowel in different languages may have different formant values (Bradlow Reference Bradlow1995, Yang Reference Yang1996, Strange et al. Reference Strange, Andrea Weber, Levy, Hisagi and Nishi2007, Chung et al. Reference Chung, Eun Jong Kong, Weismer, Fourakis and Hwang2012).
1.2 Vowel classification
Hillenbrand et al. (Reference Hillenbrand, Getty, Clark and Wheeler1995) classified vowels of North American English using the first two formant frequencies measured at a steady state and reported a 95.4
 $\%$
accurate classification. This result is slightly greater than that of an early acoustic study of the same vowels (94.4
 $\%$
) by Peterson & Barney (Reference Peterson and Barney1952). The accuracy showed an 11.5
 $\%$
improvement when acoustic parameters measured at 20
 $\%$
, 50
 $\%$
and 80
 $\%$
of vowel duration were used. The spectral change (time-varying frequencies) had an advantage over the steady state in classifying vowels of the language. Similarly, a study of vowels of Northern and Southern Standard Dutch reveals that the varieties show a small variation as a function of formant frequencies measured at a steady state for the nine monophthongal vowels. Yet, they exhibit large variations with respect to formant frequencies measured at 30
 $\%$
and 70
 $\%$
points of the three long mid vowels and as well as the three diphthongal vowels (Adank, van Hout & Smits Reference Adank, van Hout and Smits2004). There are also research results that corroborate the advantage of spectral change over the steady state in bearing more information particularly for separating confusing vowels (Morrison & Nearey Reference Morrison and Nearey2007, Williams et al. Reference Williams, Escudero and Gafos2018). The current study also attempts to investigate the role of spectral change (time-varying frequencies) in classifying Oromo vowels of the northern dialect.
Fundamental frequency and duration are also important acoustic parameters that could contribute to the classification of vowels in different languages. Their contribution is observed particularly in separating neighbouring sounds. For instance, the f0 of vowels of American English has an attested role in distinguishing front vowels along their heights (DiBenedetto Reference DiBenedetto1989). In classifying American, Australian English and Dutch vowels, f0 has a role slightly comparable to that of the third formant (Hillenbrand et al. Reference Hillenbrand, Getty, Clark and Wheeler1995, Adank, van Hout & Smits Reference Adank, van Hout and Smits2004, Williams et al. Reference Williams, Escudero and Gafos2018). An acoustic analysis of dynamic acoustic properties of monophthongs and diphthongs in Western Sydney, Australian English indicates that duration together with the three first formants accurately separated 74.9
 $\%$
of the token. However, the removal of duration from a parameter set entered into the classifier decreased the classification rate by 14.8
 $\%$
(Elvin, Williams & Escudero Reference Elvin, Williams and Escudero2016). The addition of vowel duration to the formant frequencies in quadratic discriminant analysis resulted in an improvement in classification accuracy for American English (Hillenbrand et al. Reference Hillenbrand, Getty, Clark and Wheeler1995). It is also reported that duration improved the classification rate of Dutch vowels and the contribution of duration was found to be larger in separating vowels of the Northern Standard Dutch as compared to those of the other varieties (Adank, van Hout & Smits Reference Adank, van Hout and Smits2004). The current study also aims to determine the contribution of fundamental frequency and duration in distinguishing Oromo vowels of the northern dialect.
1.3 Previous studies of Oromo vowels
The exact number of languages spoken in Ethiopia is unknown but the usual estimate is eighty and above, as reported by the 2007 National Population Census (CSA 2007). The classification of the languages into Semitic, Cushitic, Omotic and Nilo-Saharan is relatively well established, with some debate on whether or not Cushitic and Omotic should constitute separate families (Tosco Reference Tosco2000). Oromo belongs to the Cushitic family and is widely spoken in Ethiopia and to some extent in Kenya as small communities living scattered in the northern part of the country speak different varieties of the language (Lamberti Reference Lamberti1991). The language is classified as Lowland East Cushitic together with Somali, Afar and other small languages in East Africa. It has attested regional varieties but the number of such varieties is debatable, varying with studies. The number of the regional varieties in previous studies ranges from three to six (Stroomer Reference Stroomer1987, Kebede Reference Kebede2009). For example, in Kebede’s (Reference Kebede2009) genetic classification, such varieties as Western, Eastern, Northern, Central and Waata are identified, and the current study is based on this classification since it is the most comprehensive study on Oromo dialectology.
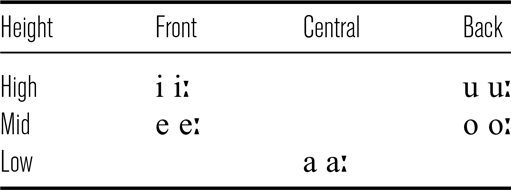
According to previous studies, Oromo has five vowels, all of which contrast in length (Owens Reference Owens1985, Stroomer Reference Stroomer1987, Lloret-Romanyach Reference Lloret-Romanyach1988). The studies have classified the vowels into high, mid and low in terms of their height, and their phonemic status is well established. The high vowels are /i u/, the mid ones are /e o/, and /a/ is the only low vowel in the language. All of them can be lengthened, having their own long counterparts (Table 1). A recent acoustic study of the vowels has confirmed this traditional classification of the vowels (Tujube Amansa Reference Amansa2018). The study investigated the extent to which acoustic properties of Oromo vowels would vary with vowel quality, gender and dialect. The acoustic measures in the study were extracted from the midpoint of vowel duration and the phonetic environment was not strictly controlled, with positions of vowels differing in the carrier words. The number of speakers (32 female, 32 male) who participated in the study was large. Repeated measures ANOVA was used to conduct statistical analysis but a linear mixed model could have been preferably employed. In spite of its limitations, the study found a significant variation in classification rates with vowel quality, gender and dialect. It showed significant differences in formant frequencies of short and long vowels. In addition, the acoustic classification indicated that the first two formant frequencies measured at the midpoint correctly separated 80
 $\%$
of tokens of the long vowels. The formants correctly classified 64.5
 $\%$
of tokens of long vowels of the northern dialect; this score was very low compared with those of the other dialects. However, no other study has been carried out to validate above findings by using a different method (Section 2).
An inventory of Oromo short vowel phonemes and their corresponding long ones (Owens Reference Owens1985).

The main objective of the current study is to validate and extend the findings of the acoustic study cited in the preceding paragraph. The study focuses on vowels of the northern dialect of the language because various reasons. This dialect has the smallest number of speakers (457,278) as compared to the other dialects of the language (CSA 2007). The dialect is spoken in the Oromia Zone, which is found in the Amhara Regional State (Figure 1). It is surrounded by Afar and Amharic speakers, being isolated from the other dialects. Amharic is a working language of Ethiopia and stands second to Oromo in terms of the number of native speakers (CSA 2007). The dialect has influenced and has been influenced by Amharic (Tosco Reference Tosco2000, Baye Reference Yimam2016). Presumably, there could be a danger of gradual shift to Amharic as the children are speakers of Amharic having acquired it from their parents who are bilingual speakers of Amharic and Oromo. The other warning sign is that Rayya, which is part of the northern dialect, has shifted to the neighbouring Semitic languages (Kebede Reference Kebede2009). In addition, it is a common observation that the interaction of language and politics has been so strong in Ethiopia that languages or their varieties could be the beneficiaries or the victims of such interaction. This study is significant in documenting the current phonetic properties of vowels of the dialect so that it can be used as a reference for future studies.
Location of Oromia Zone where the northern dialect of Oromo is spoken (Baker Reference Baker2012).

2 Method
2.1 Participants
Participants of the study were 19 native speakers (9 female, 10 male) of the northern dialect and had normal speech and hearing, with their ages ranging from 20 to 35 years. They also speak Amharic, having acquired from their community and learned it at school as a subject. They were doing college courses at Kemise College of Teachers’ Education to be teachers for primary schools and their consent was obtained before they took part in the study. They reported no travel history as they were born, brought up and educated in the study site (Figure 1).
2.2 Recording procedure
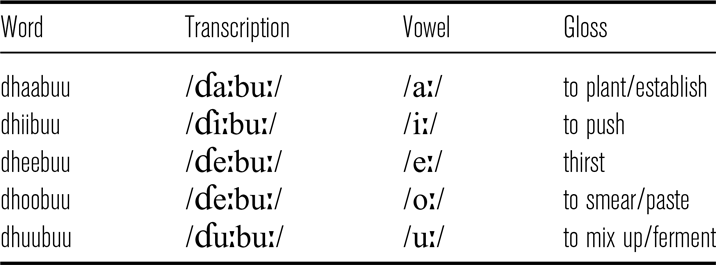
The stimuli were five long vowels of Oromo embedded in real words in the same phonetic environment (Table 2). The long vowels were selected as they are long enough to take the measurement at three points, which are not much influenced by the flanking consonants. The words containing the vowels were embedded in a carrier phrase ‘____ say’, following the word order of the language attested in Owens (Reference Owens1985) and Stroomer (Reference Stroomer1987). For instance, one of the carrier phrases was ‘Dhaabuu jedhi’ for recording the vowel /aː/ and it literally means ‘/ɗaːbuː/ say’.Footnote 1 The stimuli were recorded with Zoom H4n Handy Recorder in a quiet room while the participants were saying them at their usual speech rates. They were recorded at 44.1k Hz and digitised at 16 bits. They were randomly presented in a PowerPoint on an HP laptop and the presentation rate was adjusted based on the speech rates comfortable to all participants. Instruction for the recording was written in Oromo and the recording could only start when the participants were ready after reading and understanding the instruction. The recording took place in two rounds and the first brief round was intended to familiarise participants with the recording procedure. The second round was the actual recording session in which each stimulus was recorded five times in a random order (Schoormann, Heeringa & Peters Reference Schoormann, Heeringa and Peters2019).
List of real words used for recording vowels.

Note: No item analysis was conducted and thus the results of the study could not be generalised to other phonetic environments or population of items.
The recording totally yielded 475 tokens (19 speakers × 5 vowels × 5 repetitions) but badly recorded tokens, which had poorly resolved formant frequencies and exaggerated pitches, were discarded. Those tokens were mainly found in the first and the last recordings, and thus the first and the last tokens of each participant were not included in the analysis. The remaining 285 tokens (19 speakers × 5 vowels × 3 repetitions) were used to extract acoustic parameters for the study. The southern variety of Oromo is claimed to be tonal (Voigt Reference Voigt1985) but such a claim has not been made of the northern dialect. However, a study on Oromo phonology claimed that a disyllabic word that ends in a long vowel has primary stress and a high pitch in the last syllable (Wako Reference Wako1981). Accordingly, all the words in the current study have the same pitch and stress patterns because all of them are disyllabic ending in a long vowel (Table 2).
2.3 Measurement procedures
Praat, a free speech software version 6.20 (Boersma & Weenik Reference Boersma and Weenink2001), was used to extract duration, fundamental frequency and the first three formant frequencies of the vowels. A Praat script was used to automatically extract the acoustic parameters in TextGrid (Lennes Reference Lennes2003). Duration was automatically measured in milliseconds between interval tiers labelled with the vowel symbols. The tiers were placed on the vocalic segment, with the start points and the endpoints demarcated by the onset (where there is also a noticeable increase in intensity) and offset (where there is also a noticeable decrease in intensity) of the quasi-periodic wave (Kirtley et al. Reference Kirtley, Grama, Drager and Simpson2016). The start and endpoints were set to the nearest positive zero-crossings. Identifying the boundaries of the vowels in speech software was easy and straightforward as all carrier words have the vowels in between implosive and plosive sounds (Table 2). The added advantage of such a phonetic context is that it could remove the confounding effect of consonantal environments which may occur when different environments are used for the target sounds (Hillenbrand et al. Reference Hillenbrand, Clark and Nearey2001, Strange et al. Reference Strange, Andrea Weber, Levy, Hisagi and Nishi2007).
2.4 Acoustic and statistical analyses
The acoustic parameters extracted include duration, f0, F1, F2 and F3 of the five vowels. Formant frequencies that had extreme values were identified and measured again manually. Duration, fundamental frequency and the first three formants measured at the midpoint of the vowel duration were used for an acoustic description. The ggplot2 package (Wickham Reference Wickham2016) was employed for the graphical representations of the data.
The lme4 package in R version 4.1 (Bates et al. Reference Bates, Mächler, Bolker and Walker2015) was used to assess the study results with a linear mixed-effects model, which was fitted with maximum likelihood. A linear mixed model was chosen to overcome the violation of an assumption of independence, which was caused by multiple measures taken from a single speaker (Winter Reference Winter2020, Brown Reference Brown2021). Each acoustic parameter was modelled as a function of the fixed effects, gender (with two levels) and vowel quality (with five levels), consisting of participants’ random effects. To solve the model convergence issue, some of the derivative computation that took place after the model had got a solution was omitted, by using a control parameter (Brown Reference Brown2021). In addition, the intercept-slope interactions were uncorrelated when they made the model failFootnote 2 to converge (Bates et al. Reference Bates, Mächler, Bolker and Walker2015, Winter Reference Winter2020). Post-hoc comparisons of contrasts of significant effects were carried out using the emmeans package in R (Lenth et al. Reference Lenth, Buerkner, Giné-Vázquez, Maxime Herve, Jonathon Love, Riebl and Singmann2022). Such contrasts compared the difference between each pair of means with an appropriate Tukey's adjustment for the multiple testing. The mixed function in the afex package (Singmann et al. Reference Singmann, Ben Bolker, Frederik Aust, John Fox, Lawrence, Love, Lenth and Haubo Bojesen Christensen2016) was used to conduct likelihood ratio tests for the fixed effects, with the argument method set to ‘LRT’. The r.squaredGLMM function in the MuMIn package (Bartoń Reference Bartoń2017) was employed to get the marginal R 2 for the mixed models. The R 2 is a useful metric to determine the proportion of variance explained by the fixed effect, and both the fixed and random effects, and to examine the model fit (Harrison et al. Reference Harrison, Lynda Donaldson, Julian Evans, Fisher, Goodwin, Robinson and Inger2018)
In addition to the acoustic description, the study aims at classifying the vowels by using sets of acoustic parameters measured at 20
 $\%$
, 50
 $\%$
and 80
 $\%$
of each vowel’s duration. The parameters were normalised with Lobanov’s procedure (Adank Reference Adank2003) before they were employed in Support Vector Machine classifier (Kong, Mullangi & Kokkinakis Reference Kong, Mullangi and Kokkinakis2014). Of the four kernel functions, the Radial Basis Kernel (RBF) was selected because of its good performance. After the selection of the kernel type, the parameter C and the kernel parameter gamma (best C and best gamma) were determined based on gridsearch with five-fold cross-validation (Olson & Delen Reference Olson and Delen2008). Duration was excluded from the classification of the vowels because it did not significantly vary with a vowel quality.
3 Results
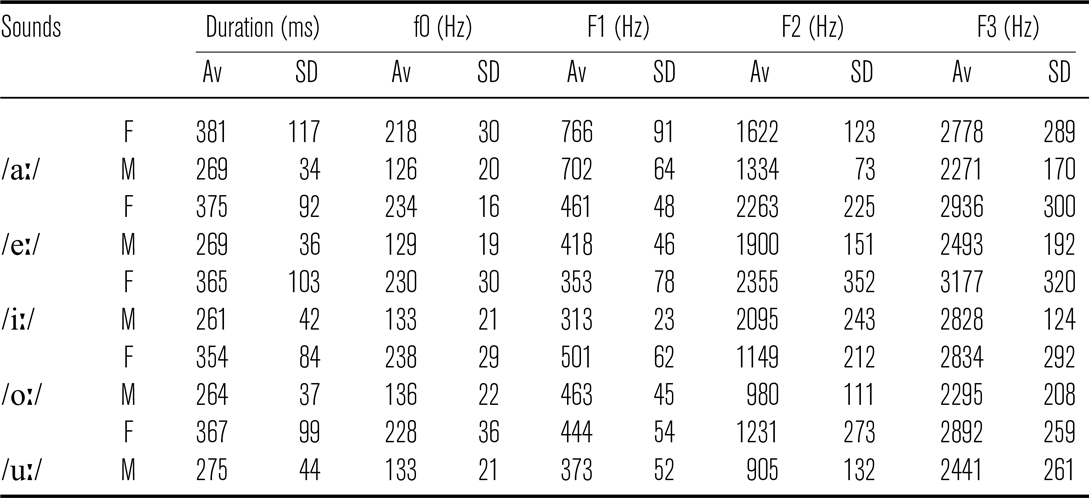
Table 3 presents the average duration and formant frequencies of Oromo long vowels produced by speakers of the northern dialect. The acoustic parameters were extracted at the midpoint of each vowel. The acoustic parameters in Table 3 and Figure 2 were extracted at midpoint of each vowel.
Duration, f0, F1, F2 and F3 averages and standard deviations (SD) for the vowel tokens.

F = female; M = male
Distribution of female (left) and male (right) speakers’ vowel tokens on an F1 × F2 vowel space. The formants are measured at 50
 $\%$
of vowel duration and normalised with the Lobanov procedure. Vowel tokens of the female speakers exhibit a greater variation and this is also evident in Table 3.

3.1 Duration
One of the research objectives is to determine if the duration of vowels of the northern variety of Oromo varies as a function of vowel quality and gender. The vowel, /aː/ has the longest duration (322 ms) while the /iː/ has the shortest duration (329.7 ms), which implies that vowel duration is inversely related to its height (Figure 3). The effect of vowel quality on duration is not significant (
 $ \chi^{2}$
(4) = 6.79, p < .15).
Raincloud plot of vowel duration (ms) by vowel quality. The error bars represent 95
 $\%$
of confidence intervals.

However, the main effect of gender on vowel duration is significant as female speakers produced vowels with longer duration than male speakers (
 $ \chi^{2}$
(1) = 8.5, p < .004). The average duration of male speakers’ vowels is less than 300ms while that of female speakers is greater than this average (Figure 4). The ratio is 1.32:1, which means female speakers produce vowels, which are 1.32 times longer than male speakers’ vowels. Gender accounts for 36
 $\%$
(R
2
= .36) of the variance in the duration of the vowels. The result shows that the interaction between vowel quality and gender is not significant (
 $ \chi^{2}$
(4) = 9.16, p < .06).
Raincloud plot of vowel duration (ms) by gender. The error bars represent 95
 $\%$
of confidence intervals.

3.2 Fundamental frequency
One of the acoustic parameters used for describing vowels is f0 because the sounds are known to have their own intrinsic f0 independently of the influence of sociolinguistic and context variables. The f0 of /oː/ and /aː/ have the highest and lowest means respectively while the front vowels have almost equal means. It is roughly inversely related to vowel height in this dialect of Oromo and the difference is statistically significant (
 $ \chi^{2}$
(4) = 28.72, p < .001). Multiple contrasts show that /aː/ significantly differs from /iː/ and /uː/ at p < .02, and from /oː/ at p < .001.
The effect of gender on f0 is well established in previous acoustic studies but the current study is more concerned with the magnitude of the effect of such a factor. Female speakers’ f0 (235 Hz) is significantly greater than that of male speakers (129 Hz) (
 $ \chi^{2}$
(1) = 50.23, p < .001). Gender accounts for 92
 $\%$
(R
2
= .93) of the variances of f0, suggesting a strong relationship between the two variables. The ratio of the two averages is 1.8:1, which implies that this acoustic parameter is a robust acoustic correlate of gender in this dialect of Oromo (Figure 5). The interaction of gender and vowel quality is not significant (
 $ \chi^{2}$
(4) = 5.11, p < .28).
Raincloud plots of fundamental frequency (Hz) by gender. The error bars represent 95
 $\%$
of confidence intervals.

3.3 Formant frequencies
As expected, /aː/ has the highest F1 but /iː/ has the lowest F1. The vowel / /iː/ is typically a high vowel in the dialect and has a big height difference with the mid vowel /eː/ but such a difference is reduced in the case of the back vowels. The main effect of vowel quality on F1 is significant (
 $ \chi^{2}$
(4) = 57.18, p < .001) and it accounts for 83
 $\%$
(R
2
=.95) of the variances. Post-hoc comparisons indicate that all possible comparisons significantly differ from each other at p < .001. F2 of the vowels increase from the posterior to the anterior of the vocal tract, with the front vowel /iː/ having the highest average followed by the mid-front vowel /eː/. The central low vowel /aː/ has an intermediate F2 between the front and back vowels (Figure 6). As expected, F2 significantly varies as a function of vowel quality (
 $ \chi^{2}$
(4) = 62.58, p < .001). It explains 78
 $\%$
(R
2
= .78) of the variances, which is less than the contribution of F1.
Raincloud plots of the first three formant frequencies (Hz) by vowel quality. The error bars represent 95
 $\%$
of confidence intervals.

Post-hoc comparison tests indicate that except /oː/ and /uː/, all other possible comparisons significantly differ from each other at p < .001. Such vowels as /aː/ and /iː/ have the lowest and highest F3 respectively while the /uː/ and /eː/ have almost equal F3. Furthermore, the vowel /uː/ has a lower F3 than does /aː/. As a result, vowel quality significantly affects (F3:
 $ \chi^{2}$
(4) = 21, p < .001) but its contribution to the variances is small (R
2
= .26). Post-hoc tests also indicate that /iː/ significantly differs from the back vowels and the central vowel at p < .001.
Past studies reported a significant effect of gender on formant frequencies, with female speakers having higher F1, F2 and F3 but a few of them included effect size. In the current study, the female speakers produced all vowels with higher F1 (520 Hz), F2 (1705 Hz) and F3 (2910 Hz) (Figure 7). As a result, the formant frequencies significantly vary as a function of gender, (F1:
 $ \chi^{2}$
(1) = 11.90, p < .001; F2:
 $ \chi^{2}$
(1) = 11.43, p < .001; F3:
 $ \chi^{2}$
(4) = 32.06, p < .001). It is also observed that in addition to f0, F3 is a good correlate of gender in this dialect of Oromo. The comparison of the contribution of gender to variances of the formant frequencies (F1: R
2
= .46; F2: R
2
= .45; F3: R
2
= .82) confirms such a strong association between gender and the third formant frequency. The interaction of gender with vowel quality is also significant for only the first formant (F1:
 $ \chi^{2}$
(4) = 11.56, p < .02; F2:
 $ \chi^{2}$
(4) = 0.8, p < .94; F3:
 $ \chi^{2}$
(4) = 1.29, p < .86). The significant interaction seems to arise from the fact that female speakers have a higher value of F1 for the vowel /uː/.
Raincloud plots of the first three formant frequencies (Hz) by gender. The error bars represent 95
 $\%$
of confidence intervals.

3.4 Classification
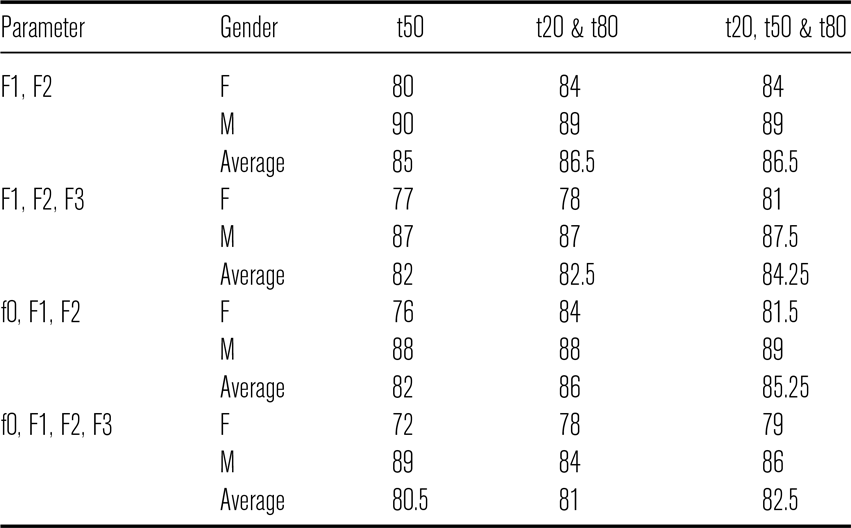
Support Vector Machine classifier was used with the objective of establishing how well the vowels could be classified based on different sets of acoustic parameters sampled at the midpoint (t50) of the vowel duration. The classification results indicate that there is a clear difference between the classification accuracy of vowel tokens of both genders (Table 4). When F1 and F2 were used, 80
 $\%$
and 93
 $\%$
of tokens of vowels of female and male speakers were respectively correctly classified. The addition of F3 led to resulted in a lower classification in both female (77
 $\%$
) and male vowels (87
 $\%$
). When f0 was entered along with the F1 and F2, the classification rates of the female and male vowels also decreased (Table 4). The first two formant frequencies seem to play a great role in the classification of male vowels while those of female vowels could slightly benefit from F3.
Percentages of correct classification of vowels of the dialect based on acoustic parameters measured at the midpoint (t50), two points (t20& t80) and three points (t20, t50 and t80) of vowel duration. The mean represents the averages of the correct classification of female (F) and male (M) tokens.

Support Vector Machine was also employed to determine how well the vowels could be separated based on different sets of acoustic parameters sampled at two-time and three-time points of the vowel duration. The classification rates showed some improvement when the parameters sampled at more than a one-time point are used in the classifier. The range for the two-time point samples is 81
 $\%$
to 86
 $\%$
while it is 82.5
 $\%$
to 86.5
 $\%$
for the three-time point samples. Tokens of female speakers’ vowels were more accurately classified when the formant frequencies and fundamental frequency measured at more than one point in the vowel duration were entered into the classifier. For instance, the highest rate of correct classification (84
 $\%$
) for this group was obtained when the acoustic parameters were sampled at two (t20 and t80) or three points (t20, t50 and t80) of the vowel duration. Again, F1 and F2 largely contribute to the correct classification of the vowels while the inclusion of f0 and F3 result in a reduced classification in the tokens of male vowels. Overall, tokens of male vowels were more correctly classified in all cases namely t50, t20 and t80 and t20, t50 and t80.
4 Discussion
The current study found that vowel duration significantly differs with gender, with female speakers producing longer vowels. Previous studies also reported significantly longer duration for female speakers of different languages such as American English, Dutch and Amharic (Hillenbrand et al. Reference Hillenbrand, Getty, Clark and Wheeler1995, Adank, van Hout & Smits Reference Adank, van Hout and Smits2004, Derib Ado Reference Ado2011). However, Tujube Amansa (Reference Amansa2018) observed that female speakers had longer duration only for /aː/ and /uː/ though these speakers produced all short vowels with longer duration. The difference between the two studies could be attributed to a methodological disparity. Vowels were embedded in different phonetic environments and their durations were not normalised to reduce the effect of such environments in Tujube Amansa (Reference Amansa2018). The durational variation of vowels with gender could be attributed to the tendency of female speakers to produce clear speech, which is known to have a longer duration for vowels relative to plain speech (Leung et al. Reference Leung, Jongman, Wang and Sereno2016).
Similarly, the study has shown that mean f0 exhibits a significant variation in vowel quality and gender, and this finding is consistent with the results in Tujube Amansa (Reference Amansa2018). Fundamental frequency (R 2 = .93) is the major acoustic correlate of gender, accounting for the lion’s share of the variance while formant frequencies, particularly F3 (R 2 = .36) can also indicate gender in the dialect under investigation. The fundamental frequency is derived from the vibration of the vocal folds, which is known to have an anatomical difference between female and male speakers. One of their major differences which is relevant here is that female speakers’ vocal folds are thinner and shorter; consequently, they produce vowels with higher pitch as compared to male speakers (Simpson Reference Simpson2001, Pisanski et al. Reference Pisanski, Fraccaro, Tigue, O’Connor, Susanne Röder, Andrews, DeBruine, Jones and Feinberg2014). Social factors can enhance the pitch difference (Cartei et al. Reference Cartei, Cowles, Banerjee and Reby2014) as gender roles are clearly differentiated in the speech community under the current study.
Consistent with the findings of previous studies on different languages including Oromo (Hillenbrand et al. Reference Hillenbrand, Getty, Clark and Wheeler1995, Berhe, Moxness & Nyland Reference Behne, Moxness and Nyland1996, Adank, van Hout & Smits Reference Adank, van Hout and Smits2004, Tujube Amansa Reference Amansa2018), in the current study, formant frequencies exhibit a significant variation with vowel quality. Vowel quality contributes greatly to the variances observed in the means of the first (R 2 = .75) and the second formant frequencies (R 2 = .68). These formants greatly contribute to the acoustic description of vowel quality of the dialect but the contribution of the third formant is relatively small (R 2 = .14). An instrumental investigation of the association between the tongue position and formants indicated that vowel height is strongly correlated to F1 and vowel backness to F2 (Ximenes et al. Reference Ximenes, Shaw and Carignan2017, Lawson et al. Reference Lawson, Stuart-Smith and Rodger2019). Given these empirical accounts, it is not surprising that the low vowel, /aː/ has the highest mean for F1 while the front vowel, /iː/ has the largest mean for F2 in the current study. The magnitude of F3 is linked to lip rounding because this articulatory gesture gives rise to the lowering of F3 for the back high vowel and to the rising F3 for the front high vowel (Lawson et al. Reference Lawson, Stuart-Smith and Rodger2019). As a result, the current study demonstrates that the front high vowel /iː/ has a higher F3 while the back high, /uː/ has a lower value for the same formant frequency.
As expected, female and male speakers significantly differ in the second and the third formant frequencies. The contribution of gender to the variance in the third formant frequency is not very small (R 2 = .36) and this is consistent with the contribution of this acoustic measure noted in classifying correctly tokens of female vowels. The observed difference could be related to the shape of the resonant cavity and the size of the larynx. The larynx grows and the shape of the vocal tract changes at puberty in a male person, causing a significant variation in the acoustic features of their vowels (Simpson Reference Simpson2001, Pisanski et al. Reference Pisanski, Fraccaro, Tigue, O’Connor, Susanne Röder, Andrews, DeBruine, Jones and Feinberg2014). The variation can also have a behavioural basis, whereby girls tend to speak like girls and boys do the same (Pepiot Reference Pépiot2012, Cartei et al. Reference Cartei, Cowles, Banerjee and Reby2014).
The study also demonstrates that spectral change separates vowels almost as effectively as the steady state. This finding is consistent with the results of past studies on vowels of North American 30 English, Dutch, and Western Sydney Australian English dialects. Vowels of these dialects were well separated when parameters measured at different time points were employed (Hillenbrand et al. Reference Hillenbrand, Getty, Clark and Wheeler1995, Adank, van Hout & Smits Reference Adank, van Hout and Smits2004, Elvin et al. Reference Elvin, Williams and Escudero2016. However, spectral change does not have an advantage over the midpoint in classifying Oromo vowels of the dialect. The reason could be that enough samples that capture the spectral dynamics of the vowels might not have been taken. In other words, more samples may be needed to characterise formant trajectories of vowels of the dialect. Acoustic features of the vowels may be better represented by taking measurements at multiple points, rather than by sampling a few static targets (Jenkins, Strange & Miranda Reference Jenkins, Strange and Miranda1994). Formant frequencies sampled at 30 time-points of vowels of Western Sydney Australian English yielded a satisfactory result in classifying the sounds of the dialect (Elvin et al. Reference Elvin, Williams and Escudero2016). Future studies on the dialect need to consider taking measurements at several time points of vowel duration to determine if the spectral change has an advantage over the steady state in classifying vowels of the dialect.
Finally, the current study shows that there is a difference between the classification rates of vowel tokens of female and male speakers (Table 4). The difference might not be attributed to anatomical differences because the normalisation procedure used (Z-score) could retain a phonemic variation effectively while reducing physiological differences (Adank, Smits & van Hout Reference Adank, Smits and van Hout2004). A factor that differentially affects the classification rates of vowels of female speakers may be responsible for the gender difference. This could be a possible area of investigation for future studies on the dialect.
5 Conclusion
This study investigates the acoustic characteristics of Oromo vowels of the northern dialect. The results show that, with the exception of duration, all other acoustic parameters significantly vary with vowel quality while f0, F1, F2, F3 and duration significantly differ with only gender. The classification rate of the vowels seems to vary with gender, with vowel tokens of male speakers more accurately classified. The spectral change (time-varying frequency) does not seem to have an advantage over a midpoint in classifying vowels of both genders. The acoustic parameters sampled at the midpoint may be enough to classify the vowels of the dialect but sampling acoustic features at multiple points may be needed to capture formant trajectories of the vowels. The number of participants is not large in the current study and thus a comprehensive acoustic study that will involve a large number of participants may be needed to address the gender difference in classification rates of the vowels.
Acknowledgements
This research was fully supported by Linguistic Capacity Building Project financed by the Norwegian government. The author is grateful to anonymous reviewers and Bodo Winter for helpful feedback.