I. INTRODUCTION
Recent advances in GaN-related semiconductor laser devices have enabled the emergence on the market of light sources in the ultraviolet (UV) to blue wave length region in watt output levels. This in turn promotes the rapid development of visible fiber lasers.Reference Okamoto, Kasuga, Hara and Kubota1–Reference Farries, Morkel and Townsend5 In 2009, Okamoto et al.Reference Okamoto, Kasuga, Hara and Kubota1 reported visible to near infrared (NIR) tunable fiber laser in a Pr3+-doped ZBLAN fluoride glass fiber using a GaN 448-nm multimode laser diode (LD) as a pump source. Then, Fujimoto et al.Reference Fujimoto, Ishii and Yamazaki2, Reference Fujimoto, Ishii and Yamazaki3 also demonstrated yellow and red laser oscillations by using Dy3+- and Pr3+-doped fluoride glass fibers, respectively. Using a 488-nm argon ion laser as pumping source, Yamashita and OhisiReference Yamashita and Ohisi4 realized a green laser at 542.8 nm from Tb3+-doped fluoride glass fiber. The fibers they used were all fluorides, which are usually unstable when exposed to air. Therefore, it is highly desirable to find an alternative material with excellent chemical durability and thermostability.
Actually in the 1980s, Farries et al.Reference Farries, Morkel and Townsend5 reported a Sm3+-doped silica optical fiber laser operating at 651 nm using a 488-nm argon ion laser as a pumping source. Due to the severe aggregation of Sm3+ when introduced into silica glass, high concentration doping is impractical. This hinders the development of compact of fiber laser devices and the realization of single frequency ultranarrow line width laser operation. On the contrary, multicomponent glasses, particularly phosphate glasses,Reference Seshadri, Rao, Rao and Ratnakaram6 can easily accommodate a high concentration of rare earth without concentration quenching. For instance, the content of Nd3+ can reach more than 2 × 1020 cm−3 in commercial laser phosphate glasses.Reference Campbell and Suratwala7 A phosphate glass is thus chosen as the host material in this investigation. In view of four-level transition nature of Sm3+ visible laser oscillation,Reference Lin, Pun, Wang and Liu8 the laser threshold is expected to be low. In addition, Sm3+ ions have wide absorption peaks from the UV to blue wave length region. Conveniently, it permits pumping with GaN LDs. As a first step to realize a visible fiber laser of Sm3+-doped phosphate glass, this work concentrates on the spectroscopic properties of the bulk glasses. Absorption spectra, static excitation and emission spectra, time-resolved luminescence spectra, fluorescence lifetime, and quantum yield are measured and discussed.
II. EXPERIMENTAL
A glass composition of 60P2O5–4B2O3–7Al2O3–10K2O–18BaO (in mol%) was selected as the target phosphate glass matrix. Various concentrations of Sm2O3 [x = 0.05, 0.1, 0.25, 0.5, 1.5, 3.0, 5.0 (mol%)] were introduced into the glass matrix by substitution with the equal amount of BaO. The glasses were labeled as P-xSm [x = 0.05, 0.1, 0.25, 0.5, 1.5, 3.0, 5.0 (mol%)]. Analytical reagents P2O5, H3BO3, Al(OH)3, K2CO3, and BaCO3 were used as starting materials. A 30-g mixture of the raw materials weighed according to the above nominal composition was batched for each concentration, homogeneously grounded and mixed, and then transferred to an alumina crucible. All the samples were melted at 1250 °C for 30 min while stirring with an alumina rod and then poured onto a preheated stainless steel plate at 300 °C. Afterwards, the samples were annealed at 450 °C for 3 h, then cut and polished for optical measurements.
The absorption spectra were measured with an absorption spectrophotometer (Lambda 900). The refractive indices of the samples were measured with a prism refractive photometer (WYV-V) using a 633-nm LD as light source. The refractive index of the glasses increased from 1.5366 to 1.5447 with Sm2O3 concentration increasing from 0.05 to 5.0 mol%. Glass densities were obtained by Archimedes method. The infrared (IR) absorption spectra were recorded with a Nicolet Magna-IR 550 series II spectrophotometer, which was manufactured by USA Nicolet company. The static excitation and emission spectra, the time-resolved luminescence spectra, the fluorescence lifetimes, and the quantum yields were measured with an Edinburgh FLS920 fluorospectrophotometer (Edinburgh Instruments Ltd., Livingston, UK) with double xenon lamp houses. All the measurements were carried out at room temperature.
III. RESULTS AND DISCUSSION
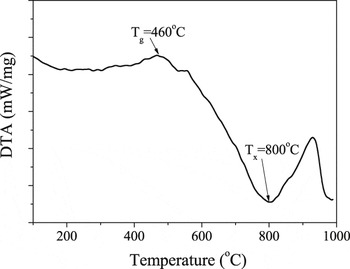
Figure 1 shows Differential Scanning Calorimetry (DSC) curve of the P-0Sm glass. The glass transition temperature (T g) and the onset temperature of crystallization (T x) are 460 and 800 °C, respectively. The large temperature region of T g − T x (340 °C) indicates an excellent thermal stability against crystallization.
DSC curve of the P-1.5Sm glass sample.

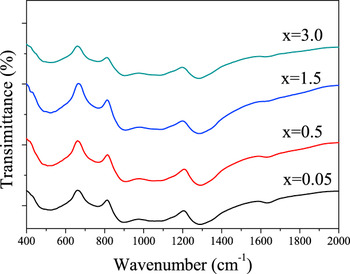
The IR absorption spectra of the P-xSm (x = 0.05, 0.5, 1.5, 3.0) glasses are shown as Fig. 2. The absorption bands at 509 and 769 cm−1 can be assigned to the O–P–O bending and ring vibrations, respectively, while the absorption bands located around 1080 and 1289 cm−1 can be attributed to the P–O stretching vibration.Reference Elisa, Vasiliu, Grigorescu, Grigoras, Niciu, Niciu, Meghea, Lfitimie, Giurginca, Trodahl and Dalley9, Reference Pascuta, Borodi, Junate, Vida-Simmiti, Viorel and Culea10 With increasing Sm3+ doping concentration, the IR absorption bands do not change noticeably, indicating that the glass microstructure is mainly composed of PO4 tetrahedral units and does not change significantly with increasing Sm3+ concentration.
IR absorption spectra of the P-xSm (x = 0.05, 0.5, 1.5, 3.0) glass samples.

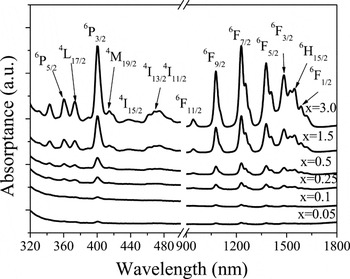
Figure 3 shows the absorption spectra of the P-xSm (x = 0.05, 0.1, 0.25, 0.5, 1.5, 3.0) glass samples. The absorption bands are distributed in the visible and IR regions and can be assigned to the typical transitions of Sm3+ from the ground state energy level 6H5/2 to the excited levels coded in Fig. 3, respectively. The positions of these absorption bands do not visually change with increasing Sm3+ concentration, whereas the absorption intensity increases monotonically with increasing Sm3+ concentration. Seven well-separated peaks (6H5/2→6P5/2, 6H5/2→4L17/2, 6H5/2→6P3/2, 6H5/2→4I11/2, 6H5/2→6F9/2, 6H5/2→6F7/2, and 6H5/2→6F5/2 corresponding to the absorption bands locating at 360, 374, 400, 467, 1077, 1228, and 1376 nm, respectively) were selected for Judd–Ofelt theoretical analysis.Reference Czaja, Bodyl, Gabrys-Pisaarska and Mazurak11, Reference Auzel12 The parameters Ω2, Ω4, and Ω6 were calculated to be 1.65 × 10⁻²⁰, 2.66 × 10⁻²⁰, and 2.65 × 10⁻²⁰ cm2, respectively, for the glass doped with 1.5 mol% Sm3+. With these parameters, the electric dipole transition probability A ed, the branching ratio of fluorescence β, the theoretical radiation lifetime τrad, and the quantum efficiency (QE) ηcal were obtained. The results are summarized in Table I. The absorption coefficients of the phosphate glass doped with 1.5 mol% Sm3+ are 0.42 and 0.16 cm−1 at 400 and 467 nm, respectively. The former is almost four times stronger than the absorption of Dy3+-doped fluoride glass at ∼400 nm.Reference Fujimoto, Ishii and Yamazaki2
Absorption spectra of the P-xSm (x = 0.05, 0.1, 0.25, 0.5, 1.5, 3.0) glass samples.

Parameters of 4G5/2→6Hj/2(j = 5,7,9) transitions for the 1.5 mol% Sm3+-doped phosphate glass sample.

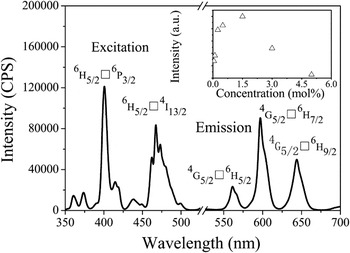
Figure 4 illustrates the excitation and emission spectra of the 1.5 mol% Sm3+-doped phosphate glass sample. Two excitation peaks at 400 and 467 nm can be observed due to the 6H5/2→6P3/2 and 6H5/2→4I13/2 transitions of Sm3+, respectively. Excitation by either 400 or 465 nm leads to a similar emission spectrum comprising three bands at 562, 596, and 643 nm. Among them, the band at 596 nm is always the strongest. This agrees well with the Judd–Ofelt analysis since the fluorescent branching ratio at this wave length is the biggest as shown in Table I.
Excitation (monitored at 596 nm) and emission spectrum (excited at 467 nm) of the 1.5 mol% Sm3+-doped phosphate glass sample. Insert shows the dependence between the emission intensity at 596 nm and the Sm3+ concentration.

The inset of Fig. 4 presents the dependence of the emission intensity at 596 nm on the Sm3+ concentration. The emission intensity increases linearly from 0.05 to 0.25 mol%, then, increases slowly and sublinearly from 0.25 mol% to 1.5 mol%, and finally decreases with increasing Sm3+ concentration. The emission intensity for 5 mol% Sm3+-doped glass is only one-twentieth of that for the 1.5 mol% Sm3+-doped glass sample.
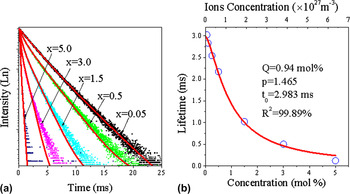
Temporal decay curves for all samples were recorded under excitation at 400 nm while monitoring the emission at 596 nm to elucidate the interaction mechanism between Sm ions (Fig. 5). The fluorescent lifetime is defined as the time when the emission intensity decays to 1/e of the initial intensity. The lifetime generally decreases with increasing Sm3+ concentration. This is understandable since the increase of Sm3+ doping concentration can reduce the distance between these ions and therefore enhance their interaction. The lifetime decreases fast from 0.05 to 0.25 mol%, then, decreases slower from 0.25 to 1.5 mol%, and finally decreases even slower from 1.5 to 5 mol%. These changes may be originating from the increase in probability of cross relaxation and reabsorption with increasing Sm3+ concentration. In addition, the decay curves follow a single exponential decay equation for glass samples doped with lower Sm3+ concentration. As the Sm3+ concentration increases beyond 1.5 mol%, the deviation of the decay curve from the single exponential equation becomes severe. This indicates that two types of Sm3+ exist in the glass sample doped with higher content of Sm3+, which may result in the occurrence of reabsorption.
(a) Fluorescence decay curves at 596 nm of the P-xSm (x = 0.05, 0.5, 1.5, 3.0) glass samples under excitation at 400 nm; (b) relationship between fluorescent lifetimes of glasses and the Sm3+ concentration and curve fitting result (red curve) according to equation  . The fitting parameters are Q = 0.94 mol%, p = 1.465, t 0 = 2.983 ms. The correlation coefficient is 99.89%.

Righini and Ferrari examined the intrinsic mechanism of interaction between ions based on the dependence of lifetime of rare earth-doped glasses on rare earth concentration.Reference Righini and Ferrari13 We fitted this dependence with an empirical equation proposed by them:

where τmeans is the observed luminescence lifetime, τ0 is the ideal luminescence lifetime in the limit zero rare earth concentration, ρSm is the Sm3+ ion concentration, Q is the critical concentration, and p is a phenomenological parameter. Fitting our lifetime measurements to Eq. (1) yields p = 1.465, Q = 0.940 mol%, and τ0 = 2.983 ms [Fig. 5(b)]. As p is close to 2, it can be deduced that the dominant mechanism of interaction between ions is dipole–dipole interaction.Reference Righini and Ferrari13, Reference Ferrari and Sakka14
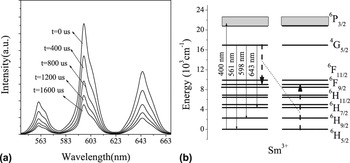
Time-resolved luminescence spectra of 1.5 mol% Sm3+-doped glass sample were recorded to clarify the decay process. They are shown in Fig. 6(a). Under a 400-nm excitation, the shape of the spectrum remains unchanged as the delay is prolonged. And since the emission at 562, 596, 643 nm all transit from the same energy level [shown in the inset of Fig. 6(b)], the intensity ratios between the three peaks, for instance I (596 nm)/I (562 nm) and I (596 nm)/I (643 nm), remain constant with time.
(a) Time-resolved luminescence spectra of the 1.5 mol% Sm3+-doped phosphate glass sample excited at 400 nm; (b) simplified energy level of Sm3+ together with the cross relaxation process between Sm3+ ions.

The absorption and stimulated emission cross sections are important parameters for future laser experiments. The absorption cross section can be calculated from the following equationReference McCumber15:

where OD(λ) is the optical density, l is the sample thickness, and N is the ions concentration of the glass. The Sm3+ ionic concentrations were obtained from the molar concentrations by the equation:

where ρsample is the density of the glass, m is the molar concentration of the rare earth, N A is Avogadro constant, M mean is the molar mass. For the sample doped with 1.5 mol% Sm3+, l is 0.5 mm and N is 2.06 × 1027 cm−3. Both the molar and ionic concentration for all samples are shown in Fig. 5(b). The absorption cross section is 1.059 × 10⁻²⁰ and 0.691 × 10⁻²⁰ cm2 at 400 and 467 nm, respectively. There relatively high value at 400 nm indicates that GaN LDs are promising pump sources for this laser glass.
The stimulated emission cross section was calculated by Füchtbauer–Ladenburg equationReference Berneschi, Bettinelli, Brenci, Nunzi Conti, Pelli, Sebastiani, Siligardi, Speghini and Righini16:

where λ is the average emission wave length, A ed is the transitions probability, Δλeff is the effective emission line width, c and n is light velocity and glass refractive index, respectively.  , where τmeas is the measured lifetime.
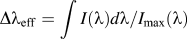 .Reference Auzel12 The calculated stimulated emission cross sections of the glass doped with 1.5 mol% Sm3+ are listed in Table I. The values at 596 and 643 nm are 3.911×10⁻²² and 2.513×10⁻²² cm2, in the same order as in fluozirconate and silica glasses.Reference Farries, Morkel and Townsend5, Reference Saissy, Azami, Jones and Maze17
The absolute QE (η) was measured in the 1.5 mol% Sm3+-doped phosphate glass sample using an integrating sphere. η can be calculated as followsReference de Mello, Wittmann and Friend18, Reference Liu, Chiu, Tung, Jang and Chen19
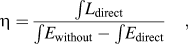
where L direct is the luminescence emission spectrum of the sample, collected using the integrating sphere; E without is the spectrum of the light used for excitation with only the total reflection sample in the integrating sphere, collected using the integrating sphere; E direct is the spectrum of the light used to excite the sample, collected using the integrating sphere. The measured QE of the 1.5 mol% Sm3+-doped glass sample is 2%, 10%, and 6% for the emissions at 562, 596, and 643 nm, which is smaller than the values of 9.3%, 13.8%, and 12.4% predicted based on Judd–Ofelt theory. It is partly due to the energy loss during the measurement process and to the reabsorption of Sm3+.
IV. CONCLUSIONS
In this work, absorption and emission spectra, fluorescence lifetime, and QE of Sm3+-doped phosphate glasses have been examined. Experimental values were analyzed and compared with the theoretical results by Judd–Ofelt theory. The larger absorption cross section (1.059 × 10⁻²⁰ cm2 at 400 nm) and stimulated emission cross section (3.911 × 10⁻²² cm2 at 596 nm) combined with the long fluorescence lifetime make phosphate glasses doped with Sm3+ promising materials for visible fiber laser. The large temperature range (T x − T g = 290 °C) indicates that the glass could be easily drawn into fiber. The present study will benefit the realization of stable visible fiber lasers.
ACKNOWLEDGMENTS
This work was financially supported by the National Natural Science Foundation of China (Grant Nos. 51072054, 51072060, 51102096, 51132004), the National Basic Research Program of China (973 Program) (2011CB808103), the Fundamental Research Funds for the Central Universities (Grant Nos. 2011ZZ0001, 2011ZB0001, and 2011ZP0002), the Natural Science Foundation of Guangdong Province (Grant Nos. 1045106410104887, S2011030001349), and the China Postdoctoral Science Special Foundation (Grant No. 201104350)