Introduction
Producer involvement in agricultural research is limited in crop variety development, particularly at public institutions in the USA and other developed countries. However, producer participation in agricultural research is not new. BiggsReference Biggs1 provides examples of producer participatory research during the 1970s. Most examples of participatory research are from producers in marginal agricultural environments in developing nations. In the 1990s, a number of International Research Stations started to experiment with different levels of producers and breeders participation in their plant breeding programs. Joshi et al.Reference Joshi, Sthapit and Witcombe2 reported that rice (Oryza sativa L.) growers in Nepal participated in setting the goal of breeding a white-grained rice variety. Producers selected rice lines in segregating material which resulted in acceptable rice varieties for their regionReference Sthapit, Joshi and Witcombe3. Sthapit et al.Reference Sthapit, Joshi and Witcombe3 reported that 16 producers were asked to rank seven rice varieties on a scale from 1 (excellent) to 7 (worst), incorporating positive and negative characteristics of each variety into their ranking. Producers and breeders mostly agreed upon the final ranking of the varieties. The variety rated as ‘excellent’ yielded the highest and the variety rated as ‘worst’ yielded the least of the tested varieties. Smale et al.Reference Smale, Bellon, Aguirre, Manuel Rosas, Mendoza, Solano, Martinez, Ramirez and Berthaud4 asked producers to ‘vote’ for previously collected maize (Zea mays L.) landraces that most attracted their attention. Maize preferred by producers conformed closely to the selection made by maize breedersReference Bellon, Berthaud, Smale, Aguirre, Taba, Aragón, Diaz and Castro5. Based on research data and the producers' input, elite landraces were selected. Thiele et al.Reference Thiele, Gardner, Torrez and Gabriel6 used questionnaires and forms to obtain knowledge about producers' interest in crop traits. Potato (Solanum tuberosum L.) farmers evaluated crop performance three times during the growing season, but it was found that an evaluation later in the season more closely reflected the producers' final choices.
Ceccarelli et al.Reference Ceccarelli, Grando and Hamblin7 evaluated barley (Hordeum vulgare L.) grain yield measured in low and high yielding environments and concluded that the alleles which control high grain yield in low yielding conditions are at least in part different from alleles which control high grain yield in high yielding environments. They indicated that selection under stress conditions or low yielding environments may result in better-adapted materials for those systems compared with material that was only selected under high yielding environments. Disease screening, however, should take place in inoculated nurseries. Van Eeuwijk et al.Reference Van Eeuwijk, Cooper, DeLacy, Ceccarelli and Grando8 suggested that if producers' specific environmental conditions cannot be created at research stations, on-farm locations should be included in germplasm evaluation. In certain cases, stress (low soil fertility levels or weedy conditions) can be created at a research site. Varieties developed using the results from the managed stress and non-stress environments may provide higher yielding varieties when used under low input conditions compared with varieties developed using conventional breeding systems where selection is done under optimal growing conditionsReference Bänziger and Cooper9. Ceccarelli et al.Reference Ceccarelli, Grando, Singh, Michael, Shikho, Al Issa, Al Saleh, Kaleonjy, Al Ghanem, Al Hasan, Dalla, Basha and Basha10 concluded that it is possible to organize a plant breeding program with producer involvement to develop varieties adapted to a multitude of environments.
Organic producers from Minnesota and North Dakota approached university extension and research staff with the request to evaluate hard red spring wheat varieties under organic production systems because they felt that conventional testing systems (with chemical inputs) did not provide them with the information needed to make variety choices. Their requests reflect suggestions by Lammerts van Bueren et al.Reference Lammerts van Bueren, Struik, Tiemens-Hulscher and Jacobsen11, Reference Lammerts van Bueren, Wilbois, Luttikholt, Wyss and Woodward12 that organic varieties should be bred and developed in environments managed organically. Participatory variety evaluation could be a first step in selecting adapted varieties to serve as parents in future variety development in organic production systemsReference Witcombe and Virk13. Participatory variety evaluation may also identify traits found to be important by producers.
Our goals were to determine if producers could identify and then rank growth traits that determined yield potential of hard red spring wheat. Our primary objectives were to determine if a farmer–researcher developed scoring system could be used to rank wheat varieties for yield potential when grown in certified organic fields. We also wanted to identify perceptions of organic producers about on-farm research and identify the educational impact of the participatory variety evaluation process. We published detailed information about the sites and wheat cultivar performance on certified organic fields in Minnesota and North DakotaReference Carr, Kandel, Porter, Horsley and Zwinger14.
Materials and Methods
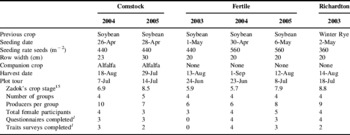
A working group consisting of organic growers, scientists and extension staff designed the experiments and selected the varieties to be included in the research. Twenty-six hard red spring wheat varieties were compared on certified organic farms near Comstock (46° 40′ N, 96° 45′ W, elevation: 284 m) and Fertile (47° 32′ N, 96° 17′ W, elevation: 349 m) in northwestern Minnesota and near Richardton (46° 53′ N, 102° 19′ W, elevation: 753 m) in southwestern North Dakota, USA, during 2003 through 2005. The experiments were located in fields prepared prior to seeding by the participating certified organic producers using standard practices on their farms, including weed control (Table 1). Plots were at least 1.2 by 6.0 m and arranged in a randomized complete block with variety treatments replicated four times at each location. Small-plot research planters with disc openers were used to seed the varieties. A small-plot research combine was used to harvest mature grain from the plots and yields were standardized to a 120 g kg−1 moisture basis.
Management information and plot tour data for experiments comparing 19 (in 2003 and 2004) and 13 (in 2005) hard red spring wheat varieties on certified organic fields located in Minnesota (Comstock and Fertile) and North Dakota (Richardton).

1 Not all groups were able to complete the forms within the given time and the questionnaire was not used in Fertile in 2003.
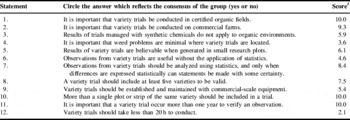
Site visits by 24–40 organic producers and crop scientists were made to each of the six locations during late-June to mid-July when wheat was at early heading through hard dough stage of kernel developmentReference Zadoks, Cheng and Konzak15. Attendees (total 12% female and 88% male) at each site were divided into groups comprised of 6–10 persons such that four groups were formed at all but one location, where five groups occurred (Table 1). Each group was given a questionnaire with several statements relating to the importance of comparing crop varieties in certified organic fields (Table 2). Groups were asked to respond, reflecting a consensus among members. A researcher or extension educator assigned to each group recorded answers after reading out loud each questionnaire statement. A score of 10 was assigned to each ‘yes’ and 1 to each ‘no’ response. Some groups could not reach a consensus and a proportional score was given between 1 and 10 depending on the percent ‘yes’ and ‘no’ answers in the group. A total of 17 completed answer sheets were used to calculate the results as not all groups were able to complete the forms within the given time and the questionnaire was not used in 2003 at Fertile.
Questionnaire evaluating opinions on the importance of conducting variety adaptation studies on certified organic fields from 17 producer groups.

1 If answer was ‘yes’ score is 10. If answer was ‘no’ score is 1. Some answers had comments and were given a score between 1 and 10 depending on the percent ‘yes’ and ‘no’ answers in the group.
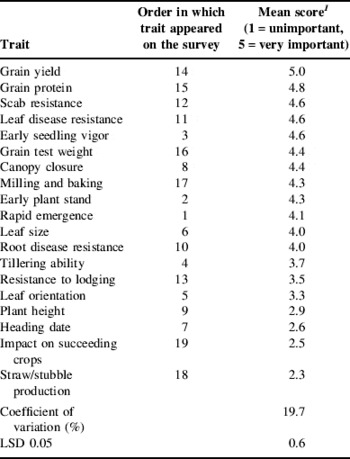
After completing the questionnaire, the groups received a survey, designed with input from organic producers, which asked for the ranking of different wheat traits including grain yield, grain quality, straw/stubble production and the impact on succeeding crops in order of importance (1=unimportant, 5=very important). Participants were instructed that no more than five of the 19 traits included in the survey could be assigned the same numerical rating (Table 3).
Order in which trait appeared on the survey and mean score ranking of selected traits for hard spring wheat varieties by 14 different organic producer groups in Minnesota and North Dakota, USA.

1 No more than 5 traits could receive the same numerical rating.
Producer groups then were assigned randomly to one of the four blocks of variety plots that comprised the field experiment. Without knowing the variety identities, each group was asked to rank all varieties in the block for growth and yield potential using a relative system, where 1 is lowest yield potential and 9 is highest yield potential. Typically, group members first selected the variety with the lowest and highest visual yield potential in the block, after which they ranked the remaining varieties between these two extremes. A researcher or extension staff member assigned to the group recorded the rank of each variety after group members agreed by consensus on a number. Groups were allotted approximately 40 min to complete their ranking. After the ranking was completed, the identities of the varieties were revealed along with growth characteristics and yield potential from conventionally managed trials on research stations, and other factors attributed to the varieties by plant breeders. Comparisons of the four independent group rankings also occurred at that time.
Data were analyzed across those locations with common variety treatments (Fertile and Richardson in 2003 and Comstock and Fertile in 2004 with 19 variety treatments, and Comstock and Fertile in 2005 with 13 variety treatments).
The F-protected least significant difference (LSD) was calculated according to Steel and TorrieReference Steel and Torrie16 for producer ranking, yield and yield as a percentage of block mean. As a single group of producers evaluated varieties in one block only, grain yield was expressed as a percentage of the mean of each block to calculate the linear regression with producer ranking as the independent variable and plant yield as dependent variable.
Results and Discussion
Producers indicated unanimously (10.0) that it was important to conduct organic variety trials on certified organic fields. They also valued (10.0) replicated trials conducted for more than 1 year (Table 2). The importance of on-farm replicated and multiple year research was also reported by Wortmann et al.Reference Wortmann, Christiansen, Glewen, Hejny, Mulliken, Peterson, Varner, Wortmann and Zoubek17. Plot tour participants debated the questionnaire's statements and meaning of ‘commercial fields’ and ‘statistics’ (statement 2 and 7) but mostly agreed that on-farm research (score 9.3) and statistics (score 8.4) are important. Producers mostly agreed (score 2.1) that on-farm research will take more than 20 h to conduct (statement 12).
Producers, unanimously, agreed that the most important consideration in the selection of a wheat variety is the grain yield (score 5, Table 3). Protein content, resistance to scab or Fusarium head blight caused by Fusarium graminearum, leaf disease resistance and early seedling vigor rated numerically as top priorities receiving scores not significantly different from those for grain yield. Plant height, date of heading, the impact of wheat on succeeding crops and straw production received lower priority in variety selection (score 2.9, 2.6, 2.5 and 2.3, respectively).
Based on comments received, producers valued the evaluation system that was used to rank varieties for their yield potential in local environments managed organically. Producers were forced to look closely at the varieties. In the survey exercise, producers previously had ranked important traits (Table 3).
2003–2004
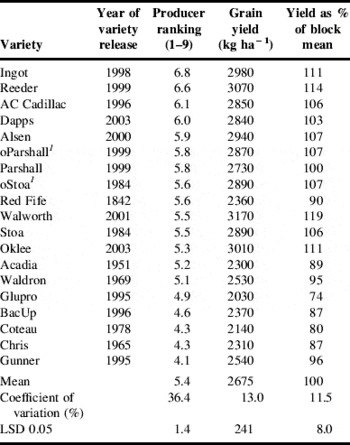
Producer rankings of the 19 varieties evaluated in 2003–2004 for grain yield were significantly different (Table 4). The highest ranking was given to ‘Ingot’ (6.8). The 11 entries (group within one LSD unit) which were given the highest producer ranking (mean 5.9) yielded 106% of the mean grain yield of each block scored by a group of producers (Table 4). The bottom group of 8 entries (mean 4.7 producer ranking) yielded 90% of the mean grain yield. In the first group ‘Red Fife’ was the only variety with lower than average yield (90% of the mean). Red Fife was the tallest (112 cm) variety. In the lower ranked group, ‘Oklee’ yielded 111% of the mean, and it was numerically the shortest (79.6 cm) variety. Red Fife (tallest) was ranked higher than Oklee (shortest). There are several examples where plant height obviously did not influence producer ranking for yield. For example, ‘Reeder’ was similar to Oklee in height (short) but producer groups ranked it high for yield (and they were correct). ‘Glupro’ and ‘Acadia’ were ranked relatively low for yield potential but were tall varietiesReference Carr, Kandel, Porter, Horsley and Zwinger14. ‘Walworth’, numerically the highest yielding variety (though statistically not different from Oklee, Reeder, Ingot and ‘Alsen’), received a producer ranking of 5.5. This variety had significantly more spikes (621 spikes m−2 compared to the trial mean of 482 spikes m−2) than any of the other varieties.
Year of variety release, producer group ranking for yield potential (1 is lowest yield potential and 9 is highest yield potential), actual grain yield and yield expressed as a percentage of the block mean for 19 variety treatments at Fertile and Richardson in 2003 and at Comstock and Fertile in 2004.

1 o=The seed lot was produced under certified organic conditions.
The ranking system was less useful in differentiating between varieties that ranked near the middle. Producers were asked to rank varieties for yield potential but not which traits to incorporate into their judgment. This resulted in differences of opinion between groups of evaluators, as was recorded also by Sthapit et al.Reference Sthapit, Joshi and Witcombe3. In that study, producers in India ranked rice varieties at the vegetative, flowering and mature plant stages. Courtois et al.Reference Courtois, Barholome, Chaudhary, McLaren, Misra, Mandal, Pandey, Paris, Piggin, Prasad, Raj, Sahu, Sahu, Sarkarung, Sharma, Singh, Singh, Singh, Singh, Singh, Singh, Sinha, Sisodia and Takhur18 reported that there was agreement among producers in India on the ranking of varieties, but unanimity about the ranking among producers was rare. Producers used barley grain yield as the main selection criterion in differentiating varieties in Syria, Morocco and Tunesia as described by Ceccarelli et al.Reference Ceccarelli, Grando, Bailey, Amir, El-Felah, Nassif, Rezqui and Yahyaoui19. In that study, plant height and tillering ability were also used and producers may have selected desirable combinations of traits rather than selection of one individual trait. When trained soybean (Glycine max L. Merr.) breeders were evaluating soybean plots for yield potential, they incorporated in their observations not only the seed yield (pods per plant) but also maturity, lodging and heightReference Hanson, Leffel and Johnson20.
2005
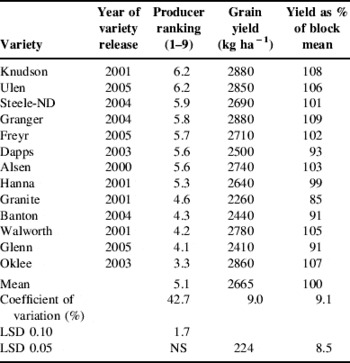
The same producer variety evaluation method was used in 2005 as in 2003–2004. The 2005 data showed no significant differences in producer ranking for yield potential (0.05 level), but there were significant differences in measured grain yield, and yield as % of block mean (Table 5). With the LSD of 1.7 (0.10 level) there is a top group of nine varieties not significantly different in producer ranking and a bottom group of four varieties. Oklee received the lowest producer score (3.3).
Year of variety release, producer group ranking (1 is lowest yield potential and 9 is highest yield potential), yield and yield expressed as a percentage of the block mean, for 13 wheat varieties at Comstock and Fertile in 2005.

The producer-ranking coefficient of variation for 2005 was 42.7% compared with 36.4% for the 2003–2004 observations. This indicates that there was large variability in the scores given to the varieties all three years. There were more visual differences between the varieties in 2003–2004 compared with 2005. For instance, in 2003–2004 plant height differences ranged from 80 to 112 cm (data not reported) and yield from 2140 to 3170 kg ha−1compared to plant height of 70 to 85 cm (data not reported) and yields from 2410 to 2880 kg ha−1 in 2005. It appears that producers were able to distinguish between larger observable differences among varieties during 2003–2004 compared with 2005.
Linear relationship
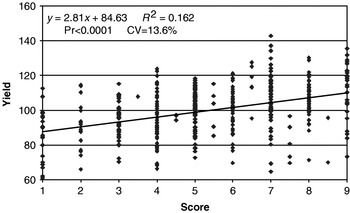
We were interested to see if producers were able to predict high yielding varieties based on their visual observations. In Figure 1, all producer ranking numbers of all varieties tested during 2003 through 2005 are shown. There was a significant linear relationship for higher yields with the higher producer rankings, but the R-squared value was only 0.16. There was also a significant linear relationship for increased crop height with higher producer rankings but with a low R-squared value of 0.02 (data not shown). Plant height was not considered a major wheat trait in our survey (Table 3), however, it was still a small factor in the evaluation of the varieties; this is not different from other research observationsReference Ceccarelli, Grando, Bailey, Amir, El-Felah, Nassif, Rezqui and Yahyaoui19, Reference Hanson, Leffel and Johnson20. There was no significant linear relationship between spikes per unit area and producer ranking (data not shown).
Regression of producer ranking (1 is lowest yield potential and 9 is highest yield potential) by grain yield expressed as percentage of the mean of the block evaluated by each producer group from six locations in 2003, 2004 and 2005.

Education
We compiled the data sets (all observed and recorded information) each year for winter educational meetings. Producers who had participated in the summer ranking exercise were eager to see how their ranking matched up with obtained yields. The data gathered from questionnaires, surveys and producers' ranking helped us to deliver winter meeting extension messages and information for plot tours during the following summer. One of the surprising ranking results was for Oklee (see Tables 4 and 5). The producer ranking for Oklee was relatively low in all locations, but the yield was above average. Producers apparently did not like this shorter variety and the more open canopy. It is unlikely that organic producers will adopt this variety. Knowing organic producers' preferences, from participatory variety evaluation, will help breeders and extension personnel in suggesting well-liked and adapted varieties for organic systems. Walworth had a producer ranking towards the lower end of the top group in 2003–2004 (5.5) and low in 2005 (4.2), but had an above average yield potential of 119 and 105% of the block mean in 2003–2004 and 2005, respectively (Tables 4 and 5). This variety had the highest number of spikes in 2003–2004, but the spike size was smaller (data not shown). We speculate that producers looked at the size of the heads and not at the number of heads when they ranked this variety. Researchers and extension staff often have additional agronomical information about certain varieties and may be able to interpret the ranking given by producers. In a participatory variety evaluation it will also be important to include buyers and end users of the product.
From an educational point of view, the process of using a survey first, to focus the attention of the producers on important traits, followed by the group ranking exercise and concluding with a general discussion, provided a hands-on learning setting. Those who participated in the summer event were eager to learn the yield results after harvest. This model of participatory evaluation can be used for many different crops, not only for variety identification, but also to evaluate weed control, fertility or other agronomic treatments. This approach also helped researchers and extension staff involved in the project to better understand producers' needs, thinking and way of observing the crop.
Lessons learned
As plot tour dates had to be set some weeks in advance of the event, the timing of the ranking exercise may not have been the optimum time in the crop development for reliable variety performance prediction. Ideally, participatory evaluation of varieties may have to be done at several critical crop development stages. Filling in the questionnaire and survey may have taken too much time and some producers lost interest and enthusiasm. We tried to come to consensus answers, which proved to be challenging, and we had to incorporate the diverse views into the analysis.
The large number of varieties made it difficult to distinguish between them. Starting with ranking the variety with the lowest yield potential followed by establishing the best variety worked well and producers easily agreed upon this decision. Although we wanted to spread the scores between 1 and 9, producers ended up ranking many varieties close to the middle range (5–7), and even gave ranking scores between numbers (for instance 6.5). More training before ranking varieties may improve the ability to separate the varieties.
It is important to have a facilitator to keep the group focused and moving along. After ranking the varieties, the producers were curious to find out the names of the varieties and additional information (already known from previous research) about these varieties. It was more challenging to rank the varieties evaluated in 2005 as the phenotypic variability was less pronounced compared with the varieties evaluated in 2003–2004. We speculate that with fewer plots to evaluate, and with more observable differences between variety treatments, it would be easier for producers to come to a consensus score.
Using the participatory model may lead to unexpected results. These may be as valuable as predicting varieties with high yield potential. In our case producers indicated some varieties they did not like visually.
Conclusion
This study demonstrated that variety adaptation research can be conducted on certified organic fields following standard experimental protocol. This project demonstrated that certified organic fields are suitable locations for conducting variety adaptation research, provided that well-planned crop rotations and other appropriate management strategies are followed. This project showed that producer-directed research efforts can be successful. Producers developed the objectives for the project, using university scientists primarily as consultants. University scientists were responsible for ensuring that field experiments were established and managed following acceptable scientific protocol, but producers were responsible for plant nutrient and pest management aspects of the research. The system of filling in a questionnaire and a survey along with ranking varieties engaged the producers in looking carefully at the plants. Farmers valued multi-year, replicated research under organic production systems. The varieties tested in 2005 were all developed through a conventional breeding program. Producers expressed the wish to incorporate specific traits, like early seedling vigor and quick canopy closure, into these varieties through a participatory plant breeding program where the next generation of varieties are selected and developed under organic field conditions and following the organic philosophy. The model of participatory variety evaluation may have potential to be used with other crops and in other locations.
Acknowledgements
We gratefully acknowledge producer cooperators Lynn Brakke, Duane and Chantra Boehm, Jim and Pat Todahl for their help in conducting this study. The work reported in this manuscript was supported by the USDA North Central Region—Sustainable Agriculture Research and Education (SARE) Program, Project no. LNC02-201 and the University of Minnesota Northwest Regional Partnership. All opinions, findings, conclusions or recommendations expressed in this manuscript are those of the authors and do not necessarily reflect the view of the USDA. Mention of a proprietary product name is for identification purposes only and does not imply endorsement or warranty to the exclusion of other products.