Implications
To estimate reliable breeding values of Swedish Warmblood horses and to reduce bias due to pre-selection of horses for competition, it is important to integrate all available information from both young horse tests and competitions. Lifetime competition results are recommended and high genetic correlations were estimated between results in competition and results from tests of 4-year-old. The equestrian sport has changed during the 20th century, and this study shows that competition results do not mean the same throughout the 35-year long period of recording. Future studies will investigate how to handle competition data from different time periods in genetic evaluations.
Introduction
For many years, the genetic evaluation for Swedish riding horses has been based on results from Riding Horse Quality Tests (RHQTs) only (Árnason, Reference Árnason1987). This 1-day field test was introduced in 1973 and about 18 000, that is about one-third of all 4-year-old horses, have participated so far. The aim of the test is to evaluate the overall quality of young sport horses. The major advantages of using young horse test data for genetic evaluations are that they include many and rather unselected horses and the traits show moderately high heritabilities. Therefore, breeding values for traits reflecting the breeding goal can be provided for both stallions and mares early in life, contributing to opportunities for faster genetic progress (Thorén Hellsten et al., Reference Thorén Hellsten, Viklund, Koenen, Ricard, Bruns and Philipsson2006). An issue is the correlation with competition results. Thus, if the correlations are not high enough it may be inefficient or even counterproductive that selection is based on indirect traits rather than directly on competitions results in dressage and show jumping at advanced levels, which constitute the real breeding objective as stated by the Swedish Warmblood Association (SWA, 2008).
Since the 1970s, competition data for Swedish riding horses have been computerized. About 40 000 horses are now included in this database, which corresponds to about 30% of the horses born. As the breeding objective of the Swedish Warmblood is to produce internationally competitive horses in dressage and show jumping, it is of interest to investigate the suitability of competition data for genetic evaluation. In Germany, France, Ireland, Belgium and the Netherlands competition results are used to estimate breeding values (Koenen and Aldridge, Reference Koenen and Aldridge2002). The disadvantages of using competition data are the pre-selection of horses before entering competition, the often long time before competition results become available, that competition data are more affected by training conditions, resulting in the generally low heritabilities of competition traits (Ricard et al., Reference Ricard, Bruns and Cunningham2000).
In Sweden, horses can start to compete in dressage and show jumping at the age of 4 years. Still, only few horses compete before the age of 5 years, and they do not reach more advanced levels until several years later. One question is whether early performances in competition express the same, or genetically correlated, traits as later performance at mature age. If they do, selection on early competition is possible and breeding value estimation can be made already at lower ages. Studies on other horse populations have shown that young horse performance in competition is highly correlated to later performance (Thorén Hellsten et al., Reference Thorén Hellsten, Viklund, Koenen, Ricard, Bruns and Philipsson2006).
In a recent study of RHQT data Viklund et al. (Reference Viklund, Thorén Hellsten, Näsholm, Strandberg and Philipsson2008) found differences in genetic parameters between time periods of testing horses indicating a change of the horse population by time. The competition data come from the early 1960s. Since then, both the sport and horse population has expanded considerably. Competition has also evolved through time because of the technical changes of competition. Therefore, it could be hypothesised that, competition traits have not been the same throughout the whole period.
To integrate all information into an overall index it is necessary to know the correlations between early performance at RHQT and competition results. Earlier studies on limited data of horses that participated in RHQT between 1973 and 1986 have indicated clearly positive correlations between RHQT and lifetime performance in dressage and show jumping (Wallin et al., Reference Wallin, Strandberg and Philipsson2003). In other European Warmblood horse populations, strong positive genetic correlations between young horse test and competition have been estimated as well (Thorén Hellsten et al., Reference Thorén Hellsten, Viklund, Koenen, Ricard, Bruns and Philipsson2006; Lührs-Behnke et al., Reference Lührs-Behnke, Röhe and Kalm2006a and Reference Lührs-Behnke, Röhe and Kalm2006b; Ducro et al., Reference Ducro, Koenen, van Tartwijk and Bovenhuis2007). The question is what are the effects of changes both in the genetically constitution of the population, and in the sport during the last few decades.
The objectives of this study were to investigate the suitability of competition data, collected during four decades, for genetic evaluation of riding horses, and to examine how well young horse performance, both at RHQT and early competitions, agree with competition performance later in life.
Material
Competition data
The Swedish Horse Board and the Swedish Equestrian Federation supplied the competition data. Results from Swedish riding horse competitions from 1961 to 2006 were available. The data comprised of 38 707 horses born between 1953 and 2002 which had competed in dressage or show jumping. Of these, 29 564 horses were in show jumping and 15 396 horses in dressage. Thus, more than 6000 horses had competed in both disciplines. The distribution between males and females were 22 428 and 16 279, respectively. The sex distributions differed in the two disciplines; in dressage 34% were females and in show jumping 45% were females.
Horses that are placed, that is, are among the 20% best in each competition, receive ‘upgrading’ points. A horse receives more points either for a better placing or at a more advanced level, or both. The purpose of this point system is to rank horses and exclude those with a certain number of points from participating at that same level again, and this is regulated by the Swedish Equestrian Federation. The number of starts was not recorded before 1983 for regional competitions, and the routines changed again in 1991, when only starts at the national level were recorded. Horses that had started in a competition, but had neither been placed nor received points, were given a zero result (24% of the dressage horses and 18% of the horses in show jumping). The data for this study consisted of summarised annual records and thus not results of individual competitions.
The expansion of the sport is illustrated by the average proportion of horses born in different periods that were placed in competition. During the period up to 1983 on average 2200 horses were born per year of which 16% were placed in competition during their lifetime. Between 1984 and 1991, 4000 horses were born annually of which 29% had achieved at least one placing in competition. Almost 3500 horses were born per year during 1991 and 2002, of which 30% had been placed in competition until 2006. Of horses aged of 7 years or older at the end of data collection in the last birth year period (horses born between 1992 and 1999), 37% had been placed in competition.
Performance traits were in this study defined as accumulated number of points and accumulated placings across all years, and the ratio between those traits (points per placing). The last trait indicates the level of successful performance of the horses but does not give credits for longevity in competition.
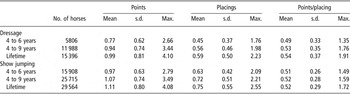
The results for each discipline were divided into three different age groups: accumulated results until aged 6 years, 9 years and lifetime results, that is including all results until 2006. The distribution of the competition traits was skewed and the traits were transformed with a 10-logarithm to an almost normal distribution, but with a slight excess of low and high values (Gelinder, Reference Gelinder1999). To make it possible to calculate the log value for horses with a zero value the number 1 was added to the result before transformation. The number of horses in each age group, and means and standard deviations for the competition traits transformed with 10-logarithm are presented in Table 1.
Means, s.d. and maximum (Max.) of 10-log transformed competition traits in different age groups

Competition data divided into groups by birth year
To investigate whether the competition traits changed during the long period of recording, the data were grouped according to the birth year of the horses. The same grouping criteria as in an earlier study on RHQT data were used (Viklund et al., Reference Viklund, Thorén Hellsten, Näsholm, Strandberg and Philipsson2008). The breaking points refer to periods of certain changes, that is a strongly increased genetic progress, and the use of imported stallions or imported semen. Group 1 included horses born until 1983, resulting in 13 245 horses in show jumping and 7467 in dressage. Group 2 included horses born between 1984 and 1991 (7285 in show jumping and 4219 in dressage). Group 3 included horses born between 1992 and 2002 (9034 in show jumping and 3710 in dressage). The horses were sired by stallions that had offspring in the different birth year groups. For example, 86 stallions had offspring in all three groups and 358 stallions had offspring in two groups ensuring genetic connectedness across the groups (Table 2).
Number of sires and offsprings in different birth year group (B1, B2, B3)Footnote a with results in show jumping and/or dressage

a Birth year group 1: 1953 to 1983, Birth year group 2: 1984 to 1991, Birth year group 3: 1992 to 2002.
b Each sire is only represented once.
c Offspring with results in competition. About 1480 of the horses in competition had no information of sire and were not included.
RHQT data
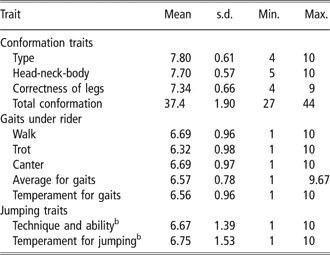
Data on horses scored in the RHQT were supplied from the Swedish Horse Board and the SWA. Results for 14 006 horses that had participated in RHQT from 1988 to 2007 were used. Most of the horses were 4-year-old, but 792 5-year-old mares that had foaled as 4-year-olds were also included. In total, 6497 mares and 7509 stallions and geldings were judged. Conformation consisted of five subtraits: type, head-neck-body, correctness of legs, walk and trot at hand. The horses also got a total conformation score, which was the sum of the five subtraits. In a riding test, individual gaits were judged. The score for jumping consisted of either free jumping, jumping under rider or an average of both whenever both were registered (changes were made over the 20-year period of recording). For both gaits and jumping the horses also received a temperament score. All traits were scored between 1 (very poor) and 10 (excellent). Viklund et al. (Reference Viklund, Thorén Hellsten, Näsholm, Strandberg and Philipsson2008) give a detailed description of the traits. Means, standard deviations, minimum and maximum values for the different traits scored in RHQT are given in Table 3.
Means, s.d., minimum (Min.) and maximum (Max.) values for traits in RHQT from 1988 to 2007Footnote a

a Number of records varied for the various traits between 12 988 and 14 006.
b A mix of free jumping and jumping under rider.
Competition results and RHQT
To estimate the genetic correlations between competition traits and traits judged at RHQT the above described two datasets were merged. Only lifetime results in competition were considered when estimating correlations with results in RHQT. Almost 50% of the horses that were judged in RHQT, that is, 6671 horses, had competition results in dressage or showing jumping.
Methods
Statistical analysis
Analysis of variance for competition traits
An analysis of variance was initially performed to test which effects to consider in the final genetic analyses, by using the GLM procedure in SAS (SAS Institute Inc., 2008). The effects of sex and birth year were tested. By considering birth year, all horses of the same age are given equal opportunities in the sport although the sport has developed considerably during the time period covered. The effect of rider was not tested because rider and horse were confounded as most riders only compete with one or few horses.
The analysis of variance showed that the effect of birth year was highly significant for all competition traits (P < 0.001). The effect of sex was significant for all dressage traits (P < 0.001). For show jumping, the effect of sex was highly significant (P < 0.001) for lifetime results and for points per placing in the age group up to 9 years of age. The effect of sex was less significant (P < 0.05) for accumulated placings in the age group up to 6 years. For the other show jumping traits, the effect of sex was not significant. The coefficients of determination (R 2-values) for competition data showed that 10% to 37% of the variation could be ascribed to the model including both tested effects. Clearly the effect of birth year had the greatest influence for all traits.
Estimation of genetic parameters
In accordance with results from the analysis of variances, the following animal model was used for competition traits:

where yijk is the score transformed with 10-logarithm of each trait for kth horse; birth yeari is the fixed effect of ith birth year (i = 1953,…, 2002); sexj is the fixed effect of the jth sex (j = male or female); animalk is the random effect of the kth horse ∼ND(0, Aσ 2a), and eijk is the random ∼IND(0, σ 2e) residual effect.
The following model developed by Viklund et al. (Reference Viklund, Thorén Hellsten, Näsholm, Strandberg and Philipsson2008) was used for RHQT traits:

where yijkl is the score of each trait for lth horse; eventi is the fixed effect of the ith combination of year and place of test (i = 1,…, 305); sexj is the fixed effect of the jth sex (j = mare, gelding/stallion); agek is the fixed effect of the kth age (k = 4 or 5 years of age); animall is the random effect of the lth horse ∼ND(0, Aσ 2a), and eijkl is the random ∼IND(0, σ 2e) residual effect.
The models included the additive relationship matrix (A) with sire and dam information. The pedigree of each horse with an observation was traced back seven generations. In total, the pedigree file included 81 103 animals for analyses of competition data, and 91 329 for the joint analyses of competition and RHQT data. Genetic parameters and their standard errors were estimated by the use of the average information algorithm (Jensen et al., Reference Jensen, Mäntysaari, Madsen and Thompson1997) for restricted maximum likelihood included in the DMU package (Jensen and Madsen, Reference Jensen and Madsen1994; Madsen and Jensen, Reference Madsen and Jensen2000).
Genetic parameters for competition results obtained for horses 4 to 6 years of age, horses 4 to 9 years of age, and lifetime results were estimated in trivariate analyses. Correlations between results from the three birth year groups were also estimated in trivariate analyses. In the analyses with birth year groups the residual covariances were set to 0. Correlations between competition traits and traits in RHQT were estimated in bivariate analyses including one competition trait and one RHQT trait.
The pedigree completeness in the pedigree file was quantified by computing the pedigree completeness index (PEC) of MacCluer et al. (Reference MacCluer, Boyce, Dyke, Weitkamp, Pfennig and Parson1983). For competition horses the average PEC value was 0.82. The average PEC values were 0.73 for horses in birth year group 1, 0.85 for horses in group 2 and 0.90 for horses in group 3. The average PEC value for horses participating in RHQT was 0.96.
Results
Effect of sex
The fixed effects solutions from the genetic analyses of competition data showed that males (stallions and geldings) were more successful in competition than mares, and more so for dressage than for show jumping. The differences between the sexes were 0.65 (accumulated points) for lifetime results in dressage, and 0.13 (accumulated points) for lifetime results in show jumping (not shown in a Table).
Genetic parameters for competition traits
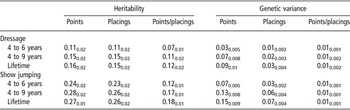
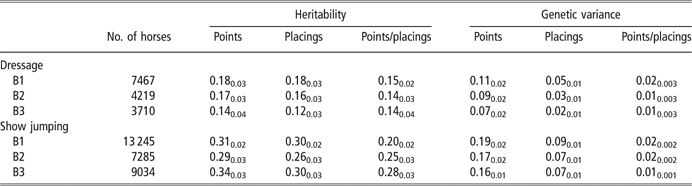
Heritabilities for dressage traits were low for all age groups, between 0.07 and 0.16 (Table 4). For show jumping the heritabilities were low-to-moderate, 0.12 to 0.28. For both disciplines, higher heritabilities were estimated for competition results of horses up to 9 years of age and lifetime results than for the youngest group. In each age group, accumulated points and accumulated placings showed higher heritabilities than points per placing. The additive genetic variances were in general two to three times higher for lifetime results compared with results of the youngest group.
Heritabilities and additive genetic variances with standard errors as subscripts for competition traits

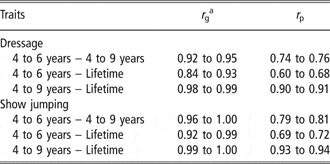
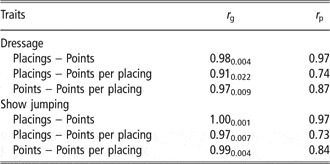
Very high genetic correlations (0.84 to 1.00) were estimated between all age groups in both disciplines (Table 5). The phenotypic correlations were also high, especially between results from 4 to 9 years of age and lifetime results (0.90 to 0.94). The genetic and phenotypic correlations between the different lifetime competition traits within discipline were very high, 0.91 to 0.98 and 0.97 to 1.00, respectively (Table 6). The highest correlations were estimated between accumulated placings and accumulated points.
Genetic (r g) and phenotypic correlations (r p) between competition traits in different age groups

aStandard errors for genetic correlations were 0.03 to 0.04 for dressage traits and 0.001 to 0.01 for show jumping traits.
Genetic correlations (r g) with standard errors as subscripts and phenotypic correlations (r p) between different competition traits

For dressage traits the highest heritabilities were estimated for horses born between 1953 and 1983 (0.15 to 0.18), and for show jumping the highest heritabilities were estimated for horses born 1992 and onwards (0.28 to 0.34) (Table 7). In both disciplines the genetic variances were highest for horses born between 1953 and 1983.
Heritabilities and genetic variances with standard errors as subscripts for competition traits divided into three groups by birth year (B1, B2 and B3)Footnote a
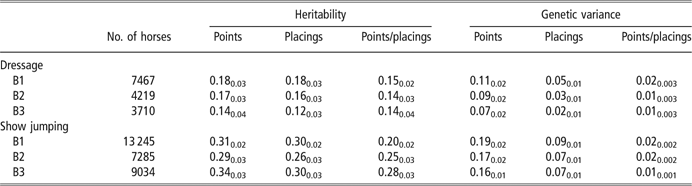
a Birth year group 1: 1953 to 1983, Birth year group 2: 1984 to 1991, Birth year group 3: 1992 to 2002.
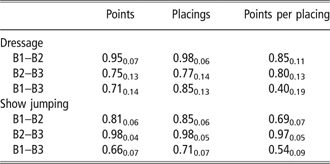
For dressage, the highest correlations (0.85 to 0.98) were estimated between birth year group 1 and 2 (Table 8). The lowest correlations were estimated between group 1 and 3, except for accumulated placings where the lowest correlation was estimated between group 2 and 3. For show jumping the highest genetic correlations were between group 2 and 3 (0.97 to 0.98), and the lowest between group 1 and 3 (0.54 to 0.71).
Genetic correlations, with standard errors as subscripts, between corresponding traits for different birth year groups (B1, B2 and B3)Footnote a
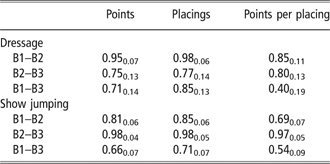
a Birth year group 1: 1953 to 1983, Birth year group 2: 1984 to 1991, Birth year group 3: 1992 to 2002.
Correlations between competition and RHQT traits
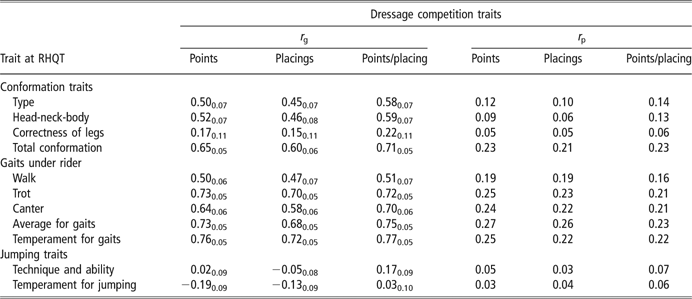
In Tables 9 and 10, genetic and phenotypic correlations between competition results and traits at RHQT are presented. Overall, the phenotypic correlations were, as expected, lower than the genetic correlations. Gait traits judged under rider at RHQT were positively genetically correlated to dressage competition (0.47 to 0.77). Genetic correlations between dressage competition and conformation traits were also highly positive (0.45 to 0.71), except for correctness of legs (0.15 to 0.22). There were slightly negative to slightly positive genetic correlations between jumping traits at RHQT and dressage competition results. Those traits were in general also phenotypically unrelated.
Genetic correlations (r g) with standard errors as subscripts and phenotypic correlations (r p) between traits at RHQT and dressage competition traits
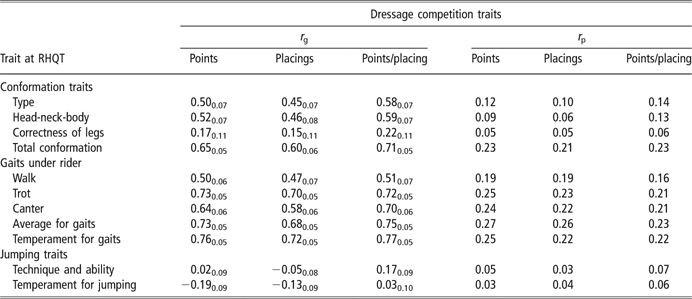
RHQT = Riding Horse Quality Test.
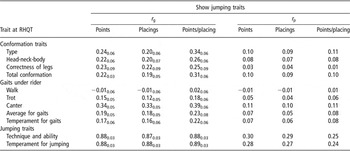
Genetic correlations (r g) with standard errors as subscripts and phenotypic correlations (r p) between traits at RHQT and show jumping competition traits

RHQT = Riding Horse Quality Test.
Very high positive genetic correlations were estimated between jumping traits at RHQT and show jumping (0.80 to 0.89). Between RHQT gait traits and show jumping the genetic correlation was moderate for canter (0.33 to 0.39), but low for the other traits (−0.01 to 0.23). Genetic correlations between conformation traits and show jumping were moderate (0.19 to 0.34). Phenotypically, conformation and gaits at RHQT were largely unrelated to show jumping results.
Discussion
Choice of trait
The competition data included mostly results from horses that had been placed in competition (76% of the dressage horses and 83% of the show jumping horses). This leads to a selection of the data because some horses compete but never or seldom achieve a placing. To get as unselected data as possible, all horses in each competition could be reported in a complete ranking, from the best to the worst horse. Then all horses contribute with information and the level of the competition can be determined. In Belgium, Germany and Ireland the trait rank in competition has been used in genetic analyses for riding horses (Janssens et al., Reference Janssens, Geysen and Vandepitte1997; Hassenstein, Reference Hassenstein1998; Reilly et al., Reference Reilly, Foran, Kelleher, Flanagan and Brophy1998). These authors used different transformations to handle the trait, for example the Blom score or the square root of placing. Ranking methodology is probably a good approach although it may be anticipated that ranking in the top of a competition is more accurate than among the bottom placed horses.
The heritabilities in this study were slightly higher than those of others (e.g. Huizinga and van der Meij, Reference Huizinga and van der Meij1989; Aldridge et al., Reference Aldridge, Kelleher, Reilly and Brophy2000; Brockmann and Bruns, Reference Brockmann and Bruns2000; Lührs-Behnke et al., Reference Lührs-Behnke, Röhe and Kalm2006a and Reference Lührs-Behnke, Röhe and Kalm2006b) and may be explained by the use of accumulated results up to different ages. However, the comparison of results from different studies is difficult because of the use of different definition of traits, transformations, age groups and statistical models. In general, heritabilities for competition traits are low to moderate. This is mainly because the traits are influenced by several non-genetic factors as training and rider. The heritabilities for lifetime results in competition were in the same range as earlier estimated by Wallin et al. (Reference Wallin, Strandberg and Philipsson2003).
Between the different traits within discipline, the genetic correlations were very high. The highest correlations were between accumulated points and accumulated placings. These traits are both measurements of how much and how well a horse has competed. The trait points per placing, instead, is a measurement of what level the horse has successfully competed at. If a single measurement were used, the heritabilities and additive genetic variances estimated indicating the log transformed accumulated points would be preferable.
Statistical model
Data used in this study covered a long period, during which opportunities for competitions changed considerably and the effect of birth year was shown to considerably affect the competition results. The horses born the first 20 years, 1953 to 1973, only corresponded to 10% of the horses in the competition data. Thereafter, the sport expanded, and the number of competing horses and competitions increased. Age at performance is often considered when analyzing competition traits (e.g. Huizinga and van der Meij, Reference Huizinga and van der Meij1989; Reilly et al., Reference Reilly, Foran, Kelleher, Flanagan and Brophy1998; Ricard and Chanu, Reference Ricard and Chanu2001; Lührs-Behnke et al., Reference Lührs-Behnke, Röhe and Kalm2006a and Reference Lührs-Behnke, Röhe and Kalm2006b). In this study accumulated results are used, which in combination with birth year leads to a comparison of horses with the same opportunity period for competition.
When using accumulated competition results, a horse could have results both as stallion and gelding. Therefore, only males and females were considered in the fixed effect of sex. Males were superior to females, which agrees with findings of Árnason (Reference Árnason1987) and Reilly et al. (Reference Reilly, Foran, Kelleher, Flanagan and Brophy1998) in their studies of Swedish RHQT data and Irish show jumping competition, respectively. The heat cycles of the mares can influence the willingness to cooperate with the rider. The sex difference was larger for dressage than for show jumping indicating that the more uneven temperament anticipated for mares may influence the dressage results more. Moreover, the sex distribution in the dressage competition data (66% males) shows that riders prefer a stallion or gelding for this discipline.
Pre-selection
Approximately 30% of the registered foals have competition records. This percentage was considerably higher than earlier reported by Wallin et al. (Reference Wallin, Strandberg and Philipsson2003). The selection of competition horses is due to talent, interest, exportation, and use in breeding. Considering that the data mostly only included horses that had been placed in competition (i.e. among the 20% best in each competition), the percentage is probably comparable to the Dutch competition data, where 30% of registered foals were brought into dressage competition and 20% into jumping competition (Huizinga and van der Meij, Reference Huizinga and van der Meij1989).
The pre-selection of horses for competition, and that the records largely refer to horses with placings, probably leads to a reduced additive genetic variance, which results in lower and underestimated heritabilities. Janssens et al. (Reference Janssens, Geysen and Vandepitte1997) estimated genetic parameters for different datasets; one including all available horses in young horse jumping competitions (4 to 7 years of age) and another including only the 25% best ranked horses. The additive genetic variance and heritability were very low for the reduced material, 0.0018 and 0.0243 compared to 0.0902 and 0.0979 for the whole material, respectively. The authors concluded that the use of the reduced material for genetic improvement would be inadequate because of both lower genetic variance and fewer horses evaluated. However, in this study the heritabilities for show jumping for horses up to 6 years of age were considerable higher than those estimated by Janssens et al. (Reference Janssens, Geysen and Vandepitte1997) for the dataset with complete records (0.14 to 0.24 compared with 0.10). This indicates that the selection of the Swedish material may not be as strong as in the Belgian data.
Differences between dressage and show jumping
The higher heritabilities and additive genetic variances for show jumping than for dressage may partly be explained by more information from more horses that had competed in show jumping. Furthermore, dressage riders may influence the horses more by training for competition in dressage than show jumping riders, as Kearsley et al. (Reference Kearsley, Woolliams, Coffey and Brotherstone2008) have shown for eventing horses. The results in dressage competition also depend on subjective judgments from one or several judges, which increase the residual variance, leading to lower heritabilities. The results from show jumping competitions are considered to be more objective even though the influence from the rider is also important. Higher heritabilities for show jumping than for dressage have been estimated in some studies (Huizinga and van der Meij, Reference Huizinga and van der Meij1989; van Veldhuizen, Reference Van Veldhuizen1997; Wallin et al., Reference Wallin, Strandberg and Philipsson2003). However, in other studies where genetic parameters have been estimated for both dressage and show jumping, the heritability estimates have been higher for dressage (Hassenstein, Reference Hassenstein1998; Brockmann and Bruns, Reference Brockmann and Bruns2000; Lührs-Behnke et al., Reference Lührs-Behnke, Röhe and Kalm2006a and Reference Lührs-Behnke, Röhe and Kalm2006b) or disciplines did not differ (Schade, Reference Schade1996; Ducro et al., Reference Ducro, Koenen, van Tartwijk and Bovenhuis2007).
Changes in competition traits
When dividing the horses in the competition data into birth year groups, the heritabilities for dressage were highest for the group of horses born in the earliest group (between 1953 and 1983) and lowest for the group of horses born in the last group (between 1992 and 2002). The low heritability in the last group could be because these horses were young, and for dressage horses the results at advanced levels come late in life. For show jumpers, on the other hand, the results in competition are often achieved earlier in life, and for these traits the highest heritabilities were estimated for the last birth year group.
The genetic correlations between birth year groups showed that the competition traits were not the same throughout the recording period. The sport has developed considerably and the proportion of competing horses out of born horses has increased continuously. In contrast to an earlier study of RHQT data (Viklund et al., Reference Viklund, Thorén Hellsten, Näsholm, Strandberg and Philipsson2008) the genetic parameters for competition results were less consistent over time. Thus, it is necessary to investigate the differences in heritabilities and variances between the different birth year groups for their impact on the genetic evaluations.
Performance for different age groups
In this study, heritabilities increased with increasing age of the horses because accumulated results were used and an older age group therefore contained more information on the horses. Lower heritabilities are often estimated with increasing age because environmental factors, such as training and rider, may have influenced the horses more (Tavernier, Reference Tavernier1992; van Veldhuizen, Reference Van Veldhuizen1997). In contrast, Ricard and Chanu (Reference Ricard and Chanu2001) estimated higher heritabilities with increasing age for annual performances in eventing horses. Most likely the genetic potential and variance is better expressed at more advanced competition levels than at lower competition levels.
Estimated genetic correlations between competition results for the different age groups were positive and very high. This indicates that results from young horses, and consequently at low levels of competition, can be used when estimating breeding values although the heritabilities were lower. When horses start to compete and get results, some selection takes place. Horses that perform well are likely to get more and better training than horses that do not perform well. This selection may contribute to the high levels of the correlations. Other studies confirm that genetic correlations between different age groups are very high (Huizinga and van der Meij, Reference Huizinga and van der Meij1989; Tavernier, Reference Tavernier1992; van Veldhuizen, Reference Van Veldhuizen1997; Ricard and Chanu, Reference Ricard and Chanu2001).
The heritabilities for lifetime show jumping traits (0.18 to 0.27) were in the same range as heritabilities estimated for jumping traits judged at young horse test for 4-year-olds (0.17 to 0.23), and for jumping traits at young horse test for 3-year-olds (0.23 to 0.33) (Viklund et al., Reference Viklund, Thorén Hellsten, Näsholm, Strandberg and Philipsson2008). The young horse should be less influenced by rider and trainer, but horses that compete in show jumping compete often and consequently have more information from competition than from the 1-day field test as a 4-year-old. For dressage heritabilities for lifetime competition traits (0.12 to 0.16) were lower than for gaits judged at young horse tests (0.38 to 0.48) (Viklund et al., Reference Viklund, Thorén Hellsten, Näsholm, Strandberg and Philipsson2008). The dressage horses compete less, especially at young ages, and they are probably more influenced by rider and trainer than the show jumping horses.
In comparison with the study by Wallin et al. (Reference Wallin, Strandberg and Philipsson2003), the genetic correlations between lifetime competition traits and traits judged at RHQT were in the same range or lower. Only the correlations between total conformation and dressage competition were higher in this study. A possible explanation for the differences between the studies is that the RHQT data in the study by Wallin et al. (Reference Wallin, Strandberg and Philipsson2003) only included 3708 horses that had been judged in RHQT between 1973 and 1986, compared to 14 006 horses judged between 1988 and 2007 in this study. Furthermore, the competition data in the study by Wallin et al. (Reference Wallin, Strandberg and Philipsson2003) comprised data to 1999, which means that the horses from RHQT had a chance to be at least 17 years old in 1999. In this study lifetime results in the last birth group could be the result for horses as young as 4 years because the lifetime result was defined as all competition results until 2006.
The highly positive genetic correlations found between performance in dressage competition and gait traits at RHQT, and even higher for show jumping and jumping traits at RHQT (Tables 6 and 7), indicate that results from RHQT are very good predictors of later performance at competitions. Other studies confirm that young horse tests are valuable for prediction of future performance. Lührs-Behnke et al. (Reference Lührs-Behnke, Röhe and Kalm2006a) found genetic correlations of 0.88 for rideability at mare tests and dressage competition but only 0.36 for free jumping at mare tests and show jumping. Ducro et al. (Reference Ducro, Koenen, van Tartwijk and Bovenhuis2007) estimated correlations to 0.69 between movements at studbook entry inspection and dressage competition and 0.87 between jumping test and show jumping.
Considering individual gaits, trot and canter are most important for becoming a successful dressage horse. This could be explained by more movements performed in trot and canter in the more advanced classes in dressage. Lührs-Behnke et al. (Reference Lührs-Behnke, Röhe and Kalm2006b) showed also that trot and canter were the most important gaits for dressage competition at the highest level, but at the lower levels all gaits seemed to have equal importance. In the study by Ducro et al. (Reference Ducro, Koenen, van Tartwijk and Bovenhuis2007), trot judged at studbook entry inspection was the gait most highly correlated to dressage competition results. In that study there were three to four different subtraits for each gait, and the genetic correlations with dressage varied from 0.05 (correctness in walk) to 0.67 (elasticity in trot). Huizinga et al. (Reference Huizinga, Boukamp and Smolders1990) estimated genetic correlations between field performance test of mares and competition and found canter to be the gait highest correlated to dressage (0.36). Yet, this correlation was low compared with other studies. Good gaits are probably not enough to succeed at higher classes in dressage. The trait temperament for gaits scored in RHQT, an expression for rideability, in this study was more strongly correlated genetically to performance in dressage competition than any of the individual gaits (0.77). In general our study shows comparatively high correlations between test results of 4-year-old and later competition results in the same discipline.
Between gaits judged at RHQT and show jumping, the genetic correlations were moderate for canter (0.33 to 0.39), but low for the other RHQT traits. The importance of canter for show jumping is also reported by Huizinga et al. (Reference Huizinga, Boukamp and Smolders1990), Lührs-Behnke et al. (Reference Lührs-Behnke, Röhe and Kalm2006a) and Ducro et al. (Reference Ducro, Koenen, van Tartwijk and Bovenhuis2007). They estimated genetic correlations to 0.36, 0.32 and 0.28 to 0.43, respectively.
Genetic correlations between jumping traits at RHQT and dressage competition results were low negative to low positive. In the study by Wallin et al. (Reference Wallin, Strandberg and Philipsson2003) the genetic correlations were low, but positive. Ducro et al. (Reference Ducro, Koenen, van Tartwijk and Bovenhuis2007) estimated weak to moderate and unfavourable genetic correlations between free jumping traits at studbook entry inspection and results from dressage competition (−0.34 to −0.09). In the study by Lührs-Behnke et al. (Reference Lührs-Behnke, Röhe and Kalm2006a) the genetic correlations were almost 0 (0.01) between free jumping at mare performance test and dressage competition. In contrast, Huizinga et al. (Reference Huizinga, Boukamp and Smolders1990) found a positive correlation between jumping ability at field performance test for mares and dressage (0.17). Thus, our study confirms the low relationships between dressage traits and show jumping, with the generally accepted exception of the positive correlation between canter and jumping traits.
Suitability for genetic evaluations
A great advantage for competition traits is that they directly reflect the breeding objective, and for show jumping traits the results from the present study show moderate heritabilities. For dressage traits the heritabilities were low and much lower than for the gait traits recorded at RHQT (Viklund et al., Reference Viklund, Thorén Hellsten, Näsholm, Strandberg and Philipsson2008). Drawbacks for competition results are that the horses are pre-selected for competition and that results come late in life, especially in dressage. Use of competition results in genetic evaluation of sport horses therefore leads to long generation intervals if selection has to wait for those results.
Competition performance can be measured in different ways. In this study, accumulated points, accumulated placings and the ratio between those have been analyzed for three different stages in life of the horse. The heritabilities, and genetic variances, were highest for accumulated points. Thus, this trait would be of most interest to use in genetic evaluations. For the different stages in the horses’ life, lifetime performance showed the highest heritabilities and genetic variances, and therefore it seems to be the most suitable approach. The lifetime performance in this study was defined as all results the horses had achieved until the end of data collection. This means that young horses also have a lifetime result even though they have not yet finished competing. Clearly young horses have fewer results, but this is corrected for in the analyses by including birth year as a fixed effect.
This research ultimately aims at integrating the results from the test of 3-year-olds (Viklund et al., Reference Viklund, Thorén Hellsten, Näsholm, Strandberg and Philipsson2008) and the competition data into the BLUP index system. It is considered important to make use of all data sources to both get as reliable proofs as possible and for the credibility of the indexes among breeders, trainers and riders. When results from tests of 3- and 4-year-olds are included in a multi-trait mixed model analysis, the effects of selected data for competitions are reduced because many more horses are evaluated as 3- and 4-year-olds, and at these occasions for both dressage and jumping traits. In constructing the indexes it is important to note that the initially described breeding objective is kept, that is competition results at advanced levels in dressage and show jumping respectively. The young horse test results should then be used as indicator traits. However, in the indexes most weight will be put on results from RHQT because the horses are tested for both disciplines, while they often only compete in one discipline. Moreover, the heritabilities for traits at RHQT are often higher than for competition traits (dressage) and the tests are more standardized than the competitions.
Conclusions
Lifetime competition results are recommended to be used in genetic evaluation of Swedish Warmblood horses because higher heritabilities were estimated when all competition results were included compared with only results from young horses. The accuracy increases when results from more years are added as more information of the horse is obtained.
Accumulated lifetime performance allows competition results to be available early in life for genetic evaluation as horses are compared within birth year.
The high genetic correlations between traits tested at RHQT for 4-year-olds and competition imply that results from the RHQT are desired to continuously be included in the genetic evaluation because they are highly correlated with the breeding objectives and results appear early in life.
Because of the pre-selection of horses for competition, integrated breeding values with results from young horse test and competition results would be preferable to indexes only including competition results.
Additional studies are needed to investigate how to handle competition data from different time periods in genetic evaluations because the equestrian sport has expanded and competition results do not mean the same throughout the 35-year long period of recording. Such studies should comprise for example studies of heterogeneity of the variances over time and comparison of breeding values and their variation, estimated with competition data from different birth year groups.
Acknowledgements
Financial support from the Foundation for Swedish Horse Research is gratefully acknowledged. The Swedish Warmblood Association, the Swedish Horse Board and the Swedish Equestrian Federation are gratefully acknowledged for providing materials for the study.