I. INTRODUCTION
All display devices, such as mobile phones, note book personal computers, monitors, and televisions, are driven by optoelectronics including active matrix liquid crystal displays (AMLCDs) and active matrix organic light emitting diodes (AMOLEDs) display. The brightness of each pixel in these AM displays is controlled by the thin film transistor (TFT) in a unit pixel. The next generation AM displays require a larger size (>60 inch), high resolution (>200 pixels per inch), and high frame rate (>120 Hz). Therefore, the allowed charging time per unit frame is decreasing continuously. For example, the charging time is ∼7 μs for TFT-LCD with a full high-definition (resolution: 1920 × 1080) and frame rate of 120 Hz. Nevertheless, a much smaller time of ∼1.2 μs is needed to drive the same-sized TFT-LCD panel with an ultra-definition (resolution: 3840 × 2160) and frame rate of 240 Hz. Therefore, the speed of TFTs should be increased substantially from ∼0.5 cm2/Vs to >5 cm2/Vs.Reference Matsueda1 The most popular backplane technology is amorphous silicon (a-Si) TFTs, which is a well-established proven technology in the LCD industry. This technology offers good substrate scalability up to generation 10 (glass substrate size: 2880 × 3130 mm2) and a low-cost process because it does not require crystallization and ion-doping processes. Furthermore, its amorphous nature ensures excellent uniformity of the device performance including field-effect mobility and threshold voltage. On the other hand, the detrimental problem is its low mobility (∼1 cm2/Vs), which makes it difficult to drive the next generation high performance AM-LCD and AM-OLED backplanes with a large size, high solution, and high frame rate. Furthermore, bias thermal stress (BTS)-induced instability has been a great concern for a long time. The threshold voltage of an a-Si TFT is displaced significantly under constant drain current stress or gate bias stress conditions due to either charge trapping into the underlying SiNx gate dielectric or weak bonding break-up of silicon and hydrogen in a a-Si thin film.Reference Jackson and Moyer2–Reference Jahinuzzaman, Sultana, Sakariya, Servati and Nathan4 This gives rise to image burnout or serious image sticking in AMOLED displays. Therefore, it is difficult to use a-Si TFTs as a backplane for AMOLED displays.
In contrast, low-temperature polycrystalline-Si (LTPS) TFTs exhibit high mobility (>80 cm2/Vs) and excellent device stability.Reference Theiss and Wagner5–Reference Jeong, Jin, Shin, Lee, Kim, Ahn, Lee, Mo and Kim7 The key processes in fabricating LTPS TFTs are the crystallization methods that convert a-Si into polycrystalline Si and ion doping for the formation of source/drain ohmic contact. The crystallization of an a-Si film is performed using an excimer laser with wave length of 308 nm.Reference Im, Kim and Thompson8 This process has already been used in the mass production of small size AMOLED displays. Excimer laser crystallization (ELC), however, has a narrow process window as well as high initial investment and maintenance costs. Moreover, the limitations in the laser-beam length and laser-beam instability are a major obstacle in the use of ELC on large-sized glass: the largest equipment available is applicable to Gen. 5.5 (a mother glass size of 1300 × 1500 mm2). The limitation of the substrate size as well as the expensive crystallization and doping process is still a hindrance to the adoption of LTPS TFTs into the advanced AMLCD and AMOLED displays.
In this regard, metal oxide TFT technology has attracted considerable attention because of its high mobility, low temperature capability, good transparency to visible light, and relatively low fabrication cost. The high fabrication cost of poly-Si TFTs can be alleviated by replacing them with metal oxide TFTs because oxide TFTs can be fabricated without intentional crystallization and doping processes. For this reason, metal oxide TFTs have been studied intensively as an alternative to a-Si TFTs for use in advanced AM displays. Several review papers described the advantages and recent advances of metal oxide TFTs.Reference Fortunato, Barquinha and Martins9–Reference Kamiya, Nomura and Hosono12 Nomura et al.Reference Nomura, Ohta, Takagi, Kamiya, Hirano and Hosono13 explored a new class of amorphous oxide semiconductors based on InGaZnO (IGZO) and reported that high performance transistors (μFE ∼ 8.3 cm2/Vs) can be fabricated using IGZO thin films deposited at low temperatures, even at room temperature. This report generated significant worldwide interest in high-end AMLCD and AMOLED technology, both in industry and academia because of the aforementioned intriguing features. The origin of the high mobility, even in the amorphous state, was attributed to the unique conduction band nature of this material, where the spherical symmetry of the 5s orbital makes structural disordering no longer critical. This is in strong contrast to silicon semiconductors, in which the mobility decreases significantly (from 600 to 1 cm2/Vs) when the phase transforms from the crystalline to amorphous state. The other important design concept of IGZO is that the incorporated Ga ions act as carrier suppressors of the IZO conducting oxide and network stabilizer.Reference Hosono14 Since then, progress in the device performance of IGZO TFTs has accelerated via the optimization of the cation composition,Reference Iwasaki, Itagaki, Den, Kumomi, Nomura, Kamiya and Hosono15,Reference Jeong, Jeong, Yang, Park, Mo and Kim16 the use of large area scalable gate insulator materials, such as SiNx or SiO2,Reference Lee, Kyung, Sung, Kim, Kang, Kim, Kim, Kim and Kim17,Reference Jeong, Jeong, Yang, Ahn, Kim, Kim, Gu, Chung, Park, Mo, Kim and Chung18 and the development of a novel device architecture.Reference Kim, Jeong, Lee, Ahn, Shin, Park, Jeong, Mo and Kim19–Reference Morosawa, Ohshima, Morooka, Arai and Sasaoka21 As a result of these efforts, many prototype IGZO TFT-driven AM displays have been reported, including 4″ full-color e-Paper,Reference Ito, Miyazaki, Ishizaki, Kon, Ikeda, Okubo, Matsubara, Hatta, Ugajin and Sekine22 12.1″ WXGA AMOLEDs,Reference Jeong, Jeong, Yang, Ahn, Kim, Kim, Gu, Chung, Park, Mo, Kim and Chung18 15″ XGA AMLCDs,Reference Lee, Kim, Yang, Hong, Yoon, Hong, Jeong, Park, Kim, Lim and Kim23 and 55″ full-HD AMOLED.24
The other potential application of ZnO-based TFTs reported is transparent electronics, such as smart windows, due to the transparency of the semiconducting channel layer to visible light (E g > 3.1 eV). The experimental data, however, suggests that the input and output characteristics of oxide TFTs are affected strongly by the irradiation of light under gate bias stress conditions.Reference Shin, Lee, Hwang, Park, Cheong, Ryu, Byun, Lee and Chu25 Indeed, the light-induced gate bias instability of metal oxide TFTs is a considerable hindrance to their commercialization into optoelectronic devices. In particular, the light-induced gate bias instability of metal oxide TFTs is more severe due to the abundance of blue or ultraviolet regions of back light units for applications to TFT-LCD panels, which have the largest market volume among the various AM displays. The stability of oxide TFTs against backlight exposure should be guaranteed for this purpose.
This paper examines the issue of photo-bias instability comprehensively. The importance of negative bias illumination stress (NBIS) instability is explained based on the optoelectronics applications. The three types of degradation mechanisms including the carrier trapping model, oxygen vacancy photoionization model, and ambient interaction model are addressed under NBIS conditions. It is noted that both carrier trapping and oxygen vacancy photoionization mechanisms involve the bulk effect in the channel layer and gate insulator, whereas the ambient interaction mechanism is relevant to the surface effect of the channel layer. Based on an understanding of NBIS instability, several approaches to prevent the NBIS instability of metal oxide TFTS are proposed.
II. DEGRADATION MODEL OF NBIS INSTABILITY
A. What is NBIS-induced instability?
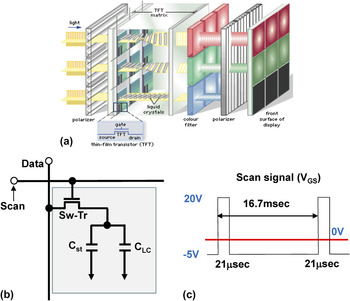
All optoelectronic devices are basically comprised of TFT arrays (back-plane) and display mode (front-plane). Figure 1(a) shows a schematic cross-section of TFT-LCD displays. Because a LCD display is nonemissive, it requires a back light unit, such as cold cathode fluorescent lamp and light-emitting diode. This intense light always illuminates the TFT backplane. Each TFT in a single sub-pixel acts as a switching device, which supplies the information signal to the storage capacitor [Fig. 1(b)]. The charges stored in the storage capacitor modulate the transmittance of liquid crystals during a frame time. Amorphous silicon films have been used as the channel layer in the case of conventional TFT-LCD displays. The light shielding structure has been adopted in TFT-LCD displays due to the large photoconductivity of a-Si film. Therefore, most of the strong illumination can be blocked by the metal gate electrode beneath the a-Si channel layer. On the other hand, a small portion of back light (<5%) can still be transmitted by lateral refraction via the gate insulator and passivation layer. Therefore, the photon-induced instability should be controlled carefully to meet the specifications of the TFT-LCD display. Simultaneously, each pixel transistor is subjected to continuous AC pulse stress. Figure 1(c) shows the typical timing diagram of the driving gate voltage during a single frame duty. The typical frame rate of 60 Hz means that the pixel is addressed 60 times per second. Therefore, the duty time of a single frame is 16.7 ms. The ratio of the turn-on time (∼21 μs) to the turn-off time (∼16.7 ms) during a single frame time is approximately 0.001. Therefore, the negative bias thermal stress (NBTS) instability is much more stringent than the positive bias thermal stress (PBTS) instability under light illumination. This light-induced bias instability is also important for AMOLEDs and flexible displays because transmissive (OLED) and reflective (E-paper) display devices are adversely affected by the self-emitting light and ambient sunlight, respectively.
(a) Schematic three-dimensional cross-section of the conventional TFT-LCD display panel. (b) Unit pixel circuit diagram of the TFT-LCD display. (c) Typical driving diagram of the driving voltage for the TFT-LCD display. The ratio of the turn-on time to the turn-off time was ∼0.001.

B. Photoinduced BTI instability
The dark gate bias stress instability has been investigated extensively. JeongReference Jeong26 published a review paper. Nevertheless, the effect of dark gate BTS on the degradation of metal oxide TFTs should be understood clearly before studying the light-induced BTS instability. The threshold voltage of oxide TFTs is displaced positively during the application of PBTS.Reference Cross and De Souza27,Reference Suresh and Muth28 Because as-grown metal oxide semiconductors are generally n-type, the application of a positive voltage to the gate electrode accumulates the majority electron carriers at the gate/channel interface region. This positive V th displacement can be attributed to either the trapping of electron carriersReference Cross and De Souza27 or injectionReference Suresh and Muth28 into the bulk film of gate insulator. Here, the interfacial states or channel bulk trap sites provide possible trapping sites for any type of carrier. On the other hand, the negative shift in V th under NBTS conditions is more subtle. Obviously, the negative V th shift cannot be justified by electron trapping at the channel/gate insulator interface because electron trapping results in a positive V th shift. Therefore, the negative V th shift can be assumed to originate from the hole carrier trapping at the channel/gate insulator and/or injection into the gate dielectric bulk film, where the inversed hole carrier is caused by the applied negative gate voltage stress. Nevertheless, the number of hole carriers in the NBTS condition would be extremely small because there is a huge sub-gap density of states (1020/cm3) near the valence band of the IGZO film.Reference Nomura, Kamiya, Yanagi, Ikenaga, Yang, Kobayashi, Hirano and Hosono29 Given that the magnitude of the negative voltage range is less than −30 V and the gate insulator capacitance is approximately 17 nF/cm2 (e.g., 200-nm-thick SiO2), the number of positive carriers in the channel can be estimated to be ∼3.2 × 10¹³/cm2. Assuming that the channel thickness is around 50 nm, the maximum hole trapping sites due to the huge sub-gap states near the valence band of IGZO film would be approximately 5 × 10¹⁴/cm2. Therefore, the number of gate voltage-induced hole carriers would be less than that of hole trapping sites due to one order of magnitude larger number of gap states. This simple calculation suggests that in the dark NBTS condition, the negative V th shift cannot originate from hole carrier trapping. For this reason, the de-population of donor-like traps was suggested to explain the NBTS-induced negative V th shift.Reference Ghaffazadeh, Nathan, Roberson, Kim, Jeong, Kim, Chung and Lee30 One possibility would be that a neutral oxygen vacancy defect accepts a hole carrier to form a positive oxygen vacancy defect where an oxygen vacancy acts as a donor-like trap.
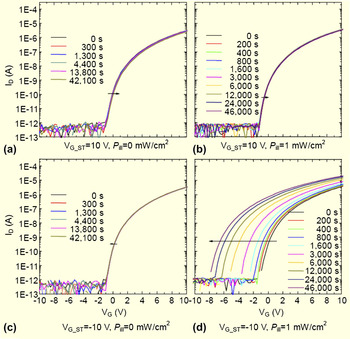
The first NBIS instability was reported for ZnO TFTs.Reference Shin, Lee, Hwang, Park, Cheong, Ryu, Byun, Lee and Chu25 The V th value of oxide TFTs was shifted slightly to the positive (negative) direction under dark PBTS (NBTS) conditions, as shown in Figs. 2(a) and 2(c). This instability was attributed to either the trapping of charge carriers or injection into the gate insulator bulk film. Here, the possibility of defect creation in the channel region can be excluded because there is no degradation of the subthreshold gate swing for the transfer characteristics during BTS duration. This anomalous behavior was observed for light-illuminated devices under BTS conditions. Although a positive bias illumination stress (PBIS) does not give rise to a shift in the V th value, the huge negative displacement of the transfer characteristics occurs under NBIS conditions, as shown in Figs. 2(b) and 2(d). The trapping of photoinduced hole carriers at the channel/gate insulator was used to explain the severe NBIS instability. On the other hand, the microscopic mechanism was not discussed in detail.
Evolution of the transfer characteristics for ZnO TFTs (a) under dark PBS conditions, (b) PBIS conditions with a photo-intensity of 1.0 mW/cm2, (c) dark NBS condition, and (d) NBIS condition with photo-intensity of 1 mW/cm2. The ZnO channel layer was prepared by plasma-enhanced atomic layer deposition (PEALD). A top gate structure was adopted with a gate insulator of ALD-derived Al2O3 thin film, which produced good BTS stability. The stress gate voltage (V GS_ST) was 10 V and −10 V for PBS and NBS conditions, respectively. A green light with a wave length of ∼540 nm, which was selected from a tungsten–halogen lamp through a band-pass filter, was used as the illumination source. Reproduced with permission from Ref. Reference Shin, Lee, Hwang, Park, Cheong, Ryu, Byun, Lee and Chu25.

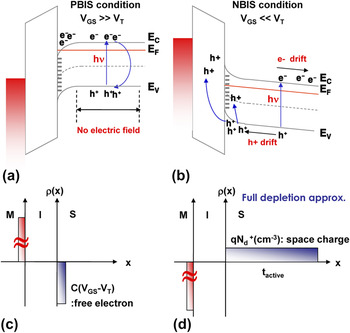
The reason for this asymmetric polarity dependence of the bias illumination stress-induced instability should be discussed. Figures 3(a) and 3(c) show a plausible band diagram of the metal/insulator/semiconductor (MIS) structure under PBTS conditions along with the corresponding charge distribution, respectively. In the case of the PBTS condition, the MIS structure becomes a simple capacitor because the majority of electron carrier is accumulated in the channel region. The very thin accumulated electrons (less than several nanometers) screen the electric field from the gate electrode. Therefore, there is a negligible electric field in the bulk oxide semiconductor region. Suppose that electron–hole (e–h) pairs via the band-to-band transition are created by photon excitation. These excessive e–h pairs begin to recombine rapidly because they remain in the same channel region after turning off the PBIS. Therefore, the effect of light illumination would be insignificant. On the other hand, the application of NBTS to the gate electrode results in full depletion of the channel layer, which results in a nonnegligible electric field in the channel region, as shown in Figs. 3(b) and 3(d). Therefore, the photoinduced e–h pairs will be separated by the existing internal electric field. This is similar to the creation of a photocurrent by the depletion layer in a photovoltaic cell.Reference Neamen31 Here, the hole carriers generated by photoexcitation are attracted to the interface of the channel layer and gate dielectric layer due to the negative bias at the gate electrode. These hole carriers are likely to be trapped at the interfacial trap sites or are injected into the underlying gate dielectric layer, leading to a more enhanced negative V th shift compared to that under only dark NBTS conditions, as shown in Fig. 4(a). The basic assumption is that the irradiated photon energy is larger than the energy band gap of oxide semiconductor materials so that the photoexcitation of electron in the valence band to the conduction band is possible. On the other hand, although the sub-band gap photon (hμ < E g) is illuminated on oxide TFTs, NBIS instability is still observed.Reference Kim, Kim, Kim, Park, Song, Jeon, Ahn, Park and Jeong32,Reference Chung, Kim, Kim, Cho, Jung, Jeong and Hwang33 This suggests that a defect center in the forbidden band gap plays an important role in determining the overall V th instability. This defect center can be an oxygen vacancy defect, zinc interstitial, or hydrogen-related complex. Unfortunately, direct evidence showing which defect species is responsible for NBIS instability has not been provided, even though the identification is scientifically and technologically important. Among the range of defects, the NBIS instability is frequently attributed to oxygen vacancy defects, as shown in Fig. 4(b).Reference Ji, Kim, Jung, Park, Choi, Kim, Hwang, Lee, Hwang and Jeong34,Reference Ryu, Noh, Choi and Chang35 An alternative explanation can be based on the photo-desorption of oxygen molecules or moisture on the back surface of the oxide channel in the case of an unpassivated device.Reference Yang, Cho, Ryu, Park, Hwang, Jang and Jeong36 The following three types of degradation mechanisms are discussed in detail.
Plausible energy band diagram of the MIS structure under (a) PBTS and (b) NBTS conditions. The corresponding charge distributions of the MIS structure under (c) PBTS and (d) NBTS conditions.

Schematic energy band diagram to explain the observed experimental results, which is based on (a) trapping or/and injection of a photoinduced hole carriers and (b) photoionization of neutral oxygen vacancy [VO] to [ ${\rm{V}}_{\rm{O}}^{{\rm{2 + }}}$] charged state.

In the case of a-Si, prolonged light illumination reduces the conductivity of the a-Si thin film, which can be attributed to the formation of a metastable deep-level defect (known as the Staebler–Wronski effect).Reference Staebler and Wronski37,Reference Stutzmann, Jackson and Tsai38 Therefore, a-Si TFTs under light illumination would be affected adversely by stretching-out the subthreshold drain current. Simultaneously, a-Si TFTs suffer from a severe photo-leakage current, which originates from the excessive e–h carriers created by the smaller band-gap of ∼1.7 eV during light illumination.Reference Kagan and Andry39 On the other hand, light irradiation into metal oxide TFTs normally accompanies a huge negative shift in the threshold voltage without significant degradation of the subthreshold gate swing, which suggests that the photoinduced carrier generation center is rather deep so that the Fermi level can never reach the defect levels responsible during transistor operation. Moreover, the photo-leakage current of metal oxide TFTs is much smaller than that of a-Si TFTs because the number of the e–h pairs generated via a band-to-band transition would be negligible compared to that of a-Si film due to the large band-gap of the a-IGZO film (∼3.2 eV).Reference Douglas, Scheurmann, Davies, Gila, Cho, Craciun, Lambers, Pearton and Ren40
C. Carrier trapping or injection model
The dark BTS instability of metal oxide TFTs is often attributed to a carrier trapping or injection model. The application of PBTS to metal oxide TFTs causes positive displacement of the V th value. The V th instability due to carrier trapping phenomenon depends strongly on the density of interfacial traps (N it) or channel bulk trapping states. Moon et al.Reference Moon, Lee, Kim, Kang, Jeong, Lee and Park41 reported that the SiOxNy layer can be a good way of achieving better BTS stability compared to the SiNx gate insulator. They converted the surface of the SiNx gate insulator to a SiOxNy interfacial layer by an oxygen plasma treatment. Therefore, the PBTS instability of IGZO TFTs can be strongly suppressed for the oxygen plasma-treated device, which suggests that N it of SiOxNy/IGZO is lower than that of SiOxNy/IGZO. An alternative explanation is that the conduction band-offset (electron barrier height) for SiOxNy/IGZO is higher than that of SiNx/IGZO due to the larger band-gap of SiOxNy. This is consistent with a carrier trapping mechanism.
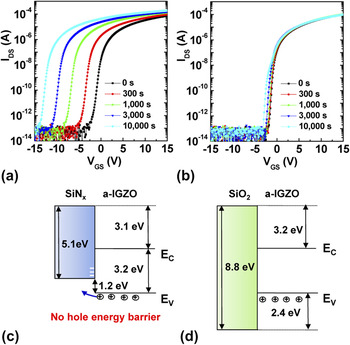
The effect of the gate insulator materials on the photo-bias instability of metal oxide TFTs can be explained well by a carrier trapping/injection mechanism because the interface states and band-offset value depend strongly on the material properties of the gate insulator. Figures 5(a) and 5(b) show the time evolution of the transfer curves for the SiNx-gated device and SiO2-gated IGZO TFTs, as a function of the NBIS time, respectively.Reference Ji, Kim, Mo, Jeong, Yang, Hwang, Park, Ryu, Lee and Jeong42 The N it (8.9 × 10¹¹/cm2) of the SiNx-gate device was approximately 3 times higher than that (3.0 × 10¹¹/cm2) of SiO2-gated device, which was approximated from the subthreshold gate swing values from both devices.Reference Ji, Kim, Jung, Park, Mo, Jeong, Kwon, Ryu, Lee, Choi and Jeong43 The inferior stability of the nitride device was manifested more clearly under NBIS conditions. Although the V th value for SiNx-gated device was shifted significantly in the negative direction (by 11.6 V), the SiO2-gated device exhibited V th movement of only −0.78 V. The consistent inferior stability of the IGZO TFTs with the SiNx gate dielectric is believed to originate from its high N it value, which concurs with the trapping mechanism of the photoinduced hole carriers. On the other hand, it is not obvious that the approximate 14-fold increase in the amount of the V th movement in the SiNx-gated device (SiNx-gated device: ΔV th = −11.6 V, SiO2-gated device: ΔV th = −0.78 V) under NBIS conditions can be attributed entirely to the approximately three times higher N it of the SiNx-gated device. Indeed, the hole carriers near the channel region feel the hole potential barrier (i.e., valence band offset) at the interface between the gate dielectric and channel layer. Figures 5(c) and 5(d) show the energy band diagram for the SiNx/IGZO, and SiO2/IGZO structure, respectively, based on the result of the valence band profile obtained. Here, it was assumed that the band gap of SiNx and SiO2 were 5.1 and 8.8 eV, respectively.Reference Tan, Chim, Cho and Choi44 The SiNx/IGZO interface has no hole barrier, whereas a significant hole barrier of ∼2.4 eV exists at the interface for the SiO2/IGZO structure.Reference Chung, Kim, Kim, Cho, Jung, Jeong and Hwang33 Therefore, the photo-created hole carriers can be injected easily into the SiNx gate dielectric due to the absence of a hole energy barrier, suggesting that the trapping and injection of photoinduced hole carriers are responsible for the inferior NBIS stability of the SiNx-gated device compared to the SiO2-gated device.
Evolution of the transfer characteristics of (a) SiNx and (b) SiO2-gated device as a function of the stress time during the application of NBIS. The evaluated device had a bottom gate and top contact configuration with the sputtered IGZO thin film. The IGZO channel layer was passivated with PECVD-derived SiO2 thin film. The IGZO TFTs were irradiated with white light during the application of NBS (V GS_ST = −20 V). A white halogen lamp was used as the light source with a photo-intensity of ∼1 mW/cm2, which consisted of visible light with wave lengths ranging from 400 to 700 nm. Reproduced with permission from Ref. Reference Ji, Kim, Mo, Jeong, Yang, Hwang, Park, Ryu, Lee and Jeong42. The energy band diagram of (c) SiNx/IGZO and (b) SiO2/IGZO structures based on the result of the obtained valence band profile. The data were adapted from Ref. Reference Chung, Kim, Kim, Cho, Jung, Jeong and Hwang33.

D. Oxygen vacancy model
An entirely different model involves oxygen vacancy defects. In the case of moderately n-type doped ZnO, the formation energy of a neutral oxygen vacancy defect (VO) state is lower than those of single [ ${\rm{V}}_{\rm{O}}^{\rm{ + }}$] and double ionized oxygen vacancy defect [
 ${\rm{V}}_{\rm{O}}^{{\rm{2 + }}}$] state according to the results of the first principles calculations, as shown in Fig. 6.Reference Janotti and Van de Walle45–Reference Janotti and Van de Walle47 Therefore, the neutral (VO) state among the various oxygen vacancy states is thermodynamically favorable. On the other hand, the formation energies of oxygen vacancy defects depend on the position of the Fermi energy (E F) level. For example, the transition from VO to
 ${\rm{V}}_{\rm{O}}^{{\rm{2 + }}}$ state, ε(2+/0), is located ∼1 eV below the conduction band minimum (CBM). This means that the neutral oxygen vacancy is a nonconducting deep state when the E F is near the CBM. In contrast, the
 ${\rm{V}}_{\rm{O}}^{{\rm{2 + }}}$ state is preferred to the VO state due to its low formation energy when E F is near the VBM. This corresponds to the application of NBS to TFTs because the quasi-E F level near the channel interface moves downward due to upward band bending. Therefore, the negative V th shift of metal oxide TFTs under dark NBS conditions can be attributed to an E F-driven transition from VO to
 ${\rm{V}}_{\rm{O}}^{{\rm{2 + }}}$. Here, the single ionized state was not considered due to thermodynamic instability, which is known as a negative-U center. Similarly, light excitation can cause a transition of the VO ground state to
 ${\rm{V}}_{\rm{O}}^{{\rm{2 + }}}$ excited states. Spontaneous outward relaxation during this photoionization makes the
 ${\rm{V}}_{\rm{O}}^{{\rm{2 + }}}$ level a shallow state, contributing the delocalized free electrons in the conduction band (Fig. 6). This is the reason for the negative V th shift of the metal oxide TFTs under light illumination. The metastable
 ${\rm{V}}_{\rm{O}}^{{\rm{2 + }}}$ states in ZnO still exist after turning off the light illumination because there is a nonnegligible thermal barrier (0.2–0.3 eV) to escape out of the
 ${\rm{V}}_{\rm{O}}^{{\rm{2 + }}}$ state to the ground VO state. This metastable change in configuration was used to explain the persistent photoconductivity (PPC) observed in ZnO.Reference Janotti and Van de Walle48
Model of the local atomic relaxations around the oxygen vacancy in the (a) neutral state, (b) +1 charge state and (c) +2 charge states. In the neutral state, the four Zn nearest neighbors were displaced inward by 12% of the equilibrium Zn–O bond length. In the +2 charge state, the four Zn nearest neighbors were outward by 23%. (d) Calculated configuration coordinate diagram for  ${\rm{V}}_{\rm{O}}^{\rm{0}}$,
 ${\rm{V}}_{\rm{O}}^{\rm{ + }}$,
 ${\rm{V}}_{\rm{O}}^{{\rm{2 + }}}$ for E F at the CBM. The data and the figure were reproduced from Ref. Reference Janotti and Van de Walle45. Copyright 2005, American Institute of Physics.

Ghaffarzadeh et al. reported that the passivated Hf–In–Zn–O (HIZO) TFTs suffered from a significant negative shift of V th under NBIS conditions. Moreover, slow recovery behavior was observed in terms of the V th value on the time scale of days, which was explained based on the photoionization of VO into the  ${\rm{V}}_{\rm{O}}^{{\rm{2 + }}}$ state (the so-called PPC effect).Reference Ghaffazadeh, Nathan, Roberson, Kim, Jeong, Kim, Chung and Lee30,Reference Ghaffazadeh, Nathan, Roberson, Kim, Jeong, Kim, Chung and Lee49 Similarly, the exposure of the IGZO TFTs to ultraviolet light resulted in an analogous negative V th shift, which was also attributed to the PPC effect.Reference Chowdhury, Migliorato and Jang50 The electron structure calculation indicates that oxygen vacancies (VO) also form a deep level in IGZO, which is similar to ZnO.Reference Kamiya, Nomura and Hosono12,Reference Omura, Kumomi, Nomura, Kamiya, Hirano and Hosono51 Therefore, an electron from a neutral deep [VO] in a multicomponent oxide system, such as IGZO, HIZO, In–Zn–Sn–O (IZTO) etc., absorbs a photon of proper energy and is ejected into the conduction band. This negative-U center behavior was calculated for IGZO system using first principle calculations.Reference Ryu, Noh, Choi and Chang35
Furthermore, the photoionized  ${\rm{V}}_{\rm{O}}^{{\rm{2 + }}}$ defect centers were claimed to act as a sub-gap state below the CBM, which caused the stretching-out of the capacitance–voltage characteristics of a-IGZO TFTs during the NBIS duration. The NBIS-induced negative V th shift can be explained by the
 ${\rm{V}}_{\rm{O}}^{{\rm{2 + }}}$ state created accelerating NBIS degradation by acting as either deep hole trapping centers or n-type dopant centers in the a-IGZO TFTs.Reference Oh, Yoon, Ryu, Hwang, Yang and Park52 Therefore, the proper insertion of an ultrathin barrier layer, such as the Al2O3 into ZnO channel layer, was effective in reducing the resulting NBIS instability, where the barrier layer prevented the photo-created
 ${\rm{V}}_{\rm{O}}^{{\rm{2 + }}}$ or photo-created hole carrier from migrating by the negative gate voltage applied during NBIS duration.Reference Oh, Park, Hwnag, Yang and Ryu53 In addition, the gate field-driven migration of
 ${\rm{V}}_{\rm{O}}^{{\rm{2 + }}}$ through the grain boundary defects in a polycrystalline In–Zn–O (IZO) channel region toward the gate insulator/channel layer further deteriorated the NBIS instability of the resulting IZO TFTs.Reference Oh, Yang, Kim, Oh, Jang, Yang, Jeong, Hwang and Kim54 This suggests that a grain boundary-less structure is favored in terms of NBIS stability, given that the channel composition is identical. Recently, it was suggested that the NBIS instability originates from the creation of a bulk double donor with a shallow singly ionized [
 ${\rm{V}}_{\rm{O}}^{\rm{ + }}$] as well as the formation of deep double ionized [
 ${\rm{V}}_{\rm{O}}^{{\rm{2 + }}}$], which was inferred through rigorous analysis of the current–voltage and capacitance–voltage characteristics of a-IGZO TFTs with different channel thickness.Reference Migliorato, Chowdhury, Um, Seok and Jang55
A different viewpoint was also proposed using hybrid density functional theory.Reference Nahm, Kim and Kim56 The hole carrier-mediated peroxide ( ${\rm{O}}_2^{2 - }$) metastable defect was suggested as the origin for NBIS instability, where a peroxide defect is an analogue to the formation of a VO and O-interstitial (Oi) pair in a ZnO crystal. The energy barrier for the recovery of an NBIS-induced V th shift was calculated to be 0.97 eV, which is consistent with the experimental activation energy of 0.9–1.0 eV.Reference Lee, Kawamura, Nomura, Kamiya and Hosono57,Reference Chowdhury, Migliorato and Jang58
E. Ambient interaction model
The possibility of oxygen photo-desorption on the back channel surface as a plausible origin of NBIS instability was reported. The ZnO-based material is quite sensitive to ambient gases, such as oxygen, moisture, and NO2, so that the ZnO-based thin film, nanowire, and bulk material are good candidate systems for sensing a range of gases.Reference Xu, Pan, Shun and Tian59,Reference Shishiyanu, Shishiyanu and Lupan60 Kang et al.Reference Kang, Lim, Kim, Song, Park, Park and Chung61 studied the dynamic effect of oxygen adsorption/desorption on the IGZO back channel surface. The turn-off voltage (V turn-off) of IGZO TFTs is dependent on the O2 partial pressure of the ambient: the V turn-off was moved negatively with decreasing O2 pressure, which suggests that the adsorbed oxygen molecules deplete the electron carrier of the IGZO channel layer due to the large electron negativity of oxygen molecules. Jeong et al.Reference Jeong, Yang, Jeong, Mo and Kim62 reported the effect of the environmental ambient including oxygen on the gate bias stability of the IGZO TFTs. In addition, the oxygen adsorption was described by the following simple chemical reaction:
 $${\rm{O}}_2 \left( {{\rm{gas}}} \right) + {\rm{e}}^ - = {\rm{O}}_{\rm{2}}^ - \left( {{\rm{solid}}} \right)\quad .$$
Here, the equilibrium constant K is given by the equation, [ ${\rm{O}}_2^ -$]solid/
 ${\rm{P}}_{{\rm{O}}_{\rm{2}} }$[n], where [O−]sol,
 ${\rm{P}}_{{\rm{O}}_{\rm{2}} }$, and [n] are the adsorbed oxygen concentration on the IGZO surface, oxygen partial pressure, and electron density in the channel, respectively. If
 ${\rm{P}}_{{\rm{O}}_{\rm{2}} }$ is increased in a vacuum system, the V th of the resulting oxide TFT will be displaced negatively because the equilibrium constant K should be invariant at a fixed temperature. Therefore, the concentration of
 ${\rm{O}}_{\rm{solid}}^ -$ should decrease. This principle is also valid when PBTS is applied to oxide TFT. As a result of PBTS, the electron density [n] accumulated in the channel region increases and the resultant adsorbate concentration of [
 ${\rm{O}}_{\rm solid}^ -$] also increases, causing an increase in the V th of the transistor. The model of the gate electric field-induced oxygen adsorption as a possible origin for the positive V th shift under PBTS conditions was confirmed by an investigation of the oxygen pressure-dependent bias instabilityReference Chen, Chang, Li, Chen, Lu, Chung, Tai and Tseng63 and the effect of various ambient atmospheres including H2, O2, and air on the positive bias instability.Reference Sung, Choi, Han, Lee, Lee, Kim, Lim, Pearton, Norton and Heo64
According to the result of thermal desorption spectroscopy, there are weakly bound physisorbed oxygen molecules and chemisorbed negatively charged oxygen on crystalline ZnO, where the concentration of chemisorbed oxygen does not change over the temperature range between 40 and 80 °C.Reference Göpel65 The activation energy of  ${\rm{O}}_2^ -$ chemisorbed at the ZnO surface was estimated to be approximately 1.1 eV.Reference Göpel66 Therefore, the irradiation of green light (E = 2.2 eV) is expected to desorb the chemisorbed
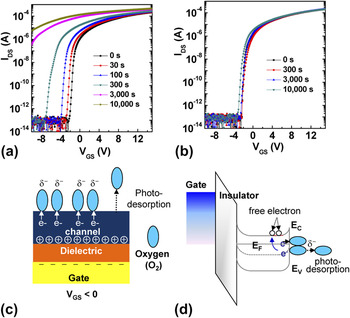
 ${\rm{O}}_2^ -$ as well as the physisorbed oxygen ion/molecules from the metal oxide surface to the ambient environment. Görrn et al.Reference Gorrn, Riedl and Kowalsky67 performed in-depth studies regarding thermo-desorption and photo-desorption on the surface of the zinc thin oxide film. Yang et al.Reference Yang, Cho, Ryu, Park, Hwang, Jang and Jeong36 reported that the negative V th shift under NBIS conditions can be explained by oxygen photo-desorption at the back surface of the channel. Figures 7(a) and 7(b) shows the time evolution of the transfer curves for unpassivated and passivated Zn–Sn–O (ZTO) TFTs under NBIS conditions. The unpassivated ZTO device showed a huge negative V th shift of >11.5 V after applying NBIS for 104 s. In contrast, the passivated device exhibited a much smaller negative V th shift of 0.72 V under identical conditions. This cannot be explained by the trapping or injection of photoinduced holes in the channel layer because photo-generation of the hole carrier and subsequent hole trapping or injection occur between the channel and gate dielectric layer rather than at the channel back-surface. This suggests that the NBIS instability can be related to the interaction of the back channel surface and ambient atmosphere. In the case of the unpassivated device, oxygen molecules are adsorbed on the Zn-based oxide surface. Photon exposure can cause the desorption of oxygen species (O−, O2− etc), which are weakly adsorbed or chemisorbed to the back surface. This is because the binding energy between oxygen species and back channel is less than the photon energy (>2 eV). The photo-desorption of oxygen species will result in the release of free electrons into the metal oxide channel layer. The desorption of oxygen ions would cause an increase in the net free carrier density, enhancing the negative V th shift in metal oxide TFTs.
 $${\rm{O}}_2^ - \left( {{\rm{solid}}} \right) + h{\rm{\nu }} = {\rm{O}}_2 \left( {{\rm{gas}}} \right) + {\rm{e}}^ - \left( {{\rm{solid}}} \right)\quad .$$
Time evolution of the transfer characteristics for (a) unpassivated and (b) passivated Al–Sn–Zn–In–O (AT-ZIO) TFTs under NBIS conditions. The channel AT-ZIO layer was prepared using the co-sputtering method. The evaluated device had a bottom gate and a bottom contact structure. The encapsulated device was covered with a PEALD-derived Al2O3 (40 nm) film. A green light with a wave length of ∼530 nm and a photo-intensity of ∼0.1 mW/cm2 was used as the illumination source. (c) Plausible physical process and (d) corresponding schematic energy band diagram showing the photo-desorption of oxygen molecules into the ambient atmosphere for the unpassivated device under the application of NBIS. The data and the figure were reproduced from Ref. Reference Yang, Cho, Ryu, Park, Hwang, Jang and Jeong36. Copyright 2010, American Institute of Physics.

Figures 7(c) and 7(d) show a schematic model of oxygen desorption by light exposure and the subsequent donation of free electrons in the conduction band. The free electron density of the channel layer due to the photo-desorption of oxygen-related species under light illumination is enhanced compared to that of the dark state, which results in an adverse negative shift of V th. Moisture exposure was found to cause an accelerated deterioration of the V th shift under dark NBS or NBIS conditions.Reference Lee, Jung, Son, Park, Kim, Choi, Jeong, Kwon, Koo and Lee68−Reference Yang, Cho, Ryu, Park, Hwang, Jang and Jeong69 As the humidity of the ambient increased, the V th instability of un-encapsulated HIZO TFTs became worse, which was explained based on the hole-trapping model.Reference Lee, Jung, Son, Park, Kim, Choi, Jeong, Kwon, Koo and Lee68 In addition, these processes will only be possible if there is no passivation layer in the channel layer.
Figure 8 shows the schematic energy band diagram to summarize the three degradation mechanisms under the application of NBIS. It should be noted that the three degradation mechanisms can be highly related. Thus, it is often difficult to distinguish the contribution of each mechanism to the overall instability. For example, some of hole carriers under the application of NBIS can come from VO mediated e–h pair creation rather than the band-to-band transition especially when the incident photon energy is less than the band-gap energy of the semiconducting oxide layer (see Fig. 8). It indicates that the hole carrier trapping process is further accelerated by the photoionization of existing VO, meaning that these two degradation processes are interconnected. Likewise, the oxygen vacancy defects near the back surface can also adversely affect the ambient-related instability because they can provide the active chemisorption sites for the oxygen ion or molecules, which are discussed in Sec. III. Therefore, the accurate interpretation of the photoinduced instability requires a considerable effort.
Schematic energy band diagram to summarize the three degradation mechanisms under the application of NBIS. (i) Trapping or/and injection of a photoinduced hole carriers, (ii) photoionization of neutral oxygen vacancy [VO] to [ ${\rm{V}}_{\rm{O}}^{{\rm{2 + }}}$] charged state, and (iii) the photo-desorption of oxygen molecules into the ambient atmosphere.

III. HOW TO REDUCE THE NBIS INSTABILITY
Several approaches have been examined to suppress the NBIS instability of the metal oxide TFTs. The first approach is based on the mechanism of charge carrier trapping or injection. The use of Al2O3 or SiO2 films with a large energy band-gap as a gate insulator was reported to be effective in minimizing the NBIS instability of the resulting HIZO TFTs.Reference Kwon, Jung, Son, Lee, Park, Kim, Park, Choi, Jeong, Koo and Lee70 The V th shift by the application of NBIS is strongly dependent on the energy barrier for hole carrier between the gate insulator and HIZO channel layer, as mention earlier. In this regard, the SiNx or HfO2-gated device exhibited inferior stability against light and NBS, which were attributed to either their low energy barriers for hole injection or the higher gap-states distribution. Similar superior reliability was observed for atomic layer deposition-derived Al2O3-gated IGZO TFTsReference Kim, Kim, Chung and Hwang71 and thermal-oxidized TiO2-gated ZTO TFTs.Reference Lee, Jung, Park, Son, Lee, Kim, Choi, Kim, Bae, Shin and Jeong72
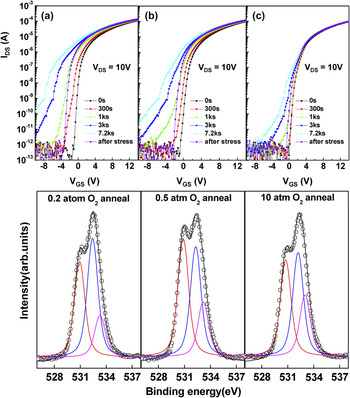
To improve the NBIS stability of metal oxide TFTs, the control of oxygen nonstoichiometry in the metal oxide semiconductor was also attempted based on the mechanism of photoionization of oxygen vacancy defects. Because the photoionization of VO to  ${\rm{V}}_{\rm{O}}^{{\rm{2 + }}}$ responsible for NBIS degradation is proportional to the concentration of preexisting VO defects in the channel layer, the intentional supply of oxygen species, such as high pressure annealing (HPA),Reference Ji, Kim, Jung, Park, Choi, Kim, Hwang, Lee, Hwang and Jeong34,Reference Park, Ji, Kim, Jung, Choi, Son, Ryu, Lee and Jeong73,Reference Son, Park, Kim, Kim, Seo, Kim, Seon, Ji, Jeong, Ryu and Lee74 oxygen-containing plasma treatment,Reference Yang, Ji, Kim, Hwang, Park, Hwang, Jang and Jeong75 and ozone radical treatment,Reference Yang, Park, Oh, Kim, Jeong, Hwang and Kim76 into the oxygen deficient channel region would result in a decrease in [VO], leading to the suppression of NBIS-induced V th instability. This group reported that the removal of the VO defect centers using intentional oxygen diffusion results in the strong suppression of NBIS instability in IGZO TFTs, as shown in Fig. 9.Reference Ji, Kim, Jung, Park, Choi, Kim, Hwang, Lee, Hwang and Jeong34 The device evaluated had a high quality SiO2 gate dielectric and a passivation layer of the SiO2 film, which were deposited by PECVD. Hence, the V th displacement caused by the hole carrier trapping/injection and ambient interaction is relatively small compared to that by the photoionization of VO defects. Therefore, the substantial improvement in NBIS instability for the O2 HPA-treated device would come mainly from the reduction of the VO defect density, which was confirmed by the result of the O1s XP spectra. The oxygen plasma treatment in terms of supplying oxygen species was also investigated for ZTO TFTs.Reference Yang, Ji, Kim, Hwang, Park, Hwang, Jang and Jeong75 The shift in V th of the oxygen plasma-treated device according to the NBIS duration was reduced by ∼50% compared to the pristine device. Moreover, the NBIS-induced V th shift decreased with decreasing channel thickness for the oxygen plasma-treated devices. This supports the photoionization model of VO because the number of preexisting [VO] defects is proportional to the light-illuminated channel volume. As a similar approach, the ozone treatment was also shown to reduce the oxygen deficiency concentration in the ZTO film.Reference Yang, Park, Oh, Kim, Jeong, Hwang and Kim76 Similar to oxygen HPA and the oxygen plasma treatment, an ozone treatment can annihilate the oxygen deficiencies of the ZTO film and prevent the NBIS-induced instability of the resulting ZTO TFTs. On the other hand, the surface of the evaluated ZTO film were not encapsulated, the retarded desorption of adsorbed oxygen species was partially responsible for the improvement in NBIS stability. The ozone treatment was suggested to convert the surface adsorption species from weakly bound
 ${\rm{O}}_2^ -$ species to highly chemisorbed OH− at the surface VO site, which in turn suppresses the photo-desorption process because the chemisorbed OH− species have a higher binding energy than
 ${\rm{O}}_2^ -$ species.Reference Seiyama77 The relative contribution of the two degradation mechanisms to the overall V th instability by the application of NBIS instability was estimated, which was accomplished by passivating the ZTO surface and excluding the ambient interaction. The contributions of the oxygen-related photo-desorption and oxygen vacancy model to the overall V th displacement can be approximated to be 10 ± 1% and 90 ± 1%, respectively.
Evolution of the transfer characteristics of the IGZO TFTs annealed under an O2 atmosphere of (a) 0.2 atm, (b) 0.5 atm, and (c) 10 atm as a function of the applied NBIS time. The IGZO TFTs evaluated had a bottom gate and top contact configurations, where the IGZO channel was encapsulated with a PECVD-derived SiO2 film. Each heat treatment was performed at 250 °C for 1 h. The surface of the IGZO TFTs was irradiated with light with a wave length of ∼460 nm from blue light-emitting diodes with a full width at half maximum of approximately ± 10 nm. The photon intensity and flux density were 0.075 mW/cm2 and 1.7 × 10¹⁴/cm2s, respectively. The figure below shows the XP O1s spectra for the corresponding IGZO thin films. The oxygen lattice peak at 530.8 eV increased and the oxygen vacancy-related peak at 533.2 eV decreased with increasing O2 pressure during thermal annealing. The data were reproduced from Ref. Reference Ji, Kim, Jung, Park, Choi, Kim, Hwang, Lee, Hwang and Jeong34. Copyright 2011, American Institute of Physics.

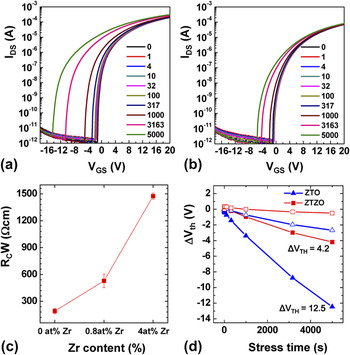
Instead of directly supplying oxygen species, cation doping into the ZTO system was attempted as an oxygen binder.Reference Yang, Huh, Oh, Lee, Kim, Oh, Jeong, Hwang and Kim78 The oxygen deficiency of the resulting oxide semiconductor decreased with increasing ZrO2 incorporated into the ZTO material, leading to the suppression of NBIS instability of the resulting TFTs, as shown in Fig. 10. This was attributed to the Gibbs free energies of formation (ΔGf) for ZnO, SnO, SnO2, and ZrO2 of −320.4, −256.7, −520.0, and −1039.7 KJ/mole, respectively, in their standard state.Reference Barin79 The most negative ΔGf value of ZrO2 suggests that chemical binding with respect to oxygen atoms is the strongest among Zn, Sn, and Zr cation atoms. Therefore, the introduced Zr cation would increase the formation energy of the oxygen vacancy defects during the deposition of ZTO films or postdeposition annealing, which is responsible for the lower oxygen deficiency of the ZTO film and improved NBIS stability. On the other hand, Zr doping is performed to reduce the field effect mobility of ZTO TFTs and increase the contact resistance between the channel layer and source/drain electrode [Fig. 9(c)]. In multicomponent oxide semiconductors, the electron mobility decreases with decreasing carrier concentration, where the percolation model has been postulated as a plausible mechanism for such abnormal mobility behavior. In the percolation model, as E F increases due to electrical or/and chemical electron doping, the conduction process due to the delocalized band transport will be dominant because most of the gap states below E F are filled with electrons.Reference Powell3,Reference Kamiya, Nomura and Hosono80,Reference Nomura, Kamiya, Ohta, Ueda, Hirano and Hosono81 The net carrier density of the ZTZO film decreased with increasing ZrO2 content, suggesting that the incorporation of ZrO2 also suppresses the formation of shallow oxygen vacancy defects as well as deep oxygen vacancy defects in the ZTZO film. Therefore, the addition of oxygen binders, such as ZrO2, into the metal oxide channel layer should be chosen carefully to secure reasonable transport properties, as well as the good photostability under NBIS conditions.
Evolution of the transfer characteristics for (a) ZTO and (b) Zn0.54Sn0.42Zr0.04O TFTs as a function of the NBIS time. (c) The width-normalized contact resistance variation in the fabricated TFTs as a function of the ZrO2 target power. (d) Variation in the V th value as a function of the applied NBIS time for the ZTO and Zn0.54Sn0.42Zr0.04O TFTs. The empty and filled symbols denote the dark NBS and NBIS-induced V th variations, respectively. The evaluated ZTO-based TFTs had a bottom gate and top contact configurations. The channel layer was not passivated. The surface of the ZTO-based TFTs was irradiated with light with a wave length of ∼650 nm from a halogen lamp through band-pass filters. The photon intensity was 0.1 mW/cm2. The data were reproduced from Ref. Reference Yang, Huh, Oh, Lee, Kim, Oh, Jeong, Hwang and Kim78. Copyright 2011, American Institute of Physics.

Finally, the passivation layer plays an important role in determining the NBIS instability of metal oxide TFTs, as mentioned earlier. Therefore, the effect of a passivation material on photo-bias stability of metal oxide TFTs has attracted considerable attention. Nomura et al.Reference Nomura, Kamiya and Hosono82 reported that the photostability of IGZO TFTs under NBTS conditions could be improved by passivating with Y2O3. Although the unpassivated device suffered from a negative V th shift of 24.8 V, the Y2O3 passivated device exhibited stable behavior (ΔV th = −4.4 V) after an identical NBIS duration. The deep defects at a depth of ∼2 nm from the IGZO back surface responsible for NBIS instability were eliminated by passivation with a Y2O3 film. Park et al. compared the effects of SiOx and SiNx passivation on the stability of HIZO TFTs under NBIS conditions.Reference Park, Kim, Son, Lee, Maeng, Kim, Kim, Park, Seon, Choi, Ryu and Lee83 In terms of the diffusion barrier property, it was expected that the SiNx layer would be better than the SiO2 film. On the other hand, the unintentional in-diffusion huge hydrogen species existing in SiNx toward the IGZO channel layer causes severe deterioration under NBIS conditions. The incorporation of hydrogen into the channel layer creates hole trap centers, which accelerates the negative V th shift under NBIS conditions. This can be attributed to the photo-desorption of incorporated hydrogen into the oxide channel layer and the subsequent migration of protons toward the gate insulator/channel interface.Reference Kim, Park, Jung, Son, Lee, Lee, Jeong, Mo, Son, Ryu, Lee and Jeong84 Therefore, hydrogen-free or less hydrogen containing SiOx films as a passivation layer are preferred in SiNx films.Reference Gosain and Tanaka85,Reference Ohara, Sasaki, Noda, Ito, Sasaki, Endo, Yoshitomi, Sakata, Serikawa and Yamazaki86
IV. CONCLUSIONS
Despite the rapid progress and many accomplishments in metal oxide TFTs, important challenges remain for their successful implementation into the next generation AMLCDs, AMOLEDs, and transparent displays. One critical issue is a precise understanding of NBIS-induced instability. This article reviewed the rationale of V th instability for metal oxide TFTs under NBIS conditions. The charge trapping/injection model, oxygen vacancy photoionization model, and ambient interaction model were described as a plausible degradation mechanism. The degradation of V th by the trapping (or injection) of photoinduced hole carriers at the interface (or into gate insulator bulk region) can be prevented using the high quality gate insulator, such as SiO2 film with a high hole energy barrier and low gap-state bulk defect. In addition, the ambient originated instability can be suppressed by an appropriate passivation layer, which should have a low hydrogen content and good diffusion barrier properties against moisture and oxygen. On the other hand, the oxygen vacancy-related V th instability is difficult to eliminate because it involves the intrinsic material property of the amorphous metal oxide semiconductor. If the NBIS instability is indeed inherent in amorphous transparent oxide semiconductor materials, an effective light shielding structure needs to be developed. The absorption layer for blue and ultraviolet photons should cover the metal oxide semiconductor layer because these photons adversely affect the transfer characteristics under NBS conditions. Similarly, a compensation circuit to adjust the NBIS-induced V th instability is needed, which is essential for the realization of metal oxide transistor-driven transparent displays.
ACKNOWLEDGMENTS
This study was supported by a Korea Science and Engineering Foundation (KOSEF) grant funded by the Korean government (MEST) (Grant No. 2012R1A2A2A02005854), the industrial strategic technology development program (Grant Nos. 10041808, 10041041, and 10035225) funded by MKE/KEIT and Inha University Research Grant.