



1. Introduction
The phenomenon of supercavitation, which envelops an underwater object in a large gas cavity to minimise skin friction, is a critical drag reduction technology for high-speed underwater vehicles. It is well established that the cavitation state is governed by the cavitation number, determined by both ambient pressure and flow velocity. Natural cavitation occurs spontaneously when the local fluid pressure drops below the saturation vapour pressure. Practical engineering applications typically employ ventilated supercavitation, achieved by artificially injecting gas into the low-pressure wake. For the same object, natural and ventilated supercavities exhibit similar morphologies when the cavitation numbers are sufficiently low and equal (Zhang et al. Reference Zhang, Wei, Zhang, Wang and Yu2007). However, the properties of the gas source, injection location and ventilation flow rate play a decisive role in the development and hydrodynamic stability of the cavity.
Extensive research has characterised ventilated supercavitation based on several key physical parameters, including ambient pressure (
 $P_\infty$
), freestream velocity (
 $U$
), liquid saturation vapour pressure (
 $P_v$
), liquid density (
 $\rho$
), gravitational acceleration (
 $g$
), ventilation flow rate (
 $Q_{\textit{in}}$
), and cavitator diameter (
 $d_c$
). These parameters collectively define three governing dimensionless numbers: the natural cavitation number
 $\sigma _c = (P_\infty -P_v)/ (0.5\rho U^2)$
, the Froude number
 $\textit{Fr} = U/\sqrt {g d_c}$
, and the gas entrainment coefficient
 $C_Q = Q_{\textit{in}}/(U d_c^2)$
. Furthermore, in confined experimental environments such as water tunnels, the blockage ratio (
 $B = S_{\textit{model}}/S_{\textit{tunnel}}$
, where
 $S_{\textit{model}}$
is the area of the disk cavitator, and
 $S_{\textit{tunnel}}$
is the cross-sectional area of the water tunnel test section) significantly influences the pressure distribution and flow structure. A high blockage ratio increases the flow velocity within the channel, thereby altering the pressure distribution and flow structure (Wu et al. Reference Wu, Liu, Shao and Hong1971). The dependency of hydrodynamic behaviour on these parameters has been extensively characterised in the literature (Silberman & Song Reference Silberman and Song1961; Epshtein Reference Epshtein1973; Logvinovich Reference Logvinovich1973; Savchenko Reference Savchenko2001; Spurk Reference Spurk2002; Karn et al. Reference Karn, Arndt and Hong2016). Under these classical frameworks, the internal flow structure is typically delineated into the ventilation influence region, internal boundary layer and reverse flow region (Wu et al. Reference Wu, Whitney and Brennen2019), with closure mechanisms categorised into re-entrant jet or twin-vortex modes (Karn et al. Reference Karn, Arndt and Hong2016). These models usually treat the injected gas as non-condensable (e.g. air), assuming that cavity dynamics is dominated by inertial forces with a simple mass balance between injection and leakage.
In recent years, the thermal effects on supercavitation have garnered increasing attention, driven by the practical need to utilise high-temperature engine exhaust gases for ventilation. Numerical studies have investigated the influence of gas temperature on cavity shape and drag, generally suggesting that high-temperature gas reduces the cavity gas density, and slightly alters the internal pressure distribution (Zhao et al. Reference Zhao, Wang, Zhao and Liu2012; Duy et al. Reference Duy, Nguyen, Phan, Hwang and Park2022; Pham et al. Reference Pham, Hong, Hilo and Ahn2022b ). Experimentally, Spurk (Reference Spurk2004) and Pham et al. (Reference Pham, Hong and Ahn2022a ) injected combustion gas and heated air into supercavities, observing that higher temperatures could stabilise cavity length to some extent. Similarly, Jiang et al. (Reference Jiang, Hong, Pham and Ahn2023) conducted experiments with non-condensable gas heated up to 773 K, concluding that the cavity diameter remains largely insensitive to temperature variations. However, a common limitation in these studies is that the working fluid was either non-condensable or treated as an ideal gas where phase change was negligible. Consequently, the observed thermal effects were primarily aerodynamic (density variations) rather than thermodynamic (phase transition).
The physics changes substantially when the ventilation medium is a condensable vapour, such as high-temperature water vapour. Water vapour introduces strong inter-phase mass transfer via condensation and evaporation at the gas–liquid interface. This coupling makes the flow a thermo-hydrodynamic system in which phase change can alter the cavity mass balance and interfacial stability. Recently, Yang et al. (Reference Yang, Wang, Chang, Liu and Wang2024) demonstrated the feasibility of generating supercavities using high-temperature water vapour, and examined the critical cavitation number. However, their work focused primarily on macroscopic feasibility. The detailed interfacial dynamics – specifically, the spatiotemporal evolution of instabilities driven by rapid phase change, and the nonlinear response of cavity morphology to thermodynamic parameters – remain unexplored. The interaction between the high-enthalpy vapour jet and the subcooled liquid boundary involves condensation shocks and heat-flux exchange, which may induce flow regimes and instabilities distinct from classical air-ventilated cavities.
Understanding interfacial instability is important for the control of supercavitating vehicles. The pulsating modes and re-entrant jet instabilities of air-ventilated cavities have been extensively studied (Silberman & Song Reference Silberman and Song1961; Woods Reference Woods1966; Liu et al. Reference Liu, Xiao and Shen2023b ), whereas vapour-filled cavities may differ substantially because the gas volume is no longer conserved. Does the rapid condensation of injected vapour suppress or amplify interfacial waves? How do the thermodynamic parameters (temperature, enthalpy) modulate the classical Kelvin–Helmholtz (K–H) and Rayleigh–Taylor (R–T) instabilities? Addressing these questions requires treating ventilation as both a pressure source and a source of thermodynamic energy and mass transfer.
This study aims to experimentally investigate the flow characteristics and interfacial instability mechanisms of vapour-ventilated supercavitation in a water tunnel. By utilising high-speed imaging coupled with an AI-based segment anything model (SAM) for precise interface quantification, we systematically analyse the cavity evolution under varying ventilation flow rates and temperatures. The specific objectives are: (i) to establish a thermo-hydrodynamic flow regime map and delineate the operational envelope; (ii) to reveal the non-monotonic suppression effects and the regime regression mechanism; and (iii) to elucidate the spatiotemporal characteristics of interfacial instabilities using dispersion relation analysis. These findings provide quantitative insights into the coupling of phase change and turbulence in multiphase flows.
The paper is structured as follows. Section 2 presents the full experimental methodology, covering the physical set-up, test conditions and the methods adopted for cavity interface data acquisition. Section 3 presents the results of the high-temperature water vapour ventilation experiments, analysing the flow characteristics of the ventilated supercavity in § 3.1, the influence of different ventilation flow rates and temperatures on supercavity size and shape evolution in § 3.2, and the cavity instability in § 3.3. Finally, § 4 provides the conclusions of the study.
2. Experimental methodology
2.1. Physical set-up and test conditions
High-temperature water vapour ventilation experimental system: (a) cavitation water tunnel; (b) high-temperature steam generator; (c) disk cavitator and the structure near the ventilation holes.

Schematic diagram of the experimental set-ups.

The experiments were conducted in a closed-loop cavitation water tunnel at Harbin Engineering University, as shown in figure 1(
 $a$
). The tunnel is equipped with a comprehensive regulation system, including a pressure control unit, a degassing section, and a honeycomb flow straightener, ensuring high flow quality with background turbulence intensity less than 0.5 %. The test section, made of transparent acrylic to facilitate optical access, has square cross-section
 $100 \times 100$
mm
 $^2$
, and length 600 mm. The flow is driven by a main pump located in the bottom loop, which is capable of generating freestream velocities up to 12 m s−1.
To investigate the thermo-hydrodynamic effects of vapour-ventilated supercavitation, a custom-designed high-temperature steam injection system was integrated, consisting of a steam generator, a high-temperature flowmeter, and a mass flow controller (figure 1
 $b$
). This system generates superheated water vapour with peak parameters 1 MPa and 823 K. The vapour is transported through thermally insulated pipelines to minimise enthalpy loss. The volume flow rate (
 $Q_{\textit{in}}$
) is precisely regulated within the range 0–600 standard litres per minute (SLPM) with accuracy
 $\pm 0.5\,\%$
of the full scale.
The experimental model is supported by a streamlined NACA0012 rear support strut, as illustrated in figure 2. A particle image velocimetry (PIV) system was used to calibrate the freestream velocity
 $U$
in the test section. The headform consists of a circular disk cavitator with diameter
 $d_c = 24$
mm and a conical deflector positioned at a stand-off distance of one cavitator diameter (
 $1d_c$
) from the disk cavitator. The resulting blockage ratio is
 $B \approx 4.5\,\%$
, which is sufficiently low to minimise wall interference effects (Wu et al. Reference Wu, Liu, Shao and Hong1971). Four ventilation holes, each with diameter 1 mm, are uniformly distributed on the inner face of the deflector to discharge superheated vapour. The conical deflector has inner camber angle
 $30^\circ$
, and outer inclination angle
 $15^\circ$
, relative to the body axis (figure 1
 $c$
). This deflector geometry provides a confined buffer zone for the superheated vapour discharged from the ventilation holes, converting discrete point-source injection into a nearly uniform annular flow, and reducing direct localised jet impingement on the cavity interface. Because the rear support strut is located downstream of the cavitator and ventilation region, its possible influence is interpreted mainly through the tail-closure and re-entrant-flow region.
Cavity dynamics was captured using a high-speed camera positioned perpendicular to the flow, operating at 9000 fps with resolution
 $1024 \times 512$
pixels. To ensure optimal contrast for the multiphase interface, a specialised lighting set-up comprising three LED sources – two on the camera side, and one backlight – was employed. During the experiments, the ambient pressure in the test section was maintained at
 $12.25 \pm 0.05$
kPa, and the water temperature was controlled at
 $298.15 \pm 2$
K. The thermophysical properties of water and vapour were determined according to the IAPWS-95 formulation (Wagner & Pruß Reference Wagner and Pruß2002). All environmental parameters were precisely controlled to eliminate extraneous factors and guarantee experimental reproducibility.
To minimise the influence of different parameter regulation paths and ensure the repeatability of the flow regimes, a strict experimental procedure was followed. The freestream velocity (
 $U$
) was first stabilised to achieve the target Froude number (
 $\textit{Fr}$
) and natural cavitation number (
 $\sigma _c$
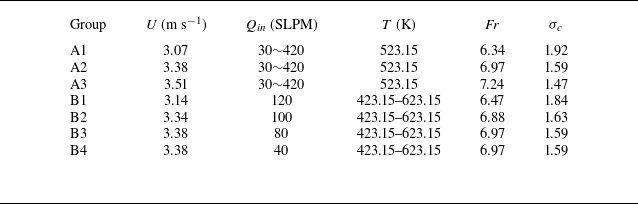
) before initiating ventilation. Data collection commenced only after the ventilation flow stabilised and the cavity reached a quasi-steady state. The specific experimental operating conditions are summarised in table 1. The experiments are categorised into two groups: group A (A1–A3) investigates the hydrodynamic response to ventilation flow rate (
 $Q_{\textit{in}}$
), while group B (B1–B4) isolates the thermodynamic effects of ventilation temperature (
 $T$
).
Summary of experimental conditions. All experiments were conducted at a controlled ambient water temperature
 $T_{\infty } \approx 298.15$
K.

Table 1. Long description
A table summarizing experimental conditions for two groups of experiments. The table has six columns and eight rows. The columns are labeled Group, U (m s-1), Qin (SLPM), T (K), Fr, and σc. The rows are labeled A1, A2, A3, B1, B2, B3, and B4. Each row provides specific values for the experimental conditions. Row 1: A1, 3.07, 30-420, 523.15, 6.34, 1.92. Row 2: A2, 3.38, 30-420, 523.15, 6.97, 1.59. Row 3: A3, 3.51, 30-420, 523.15, 7.24, 1.47. Row 4: B1, 3.14, 120, 423.15-623.15, 6.47, 1.84. Row 5: B2, 3.34, 100, 423.15-623.15, 6.88, 1.63. Row 6: B3, 3.38, 80, 423.15-623.15, 6.97, 1.59. Row 7: B4, 3.38, 40, 423.15-623.15, 6.97, 1.59.
2.2. Cavity interface data acquisition
Accurate quantification of the cavity morphology and interfacial waves is critical for analysing the instability mechanisms. Traditional threshold-based segmentation methods often struggle with complex gas–liquid boundaries in multiphase flows, particularly where mist, condensation and turbulent mixing occur. To address this, we employed an automated segmentation framework based on the SAM (Khojasteh et al. Reference Khojasteh, van de Water and Westerweel2024), a foundational vision model with a transformer architecture.
To ensure reproducibility and improve segmentation accuracy for high-speed cavitation footage, we implemented a specific pre-processing and prompting workflow. First, raw experimental images typically exhibit a ‘dark background (water) + bright contour (cavity)’ profile, where subtle interfacial details can be obscured by background noise or lighting reflections. We applied a pixel value inversion step, converting the images to a ‘bright background + dark contour’ format. This operation enhances the contrast gradients at the phase boundary, facilitating feature extraction by the image encoder.
The prompt ‘Ventilated cavity’ was then used to direct the SAM to the main supercavity contour in the central part of each frame. This helped to distinguish the cavity boundary from isolated mist patches, reflections and turbulent-mixing structures. In regions with mist, droplets or turbulent mixing, the segmentation was guided by the outer macroscopic cavity contour rather than by isolated greyscale patches inside the cavity. Small disconnected masks and internal mist structures were excluded from the cavity boundary before extracting
 $L_s$
,
 $L_d$
, and the interfacial wave envelope. As demonstrated in figure 3, this workflow yields precise segmentation masks.
For validation, the segmentation accuracy was evaluated against a manually annotated dataset of 270 independent frames. This dataset encompasses all observed flow regimes, the detailed definitions of which are provided in § 3.1. The validation set includes 30 frames each for the foamy cavity (FC), local supercavity (LS) and smooth supercavity (SS) regimes, as well as for their respective transition states. Furthermore, to account for the intense interfacial instabilities induced by varying ventilation flow rates, a higher proportion of the dataset (120 frames in total) was allocated equally to the rough supercavity (RS) and SS-RS regimes to ensure validation under these challenging conditions. The validation yielded an overall intersection over union (IoU) score exceeding 0.98, confirming the high fidelity of the extracted interface data. Based on this, the time-resolved cavity length (
 $L_s$
), maximum diameter (
 $L_d$
) and interfacial wave characteristics were quantified. The statistical convergence of these quantities was ensured by averaging over 900 consecutive frames (approximately 0.1 s) for each operating condition.
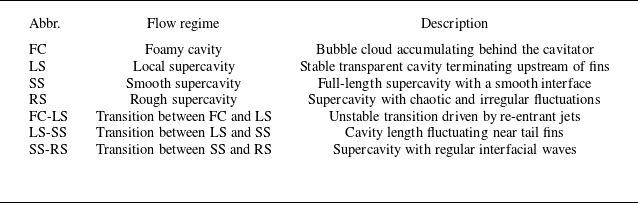
Nomenclature and descriptions of the distinct flow regimes and transitional states.

Table 2. Long description
A table with three columns and seven rows, detailing flow regimes and their descriptions. The columns are labeled Abbr., Flow regime, and Description. The rows are as follows: Row 1: Abbr., FC; Flow regime, Foamy cavity; Description, Bubble cloud accumulating behind the cavitator. Row 2: Abbr., LS; Flow regime, Local supercavity; Description, Stable transparent cavity terminating upstream of fins. Row 3: Abbr., SS; Flow regime, Smooth supercavity; Description, Full-length supercavity with a smooth interface. Row 4: Abbr., RS; Flow regime, Rough supercavity; Description, Supercavity with chaotic and irregular fluctuations. Row 5: Abbr., FC-LS; Flow regime, Transition between FC and LS; Description, Unstable transition driven by re-entrant jets. Row 6: Abbr., LS-SS; Flow regime, Transition between LS and SS; Description, Cavity length fluctuating near tail fins. Row 7: Abbr., SS-RS; Flow regime, Transition between SS and RS; Description, Supercavity with regular interfacial waves.
Quantification of the interfacial waves of ventilated supercavitation based on the AI model: (
 $a$
) original experimental image; (
 $b$
) segmentation mask overlay result; (
 $c$
) supercavitation edge segmentation and information acquisition.

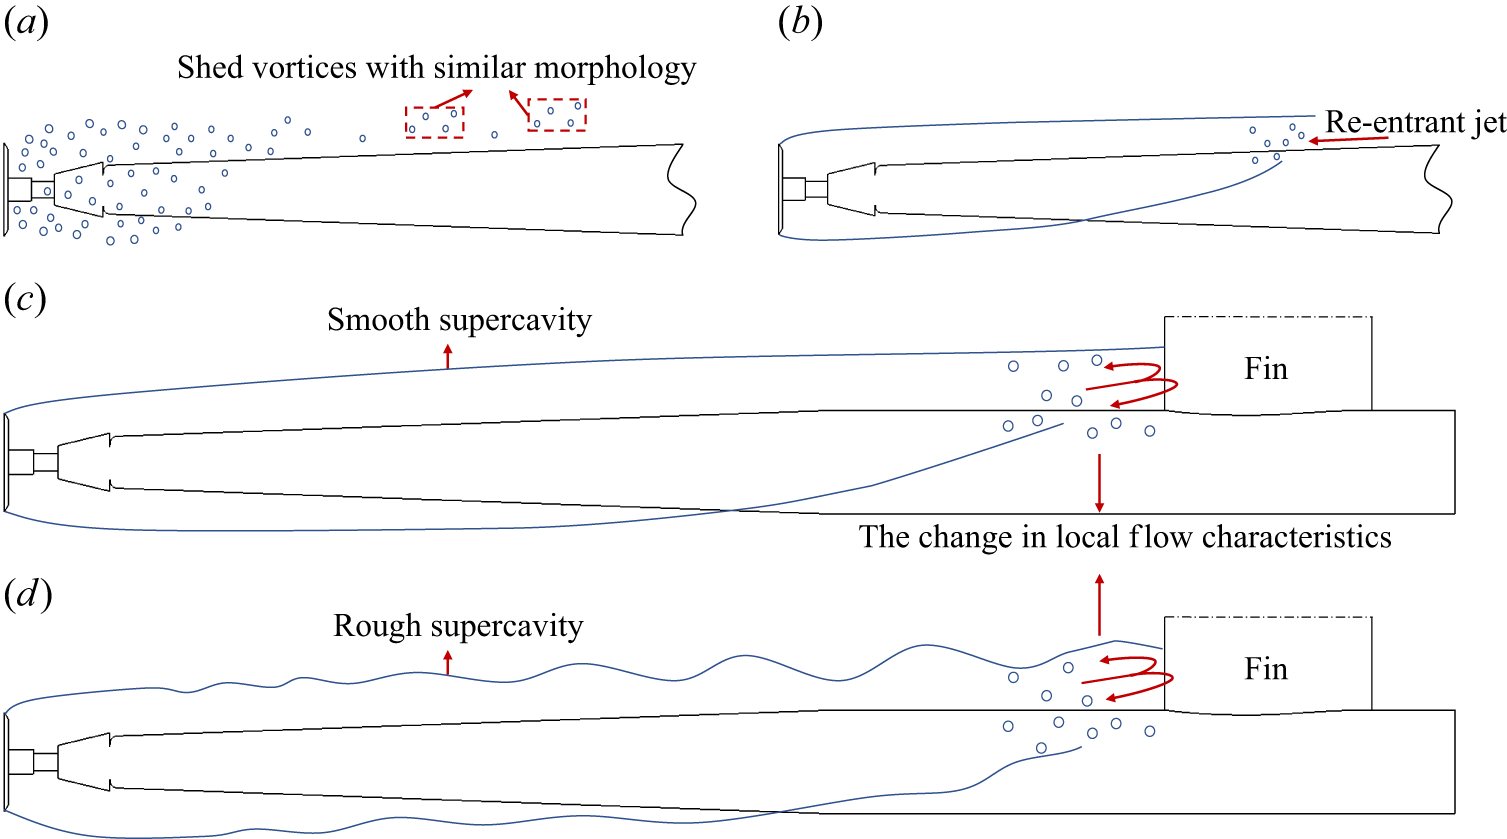
Topological classifications of the four primary flow regimes: (
 $a$
) foamy cavity, (
 $b$
) local supercavity, (
 $c$
) smooth supercavity, (
 $d$
) rough supercavity.

Figure 4. Long description
A diagram illustrating four primary flow regimes: foamy cavity, local supercavity, smooth supercavity, and rough supercavity. Panel A: A diagram showing shed vortices with similar morphology. The diagram depicts a series of vortices shed from an object, with some vortices highlighted in a dashed red box. Panel B: A diagram showing a local supercavity with a re-entrant jet. The diagram depicts a cavity formed behind an object, with a re-entrant jet indicated by an arrow. Panel C: A diagram showing a smooth supercavity. The diagram depicts a smooth cavity formed behind an object, with a fin causing a change in local flow characteristics. Panel D: A diagram showing a rough supercavity. The diagram depicts a rough cavity formed behind an object, with a fin causing a change in local flow characteristics.
3. Results and discussion
3.1. The flow regimes and topological characteristics
In the present study, we identified four distinct stable flow regimes: FC, LS, SS and RS, as illustrated in table 2 and figure 4. The RS regime represents a distinct topological state observed in condensable vapour ventilation, characterised by intense interfacial fluctuations. Intermediate transitional states (FC-LS, LS-SS and SS-RS) were also observed, which are morphologically characterised by unstable re-entrant jets, cavity-length fluctuations near the tail fins, and regular interfacial waves, respectively.
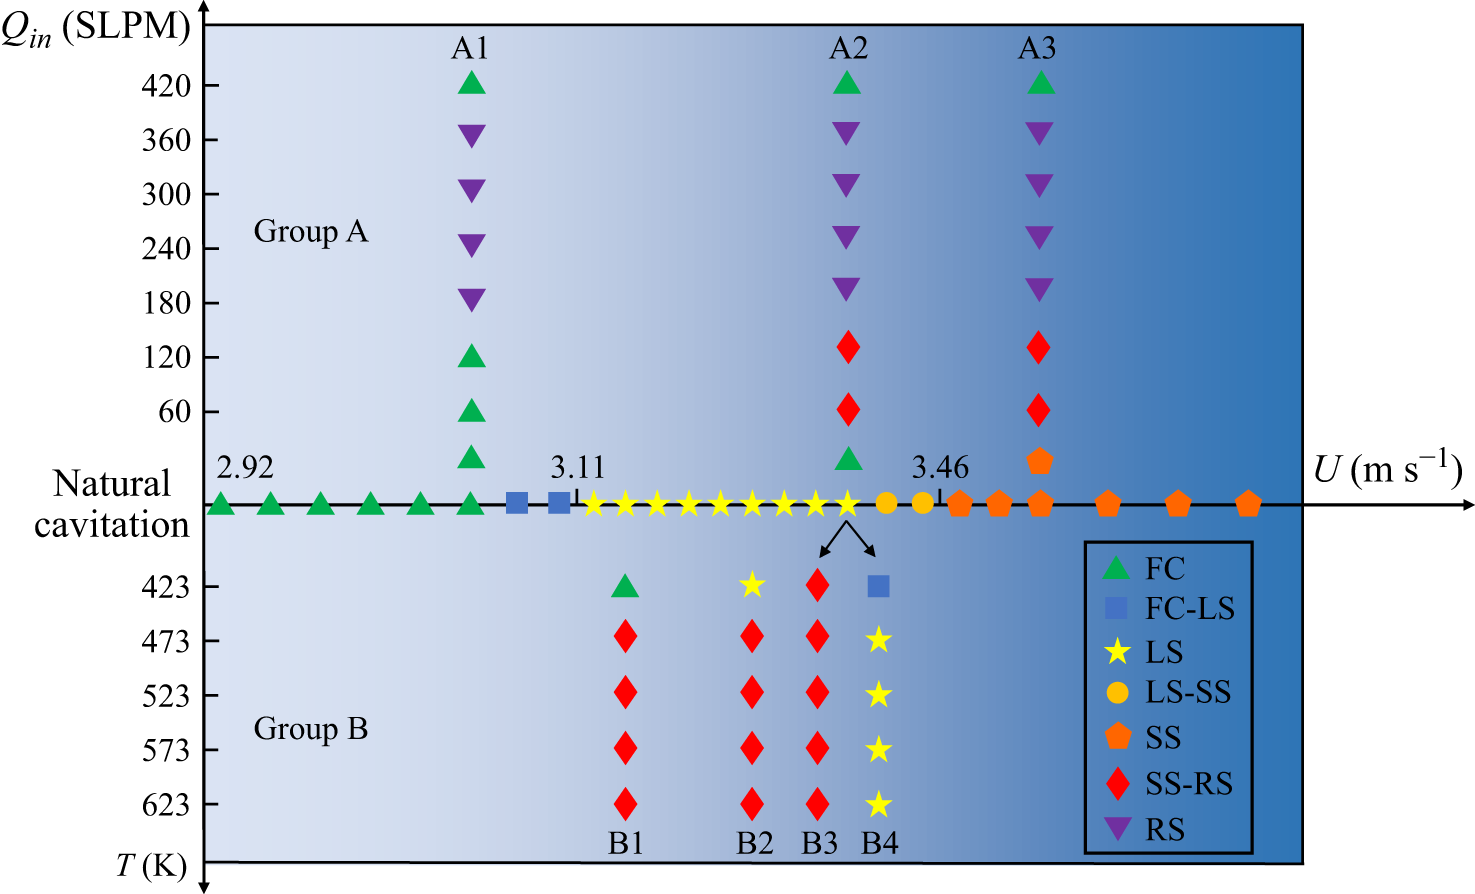
Flow regime map. The central axis defines the natural cavitation baseline (increasing
 $U$
). The upper and lower panels map the regime transitions driven by ventilation flow rate (
 $Q_{\textit{in}}$
, group A) and temperature (
 $T$
, group B), respectively.

To delineate the operational envelope, figure 5 maps these regimes against the control parameters: freestream velocity (
 $U$
), ventilation flow rate (
 $Q_{\textit{in}}$
) and ventilation temperature (
 $T$
). Along the natural cavitation baseline (
 $U$
-axis), the flow evolves sequentially from FC to LS and finally to SS. Consistent with classical cavitation theory (Franc & Michel Reference Franc and Michel2004), the interface of these natural supercavities remains stable and glassy once fully formed. In contrast, active vapour ventilation generally promotes cavity formation but at the cost of enhanced interfacial instability; consequently, the stable range of the quiescent SS regime is significantly contracted. To facilitate an intuitive understanding of the three full-length supercavity regimes, a systematic qualitative comparison of high-speed images is provided in Appendix A (figure 18), corresponding to group A3. This morphological evidence reveals the interfacial evolution from a smooth state (SS) to regular waves (SS-RS) and finally to chaotic fluctuations (RS).
The regime transition is non-monotonic, with cavitation suppression at both excessively low and high ventilation flow rates. At minimal ventilation flow rates, the injection increases the local pressure, thereby suppressing natural cavitation; however, since the vapour supply remains below the effective threshold required for sustained vapour-ventilated supercavitation, the overall effect is an inhibition of cavity growth. In a distinct mechanism, the suppression observed at excessively high ventilation flow rates stems from intense interfacial instabilities. In this regime, the ventilation significantly enhances interfacial heat and mass transfer, which accelerates the condensation rate. This leads to a ‘regime regression’ where the supercavity collapses back into the FC regime. For non-condensable gas ventilation, even minimal injection rates promote cavity formation. Furthermore, excessive gas injection typically induces over-expansion and pulsation, characterised by the shedding of large-scale gas pockets driven by buoyancy and large-amplitude oscillations of the cavity geometry, without the same regime regression. These comparative phenomena are further illustrated in Appendix B (figure 19), which also indicates that the ventilation threshold for suppression in steam ventilation is significantly higher than that for non-condensable gas.
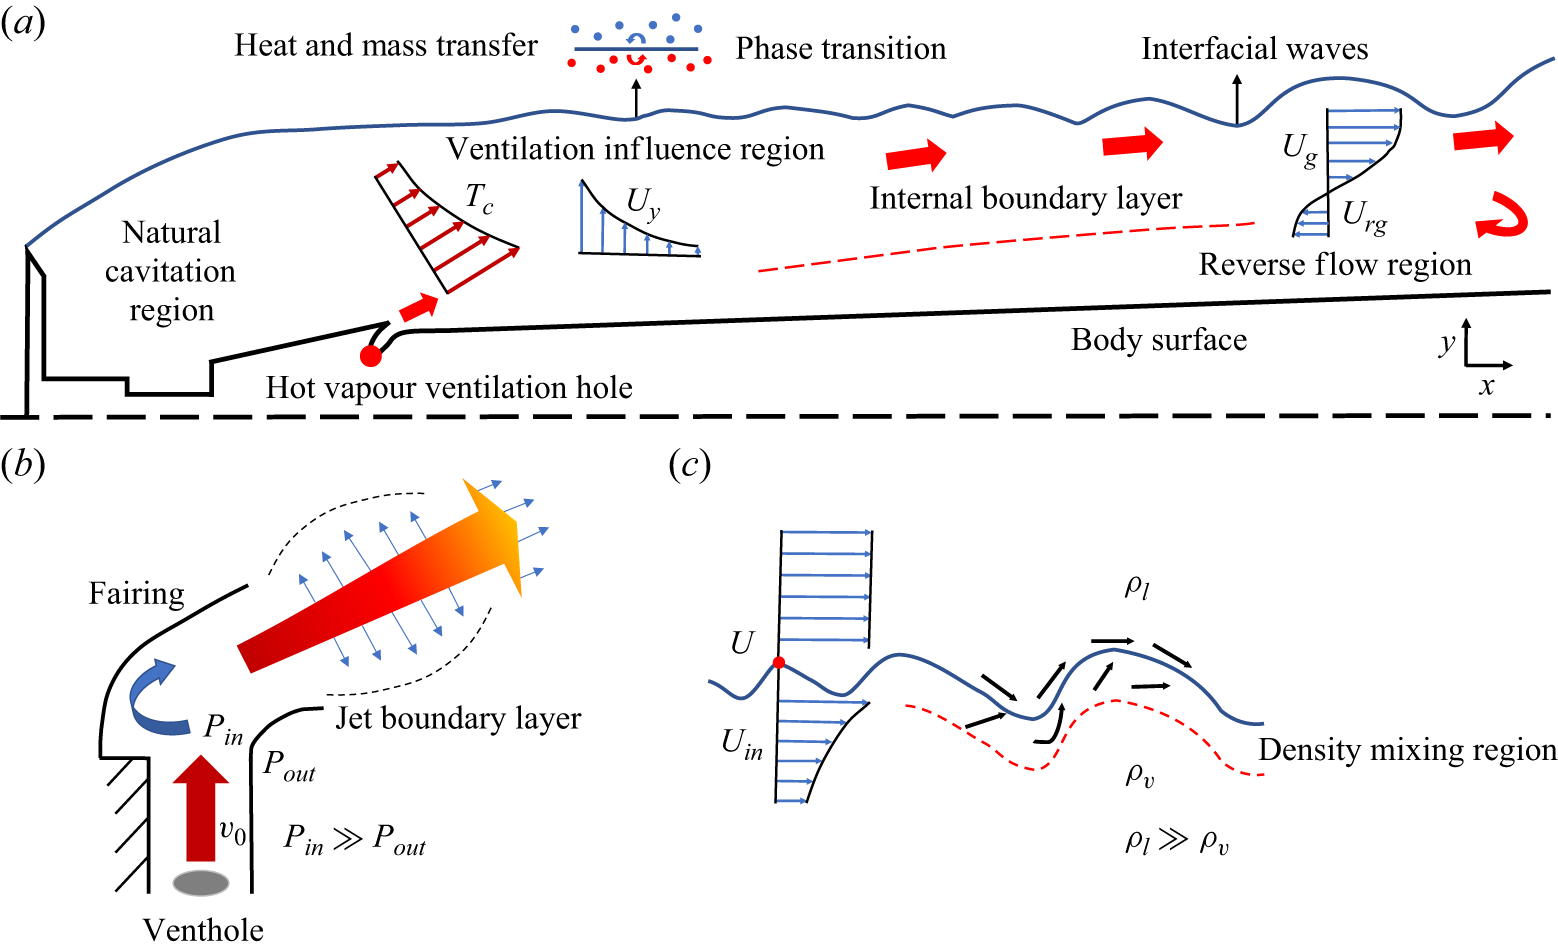
To elucidate the internal flow structure, we adopt a four-region conceptual framework (figure 6
 $a$
): the natural cavitation region, the ventilation influence region, the internal boundary layer, and the reverse flow region. The natural cavitation region (between the cavitator and the orifice) remains largely independent of ventilation, maintaining a smooth interface. Upon injection, the vapour forms the ventilation influence region. In the internal boundary layer, the hot vapour engages in heat/momentum transfer with the cavity fluid, while adverse pressure gradients at the tail drive the reverse flow region.
Schematic diagrams of flow structure and instability mechanisms: (
 $a$
) four-region internal flow model; (
 $b$
) evolution of the vapour jet near the orifice; (
 $c$
) amplification of interfacial disturbances via K–H and R–T instabilities.

High-speed visualisation of flow characteristics near the ventilation orifice and the ventilation influence region. (
 $a$
) Evolution of the cavity driven by increasing freestream velocity (
 $U$
) from 2.54 to 3.07 m s−1, under constant ventilation parameters
 $Q_{\textit{in}} = 120$
SLPM and
 $T=523.15$
K. (
 $b$
) Evolution of the cavity driven by increasing ventilation flow rate
 $Q_{\textit{in}}$
from 100 to 180 SLPM under fixed freestream velocity
 $U=3.38$
m s−1 and vapour temperature
 $T=523.15$
K. Supplementary movie 1 provided for reference is available at https://doi.org/10.1017/jfm.2026.11897.

Compared to natural or gas ventilation, the phase change introduces complex thermo-hydrodynamics. The injected steam originates as high-enthalpy superheated vapour. As it converges into the narrow orifice, it undergoes rapid acceleration and cooling (figure 6
 $b$
). At lower injection rates, this cooling forms discrete condensate droplets (figure 7
 $b$
). With increasing ventilation flow rates, the vapour flow becomes choked at the orifice pore, and forms an under-expanded jet upon exiting (Kerney et al. Reference Kerney, Faeth and Olson1972). Consequently, the vapour undergoes explosive radial expansion and temperature drop, crossing the saturation line to form observable mist flows (figure 7(
 $b$
), also see supplementary movie 1). Based on previous literature (Wu et al. Reference Wu, Katayama, Nariai, Ishizuka, Widyatmoko and Yabe2007), we postulate the existence of internal expansion–compression waves, although direct visual evidence of these condensation shock structures was not captured due to experimental limitations. Nevertheless, the interaction between this high-speed multiphase jet and the water interface is obvious. This interaction, coupled with droplet impact and latent heat release, creates severe local density gradients and pressure pulsations. These thermodynamic disturbances are then convected by shear-driven K–H-type dynamics, and shaped by gravity-related R–T-type selection, culminating in the macroscopic roughness of the RS regime (figure 6
 $c$
). At extremely high ventilation flow rates (
 $Q_{\textit{in}} \gt 400$
SLPM), the supercavity collapses back into a pseudo-FC regime, indicating that excessive interfacial instability can overcome the supplied vapour volume. Distinct from classical FC, the natural cavitation region remains smooth and transparent (see supplementary movie 1), indicating that the natural cavity is sustained while the ventilated portion is stripped away.
Figure 7 provides comparative visualisations of the flow evolution along different parameter regulation paths. First, regarding the interaction with natural cavitation (figure 7
 $a$
), increasing freestream velocity (
 $U$
) in the FC regime reveals that the injected vapour initially behaves as a submerged plume undergoing rapid condensation. As
 $U$
increases, natural cavitation nuclei grow and coalesce. Eventually, a coherent smooth interface establishes from the cavitator edge, creating a distinct stratification from the rough ventilated cavity. Second, for ventilation within a fully formed cavity (figure 7
 $b$
), at lower ventilation flow rates (
 $Q_{\textit{in}}=100$
SLPM), discrete condensate droplets impinge on the interface, generating localised ripples. At moderate ventilation flow rates (
 $Q_{\textit{in}}=180$
SLPM), the random small-scale disturbances induced by mist flow impact are rapidly amplified downstream, evolving into coherent quasi-two-dimensional interfacial waves. Detailed quantitative analysis of these dynamic mechanisms follows in § 3.3.
3.2. Quantitative dependence of cavity dimensions on ventilation parameters
In this section, we quantify the thermo-hydrodynamic response of the supercavity dimensions to ventilation parameters (
 $Q_{\textit{in}}$
and
 $T$
). As defined in figure 8, the cavity length (
 $L_s$
) and maximum diameter (
 $L_d$
) were extracted directly from the high-speed imagery. Given the periodic interfacial fluctuations characteristic of the RS regime, a time-averaged approach was adopted: statistical means were computed over 900 consecutive frames (approximately 0.1 s) to ensure convergence, with error bars representing the standard deviation of temporal fluctuations.
Definition of supercavity dimensional parameters. The length (
 $L_s$
) is measured as the axial distance from the cavitator to the re-attachment point, while the maximum diameter (
 $L_d$
) is extracted at a fixed station 10 cm downstream of the cavitator.

Figure 9 illustrates the non-monotonic evolution of supercavity length
 $L_s$
with ventilation flow rate
 $Q_{\textit{in}}$
. The overall trend aligns well with the flow regime map (figure 5), generally correlating with the transition sequence from FC to LS, SS and RS. At low-to-moderate freestream velocities (
 $U=3.07$
and 3.38 m s−1), vapour injection acts as a mass source, generally promoting supercavity growth. However, a distinct suppression interval is observed in the initial ventilation stage. Small amounts of ventilation cause
 $L_s$
to shrink, although gas addition would usually be expected to enlarge a ventilated cavity. We attribute this to a competition between hydrodynamic disruption and thermodynamic mass loss.
-
(i) Hydrodynamically, the low-flux injection disrupts the coherent low-pressure vortex core in the wake, and weakens the local low-pressure support for natural cavitation. A comparable hydrodynamic disturbance can also occur for ambient-air ventilation. However, in the Appendix B comparison, low air injection promotes cavity formation because the injected air can remain as a gas phase inside the cavity and provide an effective gas-volume source. Thus non-condensable ventilation is governed primarily by the competition between imposed gas supply and closure-region leakage (Spurk Reference Spurk2002; Karn et al. Reference Karn, Arndt and Hong2016). This interpretation is also consistent with three-component numerical models of ventilated cavitation, in which the liquid, vapour and non-condensable-gas phases are solved separately (Ji et al. Reference Ji, Luo, Peng, Zhang, Wu and Xu2010; Hasani Malekshah et al. Reference Hasani Malekshah, Wróblewski and Majkut2024). These simulations show that gas ventilation can reduce the vapour-cavity component associated with natural cavitation, while the injected non-condensable gas still provides an effective gas-volume source over a suitable range of ventilation flow rates.
-
(ii) Thermodynamically, due to the low enthalpy flux at low
 $Q_{\textit{in}}$
, the injected vapour is rapidly depleted by condensation before it can effectively sustain the internal pressure. For vapour ventilation, direct-contact condensation therefore introduces an internal volume sink, while early condensation and near-orifice mixing reduce the effective source fraction. At low vapour flow rates, the imposed vapour source may be too weak to compensate for the weakened natural-cavitation support and condensation loss. Only when
$Q_{\textit{in}}$
exceeds a transition threshold does the mass supply compensate for these losses, driving a qualitative transition from the FC to the supercavity regime. For instance, at
$U=3.07$
m s−1, increasing
$Q_{\textit{in}}$
from 120 to 180 SLPM causes
$L_s$
to nearly double. In contrast, the high-velocity case (
$U=3.51$
m s−1) exhibits a smoother transition as it initiates from a fully developed supercavity.


Variation of supercavity length (
 $L_s$
) with ventilation flow rate (
 $Q_{\textit{in}}$
) under different freestream velocities (groups A1–A3). Error bars represent the standard deviation of temporal fluctuations over 900 frames. Supplementary movie 2 is provided to demonstrate the cavity collapse under high
 $Q_{\textit{in}}$
.

Variation of supercavity diameter (
 $L_d$
) with ventilation flow rate (
 $Q_{\textit{in}}$
). Error bars denote the standard deviation over 900 frames. The dashed line indicates the reference diameter
 $2d_c$
. Note that unlike length, the diameter exhibits strong inertial constraint.

Further analysis reveals a second suppression interval even within the fully formed supercavity regime (e.g. 60–120 SLPM at
 $U=3.51$
m s−1). This interval coincides strictly with the shrinkage in diameter (
 $L_d$
) shown in figure 10. We hypothesise that this secondary suppression is due to ventilation disturbances amplifying interfacial pulsations, which correspondingly increase the effective vapour–liquid contact area and heat transfer coefficient. This creates a thermodynamic penalty where the enhanced condensation rate temporarily outweighs the increase in ventilation supply.
The same source–sink interpretation also explains the high-flow regression. As
 $Q_{\textit{in}}$
increases further, the imposed vapour supply is larger. At the same time, the interface becomes fragmented, and the closure region becomes more unstable. The resulting increase in effective contact area, interfacial renewal and closure loss can raise the sink side of the balance faster than the effective vapour source. Ultimately, at extreme ventilation flow rates (
 $Q_{\textit{in}}=420$
SLPM), all three
 $L_s$
curves exhibit a sharp drop, the dynamic evolution of which is captured in supplementary movie 2. The high-momentum vapour stream impinges strongly on the interface, enhancing turbulent mixing and heat transfer rates. Consequently, the condensation rate surges and overwhelms the mass supply, stripping away the ventilated portion of the cavity. The flow topology following the collapse differs from the classic FC regime. As highlighted in the insets, the interface remains fully transparent across the natural cavitation region, standing in stark contrast to the opaque, foamy texture characteristic of low-ventilation states. This observation implies that while the high-momentum injection suppresses the ventilated supercavity via enhanced condensation, the natural cavitation region at the leading edge remains hydrodynamically stable.
Evolution of cavity morphology with ventilation temperature
 $T$
. Experimental parameters correspond to groups B1–B4 (see table 1) from top to bottom, respectively. The supercavity length
 $L_s$
and diameter
 $L_d$
are annotated for fully developed cases. Note the collapse-to-recovery transition in group B1.

In contrast to the sensitive response of cavity length, the maximum diameter
 $L_d$
(figure 10) remains relatively insensitive to ventilation variations. While minor fluctuations correlate with the length suppression intervals, the overall magnitude of
 $L_d$
remains effectively clamped near
 $2d_c$
. This observation aligns with classical Logvinovich principle of independence of cavity expansion (Logvinovich Reference Logvinovich1973), indicating that the radial expansion is primarily governed by the inertial constraint, and is less sensitive to thermodynamic parameters. Even with active vapour injection, the cavity cannot break the hydrodynamic limit imposed by the oncoming flow momentum.
The independent influence of ventilation temperature
 $T$
is illustrated in figure 11. A pronounced thermal effect is evident in group B1, where injecting 423.15 K vapour destabilises the LS regime into a collapse; however, elevating
 $T$
to 473.15 K triggers a dramatic recovery, establishing a stable SS-RS flow. For other groups, the effect of
 $T$
exhibits a saturation trend. Temperature elevation initially drives significant length extension, but saturates once the cavity morphology is established. We attribute this to two mechanisms: (i) higher vapour enthalpy reduces the content of condensed droplets, mitigating impact disturbances; and (ii) elevated internal temperature increases the local saturation vapour pressure
 $P_v(T_c)$
, effectively lowering the local cavitation number. A similar saturation trend in diameter was reported by Jiang et al. (Reference Jiang, Hong, Pham and Ahn2023) using heated nitrogen, although their study did not observe the dramatic collapse–recovery transition seen in our group B1 due to the absence of phase change. However, the saturation trend implies a limit to these thermal benefits, likely associated with the nonlinear relationship between the source temperature and the actual internal cavity temperature.
Comparison of interfacial characteristics between natural cavitation and vapour ventilation under identical flow conditions (
 $U = 3.51$
m s−1,
 $T = 523.15$
K). Supplementary movie 3 is provided for reference.

To illustrate the non-monotonic dimensional evolution observed above, we introduce a time-averaged source–sink balance for the ventilation cavity. The retained vapour volume is supplied by the residual natural-cavitation source and by the imposed vapour flow that survives near-orifice expansion, mixing and early condensation. It is depleted by closure-region leakage and by condensation at the gas–liquid interface. Appendix C derives this balance from a gas-phase control volume, and gives the reduced source–sink ordering
 \begin{align} \frac {1}{U d_c^2}\frac {\mathrm{d} V_c}{\mathrm{d} t} =\alpha C_{\mathit{nat}}+\beta C_Q-C_{\ell }-\varTheta _{\textit{cond}}, \end{align}
where
 $V_c$
is the cavity volume,
 $C_Q=Q_{\textit{in}}/(U d_c^2)$
is the imposed ventilation coefficient,
 $C_{\mathit{nat}}$
is the dimensionless source associated with the natural-cavitation state at the same freestream speed,
 $\alpha$
is its retained fraction after ventilation is introduced,
 $\beta$
is the effective fraction of imposed vapour supply,
 $C_{\ell }$
is the dimensionless closure leakage coefficient, and
 $\varTheta _{\textit{cond}}$
is the dimensionless potential condensation-sink capacity. The corresponding sink-to-source ratio is
 \begin{align} \varPi _{\textit{net}} = \frac {C_{\ell }+\varTheta _{\textit{cond}}} {\alpha C_{\mathit{nat}}+\beta C_Q}. \end{align}
Values
 $\varPi _{\textit{net}}\lt 1$
indicate that the retained natural-cavitation source plus the effective imposed supply is sufficient to maintain or enlarge the vapour-filled cavity. Values
 $\varPi _{\textit{net}}\gt 1$
indicate that leakage and condensation have overtaken the combined source, giving a tendency towards length reduction or regime regression. This parameter is used here as a physical ordering relation, since
 $\alpha$
,
 $\beta$
,
 $C_{\ell }$
,
 $S_i$
and
 $\textit{Nu}_i$
are closure parameters in the present measurements.
This ordering is consistent with the measured trend in figure 9. For group A,
 $Q_{\textit{in}}=120$
–
 $420$
SLPM corresponds to ventilation coefficients of order 1–4. The intermediate SS range has a relatively smooth interface and a weak condensation capacity, so representative parameter ranges give
 $\varPi _{\textit{net}}\lt 1$
, and the cavity length grows. At high ventilation flow rates, the RS regime exhibits interface fragmentation, droplet impingement, and a broadened misty interface in figures 9 and 18. These features increase the effective contact area and interfacial renewal, allowing the condensation and leakage sink to rise enough for
 $\varPi _{\textit{net}}$
to exceed unity. This explains why the cavity length can regress even though the imposed vapour flow rate is larger. The detailed parameter choices, arithmetic estimates and sensitivity checks supporting this semi-quantitative ordering are provided in the supplementary material (Estimation for the source–sink criterion).
3.3. The interfacial instabilities caused by vapour ventilation
The interfacial dynamics of supercavitation change markedly under active vapour ventilation. As visualised in figure 12 and supplementary movie 3, compared with the quiescent and glassy interface characteristic of natural cavitation, the introduction of high-temperature vapour results in a marked increase in surface roughness. The interface becomes highly unsteady, characterised by the continuous formation and break-up of irregular ripples and gas clusters.
We propose a conceptual model of the instability mechanisms, with the sequence schematised in figure 13, to explain the transition from a smooth to a rough interface leading up to cavity collapse. The dominant instability source evolves distinctly with the ventilation flow rate. (i) At low injection rates, the primary disturbance arises from the impingement of condensate droplets, which acts as a discrete excitation source on the cavity surface. (ii) In the RS regime, the formation of an under-expanded jet and contact condensation generates continuous thermodynamic pulsations. These perturbations are then convected and amplified by shear-driven K–H dynamics, while gravity and surface tension select the long-wave upper-interface disturbances through an R–T-type mechanism (Chandrasekhar Reference Chandrasekhar1961; Drazin & Reid Reference Drazin and Reid2004). (iii) Under very high ventilation, the mechanism shifts to rapid heat transfer. Strong mixing triggers a surge in condensation that overwhelms the mass supply, stripping the cavity rear and causing collapse.
To quantify the spatial evolution of these interfacial disturbances, we extracted the temporal envelopes of the upper cavity interface. Figure 14 presents the amplitude distribution
 $\Delta Y$
along the streamwise direction, where the origin is defined at the cavity detachment point. It is observed that the interfacial fluctuation amplitude grows linearly downstream (
 $X/d_c \gt 2$
). Comparing the envelopes for
 $Q_{\textit{in}}=120$
and 360 SLPM, it is evident that increasing the ventilation flow rate significantly enhances both the initial perturbation magnitude in the ventilation influence region and the spatial growth rate. The 95 % confidence intervals (grey shaded regions) confirm the statistical significance of this linear amplification.
Schematic illustration of the interfacial instability mechanisms. (
 $a$
) Low ventilation flow rate: impingement of condensate droplets. (
 $b$
) Medium-to-high ventilation flow rate: thermodynamic pulsations with K–H/R–T instabilities. (
 $c$
) Very high ventilation flow rate: strong mixing and rapid condensation.

Envelope contours of the upper supercavity interface and interfacial wave amplitudes at different axial positions under different ventilation flow rates: (
 $a$
)
 $Q_{\textit{in}} = 120$
SLPM, (
 $b$
)
 $Q_{\textit{in}} = 360$
SLPM.

The FFT spectra of greyscale variations in the ventilation influence region under different ventilation flow rates. The vertical axis
 $\bar {G}$
represents the time-integrated spectral amplitude of the normalised greyscale fluctuations.

Spatiotemporal analysis of interfacial instabilities at
 $Q_{\textit{in}}=360$
SLPM. (
 $a$
) Spatiotemporal diagram of the dimensionless surface displacement
 $\eta ^{*}$
, visualising the downstream convection of wave packets. Streamwise evolution of the Hilbert energy density spectra
 $E_{\mathit{H}}$
resolved in (
 $b$
) the dimensionless frequency domain (
 $St = f d_c / U$
) and (
 $c$
) the dimensionless wavelength domain (
 $\lambda ^* = \lambda / d_c$
). (
 $d$
) Dispersion spectrum
 $S_{\mathit{H}}(St, k^*)$
in the frequency–wavenumber plane, where
 $k^* = d_c / \lambda$
denotes the dimensionless wavenumber.

We further investigated the spectral characteristics of the excitation source by performing a fast Fourier transform (FFT) on the greyscale fluctuations within the ventilation influence region (figure 15). The ventilation influence region is selected as the monitoring region because the high-temperature flow interacts with the cavity interface and produces strong thermo-hydrodynamic coupling. These processes induce significant greyscale fluctuations that characterise the core dynamic properties of the excitation source. A dominant fundamental frequency, denoted as
 $f_0$
, is identified, which shifts from approximately 55 Hz to 146 Hz as
 $Q_{\textit{in}}$
increases. This suggests that the ventilation jet acts as a thermodynamic self-excited oscillator. However, a counter-intuitive drop in the peak amplitude is observed at intermediate ventilation flow rates (
 $Q_{\textit{in}}=180{-}240$
SLPM). This attenuation can be attributed to the transition mechanism of interfacial instabilities: the under-expanded jet at these rates generates a mist flow containing very fine condensate droplets. The random impingement of this mist on the interface, and the unsteady contact condensation of the cooled jet at the cavity surface, introduce broadband thermodynamic pulsations instead of a single tonal excitation, thereby distributing the spectral energy and suppressing the dominant peak amplitude.
Figure 16 visualises the spatiotemporal evolution of the travelling waves. The trajectory of the dimensionless wave elevation
 $\eta ^{*}=\eta /d_c$
in figure 16(
 $a$
) indicates a clear convection velocity, where
 $\eta$
denotes the instantaneous interface displacement extracted from the cavity boundaries. More importantly, the Hilbert–Huang transform spectra (Huang et al. Reference Huang, Shen, Long, Wu, Shih, Zheng, Yen, Tung and Liu1998) in figures 16(
 $b$
) and 16(
 $c$
) reveal a distinct frequency downshifting and wavelength dilation trend along the streamwise direction. This evolution is consistent with vortex pairing in a K–H-type shear-layer instability. As the interfacial waves propagate downstream, small-scale vortices in the shear layer merge into larger coherent structures, leading to an increase in the spatial wavelength (
 $\lambda ^*$
) and a consequent decrease in the characteristic frequency (
 $St$
).
Furthermore, the dispersion spectrum in figure 16(
 $d$
) presents the energy distribution in the
 $(St,k^*)$
plane. The energy concentration along the linear ridge reveals the convective nature of the interfacial instabilities, where the slope represents the dimensionless phase velocity
 $C_{\!p}/U$
:
 \begin{align} \frac {C_{\!p}}{U} = \frac {\omega /k}{U} = \frac {2\pi f \lambda }{U} \approx 1.04. \end{align}
Theoretically, for a classical K–H instability at a gas–liquid interface, the phase velocity is a density-weighted average of the two stream velocities (Brennen Reference Brennen2014):
 \begin{align} C_{\mathit{K-H}} = \frac {\rho _l U_l + \rho _v U_v}{\rho _l + \rho _v}, \end{align}
where
 $\rho _l$
and
 $\rho _v$
are the densities of the liquid and vapour phases, respectively. Given that
 $\rho _l \gg \rho _v$
, the theoretical phase velocity should conform to the local liquid velocity (
 $C_{\mathit{K-H}} \approx U_{l}$
). Considering the model blockage ratio
 $B \approx 4.5\,\%$
(calculated in § 2.1), the accelerated local liquid velocity around the cavity can be estimated as
 $U_{l} \approx U / (1 - B) \approx 1.05 U$
. The close agreement between the measured phase velocity (
 $C_{\!p} = 1.04 U$
) and the estimated local velocity (
 $C_{\mathit{K-H}}\approx 1.05 U$
) supports a K–H-type convective mechanism for the interfacial waves. In this context, the pulsation of the cavity surface is organised as a source-convection process: the thermodynamic pulsations at the orifice provide the source excitation, which then undergoes downstream convection and amplification along the shear layer.
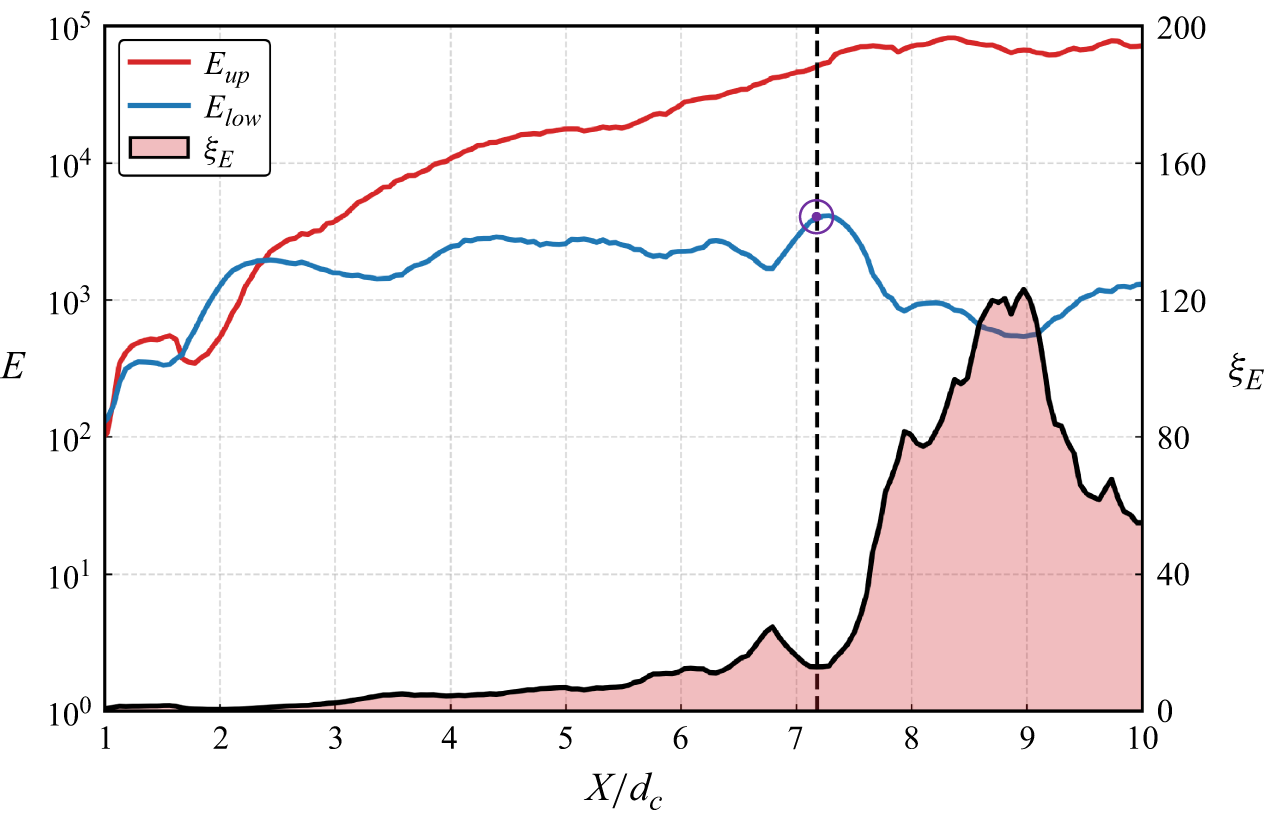
Although the K–H mechanism effectively explains the convective nature of the interfacial waves, the classical shear-layer picture implies a quasi-symmetric growth of disturbances on both interfaces (Wang et al. Reference Wang, Huang, Zhang, Wang and Zhao2018; Zou & Zhang Reference Zou and Zhang2021). Our high-speed imaging reveals a pronounced vertical asymmetry during the RS regime: the upper interface undergoes large-amplitude undulation and break-up, whereas the lower interface remains relatively stable. Previous studies have noted that the gravity-induced hydrostatic pressure gradient causes the cavity axis to migrate upwards, leading to significant disparities in the pressure and velocity distributions between the upper and lower interfaces (Ceccio Reference Ceccio2010; Liu et al. Reference Liu, Xiang, Xie and Zhang2023a ). Consequently, the interfacial evolution is likely shaped by K–H-type convection together with gravity-related R–T-type selection. Near the closure region, pressure recovery and re-entrant-flow impingement may also provide a local dynamic contribution by decelerating the interface and increasing the effective normal acceleration. To quantify this vertical asymmetry, we analyse the streamwise evolution of the fluctuation energy.
Streamwise evolution of interfacial instability intensity at
 $Q_{\textit{in}}=360$
SLPM. The cumulative energy
 $E$
is calculated by integrating the Hilbert energy spectrum within the effective frequency band (
 $5 {-} 3000$
Hz). The ratio
 $\xi _E = E_{up}/E_{low}$
quantifies the energetic asymmetry between the upper and lower interfaces. The vertical dashed line at
 $X/d_c \approx 7.2$
marks the approximate axial location of the cavity closure region.

The instability evolution is quantified by the cumulative energy intensity
 $E$
, as depicted in figure 17. In the near-field region (
 $X/d_c \lt 2.5$
), the fluctuation energies of the upper and lower interfaces are nearly equivalent, yielding energy ratio
 $\xi _E \approx 1$
. This symmetry indicates that the initial disturbances are mainly convected by K–H-type shear-layer dynamics. A significant divergence emerges in the mid-field region (
 $2.5 \lt X/d_c \lt 7.2$
). Here, the upper-surface fluctuation energy increases much more rapidly than that on the lower surface. This divergence is attributed to the superposition of shear-driven convection and gravity-related R–T-type amplification on the upper interface. On the lower interface, gravity acts as a restoring force, creating a stable stratification that inhibits the growth of large-scale fluctuations. At the intersection of the lower interface and the body surface (
 $X/d_c \approx 7.2$
), a localised surge in fluctuation energy is observed. This spike is correlated with flow separation and the vigorous impact of the re-entrant jet, both of which are driven by the severe adverse pressure gradient present in this region. Following this surge, the fluctuations on the lower interface undergo a sharp attenuation. This decay coincides with the cavity closure onto the sidewall of the test model, where the three-phase contact line effectively constrains and damps the interfacial oscillations. In the far-field region (
 $X/d_c \gt 7.2$
), the fluctuation energy of the upper interface continues to increase slightly before reaching saturation, resulting in a peak energy ratio
 $\xi _E$
exceeding 120.
Notably, the spectral evolution shown in figure 16(
 $c$
) indicates that the dominant wavelength of the disturbances increases along the flow direction. This wavelength dilation can be physically explained by the filtering effect of surface tension against the R–T-type mechanism. According to the linear stability theory (Charru Reference Charru2011), the interface becomes unstable only when the perturbation wavelength exceeds a critical threshold
 $\lambda _{\mathit{R-T}}$
determined by the competition between surface tension and gravity:
 \begin{align} \lambda _{\mathit{R-T}} = 2\pi \sqrt {\frac {\gamma }{g(\rho _l - \rho _v)}}, \end{align}
where
 $\gamma$
is the surface tension, and
 $g$
is the gravitational acceleration. Under the reference experimental conditions (
 $T = 298.15$
K,
 $P = 12.25$
kPa), the thermophysical properties derived from the IAPWS-95 formulation (Wagner & Pruß Reference Wagner and Pruß2002) are surface tension
 $\gamma = 0.072$
N m−1, liquid density
 $\rho _l = 997.05$
kg m−3, and vapour density
 $\rho _v = 0.09$
kg m−3 (evaluated at the cavity reference pressure
 $12.25$
kPa; the source–sink condensation estimate in Appendix C and the supplementary material adopts a smaller representative density for the lower-pressure condensing region inside the cavity). These parameters yield
 $\lambda _{\mathit{R-T}} \approx 17.05$
mm. Theoretically, perturbations with wavelengths shorter than this threshold are damped by surface tension, while longer wavelengths are selectively amplified by gravity. Notably, in the case of high-temperature ventilation, although superheated vapour is injected, the effective interfacial temperature (
 $T_{\textit{in}}$
) remains only slightly above the ambient water temperature (298.15 K). This is attributed to the vast heat capacity disparity between the two phases, and the intense latent heat exchange during condensation. Even if
 $T_{\textit{in}}$
shifts to 303.15 K, the resulting deviations in
 $\gamma$
,
 $\rho _l$
and
 $\rho _v$
are minimal, leading to a negligible reduction in
 $\lambda _{\mathit{R-T}}$
(approximately 0.47 %). This quantitative stability of
 $\lambda _{\mathit{R-T}}$
suggests that the observed transition towards larger coherent structures in the far field is better attributed to the selective gravity-driven amplification of long-wave perturbations than to temperature-induced property changes.
In summary, the distinct interfacial dynamics of the RS regime are associated with a coupled thermo-hydrodynamic mechanism. In contrast to the predominantly inertial instabilities observed in non-condensable gas ventilation, the instability here originates from thermodynamic self-excitation at the ventilation orifice. This self-excitation is characterised by a feedback loop in which rapid condensation and latent-heat exchange generate local thermodynamic and pressure fluctuations near the ventilation orifice. These fluctuations can modulate the near-orifice vapour discharge and interfacial condensation, thereby sustaining the disturbance source. The resulting disturbances are convected downstream through a K–H-type shear-layer mechanism. The subsequent topological evolution is shaped by gravitational differentiation. On the lower surface, gravity suppresses fluctuations through stable stratification. On the upper surface, gravity selectively amplifies long-wave perturbations through an R–T-type mechanism. In this process, short-wave disturbances are effectively damped by surface tension. This physical progression explains the RS regime by tracing the evolution from thermo-hydrodynamic pulsations and shear-driven convection to gravity-selected interfacial amplification.
4. Conclusion
This study shows that condensable-vapour ventilation changes the mass balance and interfacial stability of ventilated supercavitation. Compared with non-condensable gas ventilation, vapour-ventilated flows involve a coupled thermo-hydrodynamic response dominated by rapid phase change. We identified a rough supercavity (RS) regime, characterised by persistent interfacial roughness and strong spatiotemporal instability, which was absent in the classical ventilation cases examined here.
A key finding is the non-monotonic response of cavity evolution to ventilation. The air-ventilation comparison shows a promotion–suppression sequence: small air injection enlarges the cavity at first, whereas excessive air injection reduces the coherent cavity length through over-expansion, closure leakage, gas-pocket shedding, and pulsation. Vapour ventilation shows its own non-monotonic length response; its high-flow regression is driven by strong mixing and rapid condensation that overwhelm the imposed vapour source. Despite these thermodynamic effects, the cavity diameter remains constrained by inertial forces, supporting the applicability of classical radial scaling laws over the present range.
Spatiotemporal analysis suggests that the RS regime develops through a succession of thermo-hydrodynamic processes. The instability originates from self-sustained oscillations induced by ventilation, which involve droplet impingement, under-expanded jet expansion, and rapid condensation. The resulting pulsations serve as the initial perturbation source, and are subsequently convected downstream through the K–H-type shear-layer mechanism. The convective nature of this instability is supported by the phase velocity extracted from the dispersion relation. Concurrently, the gravitational field exerts a stratified influence on the interfacial stability: it suppresses fluctuations on the lower interface through stable stratification, while the R–T-type mechanism selectively amplifies long-wave perturbations on the upper interface. This source–convection–selection sequence explains the macroscopic RS regime and the pronounced vertical asymmetry observed in high-temperature vapour-ventilated supercavitation.
This work extends supercavitation analysis into a regime where heat and mass transfer actively modulate interfacial instabilities. The proposed physical ordering provides guidance for the control of vapour-ventilated supercavities, particularly for applications involving high-enthalpy exhaust gases.
Supplementary material and movies
Supplementary material and movies are available at https://doi.org/10.1017/jfm.2026.11897.
Funding
This research was supported by the National Natural Science Foundation of China (nos 12332014, 12372268, 52525102) and the Scientific Research Innovation Capability Support Project for Young Faculty (grant no. ZYGXQNJSKYCXNLZCXM-O1).
Declaration of interests
The authors report no conflict of interest.
Data availability statement
The data that support the findings of this study are available from the corresponding author upon reasonable request.
Appendix A. Morphological comparison of full-length supercavity regimes
To provide a visual benchmark for the flow regime classification discussed in § 3.1, this appendix presents a series of high-speed images. Figure 18 captures the representative interfacial morphologies for the SS, SS-RS transition and RS regimes, respectively. These observations correspond to group A3, where the ambient pressure (
 $P_\infty$
), freestream velocity (
 $U$
) and ventilation temperature (
 $T$
) are held constant to isolate the influence of the ventilation flow rate (
 $Q_{\textit{in}}$
). The evolution of the interface from a transparent, smooth state to the emergence of regular waves, and finally to a chaotic, irregularly fluctuating surface, provides direct evidence for the interfacial instability mechanisms described in the main text.
Comparison of typical interfacial morphologies for three full-length supercavity regimes.

Appendix B. Air-ventilation experiments for baseline comparison
In order to verify the characteristics of high-temperature water vapour ventilation compared to non-condensable gas ventilation, we used the same experimental device to ventilate different flow rates of ambient air into the cavity. The temperature of the injected air was maintained at an ambient level of approximately 298.15 K, providing a reliable baseline as the thermophysical properties of air remain relatively stable compared to the intense phase-change effects of steam. The experiments were conducted by maintaining the same ambient pressure (
 $P_\infty$
) and freestream velocity (
 $U$
) as in group A3. The results are shown in figure 19.
Cavitation promotion or cavitation suppression induced by air ventilation.

Figure 19 shows that ambient-air ventilation first promotes the cavity at low flow rate, then suppresses the coherent cavity length at higher flow rate. Since air is non-condensable under the present conditions, this suppression is interpreted as a leakage/closure effect associated with over-expansion, buoyancy-driven gas-pocket shedding, and large-amplitude pulsation. The vapour cases differ because condensation provides an additional internal volume sink and couples directly to interface fragmentation.
Appendix C. Derivation of the source–sink criterion for cavity-length evolution
This appendix derives the source–sink criterion used in § 3.2. The derivation keeps only the variables needed for the reduced balance. Detailed parameter choices, numerical substitutions, and sensitivity checks are provided in the supplementary material (Estimation for the source–sink criterion).
Consider the vapour-filled part of the ventilated cavity as a gas-phase control volume. Let
 $V_c$
be the vapour-filled cavity volume, and let
 $\rho _v$
be a representative vapour density. A leading-order gas-phase mass balance gives
 \begin{align} \frac {\mathrm{d}}{\mathrm{d}t}\left (\rho _v V_c\right ) = \rho _v \alpha Q_{\mathit{nat}} + \rho _v Q_{\mathit{in,eff}} - \rho _v Q_{\textit{leak}} - \dot m_{\textit{cond}}, \end{align}
where
 $Q_{\mathit{nat}}(U)$
is the equivalent vapour-volume source associated with the natural-cavitation state at the same freestream velocity
 $U$
,
 $\alpha$
is the retained fraction of that source after ventilation is introduced,
 $Q_{\mathit{in,eff}}$
is the effective imposed vapour supply,
 $Q_{\textit{leak}}$
is the closure-region leakage, and
 $\dot m_{\textit{cond}}$
is the condensation mass rate. Expanding the left-hand side and dividing by
 $\rho _v$
gives
 \begin{align} \frac {\mathrm{d} V_c}{\mathrm{d}t} = \alpha Q_{\mathit{nat}} + Q_{\mathit{in,eff}} - Q_{\textit{leak}} - \frac {\dot m_{\textit{cond}}}{\rho _v} - \frac {V_c}{\rho _v}\frac {\mathrm{d}\rho _v}{\mathrm{d}t}. \end{align}
The present optical measurements resolve the cavity boundary and interfacial waves, while the pressure-wave field and the spatial variation of vapour density inside the cavity remain unresolved. The density-variation term in (C2) is therefore treated as part of the model boundary. This gives the reduced volume balance
 \begin{align} \frac {\mathrm{d} V_c}{\mathrm{d}t} = \alpha Q_{\mathit{nat}} + Q_{\mathit{in,eff}} - Q_{\textit{leak}} - \frac {\dot m_{\textit{cond}}}{\rho _v}. \end{align}
Figure 10 shows that the maximum diameter
 $L_d$
remains close to
 $2d_c$
, where
 $d_c$
is the cavitator diameter. Hence at the level of the present scaling, the cavity volume can be related to the measured length
 $L_s$
as
 \begin{align} V_c \sim A_c L_s, \quad A_c=O(d_c^2), \end{align}
where
 $A_c$
is an effective cross-sectional area. The sign of the right-hand side in (C3) therefore gives the leading-order tendency for cavity-length growth or regression.
The imposed ventilation coefficient is defined as
 \begin{align} C_Q=\frac {Q_{\textit{in}}}{U d_c^2}, \quad Q_{\textit{in}}=C_Q U d_c^2. \end{align}
Only part of the imposed vapour flow contributes to the main cavity body, so
 \begin{align} Q_{\mathit{in,eff}}=\beta Q_{\textit{in}}=\beta C_Q U d_c^2, \quad 0\lt \beta \leqslant 1, \end{align}
where
 $\beta$
accounts for near-orifice throttling, expansion, mixing, and early condensation. The retained natural-cavitation source is written as
 \begin{align} Q_{\mathit{nat,eff}}=\alpha\, Q_{\mathit{nat}}(U), \quad C_{\mathit{nat}}=\frac {Q_{\mathit{nat}}}{U d_c^2}, \quad 0\leqslant \alpha \leqslant 1. \end{align}
Here,
 $\alpha =\alpha (C_Q,U)$
is a retention coefficient:
 $\alpha (0,U)=1$
for natural cavitation, and
 $\alpha$
decreases as ventilation suppresses the original low-pressure cavitating wake. The closure leakage is scaled by
 \begin{align} Q_{\textit{leak}}=C_{\ell } U d_c^2, \end{align}
where
 $C_{\ell }$
is a regime-dependent leakage coefficient associated with the tail closure state.
The condensation sink is estimated from the potential interfacial heat-transfer capacity. Define the positive temperature driving difference as
 $\Delta T_i^+=\max [T_{\textit{sat}}(p_i)-T_l,0]$
, where
 $T_{\textit{sat}}(p_i)$
is the saturation temperature at a representative interface pressure
 $p_i$
, and
 $T_l$
is the liquid temperature. With
 $A_i$
the effective gas–liquid contact area,
 $h_i$
the interfacial heat-transfer coefficient, and
 $L_v$
the latent heat of vaporisation, we have
 \begin{align} \dot m_{\textit{cond}} \sim \frac {h_i A_i\, \Delta T_i^+}{L_v}. \end{align}
Using
 $\textit{Nu}_i=h_i d_c/k_l$
and
 $S_i=A_i/d_c^2$
, where
 $k_l$
is the liquid thermal conductivity, the corresponding potential volumetric condensation sink is
 \begin{align} Q_{\textit{cond,max}} \sim \mathcal{G}_{\textit{sh}} S_i\, \textit{Nu}_i \frac {k_l\, \Delta T_i^+\, d_c}{\rho _v L_v}, \end{align}
where
 $\mathcal{G}_{\textit{sh}}$
is a superheat-buffering factor that reduces the effective condensation sink when part of the injected vapour enthalpy is consumed by desuperheating before condensation. The dimensionless condensation-sink capacity is
 \begin{align} \varTheta _{\textit{cond}} = \frac {Q_{\textit{cond,max}}}{U d_c^2} = \mathcal{G}_{\textit{sh}} S_i\, \textit{Nu}_i \frac {k_l\, \Delta T_i^+}{\rho _v L_v U d_c}. \end{align}
The term
 $\varTheta _{\textit{cond}}$
should be read as a potential sink capacity. The actual condensation rate remains supply-limited when the available vapour source is smaller than this capacity.
Substituting (C6)–(C8) and (C11) into the reduced volume balance gives the dimensionless source–sink ordering
 \begin{align} \frac {1}{U d_c^2}\frac {\mathrm{d}V_c}{\mathrm{d}t} = \alpha C_{\mathit{nat}} + \beta C_Q - C_{\ell } - \varTheta _{\textit{cond}} . \end{align}
This ordering motivates the net sink-to-source parameter
 \begin{align} \varPi _{\textit{net}} = \frac {C_{\ell }+\varTheta _{\textit{cond}}}{\alpha C_{\mathit{nat}}+\beta C_Q}. \end{align}
Values
 $\varPi _{\textit{net}}\lt 1$
indicate that the retained natural-cavitation source and the effective imposed supply are sufficient to offset closure leakage and condensation loss, while
 $\varPi _{\textit{net}}\gt 1$
indicates a tendency towards cavity regression. This ordering converts the measured length response into a semi-quantitative constraint on the hidden sink terms. Relative to the unventilated state, the low-flow source increment is
 \begin{align} \Delta \mathcal{S}_{\mathit{low}} \approx \beta C_Q - C_{\mathit{nat}}(1-\alpha ) - \Delta C_{\ell } - \Delta \varTheta _{\textit{cond}} . \end{align}
This expression states the condition for the observed initial shortening in figure 9: the ventilation-induced loss of the natural-cavitation source, plus any added leakage or condensation, can exceed the small imposed source at low
 $C_Q$
. A higher freestream velocity may keep
 $\alpha$
closer to unity over the same low-ventilation range, which weakens this initial shortening.
The condensation term can be written compactly by defining the thermal prefactor
 \begin{align} F_T = \frac {k_l\,\Delta T_i^+}{\rho _v L_v U d_c}, \end{align}
so that
 \begin{align} \varTheta _{\textit{cond}} = \mathcal{G}_{\textit{sh}}S_i\,\textit{Nu}_i\,F_T . \end{align}
For the present conditions, the magnitude of
 $F_T$
is
 $10^{-3}$
. Combined with the threshold condition
 $\varPi _{\textit{net}}\approx 1$
, we can derive the required area-heat-transfer product when the condensation sink exactly counteracts the residual total source term:
 \begin{align} \left (\mathcal{G}_{\textit{sh}}S_i\,\textit{Nu}_i\right )_{\mathit{req}} \sim \frac {\alpha C_{\mathit{nat}}+\beta C_Q-C_{\ell }}{F_T}, \quad \alpha C_{\mathit{nat}}+\beta C_Q\gt C_{\ell }. \end{align}
If
 $\alpha C_{\mathit{nat}}+\beta C_Q\leqslant C_{\ell }$
, then near-orifice losses and tail leakage alone are sufficient to prevent sustained growth of the vapour-filled part of the cavity. Otherwise, (C17) shows that a unit-order remaining source margin requires an
 $O(10^3)$
area-heat-transfer product because
 $F_T$
is small. This is the scaling reason why a smooth interface produces a weak condensation sink, while an RS interface with fragmentation, droplet impingement and contact-area renewal can make condensation dynamically important.
The measured length response provides a sign-level check on this ordering. Since
 $V_c\sim A_cL_s$
and figure 10 shows that
 $A_c=O(d_c^2)$
varies weakly compared with
 $L_s$
, the finite-difference trend of
 $L_s(Q_{\textit{in}})$
indicates the sign of the net volume balance:
 \begin{align} \Delta L_s\gt 0 \Rightarrow \alpha C_{\mathit{nat}}+\beta C_Q\gt C_{\ell }+\varTheta _{\textit{cond}}, \quad \Delta L_s\lt 0 \Rightarrow \alpha C_{\mathit{nat}}+\beta C_Q\lt C_{\ell }+\varTheta _{\textit{cond}} . \end{align}
In figure 9, increasing
 $Q_{\textit{in}}$
from the low to intermediate range gives cavity growth after the initial suppression, indicating a source-dominated interval. At the highest ventilation flow rates, all three curves regress even though the imposed source
 $C_Q$
is larger, requiring an increase in
 $C_{\ell }$
,
 $\varTheta _{\textit{cond}}$
, or both.
A high-flow finite-difference constraint follows directly from (C12). If
 $L_s$
decreases between two neighbouring high-ventilation points, then
 \begin{align} \Delta (C_{\ell }+\varTheta _{\textit{cond}}) \gt \Delta (\alpha C_{\mathit{nat}}+\beta C_Q). \end{align}
At high ventilation, the retained natural-cavitation term is expected to be small. If the effective imposed-source factor varies slowly over the last interval, then this condition reduces to the simpler requirement
 $\Delta (C_{\ell }+\varTheta _{\textit{cond}})\gtrsim \beta\, \Delta C_Q$
. If the added sink is mainly carried by condensation, then (C16) gives
 \begin{align} \Delta (\mathcal{G}_{\textit{sh}}S_i\,\textit{Nu}_i) \gtrsim \frac {\beta\, \Delta C_Q-\Delta C_{\ell }}{F_T}. \end{align}
Thus if tail leakage also increases in the RS closure, then the required condensation contribution is reduced, while the total sink constraint in (C19) remains unchanged.
The interfacial measurements give an observable counterpart to this sink increase. Figure 14 shows that the streamwise growth rate of the interface envelope increases as the ventilation flow rate rises. For a wavy interface with observed amplitude
 $a_{\mathit{obs}}$
and wavelength
 $\lambda _{\mathit{obs}}$
, the projected area correction scales as
 \begin{align} \frac {A}{A_0} \approx 1+\frac {1}{4} \left (\frac {2\pi a_{\mathit{obs}}}{\lambda _{\mathit{obs}}}\right )^2 , \end{align}
so stronger envelope growth raises a two-dimensional area proxy and accompanies enhanced local mixing. This proxy alone gives only an
 $O(1)$
area correction for the measured envelope amplitudes; the larger effective sink capacity must also involve three-dimensional fragmentation, condensate-interface renewal, and local heat-transfer enhancement. The optical images in figures 9 and 18 show these qualitative signatures in the RS regime. This appendix therefore links the observed sequence-length growth at intermediate
 $Q_{\textit{in}}$
, stronger envelope amplification at high
 $Q_{\textit{in}}$
, and sharp length regression at the highest
 $Q_{\textit{in}}$
to the threshold estimate in (C17) and the finite-difference constraint in (C19)–(C20). The estimate remains semi-quantitative because
 $\alpha$
,
 $\beta$
,
 $C_{\ell }$
,
 $S_i$
and
 $\textit{Nu}_i$
are closure parameters in the present measurements; independent flux measurements or high-fidelity simulations are required to determine these hidden fluxes separately.


 T∞≈298.15

 a
 b
 c
 a
 b
 c
 d
 U
 Qin
 T
 a
 b
 c

 a
 U
 Qin=120
 T=523.15
 b
 Qin
 U=3.38
 T=523.15

 Ls
 Ld

 Ls
 Qin
 Qin

 Ld
 Qin
 2dc

 T
 Ls
 Ld

 U=3.51
 T=523.15

 a
 b
 c

 a
 Qin=120
 b
 Qin=360

 G¯

 Qin=360
 a
 η∗
 EH
 b
 St=fdc/U
 c
 λ∗=λ/dc
 d
 SH(St,k∗)
 k∗=dc/λ
 Qin=360
 E
 5−3000
 ξE=Eup/Elow
 X/dc≈7.2



