


Introduction
There is an enormous literature on the composition of political elites. Yet, there is currently no time-series dataset on governing elites in a large number of countries, and political scientists are therefore unable to answer even basic descriptive questions such as (a) what is the share of female cabinet members globally, (b) which type of regime has the highest cabinet turnover, and (c) have cabinets increased in size over time? This naturally also hampers our ability to answer questions of theoretical importance.
In this article, we present a new dataset, WhoGov, which contains information on cabinet members in the period 1966–2016 in all countries with a population of more than 400,000 citizens.Footnote 1 In total, the dataset contains yearly information on 50,197 cabinet members in 177 countries. WhoGov provides vastly greater cross-sectional and temporal coverage compared with existing datasets on cabinets.Footnote 2
We created the dataset based on the Chiefs of State and Cabinet Members of Foreign Governments directory compiled by the Central Intelligence Agency (CIA). The original documents were digitized through machine-learning and extensive manual cleaning. This provided the position and the name for every cabinet member for a given country in July of every year. To this, we added party affiliation and gender, and we organized the portfolios into categories. The dataset is highly flexible and can be used to calculate countless variables of interest including the number of female ministers, ministerial experience, cabinet turnover, and cabinet size at the country-year level.
We first present how the data was created and validate it against other datasets. Afterwards, we prove that the dataset can be used to gain insight. We replicate and extend Arriola’s (2009) study on how African leaders increase the size of the cabinet to distribute patronage and show that the results do not travel outside of Africa, indicating that leaders outside of Africa adjust the size of the cabinet for different reasons than African leaders. Then we demonstrate how the data can be used to gain new insights into four different fields, namely the study of autocracies, gender studies, the study of regime types, and government formation. The data has many more applications, and we are excited to see how scholars will use this contribution to political science.
Existing datasets
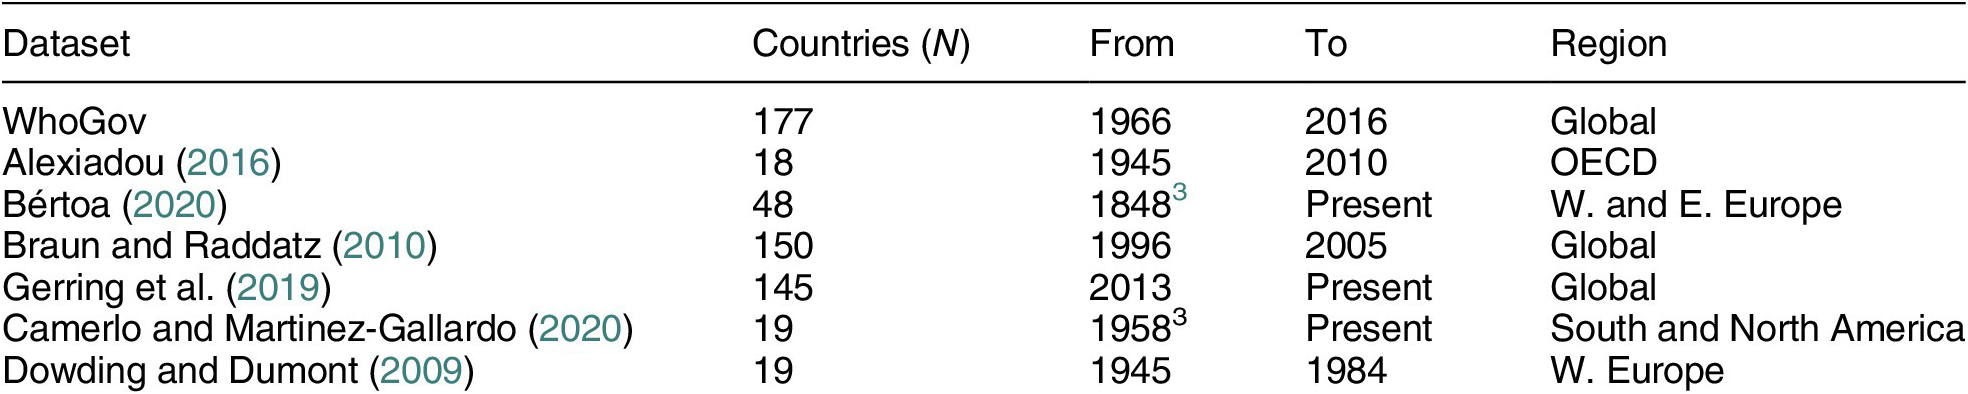
The most comprehensive work using minister-level data involves advanced industrial democracies. The bulk of this work focuses on the determinants of minister selection and survival on a country-by-country basis (e.g., Bäck et al. Reference Bäck, Dumont, Meier, Persson and Vernby2009; Berlinski, Dewan, and Dowding Reference Berlinski, Dewan and Dowding2010; Fischer and Kaiser Reference Fischer and Kaiser2007; Kam et al. Reference Kam, Bianco, Sened and Smyth2010; Kerby Reference Kerby2011; Rodríguez-Teruel Reference Rodríguez-Teruel2011; Smith and Martin Reference Smith and Martin2017). Several previous studies employ cross-national data (e.g., Bright, Döring, and Little Reference Bright, Döring and Little2015; Huber and Martinez-Gallardo Reference Huber and Martinez-Gallardo2008), and Footnote data resources have been made publicly available for researchers interested in comparisons. The Selection and Deselection of Political Elites (SEDEPE) research network offers a dataset on 19 European countries from 1945 to 1984 (Dowding and Dumont Reference Dowding and Dumont2009), while Alexiadou (Reference Alexiadou2016) offers data on 18 OECD countries from 1945 to 2010, and Bértoa (Reference Bértoa2020) presents a new dataset on European democracies since 1848.
The equivalent longitudinal data resources covering emerging democracies and autocracies are less developed. Many studies tend to focus on single countries (Buehler and Ayari Reference Buehler and Ayari2018; Kung and Chen Reference Kung and Chen2011; Schleiter Reference Schleiter2013; Woldense Reference Woldense2018), while studies that target cross-country comparisons tend to focus on a small number of countries from a specific region such as Latin America (Camerlo and Martinez-Gallardo Reference Camerlo and Martinez-Gallardo2020; Camerlo and Perez-Liñan Reference Camerlo and Perez-Liñan2015; Escobar-Lemmon and Taylor-Robinson Reference Escobar-Lemmon and Taylor-Robinson2005), Central-Eastern Europe (Bego Reference Bego2014; Semenova Reference Semenova, Cotta and Almeida2018), and Sub-Saharan Africa (Arriola and Johnson Reference Arriola and Johnson2014; Francois, Rainer, and Trebbi Reference Francois, Rainer and Trebbi2014; Kroeger Reference Kroeger2020). Other scholars have reduced the temporal coverage, and increased the number of countries. The recent Global Leadership Project (GLP), for instance, limits temporal coverage of ministers from 2013 onward (Gerring et al. Reference Gerring, Oncel, Morrison and Pemstein2019) while an earlier dataset compiled by Braun and Raddatz (Reference Braun and Raddatz2010) only begins in 1996. Furthermore, some studies only include specific positions, such as leaders (Goemans et al. Reference Goemans, Gleditsch and Chiozza2009) or the foreign or finance minister (Alexiadou and Gunaydin Reference Alexiadou and Gunaydin2018; Quiroz Flores Reference Flores and Alejandro2016).
To sum up, there is, to date, no global dataset on governments over a long time span, and the case for such a dataset is clear. Table 1 compares WhoGov with existing prominent datasets on governments.
Available Time-Series Cross-Sectional Datasets on Cabinets

Creation of the Dataset
In the following section, we briefly describe the data gathering process and choices of relevance to researchers using the data. We refer to Appendix E for a more in depth description.
The original source of data is the Chiefs of State and Cabinet Members of Foreign Governments, which is published by the United States’ CIA. This directory contains the name, the position, and title (if any) of all cabinet ministers and other members of the government in as many countries as practically possible. The earliest available version dates back to 1966, and the directory has been updated at least half-yearly until today. We have obtained the files for every July in the period from 1966 to 2016 and digitized them. We have used July because data were most widely available for this month.Footnote 4
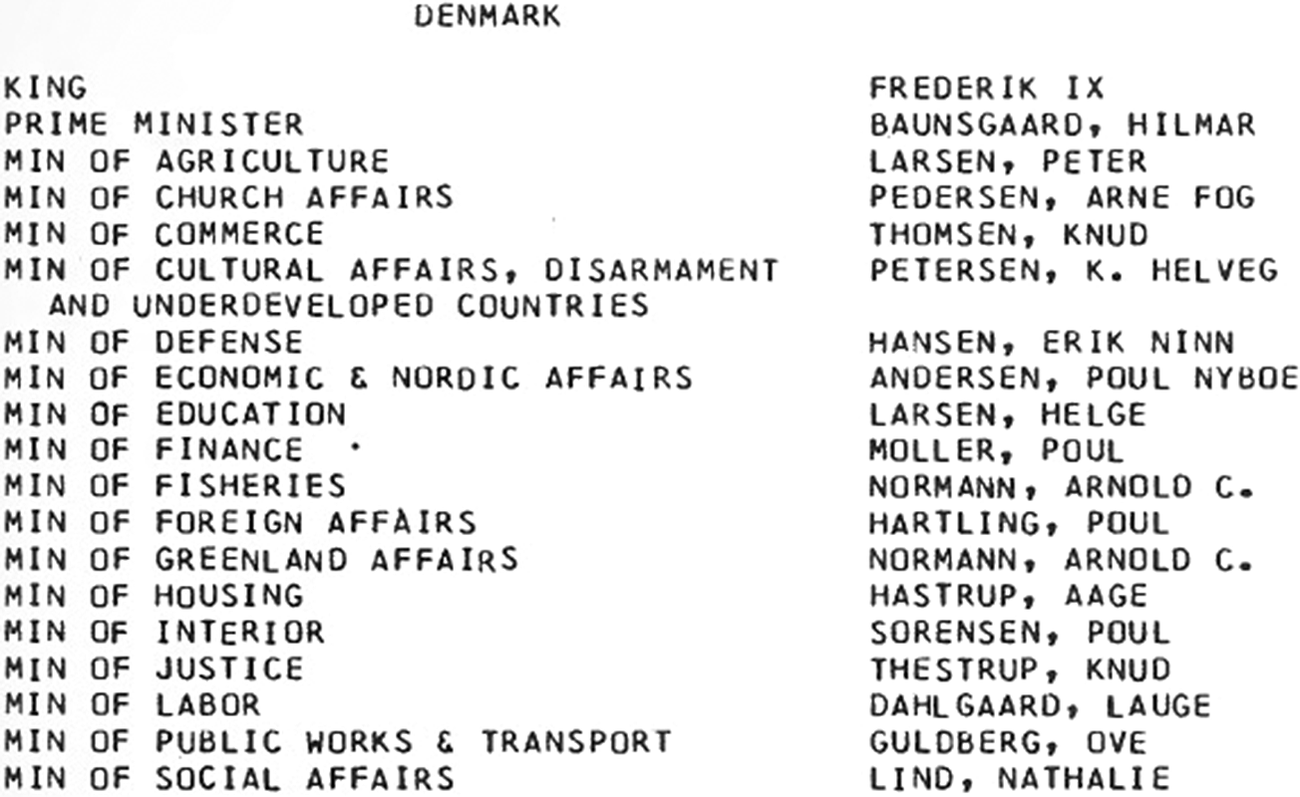
Figure 1 provides an example of the raw data for Denmark in July 1968. The entries are comparable for all countries across all years. To digitize the data, we ran an optical character recognition (OCR) on all the files and developed a script, which turned the original files into digital data files. The script contained a long range of checks, which cleaned the data using matching methods and machine learning.
The Cabinet in Denmark, July 1968

We then proceeded to complete an extensive manual cleaning of the data, which especially focused on ensuring that the same person’s name is spelled consistently across years, enabling researchers to follow the careers of individuals over time. Furthermore, we looked up every person when in doubt about the entry and used alternative biographical information to triangulate the data. All countries were independently checked by an extra person to ensure accuracy. The end product is a list of members of the cabinet for all years in a given country.
The original names for cabinet portfolios are idiosyncratic both across countries and over time. The Chancellor of the Exchequer in the United Kingdom is, for example, equivalent to the Minister of Finance in other countries. We therefore sorted all ministerial positions into 43 different types of portfolios based on the typology put forward in Krook and O’Brien (Reference Krook and O’Brien2012). Some ministers have several different portfolios as a part of their ministry. For example, France in 2003 had a Minister of Youth, National Education, and Research. To account for this, we have included up to four different portfolios to be associated with each minister. Furthermore, we added a classification to every position, making it easy for researchers to distinguish between different groups of governing elites such as full cabinet ministers, junior ministers, presidents, and royals. Lastly, many countries have several ministers covering the same portfolio. For example, Nigeria in 2003 simultaneously had a minister of the navy, a minister of the air-force, a minister for the army, and a general minister of defense. We have therefore singled out the most important portfolios and added a binary variable for whether a person is the minister of finance, the minister of defense, the minister of foreign affairs, or the minister of agriculture. The choices for classifying positions are described further in Appendix H.
We also added the party affiliation and gender for all ministers and year of birth/death for ministers in all OECD, G20, and EU countries plus a handful of other countries.Footnote 5 The party affiliation is time variant and therefore takes into account whether members of the elite change parties. We use the abbreviations from the PartyFacts’ database (Döring and Regel Reference Döring and Regel2019), which allows researchers to merge this dataset with other datasets on parties. The process for adding party affiliation is described in depth in Appendix F.
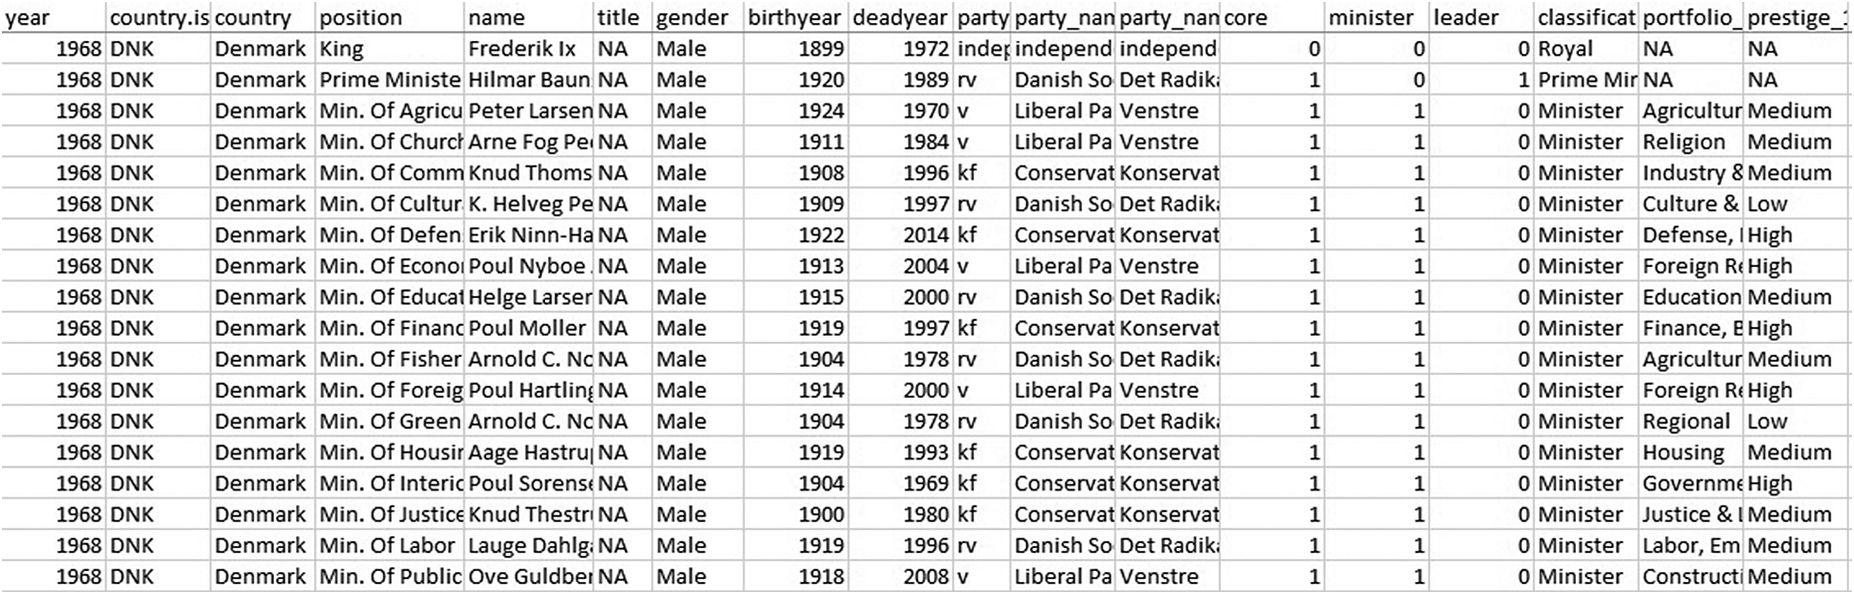
An example of the final output for the raw data in Figure 1 is shown in Figure 2. The final dataset contains 226,662 of such rows.
Final Output for Denmark, July 1968

Based on the detailed dataset, we create a cross-national panel dataset with 8,057 country years. This dataset contains several variables, including, but not limited to, the size of cabinet, number of women, the retention rate for a given year, and the average experience of the cabinet ministers. We have also added information on the leader start/end date based on Archigos (Goemans, Gleditsch, and Chiozza Reference Goemans, Gleditsch and Chiozza2009) and the government start/end date based on Döring and Manow (Reference Döring and Manow2019) and Bértoa (Reference Bértoa2020), enabling researchers to merge WhoGov with these datasets. The full list of variables and how they are coded can be seen in Appendix B. The dataset is incredibly flexible, and it is possible to create many more variables than those we provide in the cross-national panel dataset. Thus, we encourage researchers not to limit themselves to the latter.
Validation
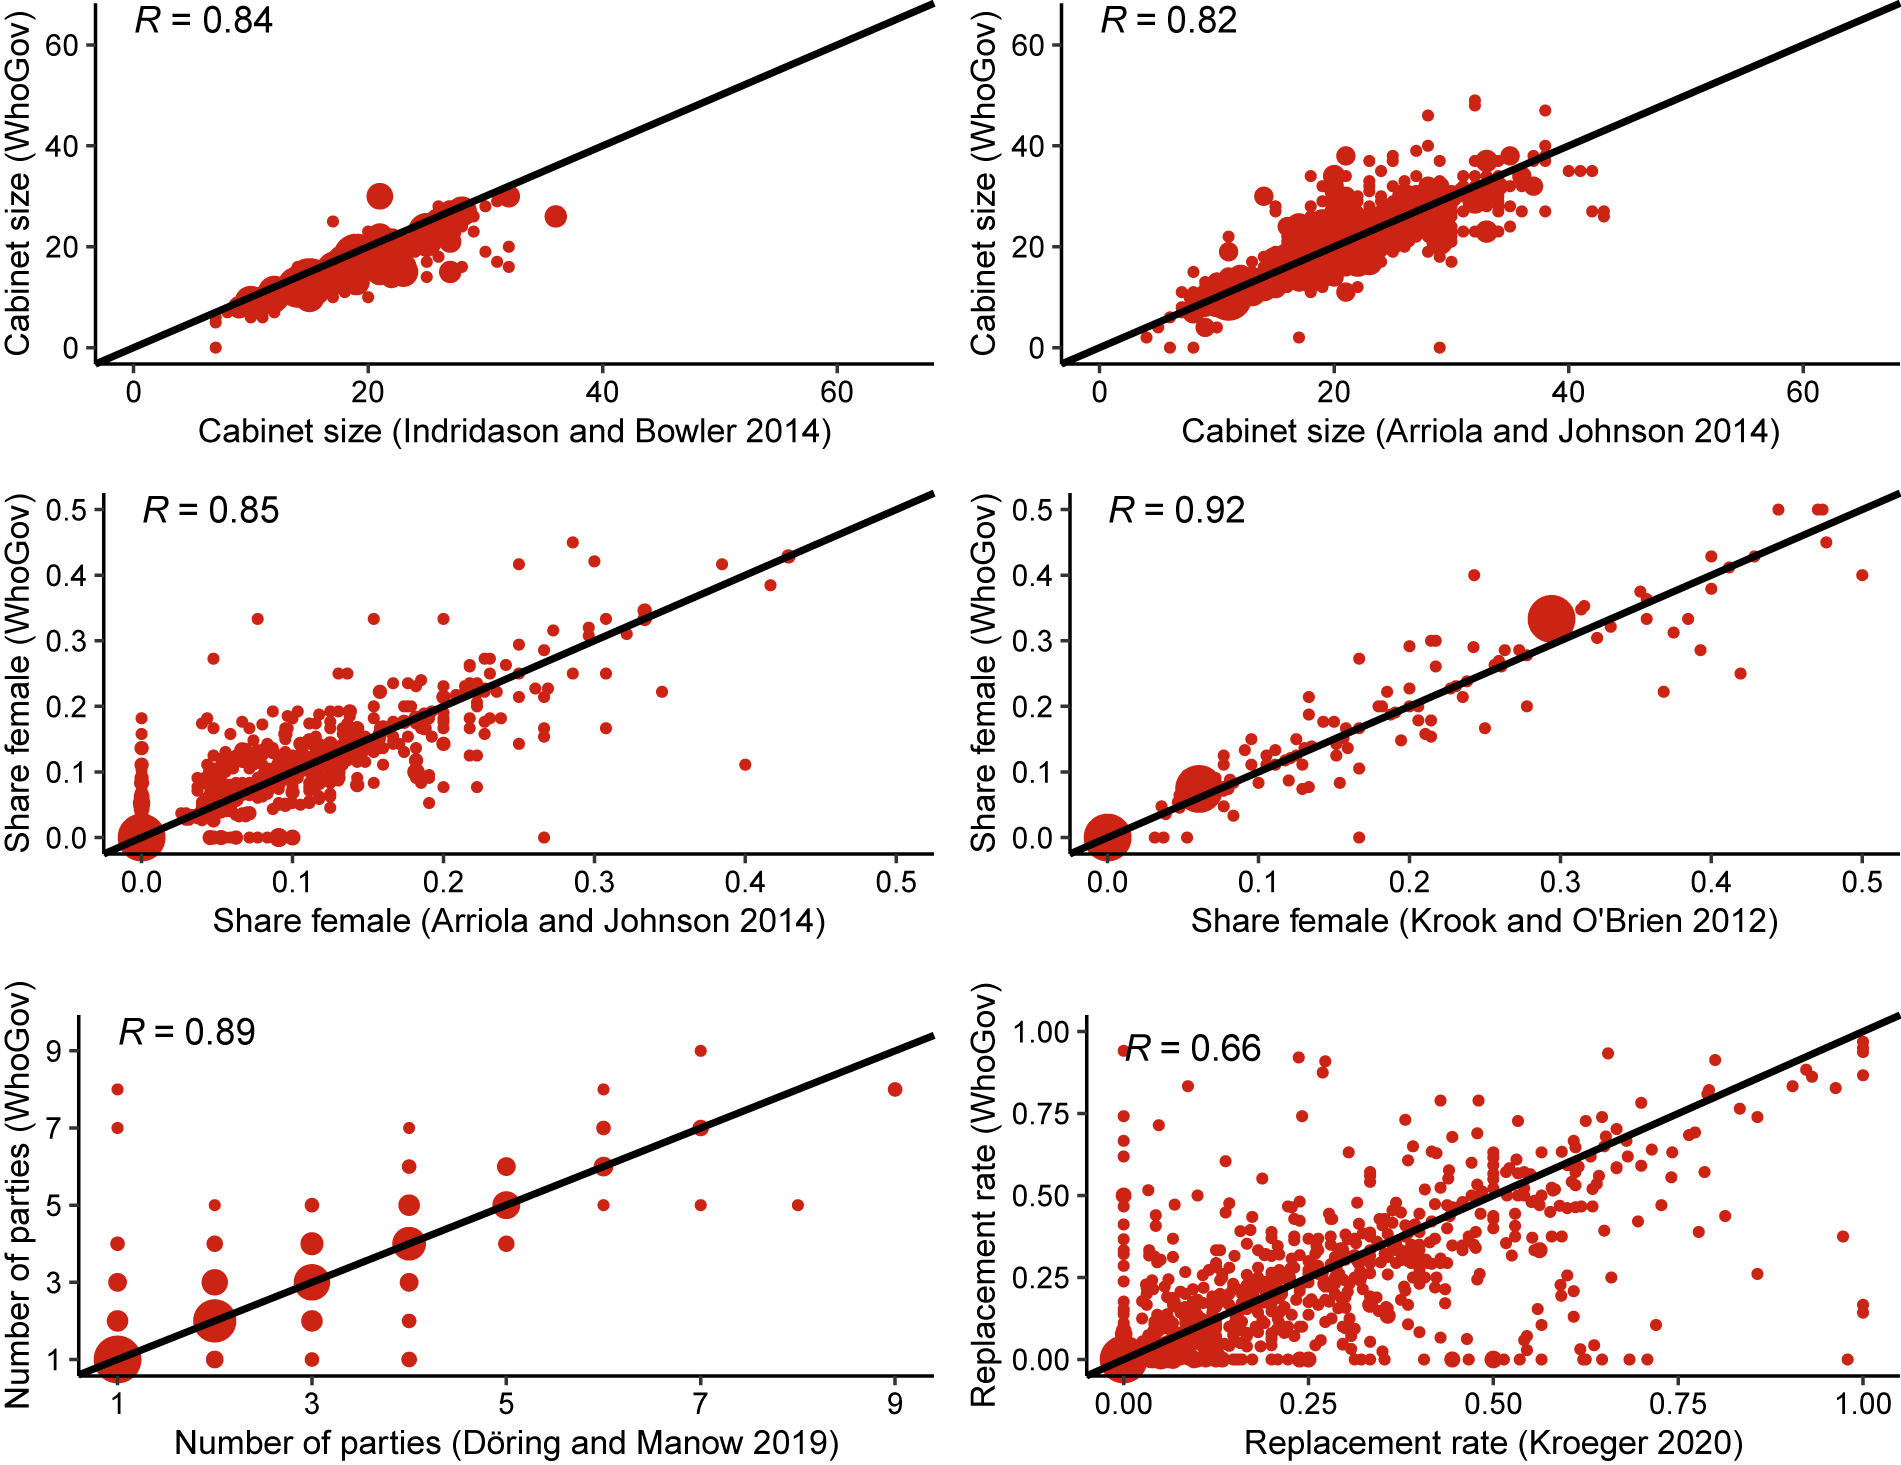
Researchers may reasonably express concerns about the quality of our data given that other datasets are gathered manually, while we primarily rely on automatized methods. To address these concerns we cross-validate the main variables from this dataset against the main variables found in other datasets in Figure 3.
The value of the variable in the validation dataset is shown on the x-axis, while our corresponding value is displayed on the y-axis. In the top panels, we match our measure of cabinet size against Arriola and Johnson’s (Reference Arriola and Johnson2014) data on African ministers (1980–2005) and Indridason and Bowler’s (Reference Indridason and Bowler2014) data on European cabinets (1945–2003). In the middle panels, we compare the share of female ministers derived from our data with Arriola and Johnson (Reference Arriola and Johnson2014) and Krook and O’Brien (Reference Krook and O’Brien2012), which has worldwide coverage for 2009. The bottom panels display our measure of the number of parties against Döring and Manow’s (Reference Döring and Manow2019) data on parliamentary democracies (1966–2016) and Kroeger’s (Reference Kroeger2020) measure of retention rates for African countries (1976–2010).
Two points are worth noting. First, all measures correlate very strongly. Second, the figures highlight some interesting differences from other datasets. The correlation is lowest for Kroeger (Reference Kroeger2020) and Arriola and Johnson (Reference Arriola and Johnson2014). They base their data on the yearly volumes of Europa Publications Limited (1975–2010), which records the composition of cabinets once a year, often at irregular intervals. Instead, we have data for July of every year, which ensures consistency. This can explain the discrepancy, especially for replacement rate, which is highly dependent on when it is measured. The downside is that we do not record the cabinet exactly at the time when a new government enters office, which might be preferred by researchers studying government formation.
Another strength is that we record our data for every minister and then aggregate it. WhoGov contains junior ministers and other members of the elite, which other datasets usually do not include. Most other datasets only present the aggregated data, and we are therefore unable to say with certainty that the same people are included. This may explain some of the discrepancies we see in Figure 3.
Lastly, we tend to include more parties than ParlGov (Döring and Manow Reference Döring and Manow2019). We do so for two reasons. First, we generally separate electoral alliances into parties. An example is the Solidarity Electoral Action in Poland, which we separate into eight different parties. Second, we do not code the governing coalition but the party affiliation of ministers. There are cases, where a minister does not belong to a party in the governing coalition. For example, the Minister for Maori Development in New Zealand is often from one of the parties representing Maori rights, even when the latter are not in the governing coalition.
Cross-Validating the Dataset against Other Datasets

Applications
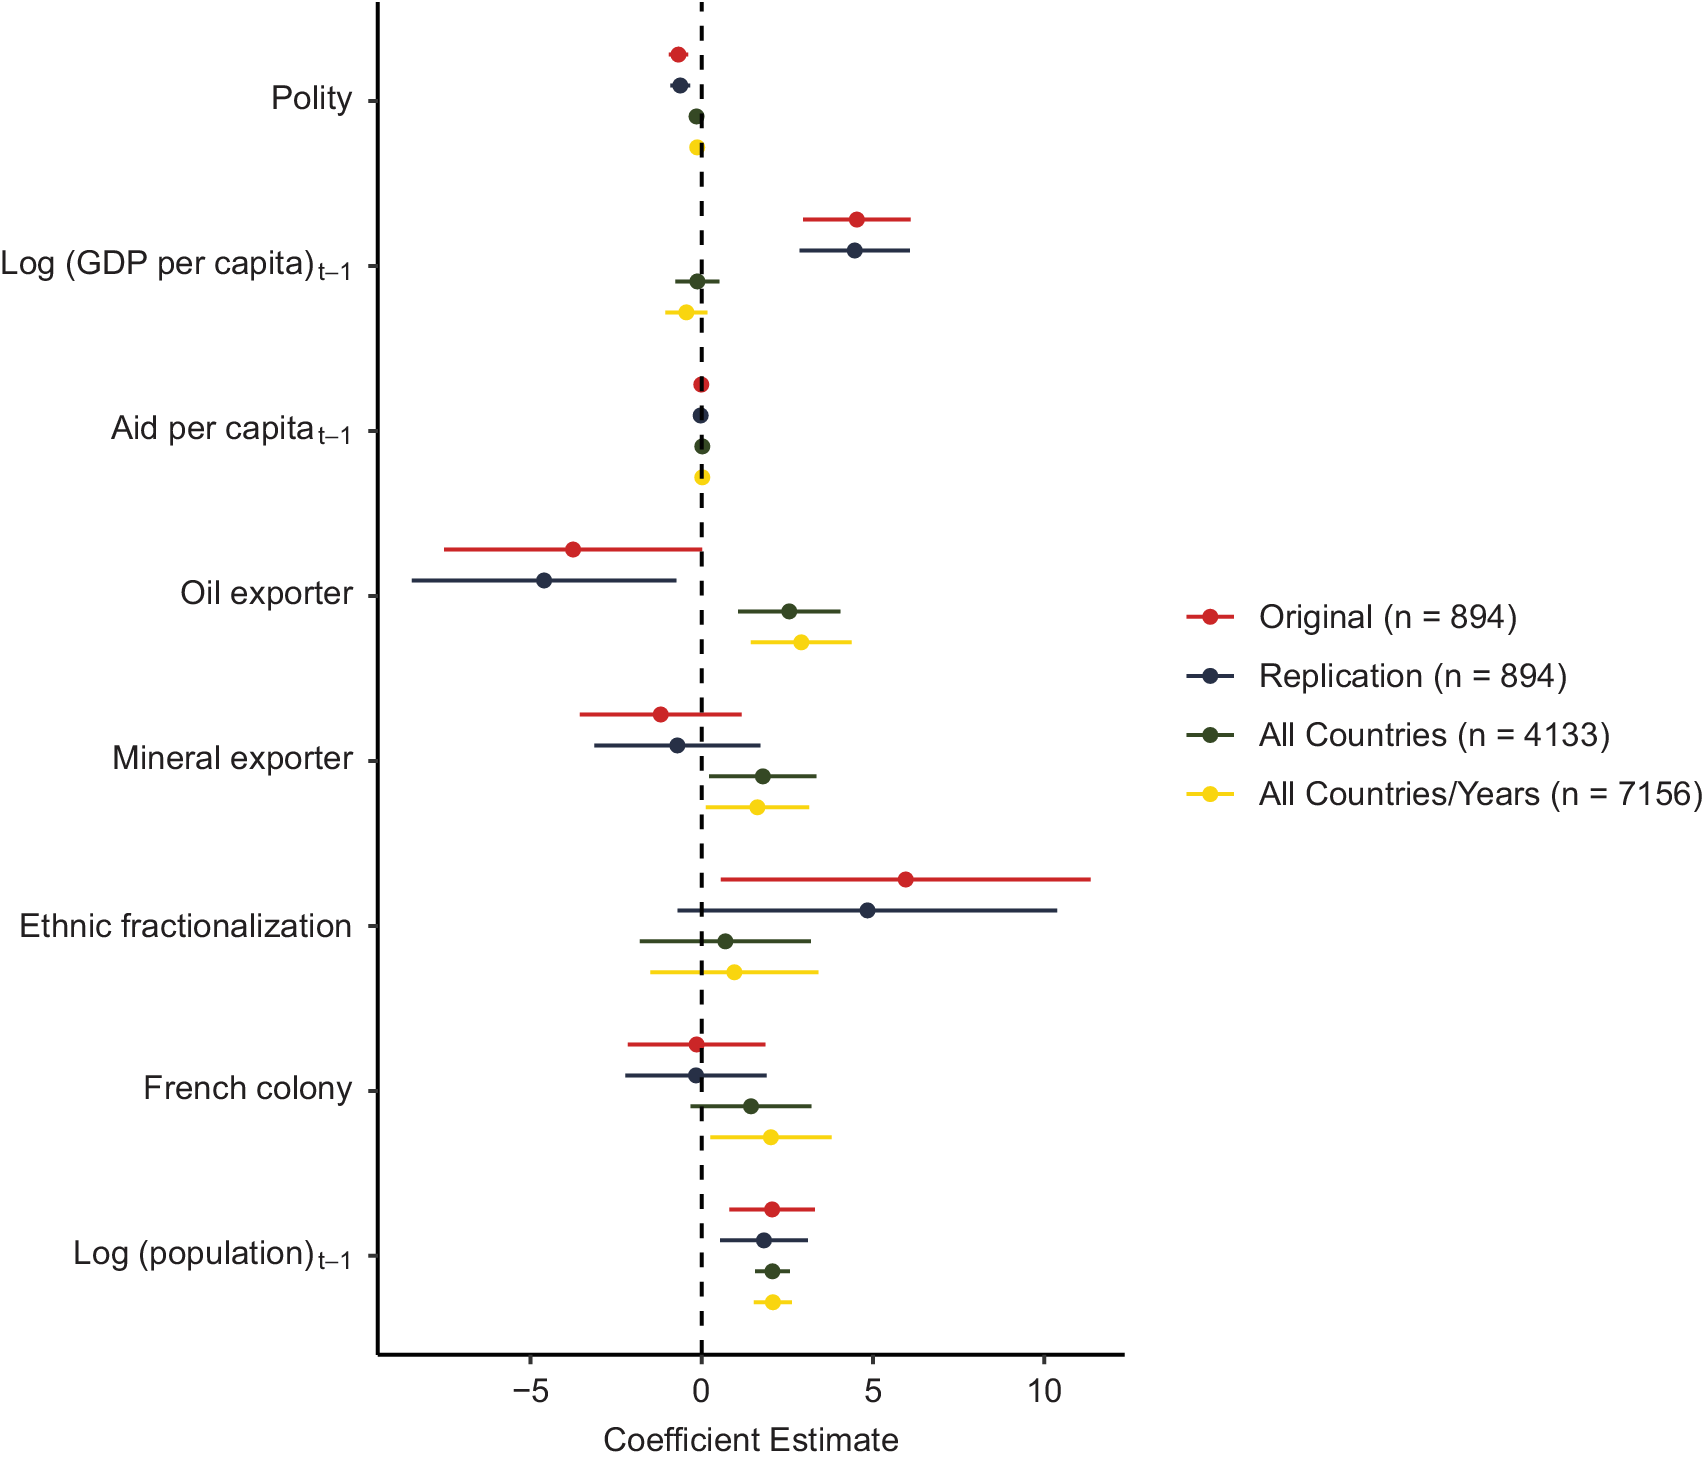
The data can give political scientists a better understanding of important political phenomena.Footnote 6 We demonstrate how our dataset can help advance our knowledge of the determinants of cabinet size by replicating and extending Arriola (Reference Arriola2009).Footnote 7 Arriola argues that African leaders distribute patronage by increasing cabinet size. This insulates them from extra-constitutional challenges to their rule. He finds that countries that are less democratic with higher per capita incomes and more ethnically fractionalized populations have, ceteris paribus, larger cabinets. The results are seen in Figure 4. In the first row, we see the original estimates from Arriola’s study, where he has data on 40 African countries from 1971 to 2001. Using an identical specification, we can closely replicate Arriola’s findings, providing further proof of the validity of the data. This is seen in the second row, where we use our measure of cabinet size as the dependent variable and the same sample as Arriola. In the third row, we include the global sample of countries from WhoGov (1971–2001) and show that the main findings are unique to Africa. Income and ethnic fractionalization are no longer strongly associated with larger cabinets, while higher levels of democracy are not associated with smaller cabinets. In the last specification, we include all years in WhoGov (1966–2016). Overall, the findings indicate that Arriola’s findings, contrary to the claim made in the article, are region specific. Thus, leaders outside of Africa do not use cabinet size as a way to distribute patronage in the same way as African leaders.
Replication and Extension of Arriola (Reference Arriola2009): Regression Analysis of Cabinet Size

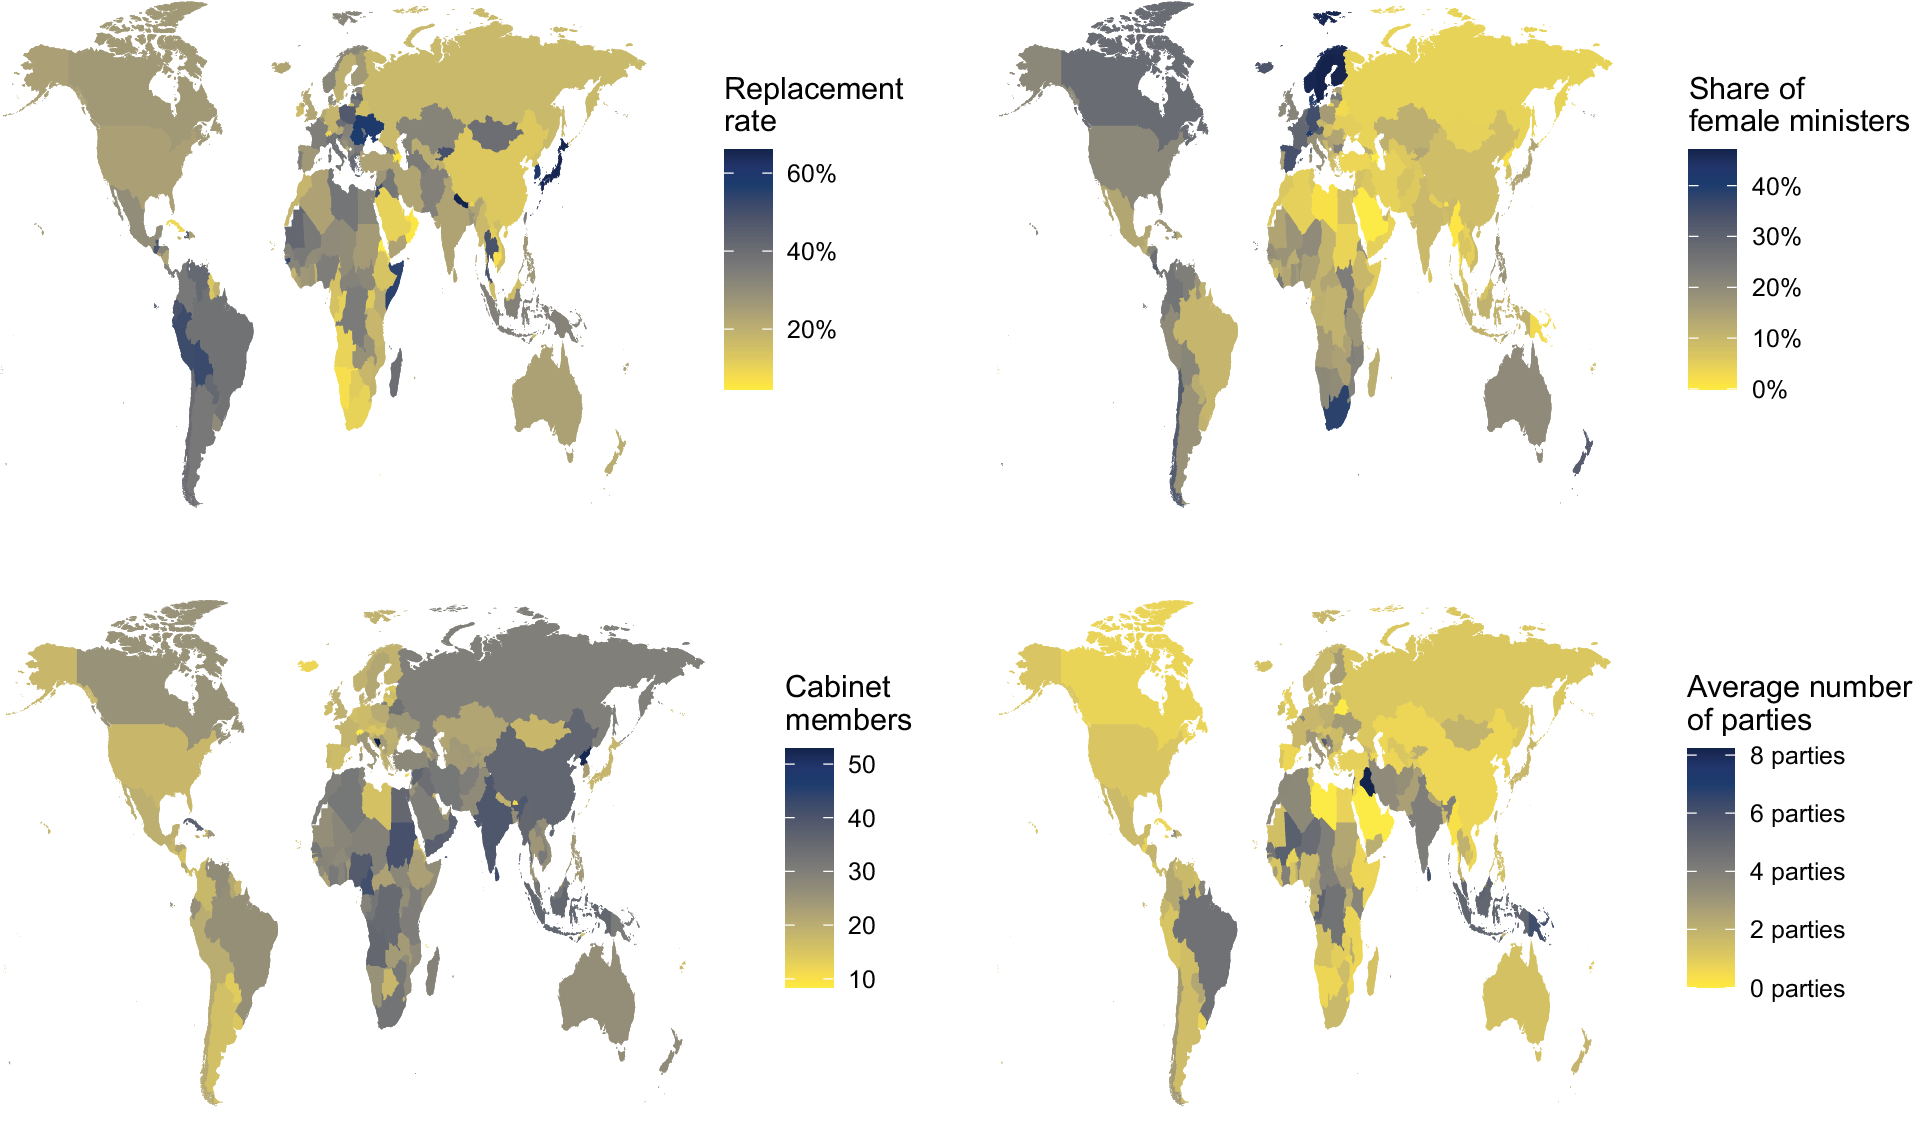
Figure 5 sheds new light on the world map using four of the main variables from WhoGov—namely, the replacement rate, the share of female ministers, cabinet size, and the number of parties in government. The color indicates the average for a given variable for each country in the period 2000–2016. Some of these findings confirm our intuitions. For instance, we see that Scandinavian countries have the most gender equal cabinets, while the cabinet in countries such as Saudi Arabia and North Korea is (almost) exclusively a men’s club. This is in line with previous research (Krook and O’Brien Reference Krook and O’Brien2012; Stockemer Reference Stockemer2017). On the other hand, the fact that many autocracies, such as Iran or Côte d’Ivoire, have many parties represented in the cabinet may come as a surprise. Research on authoritarian countries tends to assume that one party controls the government, which is encapsulated by the term “single-party” regimes (Geddes, Wright, and Frantz Reference Geddes, Wright and Frantz2014; Miller Reference Miller2020).
Country Averages during the Period 2000–2016

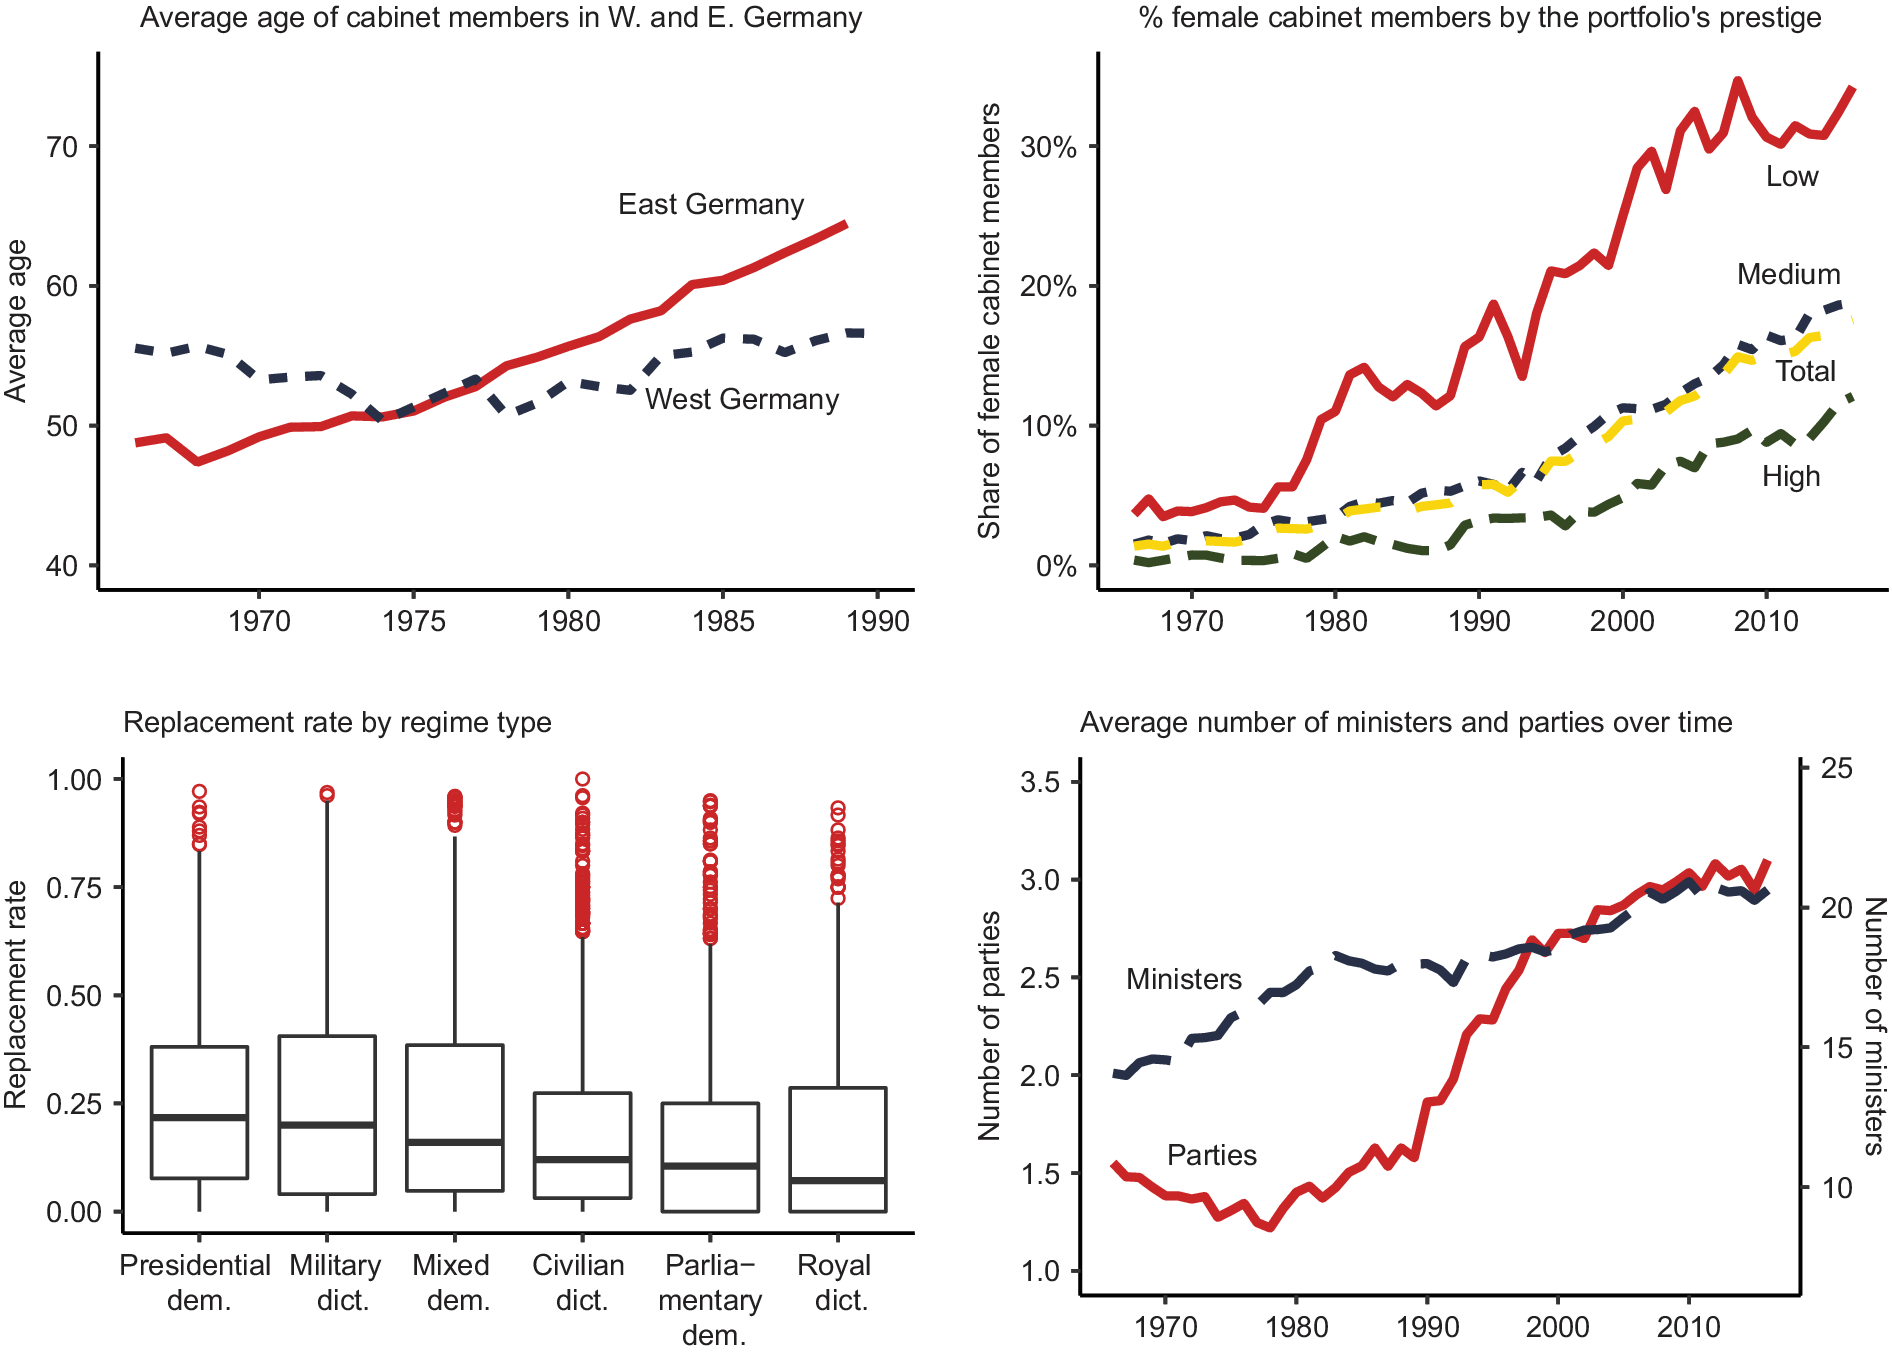
Figure 6 highlights four subfields, where our data is of particular relevance. First, this dataset is the first to contain information on governing elites in a large number of autocracies, and it is therefore a unique tool for researchers focusing on authoritarian politics. In the upper left hand corner, we see that the average age of cabinet members in East Germany increased dramatically over the period, while the age for cabinet members in West Germany stayed fairly constant. The explanation for the increase in East Germany is twofold: cabinet members tend to stay longer and new cabinet members tend to be older, especially towards the last years of the regime. This indicates that autocratic systems with limited competition for power and an entrenched ruling elite risk running out of new, young talent, who can take over, which may be an overlooked explanation for the downfall of autocratic regimes.
Second, there has been a surge in the social science literature on the inclusion of women in government (Arriola and Johnson Reference Arriola and Johnson2014; Barnes and O’Brien Reference Barnes and O’Brien2018; Bego Reference Bego2014; Escobar-Lemmon and Taylor-Robinson Reference Escobar-Lemmon and Taylor-Robinson2005; Jacob, Scherpereel, and Adams Reference Jacob, Scherpereel and Adams2014; Stockemer Reference Stockemer2017). WhoGov is the first, to our knowledge, to offer yearly data on women’s access to executive portfolios globally without sacrificing high cross-sectional, temporal, and portfolio coverage. In the top-right panel, we see that the share of female cabinet ministers has increased over time. In 1966, only one out of 63 cabinet members was female, while in 2016 it is almost one in five. While the trend of women’s representation in government is generally rising, we see that women are over- and under-represented in low and high prestige portfolios, respectively, indicating that solely looking at representation provides an overly optimistic assessment.Footnote 8
Third, there is a canonical literature discussing which type of system provides the most stable form of government (Horowitz Reference Horowitz1990; Lijphart Reference Lijphart2012; Linz Reference Linz1990). While much of the earlier literature approaches this by looking at the replacement of the chief executive or the government, the new data enables us to approach this question from a new perspective by looking at replacement rates, which is the share of cabinet members, who are replaced from one year to the next. The box plot in the bottom-left panel shows the replacement rate by regime type, as classified by Cheibub, Gandhi, and Vreeland (Reference Cheibub, Gandhi and Vreeland2010) and updated by Bjørnskov and Rode (Reference Bjørnskov and Rode2018). We see that presidential systems indeed have the most unstable cabinets, followed by military dictatorships, while parliamentary democracies and royal dictatorships are the most stable. Thus, our data can be used to cast a new light on debates amongst scholars comparing regime types.
Fourth, the dataset will be a useful tool for researchers interested in government and coalition formation. The dataset contains information on party affiliation for the vast majority of cabinet members. In the bottom-right panel we see that cabinets have become larger globally over the last 50 years and that more parties, on average, are represented in government. Governments are thus becoming larger and more complex. This dataset provides a useful tool for future studies attempting to explain the causes and consequences of these patterns.
Four Applications of the Data

Conclusion
We have introduced WhoGov, which is the largest available dataset on members of cabinets. Our dataset covers the period 1966–2016 for 177 countries, and it contains detailed information on cabinet ministers and other members of the ruling elite—including gender, portfolio, and party affiliation—for every country and year in the panel.
The dataset has undergone extensive validation checks to ensure that the information is correct, and we furthermore show that the data closely aligns with the data in existing datasets. As with all datasets, and despite our best efforts, mistakes cannot be ruled out with absolute certainty, and readers are encouraged to contact the authors at whogov@nuffield.ox.ac.uk if they find any.
WhoGov is a unique, new tool for political scientists. We show that the data can be used in diverse fields, ranging from the study of autocracies and gender studies to that of regime types and government formation, but the data has countless more applications. We hope that scholars will embrace this new resource to answer important questions in political science.
Supplementary Materials
To view supplementary material for this article, please visit http://dx.doi.org/10.1017/S0003055420000490.
Replication materials can be found on Dataverse at: https://doi.org/10.7910/DVN/YTRCQE




Comments
No Comments have been published for this article.