Introduction
The issue of how cortex along the rostral border of V2 in primates is organized has been difficult to resolve, and a number of different proposals are currently viable. One popular proposal, put forward by Zeki (Reference Zeki1971) and supported by Gattass et al. (Reference Gattass, Sousa and Gross1988), is that a single visual area, V3, forms most of the rostral border of V2 and gets direct input from V1. This concept has been challenged in two ways. First, Allman and Kaas (Reference Allman and Kaas1975) presented microelectrode mapping data that seemed to support the conclusion that part of the territory of dorsal V3 (V3d), thought to represent only the lower visual quadrant, represented part of the upper visual quadrant instead. Allman and Kaas (Reference Allman and Kaas1975) proposed that this part of the V3 territory was part of a dorsomedial (DM) visual cortical area, that represented both the upper and lower visual quadrants, as a “proper” visual area should (Kaas, 1993a; Zeki, Reference Zeki, Werner and Chalupa2004; Kaas, 2005a). This evidence for the representation of the upper visual quadrant along the dorsal border of V2 has received considerable support from the results of subsequent microelectrode mapping experiments (e.g., Allman et al., Reference Allman, Campbell and McGuinness1979; Krubitzer & Kaas, Reference Krubitzer and Kaas1993) and from studies of the connections of cortex along the border of dorsal V2 (V2d) (e.g., Beck & Kaas, Reference Beck and Kaas1998). From the beginning, this type of evidence was considered to be incompatible with the V3 concept, and it is not easy to dismiss.
The other argument against the V3 concept is based on the conclusion that V1 does not project to the ventral V3 (V3v) territory (e.g., Van Essen et al., Reference Van Essen, Newsome, Maunsell and Bixby1986; Felleman & Van Essen, Reference Felleman and Van Essen1987, Reference Felleman and Van Essen1991; Felleman et al., 1997; Nakamura et al., Reference Nakamura, Le, Wakita, Mikami and Itoh2004). Although the microelectrode mapping data (Gattass et al., Reference Gattass, Sousa and Gross1988) revealed a retinotopic organization that is highly compatible with the proposed organization of V3v, direct projections from V1 to V3v are expected from the Zeki (Reference Zeki1971) proposal. Instead, the V3v region was considered to be either a different visual area, the ventral posterior (VP) area (Newsome et al., Reference Newsome, Maunsell and Van Essen1986), with the improbable feature of representing only the upper visual quadrant, or part of a complete visual area with an unknown other half. Other data from related studies on neuron response properties were interpreted as further evidence that the V3d region and the V3v region are not parts of the same visual area (Burkhalter & Van Essen, Reference Burkhalter and Van Essen1986; Burkhalter et al., Reference Burkhalter, Felleman, Newsome and Van Essen1986; Felleman & Van Essen, Reference Felleman and Van Essen1987). Thus VP and V3d were considered to be different visual areas representing only one visual quadrant, the upper (VP), or the lower (V3d) visual quadrant. This argument against the V3 concept has now been dismissed, at least in our minds, by recent and compelling evidence that V1 projects in a similar magnitude and in the expected retinotopic pattern, to both V3d and to V3v (or VP) (Lyon & Kaas, Reference Lyon and Kaas2001; 2002a,Reference Lyon and Kaasb,Reference Lyon and Kaasc). Uncertainties about the areal locations of recorded neurons in single unit studies, as well as procedural differences, allow a reconsideration of the proposed differences in the response properties of neuron populations in V3d and VP (V3v), but the evidence for part of an upper visual quadrant representation along the rostral border of V2d continues to be supported by more recent evidence.
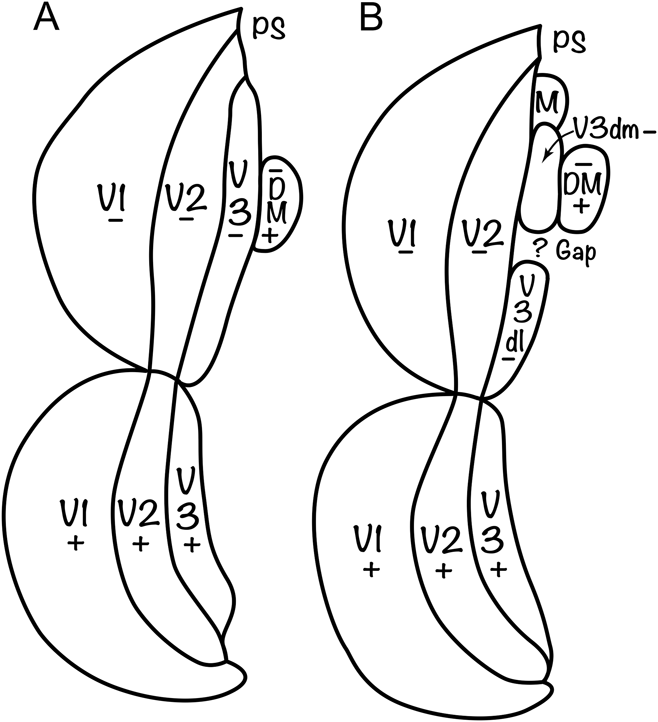
Here, we consider the evidence for V3 and the various proposals for cortical organization in the V3 territory in more detail and suggest instead that V3d is not continuous but has a gap or hole in which part of the upper visual quadrant is represented (Fig. 1). Such a gap could account for much of the conflicting microelectrode mapping and connectional data. The gap may be an intrusion of part of some visual area other than DM, and the gap may or may not be present in all primate taxa. There is, yet, no comparable evidence for a gap in V3v. We propose that the collective evidence is most compatible with the concept of a complete V3 with dorsal and ventral halves, as originally proposed by Zeki (1969, Reference Zeki1971) and Gattass et al. (Reference Gattass, Sousa and Gross1988) on connectional and mapping evidence, with the likelihood of a gap in V3d of at least some and perhaps all primates. DM remains as a complete visual area just rostral to V3d. We review evidence in support of this proposal, while recognizing that additional evidence may be gathered that would further support this or alternative proposals.
Two proposals for the organization of the V3 territory in primates. The schematics illustrate flattened cortex with V1 split along the zero horizontal meridian representation to fit a flat map. DM cortex is upper and lateroventral cortex is lower, with caudal to the left. (A) The organization proposed by Zeki (Reference Zeki1969) and supported by the studies of Gattass et al. (Reference Gattass, Sousa and Gross1988) and those of Lyon and Kaas (Reference Lyon and Kaas2001; 2002a,Reference Lyon and Kaasb,Reference Lyon and Kaasc) with the addition of the DM visual area (Allman & Kaas, Reference Allman and Kaas1975). (B) An alternative proposal for the organization of the V3 territory that accounts for the evidence for two representations of the upper visual quadrant near or along the rostral border of V2, the medial visual area, M (Allman & Kaas, Reference Allman and Kaas1976) and a possible gap or discontinuity in V3d. Thus, V3d is divided into DM (V3dm) and dorsolateral (V3dl) components. A similar alternative has been illustrated by Rosa et al. (Reference Rosa, Palmer, Gamberini, Tweedale, Pinon and Bourne2005).

Evidence for V3
The concept of a third visual area, V3, in primates reflects a long history. Brodmann (Reference Brodmann1909) portrayed three visual areas in the occipital cortex of primates, a primary area 17, and two bordering and nearly surrounding band-like areas, area 18 and area 19. Other investigators were proposing two or three visual areas about the same time (see Kaas, Reference Kaas, Rockland, Kaas and Peters1997 for review). For example, von Economo (Reference von Economo1929) divided occipital cortex of humans into occipital areas OC (area 17), OB, and OA, and later, Konorski (Reference Konorski1967) labeled the early visual areas VI, VII, and VIII. Three architectonic visual areas, 17, 18, and 19, had also been proposed for cats (Otsuka & Hassler, Reference Otsuka and Hassler1962), and Hubel and Wiesel (Reference Hubel and Wiesel1965) provided microelectrode mapping evidence for areas 17, 18, and 19 of cats, corresponding to retinotopic representations, VI, VII, and VIII (or more commonly today, V1, V2, and V3). Others provided further supporting evidence for these three visual areas in cats from more extensive microelectrode mapping (e.g., Tusa et al., Reference Tusa, Rosenquist and Palmer1979) and patterns of cortical connections (e.g., Wilson, Reference Wilson1968). Myers (Reference Myers and Ettlinger1965) was one of the first to use patterns of cortical connections in macaque monkeys to subdivide occipital cortex, but his complex summary diagram had little subsequent influence. Soon, thereafter, on the basis of area 17 (V1) connections, Cragg (Reference Cragg1969) identified two extrastriate targets as VII and VIII, while Zeki (Reference Zeki1969) presented his similar results in terms of areas 18 and 19. The areas 18 and 19 of Zeki did not correspond very well with the architectonic fields 18 and 19 of Brodmann (1909), and the terms V1, V2, and V3 were subsequently used (Zeki, Reference Zeki1971). For the most part, the connections of V1 in subsequent studies in monkeys were interpreted as being with V2 and V3, or areas 18 and 19 (e.g., Rockland & Pandya, Reference Rockland and Pandya1979; Perkel et al., Reference Perkel, Bullier and Kennedy1986; however, see Spatz & Tigges, Reference Spatz and Tigges1972).
Such early anatomical evidence for V3 was, however, incomplete, allowing for other interpretations of visual cortex organization. As the part of V1 (area 17) that is available on the dorsal surface of occipital cortex for study represents central and paracentral vision of the lower visual quadrant, the connections of V1 that were revealed in studies were mostly to the dorsal half of V3 that also represents the lower visual quadrant, and not the territory of V3v that represents the upper visual quadrant (see Lyon & Connolly, Reference Lyon and Connolly2012). This lack of evidence on ventral V1 connections led to the conclusion that the territory of V3v does not receive projections from V1, while the territory of V3d does receive V1 projections. For this reason, together with proposed differences in cortical architectonics (Van Essen et al., Reference Van Essen, Newsome, Maunsell and Bixby1986; Rottschy et al., Reference Rottschy, Eickhoff, Schleicher, Mohiberg, Kujovic, Zilles and Amunts2007), single neuron response properties (Burkhalter & Van Essen, Reference Burkhalter and Van Essen1986; Burkhalter et al., Reference Burkhalter, Felleman, Newsome and Van Essen1986) and functional magnetic resonance imaging responsiveness (Tootell et al., Reference Tootell, Nelissen, Vanduffel and Orban2004) in V3d and V3v regions, the territory of V3v was reidentified as the VP area. The term VP emerged from unpublished microelectrode mapping studies of Allman and Kaas, which revealed a retinotopy consistent with V3v. The term, VP was subsequently used with the earlier mapping evidence from owl monkeys by Newsome & Allman (Reference Newsome and Allman1980). However, the concept of VP and V3d as separate visual areas, with VP representing only the upper visual field, and V3d only the lower visual field, seemed improbable to some (Kaas, 1993b; Zeki, Reference Zeki, Werner and Chalupa2004), and other proposals emerged, including the concept that different parts of the territory of V3d are subsumed within several visual areas, DM, DI, and M (e.g., Allman & Kaas, Reference Allman and Kaas1975), or that VP continues onto the dorsal surface of the cerebral hemisphere to form a somewhat smaller representation of the lower visual quadrant (e.g., Rosa et al., Reference Rosa, Palmer, Gamberini, Tweedale, Pinon and Bourne2005). As this issue of cortical organization has not been fully resolved, some depictions of visual cortex organization in macaques and humans continue to illustrate a ventral VP and a V3d (e.g., Grill-Spector & Malach, Reference Grill-Spector and Malach2004; Rottschy et al., Reference Rottschy, Eickhoff, Schleicher, Mohiberg, Kujovic, Zilles and Amunts2007), while others include a V3d and V3v (e.g., Brewer et al., Reference Brewer, Press, Logothetis and Wandell2002; Vanduffel et al., Reference Vanduffel, Zhu and Orban2014).
The concept of VP requires reconsideration, as there is now compelling evidence that both the V3v/VP territory and the V3d territory have interconnections with V1 in topographical patterns that conform to the proposed retinotopies of V1, V3v, and V3d. Such patterns of connections have been revealed for macaque monkeys (Lyon & Kaas, 2002b), four species of New World monkeys (Lyon & Kaas, 2002c) (Lyon & Kaas, 2002c), and a prosimian primate (Lyon & Kaas, 2002a). Such injections of tracers in various retinotopic locations in V1 produced dense foci of labeled neurons (and axon terminals, depending on the tracer) in retinotopically matched locations in V2 and a corresponding retinotopic location in V3d or V3v. Less dense foci of labeled neurons and axon terminals were consistently found in the middle temporal visual area, MT, and the DM visual area. The labeled foci for V3v and V3d were similar in magnitude, but clearly less in magnitude than those in V2. The same injections produced somewhat smaller magnitudes of label in MT and even less in DM. These results provide strong evidence that V3v and V3d receive similar inputs from V1, and that together, they constitute a complete representation of the contralateral visual hemifield. In addition, the foci of label in the DM region seem to reflect a complete representation without any involvement of the territory of V3d, as injections separately labeled the DM and V3 regions, as well as MT. Finally, there is no evidence from these studies that prosimian primates, New World monkeys, and Old World monkeys differ in any major way in having or not having a complete V3 representation. These three areas appear to be basic to the primate visual system, as there is considerable retinotopic fMRI imaging evidence for the existence of V1, V2, and V3 in the visual cortex of humans (e.g., Larsson & Heeger, Reference Larsson and Heeger2006; Abdollahi et al., Reference Abdollahi, Kolter, Glasser, Robinson, Coalson, Dierker, Joenkinson, Van Essen and Orban2014; Vanduffel et al., Reference Vanduffel, Zhu and Orban2014).
While any theory of visual cortex organization in primates will need to account for the anatomical observations on V1 connections, it remains important to account for the proposed differences in the single neuron response properties of neurons and in cortical architecture for the V3v and V3d region. Previously, we have suggested that such observations may be unreliable because of uncertainties that recordings were completely from equivalent parts of V3d and V3v, or were restricted to V3d or V3v (Kaas & Lyon, Reference Kaas and Lyon2001; Kaas, 2005b; Lyon, 2013; Lyon & Connolly, Reference Lyon and Connolly2012). It is also the case that the proposed modular organization of V3 (Lyon & Kaas, Reference Lyon and Kaas2001; Xu et al., Reference Xu, Bosking, Sary, Stefansic, Shima and Casagrande2004; Fan et al., Reference Fan, Baldwin, Jermakowicz, Casagrande, Kaas and Roe2012) could bias recording results by favoring one type of module over another and could influence the architectonic description of the V3 territory. But real differences in response properties of neurons in V3v and V3d, and cortical architecture, could exist, possibly reflecting the different requirements of upper field and lower field vision (Previc, Reference Previc1990) or forcing another interpretation of visual cortex organization (see below). There may be architectonic differences in V3d and V3v as well, but there is little agreement on this (Lyon & Kaas, Reference Lyon and Kaas2001; see; Lyon & Connolly, Reference Lyon and Connolly2012). For example, in characterizing neurofilament protein patterns, Hof and Morrison (Reference Hof and Morrison1995) concluded that “there was no difference between the staining patterns of the dorsal and the ventral parts of area V3”. We now consider the other strong evidence for V3 as a single complete visual area.
Microelectrode mapping and functional imaging evidence for V3
The other impressive evidence for a V3 with a systematic representation of the complete visual hemifield, in primates, stems from the early microelectrode mapping of V3 in macaques by Gattass et al. (Reference Gattass, Sousa and Gross1988); (see Rosa et al., Reference Rosa, Piñon, Gattass and Sousa2000 for New World Cebus monkeys). Gattass et al. (Reference Gattass, Sousa and Gross1988) revealed a single overall representation of the contralateral visual hemifield in V3, split along the representation of the horizontal meridian, from peripheral vision of the lower visual quadrant to foveal vision, and then to peripheral vision of the upper visual quadrant in a sequence of recording sites from DM cortex to dorsolateral cortex to ventromedial cortex in parallel but with a mirror reversal of the retinotopy of V2. A similar organization for V3 has been demonstrated repeatedly with fMRI techniques in monkeys and humans (e.g., Tootell et al., Reference Tootell, Mendola, Hadjikani, Ledden, Liu, Reppas, Sereno and Dale1997; Brewer et al., Reference Brewer, Press, Logothetis and Wandell2002; Wade et al., Reference Wade, Brewer, Rieger and Wandell2002; Orban et al., Reference Orban, Van Essen and Vanduffel2004; Kolster et al., Reference Kolster, Mandeville, Arsenault, Ekstrom, Wald and Vanduffel2009; Kolster et al., Reference Kolster, Peeters and Orban2010; Vanduffel et al., Reference Vanduffel, Zhu and Orban2014), and other microelectrode mapping results in monkeys have been consistent with the proposed organization of V3v (Newsome & Allman, Reference Newsome and Allman1980; Newsome et al., Reference Newsome, Maunsell and Van Essen1986; Rosa & Tweedale, Reference Rosa and Tweedale2000). In addition, the expected retinotopy of V3d has been revealed in optical imaging studies of V3d organization in prosimian galagos (Fan et al., Reference Fan, Baldwin, Jermakowicz, Casagrande, Kaas and Roe2012) and New World owl monkeys (Lyon et al., Reference Lyon, Xu, Casagrande, Stefansic, Shima and Kaas2002; Kaskan et al., Reference Kaskan, Lu, Dillenburger, Kaas and Roe2009), where V3d is exposed on the dorsal surface of the brain. However, most of the recent, alternative proposals for the organization of visual cortex in primates have been concerned with cortex in the V3d region, where there is microelectrode mapping and connectional evidence for some of the rostral border region of V2 being directly adjoined by part or parts of the representation of the upper visual quadrant, not the lower visual quadrant, as proposed for V3d. It is this evidence that we consider next.
Microelectrode recording and anatomical evidence for one or more upper visual quadrant representations along the V2d rostral border
In an early microelectrode mapping study of visual cortex organization in owl monkeys, Allman and Kaas (Reference Allman and Kaas1975) found evidence for both representations of parts of the upper and lower visual quadrant in the cortex just rostral to V2d. The upper and lower quadrant representations were combined to define a new visual area, the DM visual area, which has been subjected to considerable further study (e.g., Krubitzer & Kaas, Reference Krubitzer and Kaas1993; Beck & Kaas, Reference Beck and Kaas1998; Beck & Kaas, Reference Beck and Kaas1999; Rosa & Tweedale, Reference Rosa and Tweedale2005; Rosa et al., Reference Rosa, Palmer, Gamberini, Tweedale, Pinon and Bourne2005; Lui et al., Reference Lui, Bourne and Rosa2006; Rosa et al., Reference Rosa, Palmer, Gamberini, Berman, Yu, Reser, Bourne, Tweedale and Galletti2009). More medially in cortex rostral to V2d and extending onto the medial wall of the cerebral hemisphere, Allman & Kaas (Reference Allman and Kaas1976) provided evidence for a second representation of the upper visual quadrant as part of another complete representation, the medial visual area (M), an area in the relative location of what is likely the same visual area in macaques (Colby et al., Reference Colby, Gattass, Olson and Gross1988) and Cebus monkeys (Sousa et al., Reference Sousa, Piñon, Gattass and Rosa1991; Neuenschwander et al., Reference Neuenschwander, Gattass, Sousa and Piñon1994) renamed the parieto-occipital area. Other microelectrode mapping studies have found evidence for the representation of parts of the upper visual quadrant along the rostral border of V2 in marmosets (e.g., Rosa & Schmid, Reference Rosa and Schmid1995; Rosa & Tweedale, Reference Rosa and Tweedale2001; Rosa et al., Reference Rosa, Palmer, Gamberini, Tweedale, Pinon and Bourne2005), and this led to proposals for various arrangements of visual areas along the border of V2d, including DM (also see, Jeffs et al., Reference Jeffs, Federer, Ichida and Angelucci2013). Microelectrode recordings just rostral to V2d in prosimian galagos also revealed evidence for a representation of part of the upper visual quadrant in the territory of V3d (Allman et al., Reference Allman, Campbell and McGuinness1979; Rosa et al., Reference Rosa, Casagrande, Preuss and Kaas1997). Although some of these results may reflect recordings rostral to V3d (For review, see Lyon & Connolly, Reference Lyon and Connolly2012), it is difficult to dismiss all of these observations.
In addition to this physiological evidence, the existence of an upper quadrant representation along the rostral border of V2d is supported by evidence from studies of cortical connections. Injections of tracers near the proposed V2/V3 border or in the proposed territory of V3 sometimes reveal connections that differ from those expected for V3d, especially those with parts of V1, V2, and other visual areas representing the upper visual quadrant. (e.g., Krubitzer & Kaas, Reference Krubitzer and Kaas1990, Reference Krubitzer and Kaas1993; Beck & Kaas, Reference Beck and Kaas1998; Rosa et al., Reference Rosa, Palmer, Gamberini, Tweedale, Pinon and Bourne2005; Jeffs et al., Reference Jeffs, Federer, Ichida and Angelucci2013). Other injections in the V3d territory next to V2d, but attributed to DM, reveal patterns of connections with V2d and V1 that are highly consistent with the V3d concept (discussed in Lyon, 2013; also see Fig. 2). The difficulty in accurately identifying the rostral border of V2 and the width of V3, adds to the problem of interpreting such results. Additionally, cortex along the rostral border of V2d represents the region of the horizontal meridian, including a narrow strip of the upper visual quadrant (Jeffs et al., Reference Jeffs, Federer, Ichida and Angelucci2013). Thus, injections in V3d that include the V2d/V3d border zone could label neurons in the V2v/V3v border zone, as well as other places, and such patterns of label could be taken for evidence of a more extensive upper quadrant representation along the rostral border of V2d. Nevertheless, the possibility that some of these injections are revealing a representation of a large part of the upper visual quadrant next to part of V2d should be seriously considered.
Connections of V3d in an owl monkey. The locations of V3d borders are estimated from previous results (Lyon & Kaas, 2002c). While the borders of V3d are somewhat uncertain, the position of the injection site is in the expected location relative to the clear V1/V2 border, and the connection pattern with V2 and V1 is in the expected lower quadrant representation. Cortex has been flattened and cut parallel to the surface. DLc and DLr are proposed caudal and rostral subdivisions of the dorsolateral visual area, also known as V4. MTc, MST, and FST are proposed subdivisions of the MT complex (Kaas, 2005a). VPP and LPP are proposed regions of posterior parietal cortex. IT, inferior temporal cortex. See Lyon and Kaas (2002c) for details. Previously unpublished results from Lyon and Kaas (2002c).

Does V3d have a gap?
We are left with results that seem to support conflicting schemes of visual cortex organization. Earlier proposals argued that the territories of V3d and V3v formed complementary representations of the upper and lower visual quadrants or interpreted the ventral and dorsal territories of V3 as parts of two visual areas, V3d and VP. This controversy now seems to have been resolved in favor of V3v over VP. Thus, Abdollahi et al. (Reference Abdollahi, Kolter, Glasser, Robinson, Coalson, Dierker, Joenkinson, Van Essen and Orban2014) have recently concluded that “V3d and V3v are now widely regarded as subdivisions of a single retinotopic area”. Nevertheless, the previously well-accepted concept of V3d remains in question. Attempts to resolve differences in interpretations and accommodate contradictory results have included renaming VP as VLP and extending VLP dorsally to include much of the territory of V3d, thereby forming a visual area with representations of both the upper and lower visual quadrants (Rosa & Tweedale, Reference Rosa and Tweedale2000; Reference Rosa and Tweedale2005). Other similar proposals have been made to accommodate the proposed locations of upper visual quadrant representations along the rostral border of V2d (Jeffs et al., Reference Jeffs, Federer, Ichida and Angelucci2013). Our alternate approach is to retain the overall concept of V3d but with a gap for part of an upper quadrant representation in the middle of V3d (Fig. 1) and at another location at the DM tip of V3d for area M.
Our recent optical imaging and microelectrode mapping study provided more evidence for V3d in prosimian galagos (Fan et al., Reference Fan, Baldwin, Jermakowicz, Casagrande, Kaas and Roe2012), while possibly allowing for such a gap. The optical imaging mapping results revealed the expected retinotopic organization of V3d, with a seemingly modular organization of orientation selective or nonselective neurons. Visual stimuli that were effective when placed in the lower visual quadrant were completely ineffective in the upper visual quadrant in activating cortex we defined as V1d, V2d, and V3d, including the possible gap region of V3d. In addition, a 100-electrode array with equally spaced electrodes was used to simultaneously record from neurons in fixed positions across V1, V2, and V3 in a strip of dorsal visual cortex as the neurons were activated by various visual stimuli. As expected, recordings from each of the three visual areas were clearly distinguished by receptive field locations and sizes, so that the receptive fields were smallest in V1 and largest in V3. All of the neurons in the sampled region of dorsal cortex had receptive fields in the lower visual quadrant, although some of the large receptive fields for neurons in the proposed V3 territory extended slightly past the zero horizontal meridian into the upper visual quadrant. These results provided further evidence for a V3d, adjoining V2, but no direct evidence for a representation of the upper visual quadrant in cortex next to V2d. However, the complete border region of V2d was not investigated with the 100-electrode array, and a gap in V3d could have been missed. Overall, the results based on injections in V1 and these other mapping results based on optical imaging or microelectrode recordings lead us to propose that V3v (VP) and V3d are closely matching parts of a single visual area, V3, as proposed by Zeki (Reference Zeki1969) and Gattass et al. (Reference Gattass, Sousa and Gross1988). Yet, it also seems possible that the data reviewed in support of V3d are compatible with some of the data that argue for one or more upper visual quadrant representations extending near or to the rostral V2d border. Thus, we consider modifications of the V3d concept that are compatible with the overall V3 concept while allowing for discontinuities in V3d.
One further argument for V3 is the evidence that sensory areas in general tend to have congruent borders (e.g., Grill-Spector & Malach, Reference Grill-Spector and Malach2004). Thus, receptive fields for neurons near the border between adjoining areas are similar in location on the sensory receptor surface. The reasons for this are unclear, but one area may serve as a template for the development of others, with the added benefit of allowing shorter interconnections (Van Essen, Reference Van Essen1997). Whatever the reason, V3 thereby forms the expected representation along the V2 border with a reversal retinotopy. Because of similar constraints, a similar V3 may have evolved independently in carnivores and primates and perhaps other taxa (Rosa & Manger, Reference Rosa and Manger2005). Yet, a progression in representation from the lower visual quadrant of V2 into the upper visual quadrant in the territory of V3d would seem to be a possible alternative, as the rostral border of V2 represents the horizontal meridian that separates the lower and upper quadrants, and the border zone of V3 and V2 already represents parts of the upper and lower quadrant along the horizontal meridian (Jeffs et al., Reference Jeffs, Federer, Ichida and Angelucci2013). The argument against the V3d concept is based on the evidence for a gap or disruption in V3d by the intrusion of the representation of part of the upper visual quadrant, possibly as part of DM or some other visual area, or even as a separated fragment of a representation. In addition, there is good evidence for the visual area M, at the medial end of V3d that has an upper quadrant representation next to V2d (Allman & Kaas, Reference Allman and Kaas1976). A small disruption or gap in V3d would not necessarily be apparent in studies of V1 projections to V3, and such a gap might not be obvious in the retinotopy of V3d as revealed by optical imaging due to the modular organization of V3d (Lyon et al., Reference Lyon, Xu, Casagrande, Stefansic, Shima and Kaas2002; Xu et al., Reference Xu, Bosking, Sary, Stefansic, Shima and Casagrande2004; Kaskan et al., Reference Kaskan, Lu, Dillenburger, Kaas and Roe2009; Fan et al., Reference Fan, Baldwin, Jermakowicz, Casagrande, Kaas and Roe2012). Alternatively, small regions of cortex that are not activated above threshold in such studies may represent the upper visual quadrant, rather than being insensitive to the specific visual stimuli. In the optical imaging studies of V3d noted here, area DM was not activated above threshold. This is not a surprise as higher order visual areas are more depressed by anesthesia than early visual areas, such as V1, V2, and V3. Thus, the lack of optical imaging evidence for an upper quadrant representation within the V3d territory does not rule out the possibility. Conclusive evidence for the presence of such a gap would require that the description of V3d be modified, perhaps as in Fig. 1B. The alternative of a VP or VLP that extends along the rostral border of V2v and then curves rostrally away from V2d while being displaced by other visual areas (e.g., Rosa et al., Reference Rosa, Palmer, Gamberini, Berman, Yu, Reser, Bourne, Tweedale and Galletti2009) does not seem consistent with the anatomical evidence of V1 connections to V3d and V3v that are in expected topographic locations relative to V2 and clearly greater in magnitude than those to DM.
Differences in the V3 region across primate taxa
Differences in the organization and functions of the V3 region of primates are likely to exist across taxa, especially those that have been in separate lines of primate evolution for many millions of years. As a clear example of a difference in extrastriate cortex, V2 of prosimian galagos does not have a well-developed banding structure in cytochrome oxidase and myelin preparations as in New and Old World monkeys, reflecting perhaps the over 60 million years of separation of prosimian and simian branches of the primate radiation (Xu et al., Reference Xu, Bosking, Sary, Stefansic, Shima and Casagrande2004; Fan et al., Reference Fan, Baldwin, Jermakowicz, Casagrande, Kaas and Roe2012 for review). Similar differences may exist in V3 across taxa, but there have been only limited attempts to investigate the modular organization of V3. Additionally, there have been few attempts by members of the same laboratory using the same procedures to study a range of primate species.
Conclusions
In our opinion, the bulk of the data supports the conclusion that a single visual area, V3 with dorsal and ventral halves, forms most of the rostral border of V2 in primates. For us, the evidence that V1 is retinotopically interconnected with the total V3 region across primates is particularly compelling. In brain sections, cut parallel to the surface of flattened cortex, the border of V1 (area 17) with V2 (area 18) is clear, and one can see where the injection in V1 is located and see the relevant patches in the proposed territories of V2 and V3. The projections to the DM region are not confused with the V2 and V3 patches as the DM connections are reduced in magnitude compared to the V2 and V3 connections. We have placed injections of tracers in V2d and V3d that reveal the connections expected for V3d, but these results are more questionable because the borders of V2 and V3 are estimated and somewhat uncertain. Injections in V3v are difficult to place and can miss V3 altogether, wrongly leading to the conclusion that V3v does not interconnect with V1. Microelectrode mapping results are limited by difficulties in accurately defining receptive fields, especially when responses are weak or variable and by the problem of defining functional borders. Furthermore, subjectively determined receptive field results may be unintentionally influenced during collection, and such results may be selectively illustrated. Such difficulties can be reduced by the use of fixed electrode arrays, such as the Utah array of 100 electrodes, so at least the arrangement of recording sites is fixed. In our hands, recording with such an array from the dorsal V1, V2d, V3d region in galagos revealed receptive fields only in the lower visual quadrant, and consistent size differences in receptive fields for recording sites architectonically identified as in V1, the V2 region, and the V3 region (Fan et al., 2012). Finally, optical imaging results from the exposed V3d region in owl monkeys and galagos, together with the fMRI results in macaque monkeys and humans all present a similar picture of the global organization of cortex that supports the V3 concept. Evidence in conflict with the V3 concept seems much less compelling.
Nevertheless, it remains possible that V3d does not form the complete border of V2d in at least some primates. This possibility would remain compatible with most of the evidence that supports the V3d concept, while allowing for some of the data that seem to be in conflict with the V3d concept. More specifically, the middle part of V3d may have a gap in which part of the upper visual quadrant is represented as part of another visual area. The identity of this hypothesized visual area is uncertain, but the candidate area, DM, seems unlikely, as DM appears to have a complete representation of the contralateral hemifield in cortex just rostral to V3. A second representation of part of the upper visual quadrant may also exist along the border of rostral V2 at the medial end of V3d. This is part of the area M. No comparable border areas have been suggested for cortex along the rostral border of V2v. Uncertainties remain because of difficulties in accurately identifying the rostral border of V2 and the proposed territory of V3d, while allowing for some representation of the upper visual quadrant along the horizontal meridian in a strip of cortex along the V2d/V3d border. Future research could reduce this uncertainty by providing more convincing evidence that the proposed gap in V3d exists and is related to upper quadrant vision. Further evidence is also needed for the existence of an upper quadrant representation in area M along the V3d border. Clear evidence for a gap area or area M would require a modification of the V3d concept, such as in Fig. 1B, but this would not necessarily mean that V3d does not constitute a complete representation of the lower visual quadrant, or that a new name is justified. The concept of a V3 in primates has a long history, and a V3-like area should remain V3.