Introduction
Age, as a variable, represents a critical basis for demographic classification; thus, its misrepresentations or misreporting alter the accuracy of demographic estimates (Dorjee & Spoorenberg, Reference Dorjee and Spoorenberg2016; Szołtysek, Poniat, & Gruber, Reference Szołtysek, Poniat and Gruber2018). The preference of certain digits, mostly ending in 5s and 0s, have been largely reported in censuses and surveys where age is inquired (A’Hearn et al., Reference A’Hearn, Baten and Crayen2009; Dahiru & Dikko, Reference Dahiru and Dikko2013; Randall & Coast, Reference Randall and Coast2016). Age heaping may be intentional or non-intentional as individuals may deliberately report preferred ages during self-reported data gathering or particular numbers may be unintentionally reported by research assistants (Gilleard, Reference Gilleard2016; Tollnek & Baten, Reference Tollnek and Baten2016). In some societies, reporting one’s accurate age is seemingly a difficult task, especially where the individual perceives exact age as having no significance (Blum & Krauss, Reference Blum and Krauss2018) or is ignorant of his/her actual age (Pardeshi, Reference Pardeshi2010). In such societies where there is a high level of age unawareness, people may make guesses of what their age should be (Pardeshi, Reference Pardeshi2010), or track it using the calendar or by astrological means (Crayen & Baten, Reference Crayen and Baten2010). Regardless, age heaping is inimical and threatens the reliability and validity of demographic data, especially on high profile issues such as policy formulation, for which demographic data are required (A’Hearn et al., Reference A’Hearn, Baten and Crayen2009; Bocquier et al., Reference Bocquier, Madise and Zulu2011; Randall & Coast, Reference Randall and Coast2016).
At the individual level, age heaping may be linked to several socioeconomic and socio-cultural factors, of which poor education and poor awareness are prominent (Blum & Krauss, Reference Blum and Krauss2018). Age heaping is considered as a tool to assess the level of literacy or extent of numeracy skills of a population (Spennemann, Reference Spennemann2017). Past influential studies on the relationship between educational level and age heaping showed an inverse relationship between the two variables (A’Hearn et al., Reference A’Hearn, Baten and Crayen2009; Bachi, Reference Bachi1951; Myers, Reference Myers1954). Beyond education, socio-cultural beliefs of the people have been identified as among the factors associated with age heaping. For instance, in Korea and Japan as well as some countries in East Africa, there is a lot of symbolic interaction and value placed on figures (Poston, Reference Poston2005). People often prefer their age ending in numeral 3 while they avoid digits ending with 4. This is so because there is the belief that the former is like the word or character for life while the latter has the same sound as the word for “death” (Poston, Reference Poston2005).
In Nigeria, censuses held in 1991 and 2006 revealed a high level of age heaping at 62.3% and 67.1%, respectively, using Myers’ index (Dahiru & Dikko, Reference Dahiru and Dikko2013). However, there is a dearth of information on the extent of age heaping in nationwide surveys in Nigeria. One of the most important surveys that contain data that informs policy formulation is the Nigeria Demographic Health Survey (NDHS). Given that the NDHS data assist the government in evaluation and planning by means of instituting programmes to targeted age cohorts in the population, this study investigates the extent and pattern of age heaping in the NDHS data of 2003, 2008 and 2013.
Methods
This study used secondary data from the NDHS for 2003, 2008 and 2013. These are third, fourth and fifth in the series of national sample surveys that provide demographic and health indicators in randomly selected households across Nigeria (National Population Commission [Nigeria] & ICF International, 2014). Permission to use the dataset was obtained from ICF Inc. USA. Specifically, this study accessed household members’ information on age, sex, highest educational level, wealth index, region and residence of merged household member recode files for 2003, 2008 and 2013. Household members whose reported age in single years was between 10 years and 99 years at the time of the survey were selected for the analysis. Household sampling weight was applied to correct for oversampling or under sampling. This gave a weighted sample total of 246,788 household members between the ages of 23 and 62 for the three surveys. The sample included 25,121, 102,665 and 119,002 household members in the 2003, 2008 and 2013 surveys respectively.
Age heaping was computed using Whipple’s index and Myers’ blended index (Nasir & Hinde, Reference Nasir and Hinde2014; Pullum, Reference Pullum2005). These indices have been developed to measure the extent of age heaping and terminal digit of preference in census or survey data (Blum & Krauss, Reference Blum and Krauss2018). Whipple’s index (WI), also known as index of concentration, was invented by George Chandler Whipple to measure the tendency for individuals to inaccurately report their age and detect the extent to which age data show systematic heaping on certain ages as a result of digit preference or rounding, particularly those ending in 0 and 5 (Shryock & Siegel, Reference Shryock and Siegel1976). This is the basic tool widely recommended for detecting a preference for 0 and 5 in age reporting.
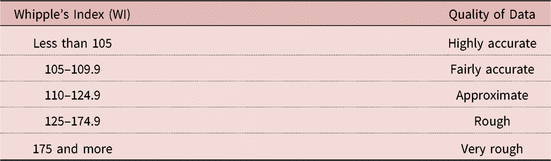
The index score is obtained by summing the number of persons in the age range 23 and 62 inclusive, who report ages ending in 0 and 5, dividing that sum by the total population between ages 23 and 62 years inclusive, and multiplying the result by 5. A weighted sub-sample of 133,814 household members between the ages of 23 and 62 for the three surveys was used to compute Whipple’s index. The sub-sample included 13,081, 56,073 and 64,659 household members in NDHS 2003, 2008 and 2013 respectively. Restated as a percentage, index scores ranged between 100 (no preference for ages ending in 0 and 5) and 500 (all people reporting ages ending in 0 and 5). This study adopted the United Nations’ standard for measuring age heaping using Whipple’s Index (United Nations, 1989) (see Table 1).
Whipple’s Index for measuring age heaping

Myers’ blended index (MI) is another tool for measuring age heaping based on the assumption that the population is equally distributed and the aggregate population of each age ending in terminal digits 0 to 9 should represent 10 percent of the population (Myers, Reference Myers1954). Unlike Whipple’s index, it identifies age misreporting and digit preference among single age respondents above 10 years and computes the deviation from 10 percent for each of the terminal digits. Myers’ index summarizes the absolute deviations in the population to give an index of preference as a measure of age misreporting in a particular survey. The index ranges from 0 when deviation from 10 percent is zero and heaping does not occur, to 90 when there is heaping and inaccurate unit digits in age reporting.
Apart from examining the pattern of age heaping in the NDHS between 2003 and 2013, this study explored age heaping by three basic characteristics of household members: sex of household members with values of male and female, residence grouped into urban and rural areas and regions based on geopolitical divisions in the country as North Central, North East, North West, South East, South South, and South West.
There were two stages of data analysis: the first stage was the computation of frequency distribution of different single age categories by survey year, sex of household member, region and residence. The second stage involved calculation of Whipple’s index and Myers’ index for those basic background characteristics for different years of the survey.
Results
Whipple’s indices for the three surveys were all well above 125, which is the maximum value consistent with ‘approximate’ data, in terms of the United Nations (1989) classification of the quality of age reporting. Age heaping and preference for the digits 0 and 5 was highest in the 2003 survey with a value of 217.3, indicating ‘very rough data’ in the United Nations classification. Although the value of the index was slightly reduced to 204.2 and 202.5 in the 2008 and 2013 surveys respectively, it was still in the United Nations’ ‘very rough’ category.
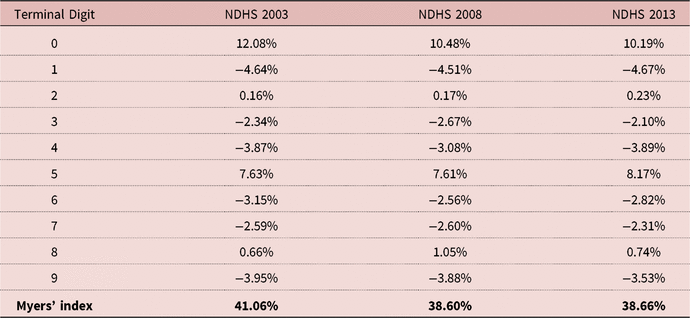
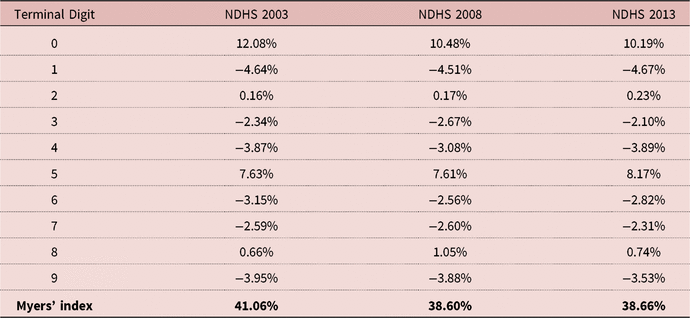
Myers’ indices for the three Nigeria Demographic Health Surveys followed the same pattern as Whipple’s indices. Table 2 presents the deviations of percentage from 10 for terminal digits by Myers’ blended method for NDHS 2003, 2008 and 2013. Myers’ index of preference for NDHS 2003 shows a higher value of 41 percent and inaccurate age reporting than other surveys. The index slightly declined by about 3 percentage points in NDHS 2008 and 2013. The most preferred age digit reported with highest percent deviation across the three surveys was 0, followed by 5. The deviation of percentage from 10 for digit 0 was 12.08% in 2003 and declined to 10.19% in 2013. However, the preference for terminal digit 5 increased from 7.63% in 2003 to 8.17% in 2013. This implies that although a preference for zero digit is higher than other terminal digits, there was an increase in preference for digit 5 between 2003 and 2013. The least preferred digit was 1 across the surveys.
Deviations of percentage from 10 for terminal digits by Myers’ blended method for NDHS 2003, 2008 and 2013
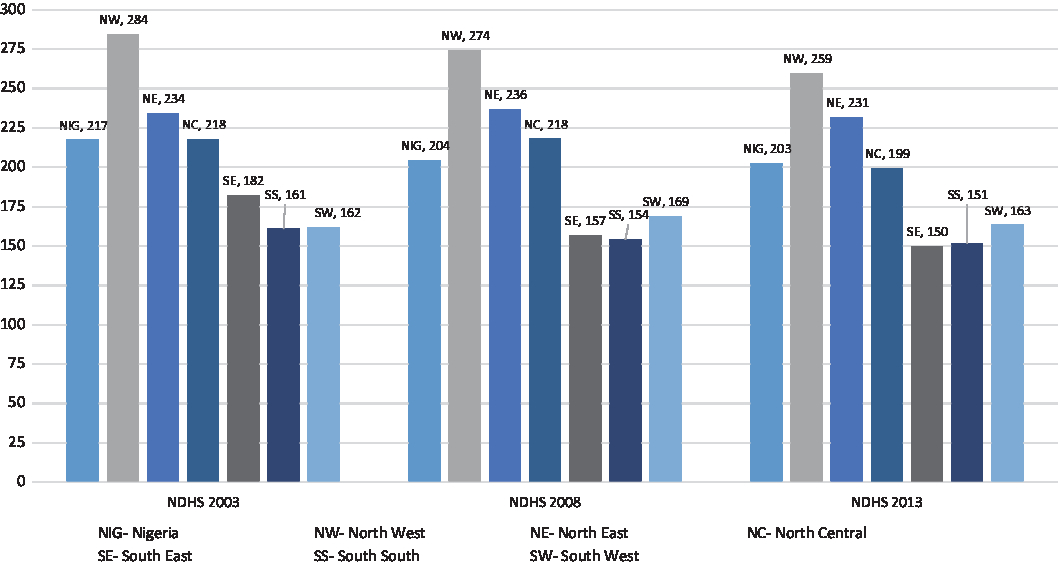
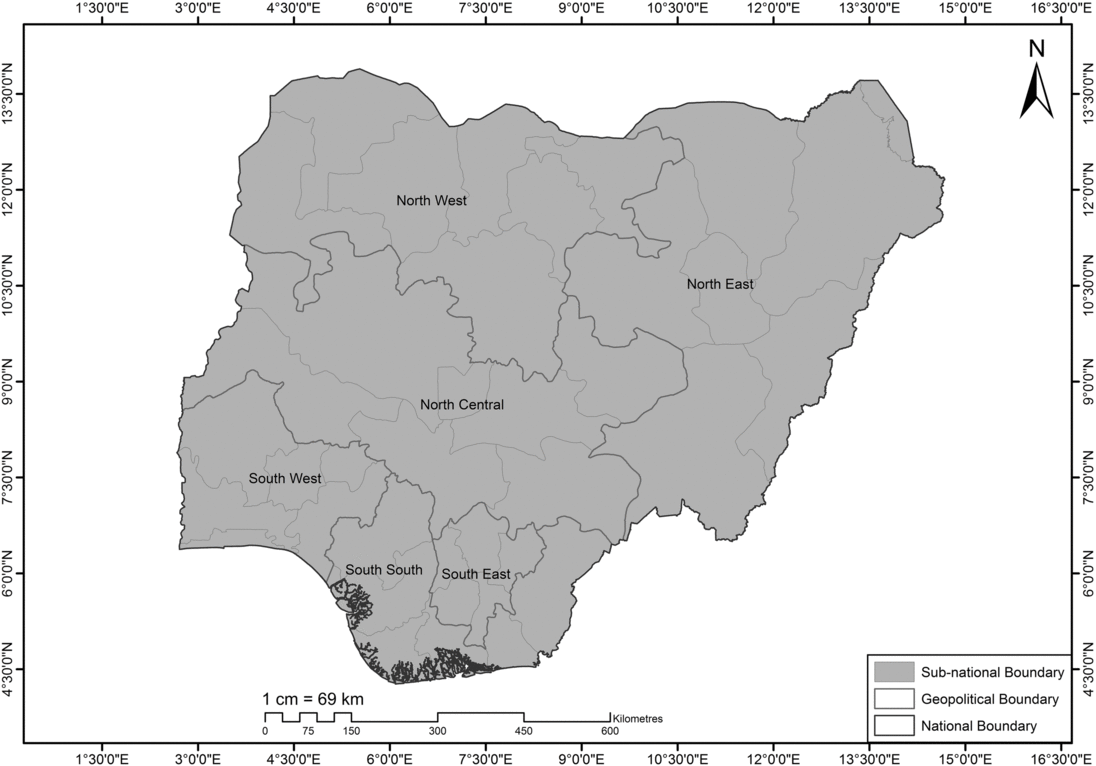
The analysis of adult age heaping in Fig. 1 and Table 3 shows north–south dichotomy that has been consistently reported in basic health and demographic characteristic in Nigeria. A map of Nigeria is shown in Fig. 2.
Whipple’s index by geopolitical regions in Nigeria: NDHS 2003, 2008 and 2013.

Myers’ index by geopolitical regions in Nigeria: NDHS 2003, 2008 and 2013

Map of Nigeria.

Respondents who live in the northern part of Nigeria had more age misreporting with digit preference for 0 and 5 than other regions. The North West geopolitical region had the highest WI and MI in NDHS 2003, 2008 and 2013 consistently. Although, indices for North East and North Central were lower than North West, the values were still consistently higher than the southern region in the three surveys.
The quality of age data in the southern region was rough, but also with lower Whipple’s and Myers’ indices. In the most recent survey in 2013, for example, the least number of age misreporting and preference for 0 and 5 occurred in South East with a value of 150 for Whipple’s index. However, further analysis of single age of household members who were between 10 and 99 years using Myers’ index, indicated that the quality of age data in South South was the best reported in all the three NDHS over the ten-year period.
While the range of Whipple’s and Myers’ indices in Nigeria shows poor quality data over the period of selected NDHS years and across regions, there was a gender difference in age misreporting (Table 4). Age heaping and terminal digit preference in the three NDHS series between 2003 and 2013 were lower among females than males.
Gender difference in age heaping and digit preference in NDHS 2003, 2008 and 2013

There was an urban–rural difference in age heaping and digit preference in the NDHS 2003, 2008 and 2013 (Table 5). Rural indices for the three surveys were higher than urban indices. Improved age reporting, though still poor, was observed in urban areas with Whipple’s index of 191.9 in 2003, to 171.7 in 2008, to 169.6 in 2013 and Myers’ index of 34.17%, 29.06% and 28.62% in the three consecutive NDHS survey of 2003, 2008 and 2013.
Urban-Rural difference in age heaping and digit preference in NDHS 2003, 2008 and 2013

Discussion
This study examined age heaping in Nigeria since the millennium. In doing so, the study used the NDHS for 2003, 2008, and 2013 to compute a Whipple’s index for each survey year, by gender, geopolitical zones, states and place of residence. Also, Myers’ index was computed for each survey year, by gender, geopolitical zones, and place of residence. The analysis shows that the NDHS exhibits a preference for ages ending in 0 and 5. Consequently, age heaping occurs due to a preference for rounding ages in multiples of 5. A similar finding was observed by Dahiru and Dikko, (Reference Dahiru and Dikko2013), in the study of digit preference in Nigerian censuses held in 1991 and 2006. Given that Whipple’s index for the three surveys is higher than 125, which is the least acceptable value of approximate data in terms of quality of age reporting (Spoorenberg, Reference Spoorenberg2007), the quality of age reporting in the surveys is poor.
However, the analysis shows a slight decline in age heaping between 2003 and 2013. Nonetheless, the quality of age reporting even in 2013 is poor. The extent to which this reflects cultural preferences for special ages as found in a Chinese study (Baten et al., Reference Baten, Ma, Morgan and Wang2010; Baten & Sohn, Reference Baten and Sohn2017; Jowett & Li, Reference Jowett and Li1992) or literacy and numeracy as found in Europe (A’Hearn et al., Reference A’Hearn, Baten and Crayen2009) is unknown. A study, however, has cautioned that the link between age heaping and literacy and numeracy is spurious and that the census collection and reporting methodologies are the main reasons for the observed age heaping preference (Spennemann, Reference Spennemann2017). Consistent with this assertion, a qualitative study reveals that participants often do not know their age and are sometimes reticent in revealing their age, thus making the interviewers use hints such as age at marriage, duration of marriage and age of first child to estimate participants’ age (Pardeshi, Reference Pardeshi2010). West et al. (Reference West, Robinson and Bentley2005) also affirmed that age heaping is as a result of respondent’s unawareness of their age.
The Whipple’s indices in the three NDHS series between 2003 and 2013 are slightly but consistently lower for females than males. This is in contrast to previous findings, which showed that men were reportedly less likely to heap their age compared to women (Dahiru & Dikko, Reference Dahiru and Dikko2013; Földvári et al., Reference Földvári, Van Leeuwen and Van Leeuwen-Li2012; Manzel et al., Reference Manzel, Baten and Stolz2012). Studies that examined sex differences in age heaping using the Mosaic data found mixed evidence but concluded that sex differences in heaping are smaller than might be expected from reading economic history and demographic literature (Földvári et al., Reference Földvári, Van Leeuwen and Van Leeuwen-Li2012; Manzel et al., Reference Manzel, Baten and Stolz2012; Szołtysek et al., Reference Szołtysek, Poniat and Gruber2018). Although the findings showed a contrasting result, the sex difference in age heaping in the NDHS is small.
The study also shows a decline in age heaping in urban areas with an index of 191.9 in 2003, to 171.7 in 2008, to 169.6 in 2013. The decline in age heaping observed in the urban areas could be attributed to increased literacy level in urban areas. Nonetheless, the Whipple’s index in urban areas in 2013 still strongly reflects very rough data and age misreporting. Similarly, the analysis reveals significant regional differences in age misreporting in the NDHS, clearly skewed towards a northern region disadvantage in age heaping. The literacy level is much lower in the northern regions compared to the southern regions (National Population Commission [Nigeria] & ICF International, 2014) and thus explains why age misreporting is more prevalent in the northern regions of the country. Studies have consistently shown that age misreporting is significantly correlated with educational level (A’Hearn et al., Reference A’Hearn, Baten and Crayen2009; Crayen & Baten, Reference Crayen and Baten2010; Mokyr, Reference Mokyr2013). The findings show that household members with at least secondary education and rich in terms of wealth index have lower values of Whipple’s index than other educational and wealth index groups.
In conclusion, the study reveals strong evidence of age misreporting in the NDHS. Evidence of age heaping exists in all regions of Nigeria, although more prevalent in the rural areas and northern region of the country. The poor quality of age data as found in the NDHS can introduce bias that has implications for decision making. Age reporting is a critical issue in the study of fertility and mortality (Coale & Li, Reference Coale and Li1991). Rounding up of age or age exaggeration could lead to misclassification of age, which could result in underestimation of fertility and mortality rate (Coale & Li, Reference Coale and Li1991; Pardeshi, Reference Pardeshi2010). Thus, future studies should assess the extent to which age misreporting could bias the estimate of the fertility rate.
Acknowledgments
The authors acknowledge the African Population and Health Research Centre for granting AIA a postdoctoral research scientist position during which he worked on this article. Also, they acknowledge ICF Macro for granting access to the dataset analysed in this study.
Funding
No funding was received towards completion of this work.
Conflicts of Interest
The authors have no conflict of interests to report.
Ethical Approval
The authors agreed with and adhere to all the terms of use of the dataset set by the DHS. The IRB-approved procedures for DHS public-use datasets do not in any way allow respondents, households or sample communities to be identified. There are no names of individuals or household addresses in the data files. The study adhered to the IRB Ethical Guidelines for Human Subjects.