


Introduction
Political selection involves many dimensions, such as who initially becomes a candidate for office, who wins, the extent to which winners retain their positions (static ambition), and the extent to which winners seek higher positions (progressive ambition).Footnote 1 Recently, access to high-dimensional administrative data has allowed researchers to provide better answers to some classic questions about political selection, often focusing on the net result of the selection processes just noted.Footnote 2 For example, are winning candidates richer or more educated than the population at large? Do elections select on merit, somehow defined (Dal Bó et al. Reference Dal Bó, Finan, Folke, Persson and Rickne2017)? What determines the career progression of an individual politician?
In this paper, we use comprehensive electoral and candidate data from both local and national elections to explore political selection in Norway. The important role of political parties in choosing candidates for office is well-established; however, the extent to which rules or norms guide internal party selection is less well-understood (Dal Bó and Finan Reference Dal Bó and Finan2018; McCarty and Schickler Reference McCarty and Schickler2018). We depart from the existing literature, both in political economy and political science, in our focus on political seniority systems.
As we define them, seniority procedures are methods of selection that prioritize prior experience holding political office. More specifically, we argue seniority systems consist of two components: an “incumbent re-nomination norm,” whereby any incumbent in good standing will be re-nominated (if they wish), and a “seniority progression rule,” whereby open nominations (those with no incumbent claiming them) will be allocated preferentially to party members currently holding predefined feeder offices. Together, these rules help create a career path within the party, such that nominations are meritocratic for entry-level jobs (for which no feeder offices exist), but then become seniority-based as one moves up in the hierarchy of offices. In contrast to previous studies of seniority systems—which focus on the allocation of appointive offices, such as committee chairs (e.g., Epstein et al. Reference Epstein, Brady, Kawato and O’Halloran1997; McKelvey and Riezman Reference McKelvey and Riezman1992; Muthoo and Shepsle Reference Muthoo and Shepsle2014)—we investigate whether parties use seniority to allocate nominations for elective office(s).
Seniority procedures for selecting nominees to elective offices can have important consequences. For example, accrued seniority increases a politician’s value of remaining in his/her party, rather than switching to another. Unless a switcher’s seniority will be “honored,” s/he must accept a demotion in order to join a new party. Thus, seniority systems can help build more stable parties. Relatedly, stripping a member of his/her seniority is a significant threat that only parties running seniority systems can deploy. Thus, seniority systems can help build more disciplined parties.
Our goals in this paper are as follows. First, we hope to put the investigation of seniority systems on the scholarly agenda. While there is an extensive comparative literature on candidate selection and recruitment, standard surveys (e.g., Gallagher and Marsh Reference Gallagher and Marsh1988; Norris Reference Norris and Norris1997) do not mention the possibility that parties use seniority systems in allocating their nominations. Although the study of seniority systems is well-established in legislative studies, it is remarkably absent from electoral studies. Second, we hope to provide methods that can be used to identify whether seniority systems are in place in closed-list systems. The challenge is that nominations allocated by “merit” (variously defined) might look like those allocated by seniority. For example, an incumbent might earn re-nomination by virtue of being a higher-quality candidate than his/her likely competitors rather than by virtue of being credited by party nominating committees for his/her seniority. Third, we apply the methods we develop to Norway, a case with detailed data that allows us to empirically test these competing claims.
To pursue the objectives just articulated, we first model an abstract office hierarchy in a closed-list proportional representation (PR) electoral system, then provide a detailed look at political careers in Norway during the period 1945–2019. To assess whether Norwegian parties follow seniority norms, we focus on several “incremental moves” that a Norwegian politician might traditionally seek, such as promotion from local councilor to mayor, promotion from mayor to a spot on the parliamentary list, and re-nomination to a winnable spot on the parliamentary list (should such a position be obtained). In order to accomplish any of these moves in a closed-list system, it is crucial to secure an appropriate nomination spot (as we explain further below). In Norway, we consistently find patterns that would be expected under seniority progression (or re-nomination). We use both panel regressions and regression discontinuity (RD) designs to improve our ability to address issues of causality.
After providing some evidence that Norwegian politicians are very stably attached to their parties, as would be expected if those parties followed seniority norms, we consider some of the opportunities that parties can offer to their members late in their careers (such as cabinet posts or “retirement” positions) as well as the general value to political office (in the form of economic returns). In the paper, we also examine two key challenges to our analysis—one inferential (can one distinguish seniority from skill acquisition?) and one theoretical (can parties credibly commit to following seniority rules?). We also discuss the implications of seniority systems for party stability.
Office and Nomination Hierarchies
Throughout the paper, we use as a running example a country in which only three types of elective political office exist: local council seats, intermediate posts such as mayoralties, and national parliamentary seats. The values of these seats are denoted
 $ {V}_L<{V}_I<{V}_N $
, where the subscripts indicate the level (local, intermediate, national). This three-level example suffices to illustrate a hierarchy of elective offices. In principle, office hierarchies can also include intra-legislative posts (e.g., committee chairs), executive posts (e.g., cabinet portfolios), and private sector posts (e.g., positions on corporate boards or in lobbying firms).
Continuing with our three-level example, we assume that seats at the local and national levels are filled via closed-list PR elections. Moreover, for simplicity we shall assume that only hopeless and safe list positions exist. Candidates with hopeless positions are sure to lose, while those with safe positions are sure to win. Thus, nomination to a hopeless spot is worth nothing (within the current period), while nomination to a safe local (resp., national) spot is worth
 $ {V}_L $
(resp.,
 $ {V}_N $
).
Given these simplifying assumptions, a generic politician in a particular party in a closed-list system can progress through the following five stages, which we call the “nomination hierarchy”:
-
1. Being nominated to a losing position on the local list
-
2. Being nominated to a winning position on the local list
-
3. Being nominated to an intermediate post
-
4. Being nominated to a losing position on the national list
-
5. Being nominated to a winning position on the national list
Nomination to a losing position on the national list typically does not require the candidate to surrender their current office. For example, mayors may run on the parliamentary list and continue serving if they do not win. It is for this reason that we put nomination to a losing spot on the national list higher than nominations to lower offices.
We characterize the process that a generic party uses to choose its nominees as follows. First, each potential nominee i is given an overall score,
 $ {S}_i=\left(1-\sigma \right){q}_i+\sigma {s}_i. $
Here,
 $ {q}_i $
denotes
 $ i $
’s ability or quality, while
 $ {s}_i $
represents
 $ i $
’s “seniority score,” which depends on the highest office
 $ i $
has held and for how long. For example, the party might rank its members by seniority within each office and assign larger scores to those higher in the seniority ranking. The overall score,
 $ {S}_i $
, is then a weighted average of the candidate’s quality and seniority with weight
 $ \sigma \in \left[0,1\right] $
on seniority and weight
 $ 1-\sigma $
on quality.
Second, the probability
 $ {\pi}_{ik} $
that candidate
 $ i $
wins, when competing against candidate
 $ k $
for a particular nomination, is given by a contest success function (Skaperdas Reference Skaperdas1996):
 $ {\pi}_{ik}=\quad0.5em \frac{S_i^{\alpha }}{S_i^{\alpha }+{S}_k^{\alpha }}. $
Depending on the values of the weight
 $ \sigma $
and the exponent
 $ \alpha $
, this formula can represent procedures that award nominations strictly on the basis of seniority (
 $ \alpha \to \infty, \sigma =1 $
), strictly on the basis of quality (
 $ \alpha \to \infty, \sigma =0 $
), or on the basis of both seniority and quality. Moreover, the formula can be extended to cover cases in which more than two candidates compete for a given nomination in the nomination hierarchy.
How much nominations based on quality and those based on seniority would differ depends on the distribution of quality in the candidate pool. If all candidates have the same quality, then the correlation between quality and seniority (
 $ {q}_i $
and
 $ {s}_i $
) will be zero and it will be relatively easy to tell whether seniority procedures are in use or not. In contrast, if quality varies across candidates, then quality and seniority (
 $ {q}_i $
and
 $ {s}_i $
) will be positively correlated (since higher-quality candidates are more likely to win nominations and offices), making it harder to detect whether seniority per se weighs in the nomination decision. Our analyses deal with this through RD designs.
However, RD designs mainly help if
 $ {q}_i $
is a fixed characteristic of each candidate
 $ i $
. If instead
 $ {q}_{it} $
varies over time, and represents the human capital
 $ i $
has accrued as of time
 $ t $
, then human capital and seniority will be positively correlated. Each term that a politician serves in a particular office will both increase their seniority and develop their skills as a politician. It is thus harder to tell whether nominations are awarded based on skills or on seniority. We return to this issue later, in the section entitled “Seniority versus Skills.”
More broadly, one could argue that incumbent re-nomination norms emerge naturally as conventions: incumbents are expected to defend their current spots in equilibrium and thus potential challengers are deterred from competing for those spots. Some parties might choose to recognize incumbent re-nomination norms formally, further entrenching them.Footnote 3 For our purposes, it does not matter whether incumbent re-nomination norms arise purely spontaneously or are also reinforced by explicit rules. However, the quantitative methods we use to detect seniority systems complement qualitative approaches, such as examining the written rules (if any) governing a party’s nomination process. Even when written rules exist and are available to scholars, a question remains as to how strictly they are followed; our methods can answer that question.
The Office and Nomination Hierarchies in Norway
Having described an abstract hierarchy in a closed-list system, we introduce the case of Norway, upon which our empirical analysis will focus. As do 40 of 43 European countries, Norway uses a form of party-list PR to elect national parliamentarians. By focusing on the Norwegian case, we hope to contribute a set of techniques useful in identifying whether seniority systems are in place as well as to discuss some of the substantive issues that such systems raise.
Main Features of Our Empirical Case
Like many European countries, Norway’s political hierarchy has directly or indirectly elected officials at several levels: local, intermediate, and national. Near the top of Norway’s office hierarchy lies the Storting, a unicameral parliament with 169 members elected for four-year terms using closed-list PR. Still higher lies the government, consisting of the Prime Minister and other members of the Statsråd (Council of State, or cabinet). The number of cabinet ministers has varied, depending on the number of parties in the governing coalition; the most recent cabinet, formed in January 2020, includes 20 members.
At the bottom of the hierarchy are the local councils (kommunestyre) with, on average, 25 members elected for four-year terms. Local elections are staggered so that they occur two years before (or after) parliamentary elections. Based on suggestions from parties, each local council elects various intermediate officers: a mayor (ordfører), a deputy mayor (varaordfører), and an executive board (Formannsskapet) (all of whom are elected councilors). Municipalities are small (the median population is 4,000, the average 10,000) but have the responsibility for key welfare services such as child care, schooling, and elderly care, and they employ about 17% of the labor force. As a result, local office is perceived to be an important stepping stone to the national arena.
Norway also features a set of regional councils, existing as a component of sub-national government. However, regional governments do not feature as part of our main empirical analysis for a number of reasons. First, they have much more limited responsibilities and employ a much smaller fraction (2%) of the labor force. The majority of social services and public goods provision are provided by local councils, making regional politicians relatively weak and their job less prestigious. Second, and relatedly, regional elections in Norway are often seen as “second-order” elections that both the media and voters perceive as much less important (e.g., Ervik Reference Ervik2012; Johansson and Mortenberg Reference Johansson and Mortenberg2013). As serving in a regional council is a source of experience and potentially skill, we include this information in our descriptive figures. But we focus primarily on analyzing seniority progression from local to national office.
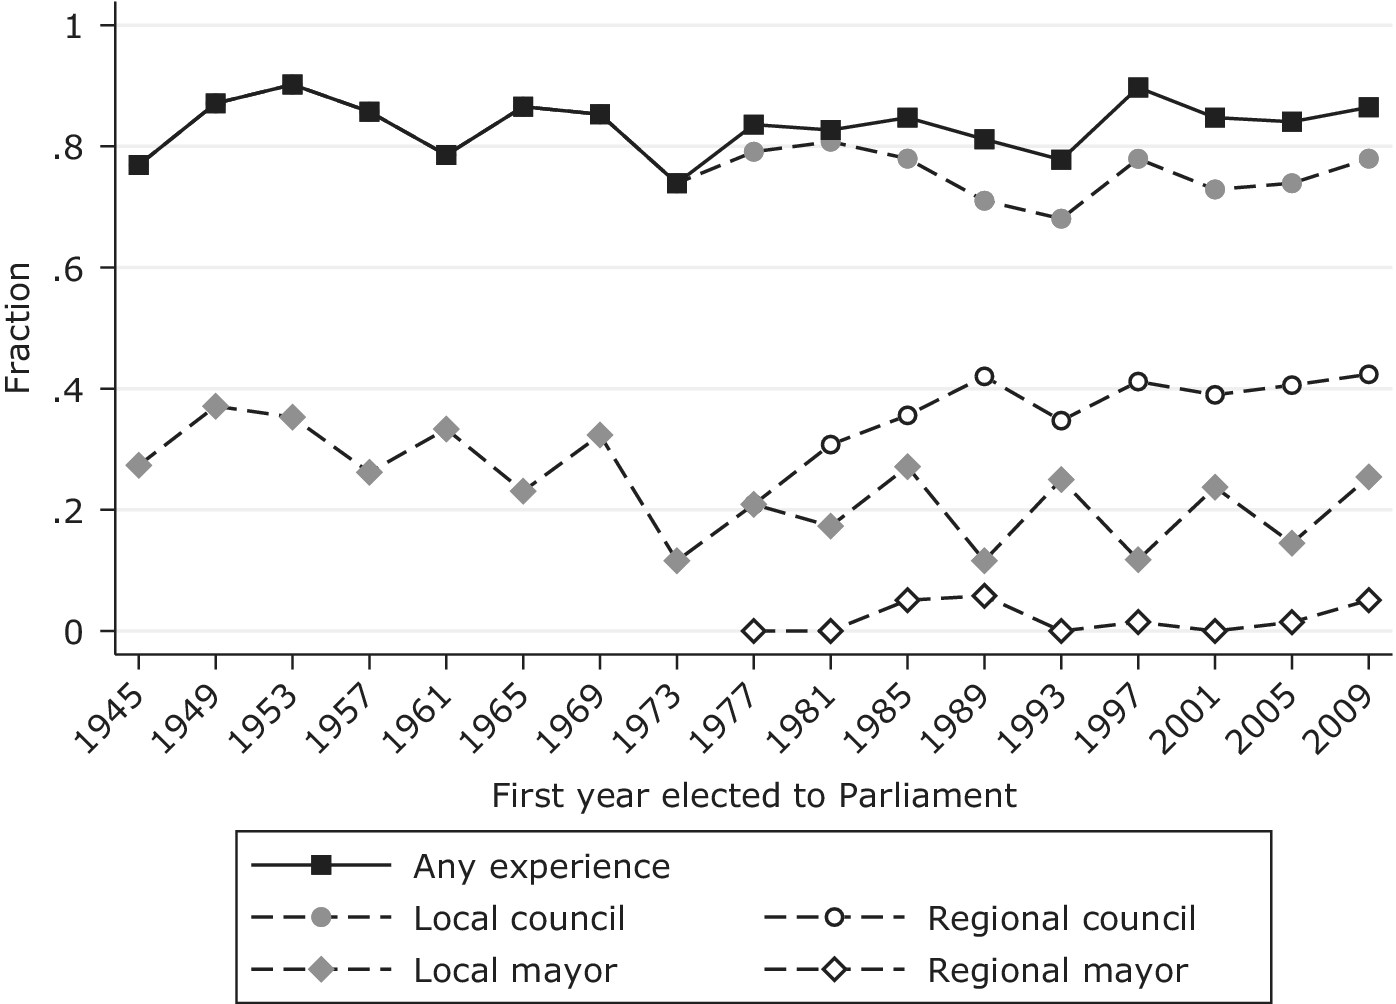
Figure 1 demonstrates that a high proportion of first-time parliamentarians have prior experience in either local or regional office. Most political careers begin at the local or regional level, with relatively few beginning at the parliamentary level. Candidates that have experience from both sub-national offices tend to start their career at the local level (see Appendix Figure A.1).
Fraction of Candidates with Political Experience from Local and Regional Office before Entering Parliament for the First Time

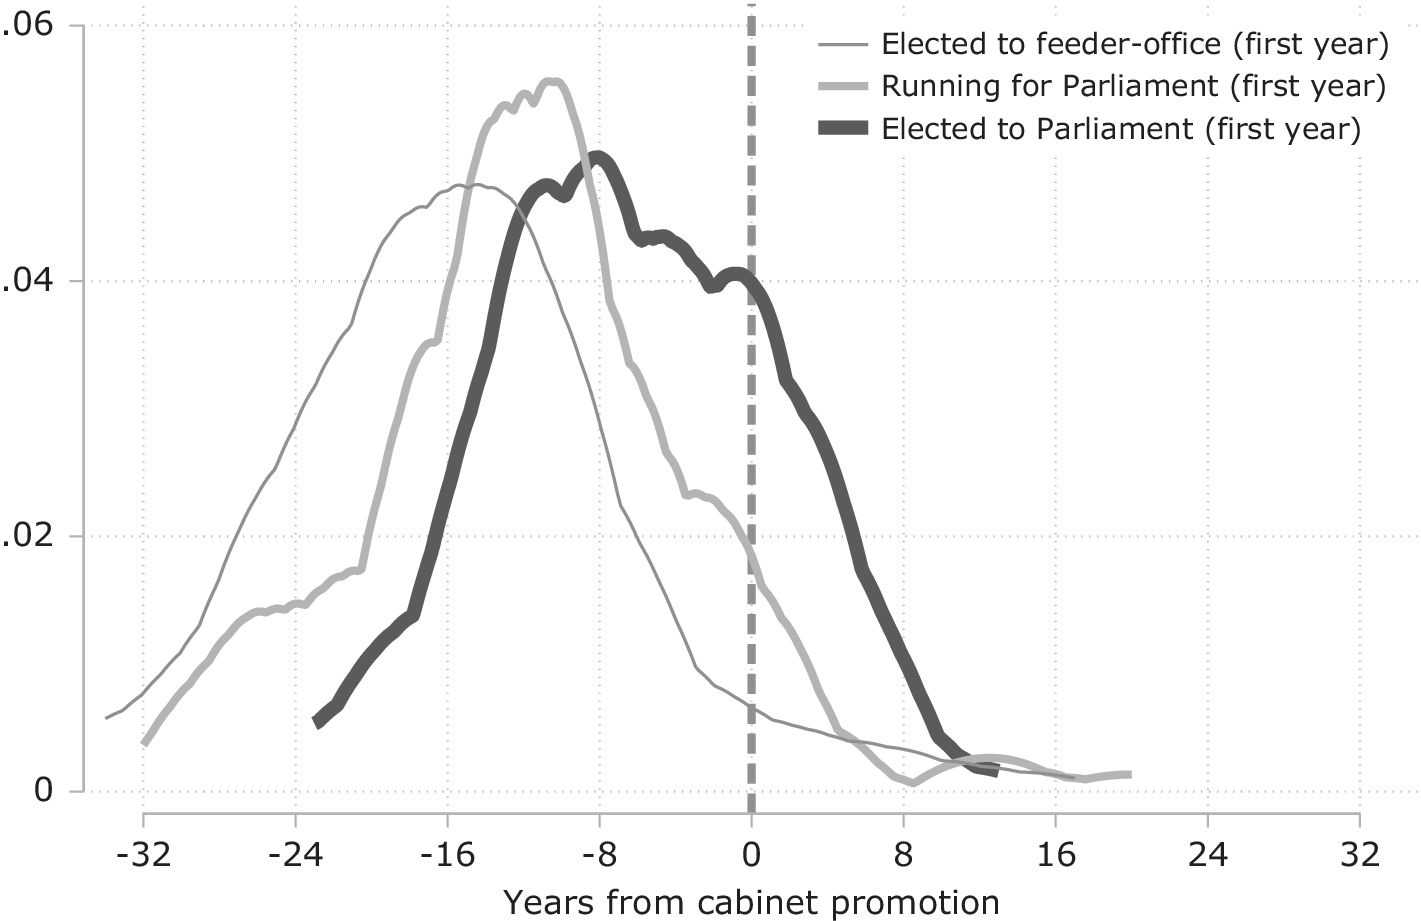
If we look at first-time cabinet members, the descriptive pattern is also consistent with seniority-based promotions, as demonstrated by Figure 2. For example, among the individuals promoted to cabinet for the first time during the 1980–2009 period (N = 136), 74% were previously elected to a feeder office (local or regional council, or mayor). Typically, decades have elapsed between the start of a politician’s career and their first-time promotion to cabinet, as illustrated by the thin line in the kernel density plot of Figure 2. The vertical line at zero represents first-time promotion to cabinet; for example, –8 means that the candidate first was elected to local office 8 years before being promoted to cabinet for the first time. The thicker lines in Figure 2 illustrate that there is typically also a considerable time lag from first-time running (winning) in national elections and promotions to cabinet. Among the candidates promoted to cabinet during the 1980–2009 period, 88% ever run for parliament and 74% are ever elected.
Kernel Density Plots Describing Cabinet Member’s Political Career

Research Questions
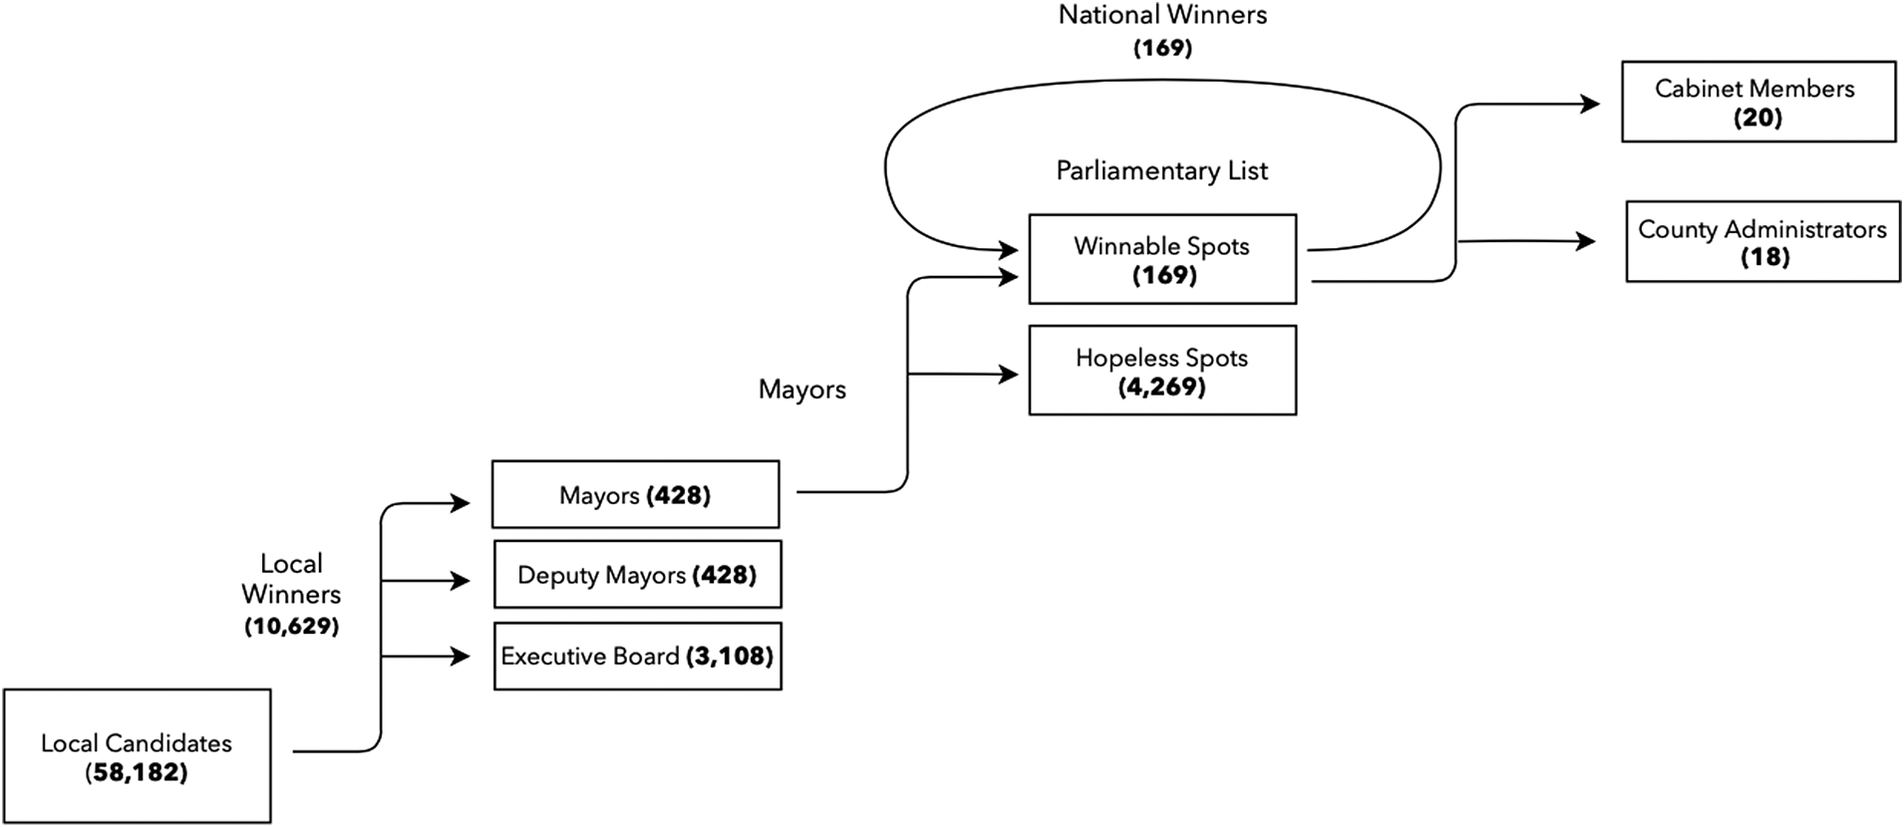
In our main empirical analyses, we investigate the extent to which Norway’s main parties advance their members through a nomination hierarchy. To clarify our research questions we rely on Figure 3. Our first research question (RQ1) is whether winning a local council election (for the first time) improves a candidate’s chance of advancing at the local level. We are primarily interested in the candidate’s chances of winning the prestigious mayoral position, but we also consider future election to the executive board/deputy mayor. As being listed first on the local list of a large party is virtually the only way to become mayor, our first question is similar to asking whether local winning boosts a politician’s chance of being put at the top of their party’s list.
Illustration of the Norwegian Nomination Hierarchy

The second research question (RQ2) is whether those who become mayors are more likely to be placed on their party’s parliamentary list (in either a hopeless or safe spot). As with RQ1, this concerns what we have called seniority progression. The third research question (RQ3) is whether those who are elected to parliament (for the first time) are more likely to secure a winnable spot in the next election, as an incumbent re-nomination rule would dictate. Finally, we also consider how winning a seat in parliament affects a candidate’s chances of ever being promoted to higher office (RQ4); we focus on a cabinet position, common to all parliamentary systems, as well as a top-level bureaucratic post specific to the Norwegian case.
Our research questions cover some of the more important and commonly traveled steps in the Norwegian office hierarchy. Collectively, they suffice to address the overarching questions motivating our study: do seniority systems regulate the allocation of nominations in closed-list systems, and how could we tell if they did, both in general and in the specific case of Norway?
Parties, Nomination Procedures, and Electoral Rules
Local, regional, and national elections in Norway are all dominated by seven political parties, which can be classified as belonging to the left-leaning socialist camp (Labor Party, Socialist Left Party) or the right-leaning conservative camp (Center Party, Christian Peoples’ Party, Liberal Party, Conservative Party, Progress Party).Footnote 4
At the national level, candidate nominations and rank positions are determined within each election district by dues-paying party delegates at nominating conventions (Valen, Narud, and Skare Reference Valen, Narud, Skare, Narud, Pedersen and Valen2002). The nomination procedure has been characterized as closed (Narud and Valen Reference Narud and Valen2007). In the “Seniority versus Skills” section, we present original data showing that only 5% of spots on main party lists were contested in the most recent national election. At the local level, the nomination procedures are somewhat more open. For example, Christensen et al. (Reference Christensen, Midtbø, Ringkjøb and Aars2008) conduct an analysis of 43 nomination processes and find some disagreement in about half of them.
At the local level, a nomination committee is typically established by the party organization to recruit candidates for the election list. The committee typically proceeds as follows (Ringkjøb and Aars Reference Ringkjøb and Aars2010):
-
1. Ask current incumbents if they want re-election.
-
2. Ask previous candidates if they want re-nomination.
-
3. Ask local party members if they would like to run.
-
4. Ask other party sympathizers if they would like to run.
The first rule suggests that incumbent re-nomination is the norm at the local level.
The final party ballot is usually decided at a nomination meeting, typically open to all local party members. Parties have the possibility to give certain candidates an increased share of the poll (25% of the total number of votes received by the party [PartyVotes]). Candidates with such a pre-advantage are listed at the top of the ballot paper in boldface.Footnote 5
Voters may cast personal votes for candidates on any party list. Together with candidates’ pre-advantage status, the number of personal votes yields the personal poll that forms the basis of the within-party distribution of seats.Footnote 6
 $ {\displaystyle \begin{array}{ccc} Pol{l}_{it}=\left\{\begin{array}{cc} PersonalVote{s}_i& \mathrm{if}\ i\ \mathrm{has}\ \mathrm{no}\ \mathrm{pre}-\mathrm{advantage}\\ {} PersonalVote{s}_i+0.25\cdot PartyVote{s}_l& \mathrm{if}\ i\ \mathrm{has}\ \mathrm{a}\ \mathrm{pre}-\mathrm{advantage}\ \mathrm{for}\ \mathrm{list}\ l\\ {}& \end{array}\right..& & \end{array}} $
Not surprisingly given the formula just explained, pre-advantage status is often decisive for the within-party allocation of seats, giving parties substantial control over who is elected. Thus, even at the local level, Norwegian parties can offer two types of nomination—a pre-advantaged spot at the top of the list and a non-advantaged spot at the bottom of the list. List position on the regional and national lists is even more determinative of a candidate’s chances.
Local Election Data
Our local election dataset consists of all 187,000 candidates running for municipal office in 2003, 2007, and 2011. However, we exclude candidates running for party-independent local lists and minor lists that (almost) never win national office (27,000 observations) as well as candidates running for lists that fail to win any seat in the relevant local council (4,000 observations). This is our baseline sample. In addition, we impose separate sample restrictions on the datasets that we use to analyze RQ1 and RQ2: (i) the councilor analysis excludes observations with missing data on personal votes (14,000 observations) and cases involving ties between two candidates (which are broken by the initial ranking on the list) (700 observations) (N = 142,617) and (ii) the mayoral analyses excludes all candidates running for office in municipalities using direct elections for mayor (12,000 observations), candidates that previously ran for national office (8,000 observations), and lists where the elected mayor is not in the top-ranked position (319 observations from 13 lists) (N = 140,830).
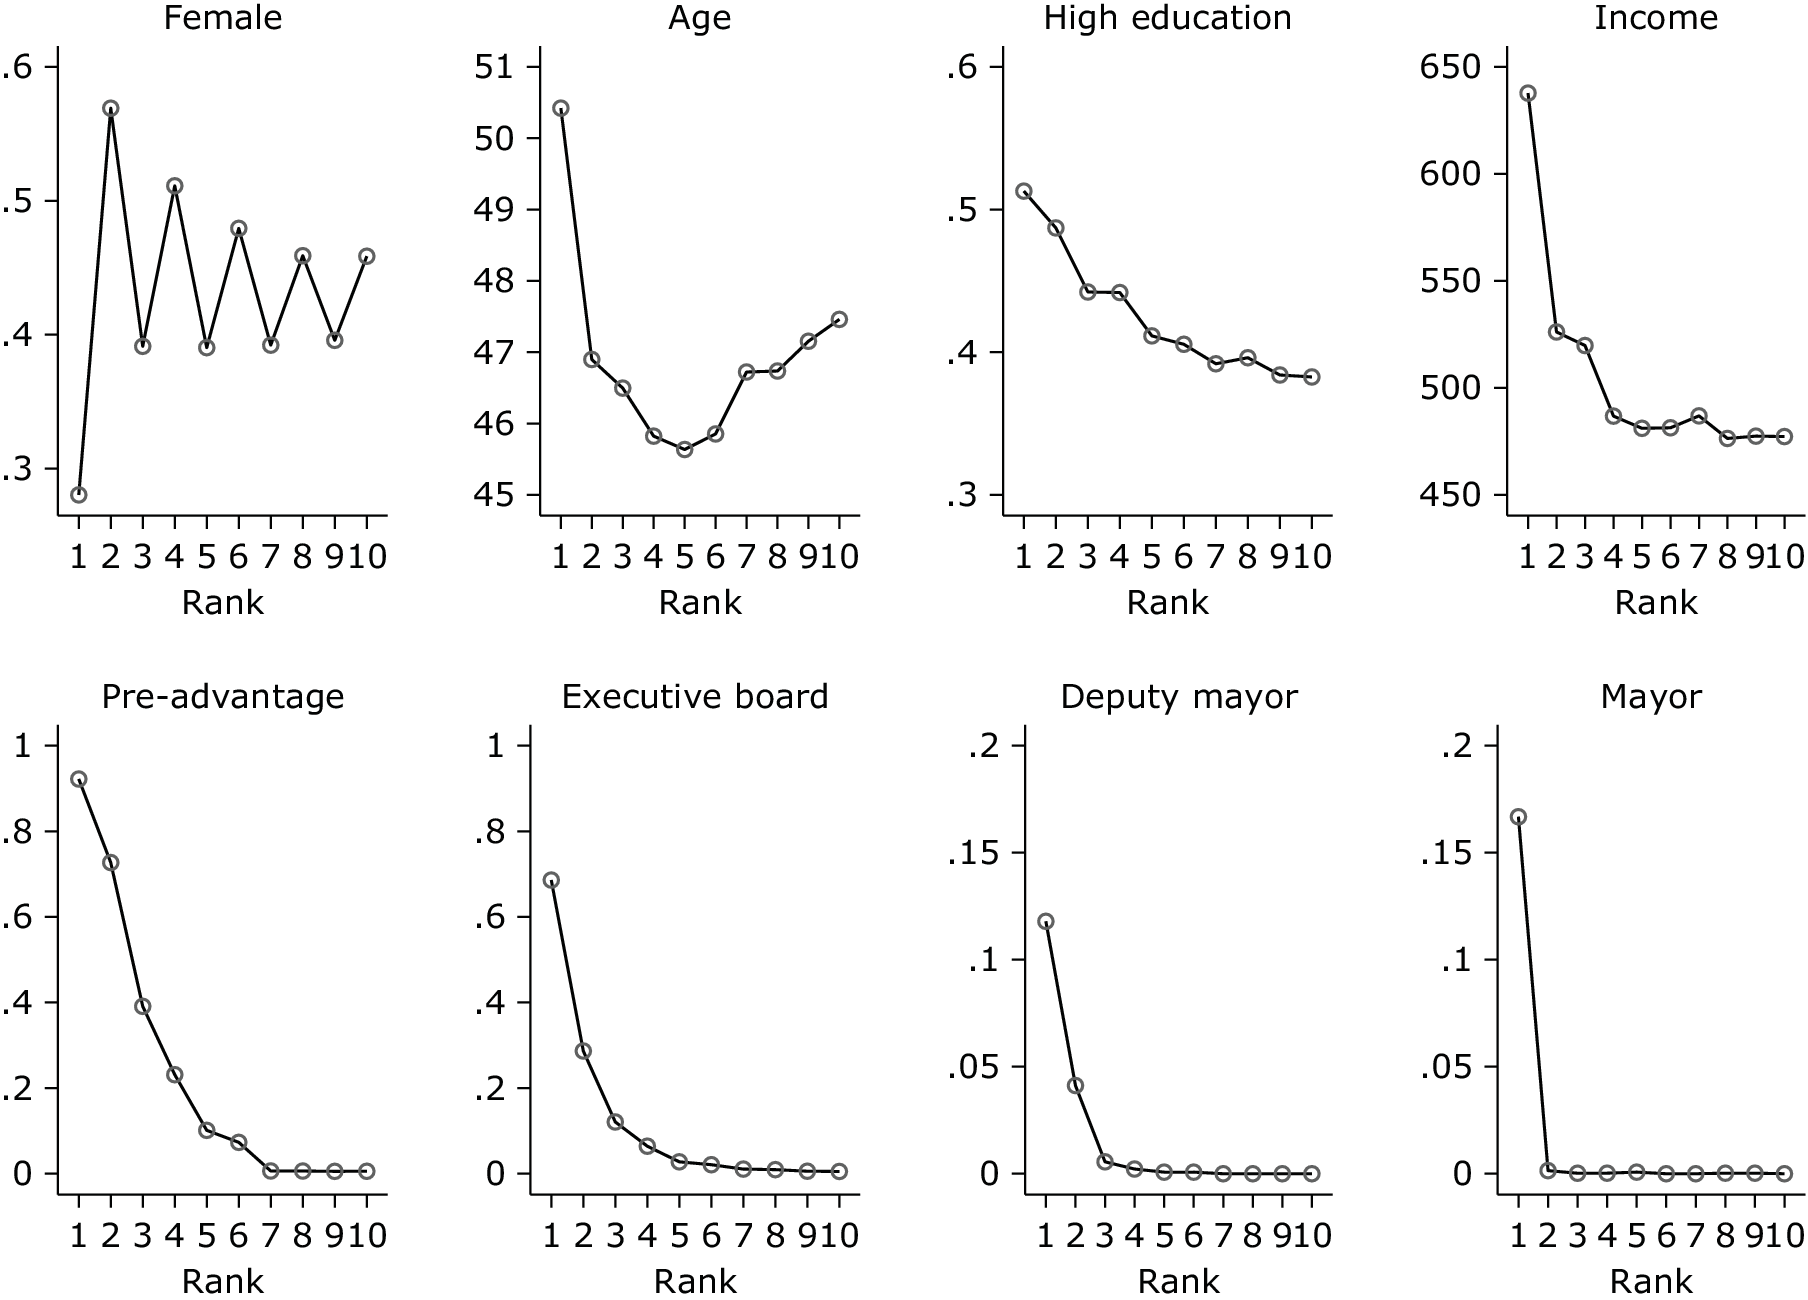
Figure 4 provides some descriptive statistics on how the rank on a party’s local list relates to candidate background features (top row) and local electoral outcomes (bottom row) using our baseline sample. In the top row, on the far left, we see that women get less than 30% of the top spots on parties’ lists. The saw-toothed pattern suggests that many parties are alternating, listing a man in first spot, a woman in second spot, and so on. The next column in the top row shows that the first-ranked candidates on local lists are, on average, several years older, with age generally declining with list rank. A similar pattern holds for education and income, which is highest for the top ranked candidates and declines with rank.
Candidate Background (Top-Panel) and Local Election Outcomes (Bottom Panel)

The bottom row of Figure 4 shows that the fraction of candidates that (i) have a pre-advantage, (ii) enter the executive board, and (iii) become deputy mayors monotonically decrease with list rank. The bottom-right panel shows that each party’s mayoral candidate is at the top of the list (in our sample). This feature is useful for identifying the returns to winning mayoral office.
National Election Data
Our national election dataset covers the universe of candidates participating in Norwegian national parliamentary elections during the postwar era (53,911 candidate-list-year observations). Our baseline data come from Fiva and Smith (Reference Fiva and Smith2017), which we supplement with information on key outcome variables: cabinet membership, bureaucratic posts, and administrative data on private income.
In our analyses of RQ3 and RQ4, we focus on candidates running for one of the seven main parties during the 1953–2013 period (N = 26,868). During this period, the district structure and seat-allocation method have been stable.Footnote 7 In 1989, Norway introduced a two-tier system, where first-tier seats are allocated proportionally to parties within each district based on party vote shares, and second-tier seats are given to parties that are underrepresented at the national level once the first-tier seats have been allocated.Footnote 8 Our RD analyses isolate the causal effect of winning a first-tier seat on future outcomes. Because some bare losers towards the end of our sample period win second-tier seats, our estimates should be interpreted as intention-to-treat estimates.Footnote 9
Main Results
Seniority Progression: From Councilor to Mayor
We first address RQ1, or whether winning local council office for the first time improves a candidate’s chances of advancing at the local level. Following Fiva and Røhr (Reference Fiva and Smith2018), we implement a within-list RD design, where we compare outcomes for candidates who are next in line to win a seat for party list
 $ l $
, with the last candidate winning a seat for the same list. To construct the forcing variable, we sort candidates based on their
 $ Pol{l}_{it} $
(see Equation 2) to get their within-list rank,
 $ {R}_{il} $
. The Win Margin (standardized by party votes for list
 $ l $
) is then given by
 $ {\displaystyle \begin{array}{ccc} WinMargi{n}_{il}=\left\{\begin{array}{cc}\frac{Pol{l}_{il}- Pol{l}_l^{S_l+1}}{PartyVote{s}_l}& \mathrm{if}\ {R}_{il}\le {S}_l\ \left[\mathrm{elected}\ \mathrm{candidates}\right]\\ {}& \\ {}\frac{Pol{l}_{il}- Pol{l}_l^{S_l}}{PartyVote{s}_l}& \mathrm{if}\ {R}_{il}>{S}_l\ \left[\mathrm{non}-\mathrm{elected}\ \mathrm{candidates}\right]\\ {}& \end{array}\right..& & \end{array}} $
Fiva and Røhr (Reference Fiva and Smith2018) document that a candidate who barely wins a seat in the local council has about a 9 percentage points (43%) higher probability of being elected in the next election compared with a candidate who just misses out on a seat on the same party list. They find that incumbents tend to advance in the party hierarchy and obtain safer ballot positions in future elections, which is what ultimately leads to electoral success. Here, it’s worth noting that incumbency advantage in local politics is not driven by voter response to popular candidates via personal votes; Fiva and Røhr (Reference Fiva and Smith2018) find instead that it is driven by re-nomination in safe spots. This is in line with existing evidence from the Nordic countries showing that incumbents are more likely to be re-nominated in, and win, future elections. Studies that focus on municipal elections in Denmark and Finland estimate an incumbency advantage of 3–13 percentage points (Dahlgaard Reference Dahlgaard2016; Kotakorpi, Poutvaara, and Terviö Reference Kotakorpi, Poutvaara and Terviö2017).
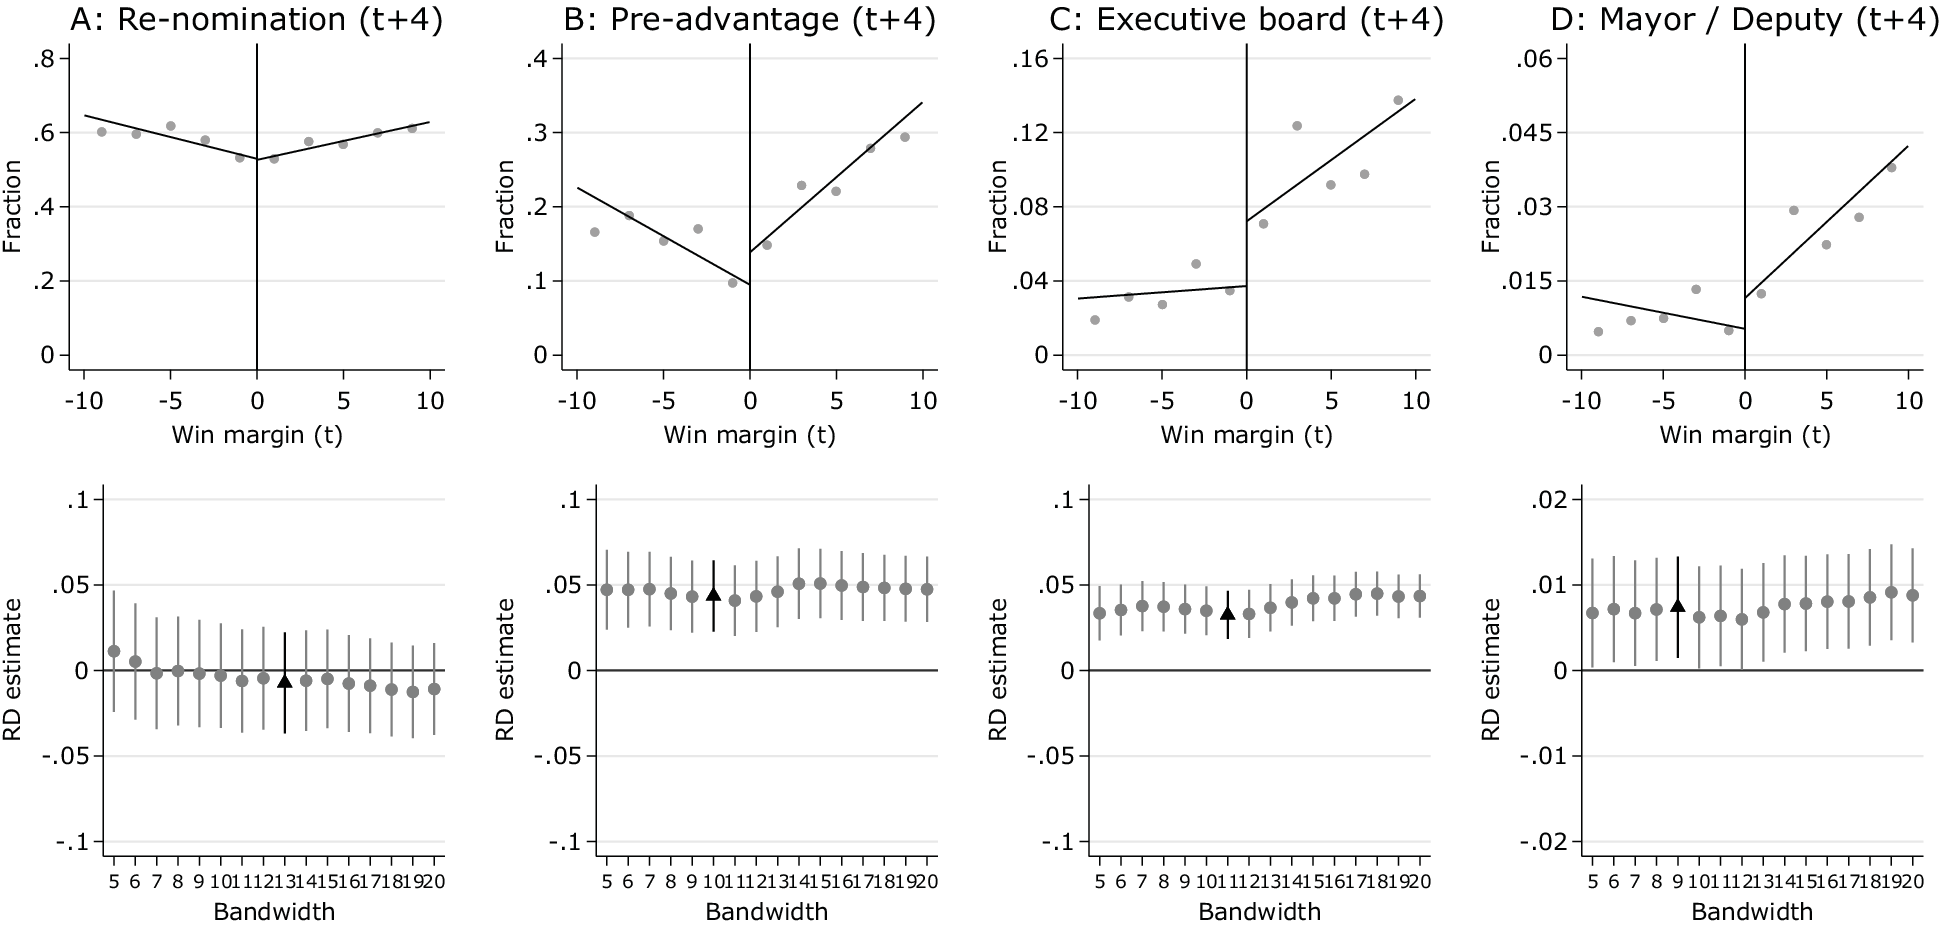
In our analysis, we focus on re-nomination in the next election and promotions to leadership positions in the next election term. Figure 5 provides the results. Incumbents and non-incumbents run again in the subsequent election at about equal rates (Panel A). However, incumbents are about 4 percentage points more likely to be awarded a “head start” than are non-incumbents (panel B), and about twice as likely to be promoted to leadership positions in the next election term (Panels C and D).Footnote 10
Analysis of RQ1: Seniority Progression at the Local Level

We should stress that these analyses do not condition on candidates seeking re-nomination. While the RD design makes it straightforward to estimate the effect of winning unconditional on running, estimating the conditional effect would require addressing selection into future candidacy (Anagol and Fujiwara Reference Anagol and Fujiwara2016). We examine unconditional effects in all our analyses and discuss the merits of that approach in the section on parliamentary lists.
Our within-list RD design rests on the implicit assumption that candidates do not have precise control over election results. If this assumption is satisfied, then winners and losers of close elections should be comparable ex ante. In the appendix, we demonstrate that pre-advantage status in the current election, as well as other predetermined characteristics, are indeed balanced at the cutoff (Appendix Figure A.3).
Seniority Progression: from Mayor to Parliamentary List
In this section, we explore our second research question, RQ2, which is the direct link between the intermediate and national levels. Here, we analyze whether being elected as mayor leads to future national success. We estimate the “mayoral effect,” using the following specification:
 $ {\displaystyle \begin{array}{ccc}{Y}_{rpmdt}={\gamma}_{pdt}+{\beta}_r+{\lambda}_r Mayo{r}_{pmdt}+{u}_{rpmdt}.& & \end{array}} $
Here,
 $ {Y}_{rpmdt} $
represents a future electoral outcome for the candidate ranked
 $ r $
for party
 $ p $
in municipality
 $ m $
belonging to parliamentary district
 $ d $
at time
 $ t $
. We consider three outcome variables: (i) ever running for national office (
 $ Run $
), (ii) ever winning national office (
 $ Win $
), and (iii) accumulated days served as an MP or deputy MP as of March 2019 (
 $ Days $
). As in the previous section, we do not restrict attention to those seeking re-nomination. The model controls for party-district-year fixed effects (
 $ {\gamma}_{pdt} $
) and rank fixed effects (
 $ {\beta}_r $
);
 $ {u}_{rpmdt} $
is an error term.
The coefficients of primary interest are
 $ {\lambda}_1,\dots, {\lambda}_R $
, where
 $ R $
is the maximum rank on a list.
 $ Mayo{r}_{pmdt} $
is a dummy variable capturing whether party
 $ p $
in municipality
 $ m $
of district
 $ d $
at time
 $ t $
wins the mayoralty. In our sample, all candidates that become mayor are listed in the first position (
 $ r=1 $
). The parameter
 $ {\lambda}_1 $
therefore isolates the effect of becoming mayor by comparing outcomes for mayors with outcomes for other first-ranked candidates running for the same party in the same parliamentary district in the same election year (in a different municipality).
It is not obvious that estimates based on Equation 4 will capture the causal effect of becoming the mayor on the outcomes of interest. Party lists that win the mayoralty might differ from party lists that do not win, in many respects that might matter for candidates’ future political careers. Estimates of
 $ {\lambda}_2,\dots, {\lambda}_R $
will be informative in this regard. Any list-specific factor that benefits all candidates on a list will produce positive values for all the
 $ \lambda $
’s. If
 $ {\lambda}_1 $
is larger than the other
 $ \lambda $
’s, then this suggests that becoming mayor improves a politician’s future outcomes.
Figure 6 presents the results. The first row plots averages for lists, with and without the mayor, by list rank of the candidate (we restrict attention to the first ten spots on each list, 62,000 observations). The left column (“Run”) shows that first-ranked candidates who become mayor are about 15 percentage points more likely to run for parliament than first-ranked candidates who do not become mayor. In contrast, candidates ranked lower than first get no benefit from their party winning the mayoralty. So, the “mayoral boost” benefits only the mayor, not the other candidates on his/her list. The second column shows about a 2.5 percentage point boost in winning parliamentary office for mayors. Finally, the third column shows that mayors spend about six times more lifetime days in parliament than do first-ranked candidates on lists that do not win the mayoralty.
Analysis of RQ2: Seniority Progression from Mayor to National Politics

In interpreting these results, the reader should keep in mind that, in any given year, there are about
 $ \mathrm{11,000} $
local councilors chasing only
 $ 169 $
seats in parliament. These numbers naturally limit the size of any seniority progression effects. In the top ten listed candidates, the baseline probability of running for parliament is
 $ 0.056 $
, the baseline probability of winning a parliamentary seat is
 $ 0.002 $
, and the average number of days served in parliament is four. The effects reported above look relatively large when judged against these baselines.
The second row of Figure 6 plots the
 $ {\lambda}_r $
coefficients, for
 $ r=1,\dots, 10 $
, along with
 $ 95\% $
confidence intervals. As can be seen, the only consistently significant effects are those comparing mayors with other first-ranked candidates.Footnote
11 In Appendix Table A.2, we also show results when adding further controls. We find that (i) younger candidates as well as (ii) those candidates that receive a larger share of the personal votes cast for his/her party are more likely to continue to national politics. However, controlling for these factors leaves the estimated “mayoral effects” basically unaltered.Footnote
12 In sum, this provides evidence that seniority-based selection is at work.
Incumbent Re-Nomination and Re-Election
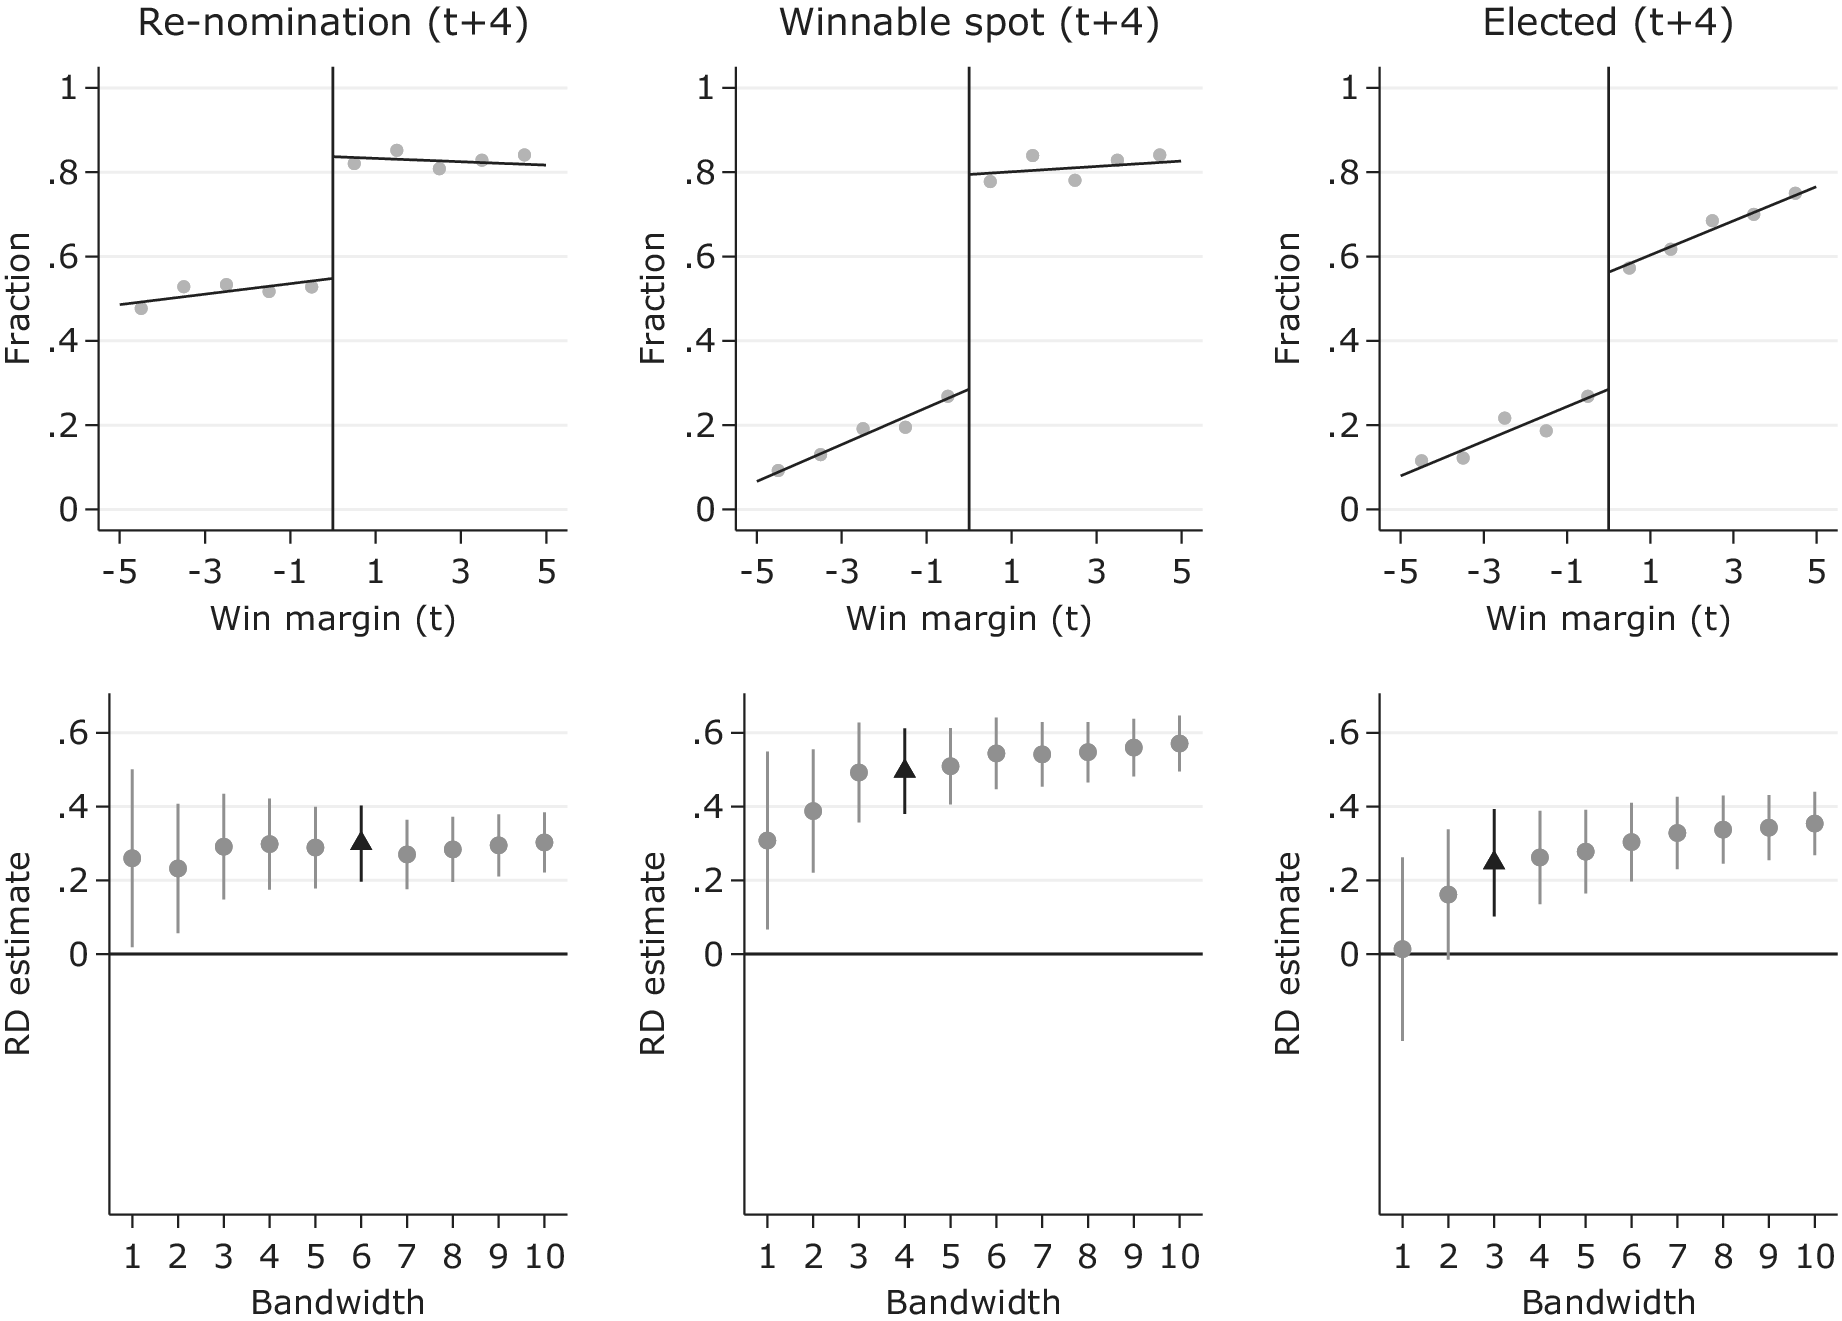
Next, we address RQ3, and examine whether those who are elected to parliament for the first time are more likely to secure a winnable spot in the next election. Figure 7 provides RD plots for re-nomination overall (left-hand plot), re-nomination in winnable spots (central panel), and re-election at the next general election held in year
 $ t+4 $
(right-hand plot) for candidates running for one of the seven main parties in Norway during the 1953–2013 period.Footnote
13 We limit the RD analysis to candidates less than 5 percentage points away from the seat threshold in the current election who neither previously won a seat in parliament nor came close to doing so (i.e., came within the 5 percentage point window) and who never served as a cabinet minister.
Analysis of RQ3: Incumbent Re-Nomination and Re-Election

As in the previous two sections, we do not condition on candidates seeking re-election, following recent practice in the literature (e.g., Dahlgaard Reference Dahlgaard2016; Hyytinen et al. Reference Hyytinen, Meriläinen, Saarimaa, Toivanen and Tukiainen2018b). The problem with conditioning on rerunning is well-explained by De Magalhaes (Reference De Magalhaes2015, 114), who notes that “runners-up who rerun are disproportionately those that foresee doing better in the next election.” Thus, even if all bare losers and all bare winners are balanced by the RD design, the bare losers who rerun need not be comparable to the bare winners who rerun.
The left-hand panel of Figure 7 shows that narrowly elected candidates are about
 $ 25 $
percentage points more likely to win re-nomination than narrowly losing candidates. Even more strikingly, the narrowly elected candidates are more than twice as likely to be re-nominated in a winnable spot than narrowly losing candidates (central plot).Footnote
14 This provides clear evidence for the use of incumbency re-nomination rules.
In our theory, incumbents should benefit not just from a higher probability of securing re-nomination in their current list spot (incumbent re-nomination), but also from a higher probability of advancing up the list, should spots become open (seniority progression). Our RD analysis of election in year
 $ t+4 $
(given in the right-hand panel of Figure 7) provides an estimate of how winning in year
 $ t $
affects a candidate’s probability distribution across list ranks.
To explain, let
 $ {z}_t $
denote the win margin at
 $ t $
and
 $ {p}_{r,t+4}\left({z}_t\right) $
be a candidate’s probability of securing list rank
 $ r $
at time
 $ t+4 $
, conditional on their lagged win margin. Let
 $ {w}_{r,t+4} $
be the probability of winning if nominated at rank
 $ r $
at time
 $ t+4 $
. We view candidates who fail to secure any re-nomination as receiving a rank
 $ 0 $
that confers a probability
 $ {w}_{0,t+4}=0 $
and denote their probability of receiving that position by
 $ {p}_{0,t+4}\left({z}_t\right) $
. A candidate can end up in rank
 $ 0 $
through death, voluntary withdrawal from electoral politics, or by seeking but failing to secure a spot on the list. Otherwise, they receive a position
 $ r $
 $ \in $
 $ 1,\dots, R $
.
Given the notation just introduced, the unconditional probability of winning at time
 $ t+4 $
can be written as
 $ \sum {p}_{r,t+4}\left({z}_t\right){w}_{r,t+4} $
. Our RD recovers the change in
 $ \sum {p}_{r,t+4}\left({z}_t\right){w}_{r,t+4} $
at the discontinuity (
 $ {z}_t=0 $
). This change summarizes how winning affects a candidate’s chances of securing list rank
 $ 0,1,\dots, R $
while weighting each position by the candidate’s probability of winning a seat given that position. The more that winning depresses
 $ {p}_{0,t+4} $
, raises the probability of re-nomination in the same list position, and improves the chance of securing a better list position, the larger the effect of winning at
 $ t $
on winning at
 $ t+4 $
will be. Thus, an unconditional analysis of winning allows us to assess the combined effects of incumbent re-nomination and seniority progression. The right-hand panel of Figure 7 shows a clear discontinuity in the probability of winning a seat in the next general election (as in Fiva and Smith Reference Fiva and Smith2018).
Obtaining Higher Office
Parties that regularly win power at the national level are in a position to allocate cabinet portfolios and other high offices. Do Norway’s seven main parties incorporate such offices into their seniority systems? To investigate this question, we look at promotion to a cabinet position (the highest post behind prime minister) and promotion to county administrator (fylkesmann), a top-level bureaucratic post (RQ4).Footnote 15
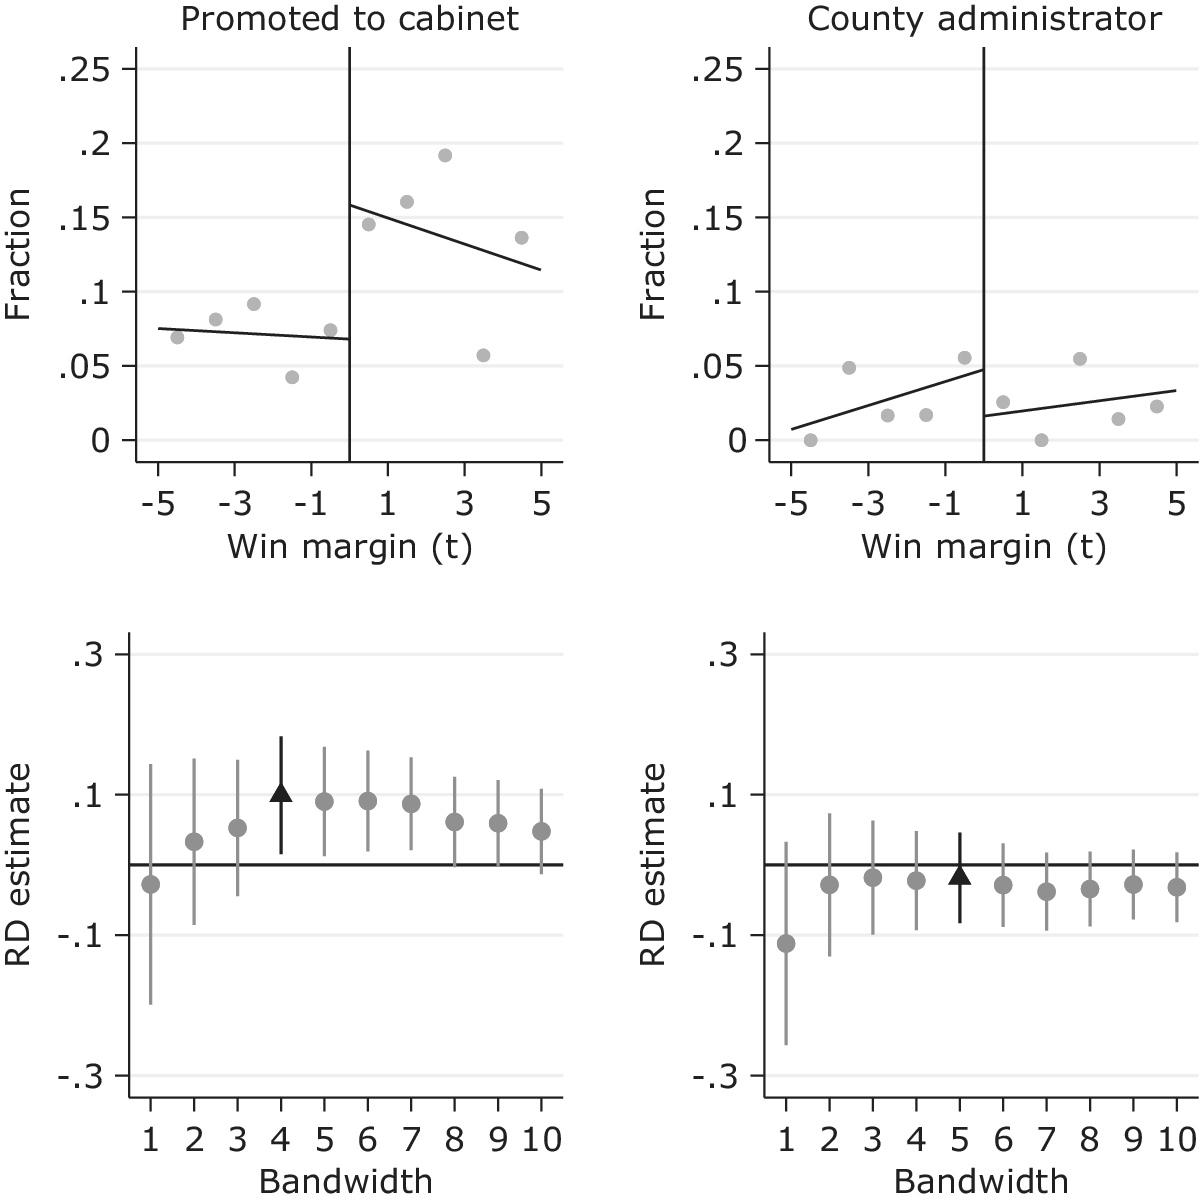
Figure 8 provides our RD analysis. The dependent variables are dummies that take a value of one if the individual was ever promoted to a cabinet position or a top-level bureaucratic post, respectively, in their career. In line with our expectations regarding seniority, we find that narrowly winning a seat in parliament roughly doubles candidates’ chances of obtaining a cabinet position in the future. The RD estimate for county administrator is negative but not statistically significant. Our findings may be related to the differences in prestige for the two types of offices. While cabinet promotions should be considered an apex of a political career, county administrators are often used as a “retirement post.” Becoming a county administrator is also a much rarer event. In our sample period, there are only 19 positions in the country, and appointees often remain in office for decades.
Analysis of RQ4: Seats in Parliament and Higher Offices

Seniority versus Skills
We have shown that re-nominations in Norway’s office hierarchy are consistent with the hypothesis that the main parties operate under seniority systems. The research designs used in the prior section effectively ensure that time-invariant candidate characteristics relating to baseline skill are netted out.Footnote 16 However, it remains possible that politicians develop their human capital each time they serve a term in office and that parties award nominations based on accrued human capital rather than seniority per se. As in labor economics, retention or promotion based on accrued human capital is difficult to distinguish from retention or promotion based on seniority (Altonji and Shakotko Reference Altonji and Shakotko1987; Topel Reference Topel1991).
One way to distinguish between skill-based and seniority-based nominations is to recall the RD estimates from the “Incumbent Re-Nomination and Re-Election” subsection, where we found a significant incumbency advantage. For human capital accumulation to explain those results, narrowly elected new incumbents must establish large skill advantages over barely losing candidates during their first term in office. We explore the plausibility of “rapid” skill acquisition, in particular by considering mid-term substitutes for deceased MPs. Another way to distinguish between skill-based and seniority-based nominations is to leverage data on intra-party competition for nomination spots. We take both these approaches in the following subsections.
Intra-Party Competition for List Nomination
One option is to investigate how competitive a party’s nominations are. Since safe spots on a closed list virtually guarantee a seat in parliament, those working in the Schattschneiderian (Reference Schattschneider1942) tradition would expect them to be contested. As Ranney (Reference Ranney, Butler, Penniman and Ranney1981, 103) puts it, “The most vital and hotly contested factional disputes in any party are the struggles that take place over the choice of its candidates.” We thus collected original data on competition for spots in the 2017 election, coding intra-party contests using both newspaper coverage of the nomination meetings and information we gathered from contacting local party organizations. We have 1,955 candidate-level observations, of which 97 were contested.
In the 2017 election, we find that 15% of winnable spots were contested (see Appendix Figure A.9). In contrast, about 75% of “open” nominations in the US House are typically contested (Boatright Reference Boatright2014, 118). We view the level of competition in Norway, which is clearly well below that in the United States, as too low to be consistent with a model in which all winnable nomination spots are subject to open competition.
We also find that, when a fight over a nomination spot occurs, it typically involves two contestants who have similar experience with holding elective office. If we classify candidates into four strata—(1) no previous elective office, (2) previous experience at the local (entry) level but no higher, (3) previous experience as mayor or regional councilor (intermediate) but no higher, and (4) previous experience as an MP or minister (top)—we find that contestants for nomination spots are from the same category of seniority in 52% of the cases (Table 1). The relative rarity of contests, as well as the consistent tendency for contestants to be matched in terms of a crude proxy for seniority, are both consistent with the parties having fairly well-understood “career paths” that help sort out who has the best claim to open nominations. Unfortunately, the matching pattern just described could arise either because parties have well-understood “career paths” or because candidates of similar seniority have accrued similar human capital (including office-holding experience). So, we need to explore the issue of skill acquisition more carefully.
Intra-Party Competition over Nomination

Note: Data comes from an original survey of nomination meeting newspaper coverage and contact with party organizations. The sample is limited to candidates running for one of the seven main parties in the 2017 election. Out of the 1,955 potentially contested spots, we identify 97 intra-party fights over nomination spots. We exclude three cases where we lack information about the losing candidate. The diagonal represents head-to-head seniority matchups, across four categories: No: no previous elective office, Entry: previous experience at the local level but no higher, Intermediate: previous experience as mayor or regional councilor but no higher, and Top: previous experience from parliament or cabinet.
Party-Specific Assets
Some readers might worry that serving one term in office affords a unique opportunity to develop knowledge, skills, and personal contacts that will be relevant to earning re-nomination or promotion. This would be analogous to the literature showing that re-nomination of incumbents in the European Parliament depends on skill acquisition, seniority held constant (Frech Reference Frech2016; Hermansen Reference Hermansen2018; Wilson, Ringe, and van Thomme Reference Wilson, Ringe and van Thomme2016).
In order to address these concerns, we introduce a conceptual distinction that clarifies what our estimand is. The skills that are most likely to improve a politician’s nomination and advancement are all party specific (i.e., nontransferable to other parties). For example, knowing the rules of party A’s nomination process and cultivating relationships with those in party A who influence nominations are both directly relevant to re-nomination and promotion (when those processes are competitive). But knowing party A’s rules and selectors does not help win nomination in another party, which will have different rules and selectors. Other examples of party-specific assets include contacts with donors, activists, and leaders who can offer “revolving door” opportunities at the end of one’s career.
An important feature of all these party-specific assets is that, to the extent they are valuable, they help tie politicians to their parties and make deselection more effective as a disciplinary tool. They are akin to bonds that can be collected only if the politician remains in his or her party. Thus, we think of the relevant estimand for our analysis as the sum of all the party-specific assets a member has that improve his or her future re-nomination and promotion prospects. (In our earlier model,
 $ {s}_{it} $
now represents a combination of
 $ i $
’s seniority ranking as of
 $ t $
and
 $ i $
’s other party-specific assets, such as knowledge of party influentials, as of
 $ t $
.)
The remaining inferential threat can be stated as follows. Perhaps local councilors in their first terms acquire transferable assets (
 $ {q}_{\mathrm{it}} $
), such as knowledge of how the council operates or of how intergovernmental fiscal transfers are handled, and these transferable assets confer a sharply larger advantage in securing re-nomination or future leadership positions. One response is as follows. If transferable assets such as those just described are highly valued by party nominators and uniquely accessible to incumbents, then incumbents should be able to sell their services to the highest bidder at each election. We should observe both party switching and overt competition for nomination slots.
Yet we see neither in Norway. As noted above, visible competition for parliamentary nominations is rare. Moreover, even though the ideological distances among adjacent parties are small (see Appendix Figure A.2), party switching at both the local and national level is extremely rare. For example, only 13 of 1,108 Norwegian MPs (1%) ever switched among main parties during their parliamentary careers over the postwar era. Meanwhile, among the 9,517 local councilors and 397 mayors elected for one of the main parties in 2003, only 80 councilors and one mayor run for a different party in the next local election (see Appendix Figure A.10).
Further, we can test an asset-based explanation directly by exploiting exogenous, within-term changes of elected representatives—via substitute MPs. If non-party-specific assets drive politicians’ ability to secure nominations and promotions, then substitutes who replace MPs late in a parliamentary term should have little time to learn on the job and thus little advantage over other losing candidates.
In order to investigate whether this expectation holds, we identified all substitutes for MPs who died during the period 1953–2013 (the sample period used in the prior section). From this initial sample, we subtracted substitutes who had previously been elected to parliament as well as those who entered parliament so late that the parliamentary lists had already been decided. This left us with a sample of 32 substitutes with no previous electoral success who entered prior to list finalization due to a plausibly exogenous event (the death of their predecessor).Footnote 17
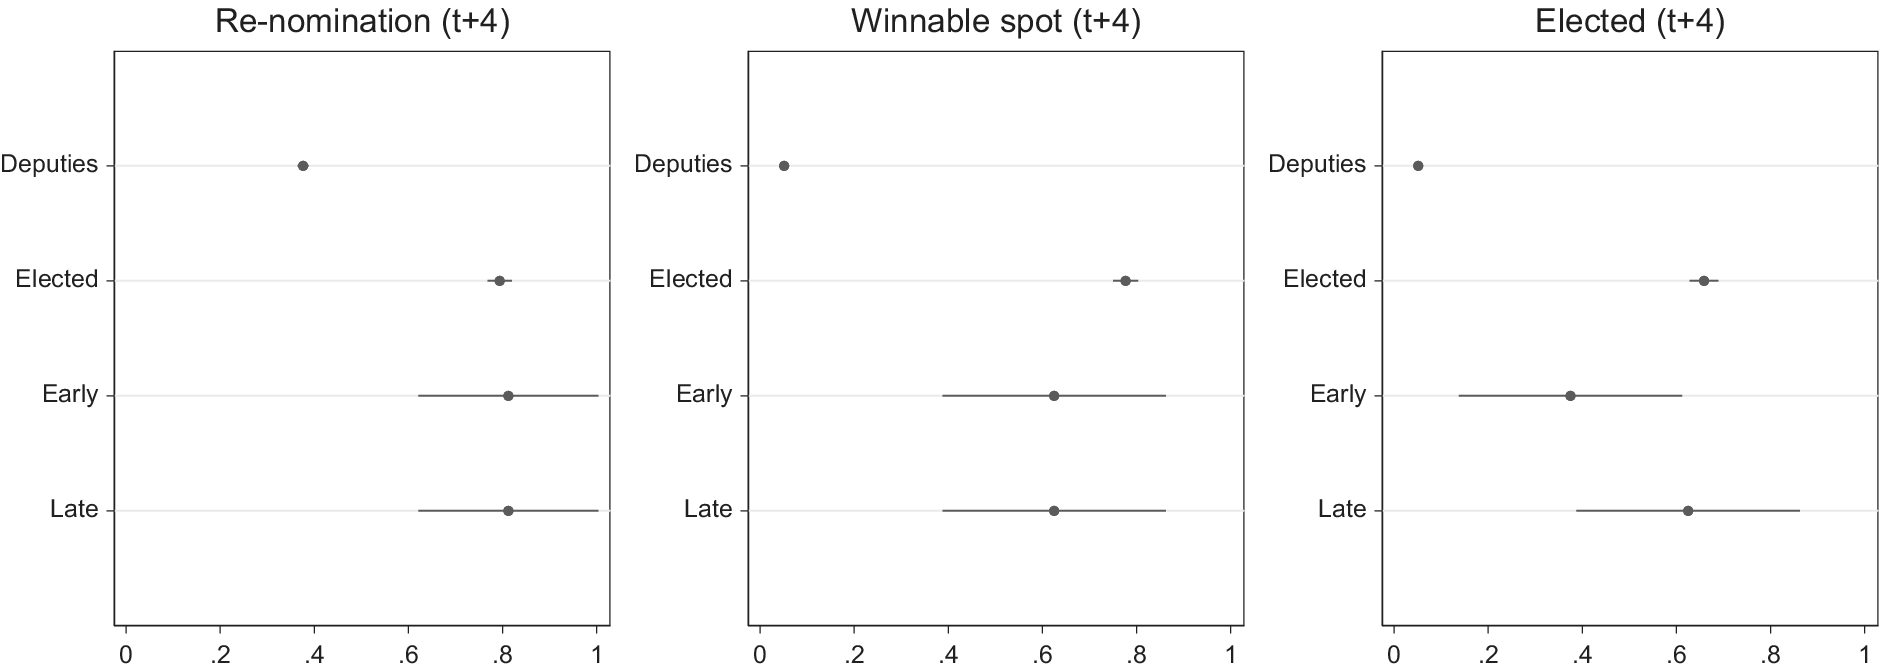
These substitutes entered parliament at widely varying times, from 21 days after the start of the session to 1,233 days after. For purposes of analysis, we split the sample at the median into 16 who entered “early” (within 716 days from the start of parliament) and 16 who entered “late” (717 or more days after). In Figure 9, we show these two groups of substitutes compared with other deputy MPs, and to all winning candidates, in terms of their probability of being nominated at the next election, their probability of securing a winnable spot at the next election, and their probability of re-election.Footnote
18 As can be seen, the early and late substitutes are indistinguishable from one another, and also from the winning candidates, in terms of nomination; all three groups had about an 80% chance of securing nomination at
 $ t+4 $
, significantly higher than the baseline group of 6,542 deputies that did not replace an MP who died in office.
National-Level Re-Nomination, Overall and in Winnable Spots, by Four Categories

In terms of winnable spots at
 $ t+4 $
, the early and late substitutes are again indistinguishable from each other. While both groups have a discernibly lower probability of landing a winnable spot at
 $ t+4 $
than do winning candidates (at
 $ t $
), the difference is not very large substantively (about 15 percentage points). Moreover, both groups of substitutes are much closer to elected candidates than to deputy MPs that did not replace MPs dying in office.
Finally, the early and late substitutes are again more similar to MPs than to other deputy MPs in their re-election rates. While the two groups of substitutes do differ, the difference is opposite to what one would expect under a human capital story, as the early substitutes (who have more time to acquire skills) have a lower re-election rate.Footnote 19
The late substitutes had relatively little time to acquire on-the-job skills before their parties made their nomination decisions. For example, four of them entered parliament within six months of the March 31st date at which lists have to be finalized. Since district parties start their nomination processes well before March 31st, these four had well less than half a year to acquire a skill advantage over their rivals for nomination. To explain our findings in terms of non-party-specific human capital, then, one would have to argue that substitutes learn very quickly.
All told, we think that the rarity of visible competition for nominations, the rarity of party switching, and the fact that substitutes who enter parliament late in the term have much better outcomes than other deputy MPs are all inconsistent with the hypothesis that the acquisition of non-party-specific human capital drives nomination decisions. Nor does it seem plausible that the patterns we have documented are driven by party-specific assets such as knowing the party’s selectors and selection rules. Any candidate, winning or losing, can read the party’s nomination rules and cultivate relationships with party activists, leaders, and selectors. Thus, the only plausible explanation for the patterns we have documented is that winning Norwegian candidates accrue seniority within their respective parties, which then enhances their re-nomination and progression prospects.Footnote 20
Economic Returns to Office
Our notion of a hierarchy of nominations and offices includes the possibility of post-political “revolving door” employment (Bertrand, Bombardini, and Trebbi Reference Bertrand, Bombardini and Trebbi2014; Blanes i Vidal, Draca, and Fons-Rosen Reference Vidal, Jordi and Fons-Rosen2012; Geys and Mause Reference Geys and Mause2013). Estimating the returns to office requires comprehensive data on politicians’ wealth, which can be challenging to obtain; however, we are able to exploit detailed Norwegian data on politician income, at both the national and local level and across time. In this section, we look at the returns to office across the nomination hierarchy, and when they accrue, as an indirect way to explore whether such employment opportunities are common in Norway.
First, we consider the economic returns to holding a local office. At this level, the expectations of the potential financial value of political office are less clear—in Norway and many other countries, being a local politician is a part-time position held concurrently with other sources of income (Djankov et al. Reference Djankov, Porta, Silanes and Shleifer2010). In line with previous studies from the other Nordic countries (Berg Reference Berg2020a; Kotakorpi, Poutvaara, and Terviö Reference Kotakorpi, Poutvaara and Terviö2017), we find no evidence that winning a seat in the local council affects future individual incomes (Appendix Figure A.12).
What about the economic returns to winning an intermediate post? Appendix Figure A.13 displays the results from a difference-in-differences research design for mayoral candidates participating in the 2011 local election. In 2011, when mayors enter office towards the end of the year, their income jumps up. In the years with “full treatment” (2012–2014), mayors get an income boost of about NOK 200,000 (USD 22,000) per year. Unless they are re-elected, mayors leave office towards the end of 2015, and their incomes fall back in 2016–2017 (Appendix Figure A.14). These results not only contribute to the larger literature on returns to office but also demonstrate the present value of even intermediate steps in the nomination hierarchy.
Finally, we can consider the economic returns to office at the national level in Norway using the same estimation framework as in the main results section. In Appendix Figure A.15, we document substantial returns from serving in the national parliament. In the years following an election, elected candidates get an income boost of about NOK 150,000 per year.Footnote 21 This result joins a larger literature that generally finds positive returns to holding a national office across a number of different countries.Footnote 22 As in the case of the intermediate post, these income effects appear to only last during the candidates’ tenure in office, like in Finland and Sweden (Berg Reference Berg2020b; Kotakorpi, Poutvaara, and Terviö Reference Kotakorpi, Poutvaara and Terviö2017).
Are Seniority Systems Stable?
A natural question about seniority systems concerns their stability. Will central party leaders honor seniority, even in cases where doing so requires promoting less-skilled candidates (Hollyer, Klašnja, and Titiunik Reference Hollyer, Klašnja and Titiunik2018)? Will party members who participate in the nomination process at the local level honor seniority?
As regards the latter question, McKelvey and Riezman (Reference McKelvey and Riezman1992) suggest a positive answer. If local nominators believe that their party operates according to a seniority system, then they will value having local candidates with higher seniority. As between two otherwise identical local candidates, the one with more seniority will be expected to progress into the cabinet (or other high offices) faster than the one with less seniority. Thus, seniority per se becomes a reason for local nominators to prefer a candidate over his/her intra-party rivals.
What about central party leaders? In the short run, they might prefer a nomination procedure in which they could nominate whomever they wished. However, such a system would deprive them of the ability to make credible long-term commitments to their followers, thereby weakening the party. Thus, if leaders have long enough time horizons, they should honor any commitments they make to decide nominations based on seniority. It is also worth reviewing the benefits to seniority systems, which would incentivize their use. What benefits might political leaders accrue by building seniority systems? Although it is beyond the scope of the current essay to fully discuss them, we can mention some prominent possible benefits—which help to motivate our study.
First, seniority procedures avoid internecine fights for nominations. Safe spots on closed lists are very valuable and, were they awarded via some open competition, internal party factions would strive to win them (Cross and Katz Reference Cross and Katz2013; Gallagher and Marsh Reference Gallagher and Marsh1988). Seniority systems are one way to lessen such competition, which may be unproductive for the party as a whole.
Second, promises of future safe nominations (and hence office payoffs) can induce candidates given safe list spots to exert current campaign effort. This is an important effect since such candidates otherwise have negligible incentives to campaign hard. Cox et al. (Reference Cox, Fiva, Smith and Sørensen2020) elaborate on this point, focusing especially on seniority-based promotions into cabinet positions, and a similar logic applies to the connection between seniority-based allocations to prominent committees.
Third, seniority systems can stabilize parties’ memberships. Those who contemplate leaving would have to sacrifice their seniority (or negotiate to have it honored by their new party). Consistent with this observation, we have shown that Norwegian politicians very rarely switch parties. Stable membership, in turn, is key for building durable and institutionalized parties (Hazan and Rahat Reference Hazan, Rahat, Katz and Crotty2006).
Fourth, promises of future safe nominations (and hence office payoffs) can induce incumbents to vote with their party. Many scholars have noted that threats of deselection can induce voting cohesion (e.g., Kam Reference Kam2009). Such threats should be particularly potent in systems in which nomination is tantamount to election and party leaders exert centralized control over nominations. On the other hand, any factor that reduces the central party leadership’s control over nominations should reduce the price in effort and loyalty that it can demand. For example, dual mandates make a party “less liquid,” in the sense that the expected flow of valuable nominations it has to allocate shrinks, which in turn reduces politicians’ incentives to invest in party institutions (Cirone Reference Cirone2020).
Fifth, to the extent that seniority is weighed more heavily when the party makes nominations to higher offices, entry is increasingly restricted. In a purely meritocratic system, senior politicians would have no intrinsic advantage over either their juniors or “populists” (who build a career in the private sector and then seek a party’s nomination). In a seniority system, in contrast, both juniors and populists face a barrier to entry that grows with the importance of the office they might seek. As do all barriers to entry, the barrier to competition for a party’s nominations should increase the rents that senior politicians can extract from their offices, especially when nomination is equivalent to election. That said, rent extraction will obviously depend on how “good standing” is defined in each party—who defines the party’s legislative position to which loyalty is demanded, and who judges whether the electoral effort exerted by nominees is adequate.
Given the variety of benefits that building seniority systems might afford to party leaders, it would seem plausible that many would have considered them. We have provided initial evidence that Norwegian parties appear to operate via seniority procedures. If seniority systems are to be put on the scholarly agenda, it will be important to further bolster our ability to detect them and to explore their systemic effects.
Conclusion
In this paper, we have hypothesized that parties in closed-list electoral systems have significant incentives to build seniority systems to allocate nominations and offices among their members, and we have begun to provide a suite of tools that could be used to identify when such systems are in place. Given that a large proportion of advanced democracies operate under closed-list proportional representation, if we are correct that many parties in such systems use seniority in allocating their valuable list spots, then the absence of any mention of such systems in standard surveys (e.g., Gallagher and Marsh Reference Gallagher and Marsh1988; Norris Reference Norris and Norris1997) would suggest a significant gap in the existing literature.
Our approach to identifying the existence of seniority systems also intersects with an extensive literature that examines incremental moves in political careers—does a politician get re-nominated (static ambition), and does s/he get promoted (progressive ambition)? Our work also contributes to a large literature on incumbency effects. Numerous studies have documented a significant incumbency advantage in the United States and other majoritarian settings in terms of both an increased vote share and higher probability of winning the next election.Footnote 23 And while this question has been addressed in candidate-centered systems, prior findings from candidate-centered environments are very different from those in closed-list electoral systems. In this context, we raise an important question: why does incumbency predict re-nomination and promotion? Our answer is that it is important to consider how seniority systems, both seniority progression rules and incumbent re-nomination norms, help to prioritize prior experience holding political office.
Our findings open up a number of interesting avenues of inquiry, yet to be explored. For example, it is possible that there might be inter-party differences in how seniority systems operate. The value of seniority promotion should be constant across parties of all ideological shades; however, there could be interesting variation across parties in their usage due to historical circumstances, internal party organization, or the age of the party. If parties in new democracies adopt seniority procedures, there could be interesting spillover effects to other groups in the system regarding early professionalization or discipline. Finally, our results also demonstrate the need for more data collection and surveys for parties, specifically about internal party norms, re-nomination procedures specifically for incumbents, and the extent to which party elites consider seniority, across cases. It would also be useful to collect more information on the extent to which voters respond to cues about seniority or how lists reflect seniority progression in the electoral arena.
Supplementary Materials
To view supplementary material for this article, please visit http://dx.doi.org/10.1017/S0003055420000416.
Replication materials can be found on Dataverse at: https://doi.org/10.7910/DVN/VWFKDG.
















Comments
No Comments have been published for this article.