1 Introduction
Mankind has been dreaming to fly for centuries. However, the fundamental flying mechanism had not been understood until the pioneers of aerodynamics, such as Kutta and Joukowski (Milne-Thomson Reference Milne-Thomson1958), connected lift generation to the circulation of an airfoil in the steady sense. Over the last several decades, in order to design high-performance micro aerial vehicles (MAVs), major research effort has been focused on unveiling the unsteady aerodynamic secrets of insects and birds that have demonstrated unrivalled manoeuverability and agility. Early researchers (Ellington Reference Ellington1984; Dickinson & Gotz Reference Dickinson and Gotz1993) have attributed the high lift performance of the natural flyers to an attached leading-edge vortex (LEV). Later, numerous investigations (Liu & Kawachi Reference Liu and Kawachi1998; Dickinson, Lehmann & Sane Reference Dickinson, Lehmann and Sane1999; Sun & Tang Reference Sun and Tang2002; Wang, Birch & Dickinson Reference Wang, Birch and Dickinson2004; Lua, Lim & Yeo Reference Lua, Lim and Yeo2008; Kim & Gharib Reference Kim and Gharib2010; DeVoria & Ringuette Reference DeVoria and Ringuette2012; Cheng et al. Reference Cheng, Sane, Barbera, Troolin, Strand and Deng2013; Liu et al. Reference Liu, Cheng, Sane and Deng2015a ; Polet, Rival & Weymouth Reference Polet, Rival and Weymouth2015; Onoue & Breuer Reference Onoue and Breuer2016; Xu & Wei Reference Xu and Wei2016) have been carried out to study the dynamics of the wake vortices as well as its effects on force generation for wings or airfoils undergoing unsteady motions, such as accelerating, pitching, flapping, etc.
For theoretical investigation, inviscid potential flow together with vortex methods have been extensively applied to provide a reduced flow model without solving the Navier–Stokes equation. For example, Minotti (Reference Minotti2002) adopted a virtual coordinate frame to develop an unsteady framework for a two-dimensional (2-D) rotating flat plate and employed a single point vortex to emulate the effect of the LEV. However, the single vortex was still modelled in a quasi-steady manner that the location and circulation of the vortex are fixed during the movement of the plate. Michelin & Smith (Reference Michelin and Smith2009), Wang & Eldredge (Reference Wang and Eldredge2013) and Hemati, Eldredge & Speyer (Reference Hemati, Eldredge and Speyer2014) modelled the wake using finite sets of point vortices with varying strengths and evolving locations. This resulted in significant improvement in capturing the unsteady features of the flow; whereas the accuracy of the model is still limited, especially for cases with complex near-field wake patterns, due to the overly reduced modelling of the vortical structures. An alternative approach is to fully represent the wake vortex sheets in a discretized sense, using either point vortices or vortex panels as demonstrated by Katz (Reference Katz1981), Streitlien & Triantafyllou (Reference Streitlien and Triantafyllou1995), Jones (Reference Jones2003), Yu, Tong & Ma (Reference Yu, Tong and Ma2003), Pullin & Wang (Reference Pullin and Wang2004), Ansari, Zbikowski & Knowles (Reference Ansari, Zbikowski and Knowles2006a ,Reference Ansari, Zbikowski and Knowles b ), Shukla & Eldredge (Reference Shukla and Eldredge2007), Xia & Mohseni (Reference Xia and Mohseni2013a ), Ramesh et al. (Reference Ramesh, Gopalarathnam, Granlund, Ol and Edwards2014) and Li & Wu (Reference Li and Wu2015). Due to a relatively complete representation of all vortical structures in the wake, the vortex-sheet approach generally yields promising accuracy; however, the simulation becomes increasingly expensive as time proceeds. As a remedy, a vortex-amalgamation method (Xia & Mohseni Reference Xia and Mohseni2013b , Reference Xia and Mohseni2015) has recently been proposed to effectively restrain the growth of the computational cost for large simulations.
In practice, our previous model (Xia & Mohseni Reference Xia and Mohseni2013a ) for a 2-D unsteady flat plate could be readily applied to the case of a rigid wing or airfoil with negligible thickness. However, the same extension might not be applicable for an airfoil as the model requires us to establish an analytical mapping between the airfoil and a circle. Although special solutions for certain types of airfoil could exist (such as the Joukowski airfoil), it is generally challenging to obtain such transformation for an arbitrary-shaped airfoil. To address this difficulty, the effect of the airfoil might be substituted by a closed vortex sheet coinciding with the surface of the airfoil, the framework of which is consistent with the boundary-element method (Morino & Kuo Reference Morino and Kuo1974; Katz Reference Katz1981; Katz & Plotkin Reference Katz and Plotkin1991; Zhu et al. Reference Zhu, Wolfgang, Yue and Triantafyllou2002; Jones Reference Jones2003; Shukla & Eldredge Reference Shukla and Eldredge2007; Pan et al. Reference Pan, Dong, Zhu and Yue2012).
The essence of vortex-based flow models lies in the accurate predictions of the strength and distribution of the vortices in the flow field. Since the evolution of free vortices follows the Birkhoff–Rott equation (Lin Reference Lin1941; Rott Reference Rott1956; Birkhoff Reference Birkhoff1962), the key problem to be addressed is how vorticity detaches from the surface of the solid body and enters the flow. In reality, the generation of vorticity is related to the fluid–solid interaction that forms the shear layer, which is essentially the product of the viscous effect. Under the framework of inviscid flow, a typical solution is to apply vorticity releasing conditions at the vortex shedding locations of the solid body, e.g. the Kutta condition at a sharp trailing edge. This means that all the viscous effects can be translated into a single condition (Crighton Reference Crighton1985) that yields an estimation of the circulation around the body or the vorticity created near each vortex shedding location. For trailing edges, the classical Kutta condition has been shown to be effective for steady background flows, thus it is also commonly known as the steady-state trailing-edge Kutta condition which requires a finite velocity at the trailing edge (Saffman & Sheffield Reference Saffman and Sheffield1977; Huang & Chow Reference Huang and Chow1982; Mourtos & Brooks Reference Mourtos and Brooks1996). For a Joukowski airfoil, the steady-state Kutta condition is realized by setting the trailing edge to be a stagnation point in the mapped circle plane. The effect of this implementation is that the stagnation streamline from the trailing edge will be tangential to the edge (or bisect a finite-angle trailing edge), which is consistent with the physical flow near the trailing edge. For the case of a flat plate, this condition will guarantee the streamline emanating from this stagnation point to be in line with the plate, fulfilling the condition proposed in previous studies (Chen & Ho Reference Chen and Ho1987; Poling & Telionis Reference Poling and Telionis1987). However, the stagnation streamline for a finite-angle trailing edge is ambiguous (Poling & Telionis Reference Poling and Telionis1986), which a causes great challenge to modelling the trailing-edge vortex (TEV) sheet.
To address this difficulty, an additional relationship other than the Kutta condition is necessary. Realizing that the flow field is obtained by solving the Euler equation, which is the Navier–Stokes equation without the viscous term, this flow model generally has difficulty in capturing viscous effects around and behind a moving object. The introduction of the vortex sheet could partially address this difficulty. Physically, a vortex sheet represents a viscous shear layer in the Euler limit, by letting the thickness of the shear layer approach zero (Saffman Reference Saffman1992, §2.2). From a kinematic perspective, this approximation would yield the solution to the inviscid flow outside the vortex sheet with the non-penetration boundary condition implemented at the fluid–solid interface. However, a vortex sheet is inadequate to represent a viscous shear layer in the dynamic sense. This is because the vortex sheet only conserves the tangential velocity jump, which is also the circulation per unit length of the original shear layer. Therefore, a vortex sheet does not resolve the velocity gradient across the sheet; neither does it account for the mass and momentum associated with the shear layer, nor the fluid entrained by the shear layer. To this end, a vortex-sheet-based flow model is likely to capture the force contributions from circulation, i.e. lift and pressure drag, but not the viscous drag which is closely related to the momentum balance of the viscous shear layer. In order to properly capture other viscous effects, such as entrainment, viscous drag or even energy dissipation, we propose a generalized sheet with superimposed quantities and discontinuities associated with the original shear layer. This enables the application of the conservation laws of mass and momentum for a flow system containing a vortex sheet. As seen in this paper, application of proper boundary conditions together with standard conservation laws allow for the calculation of a correct wall-bounded vortex sheet as well as the free vortex sheet released at the trailing edge of an airfoil.
The paper is outlined as follows. The framework of the vortex-sheet-based aerodynamic model is presented in § 2. Section 3 provides an implicit expression of the unsteady Kutta condition, which relates the strength of the forming vortex sheet to its adjacent bound vortex sheet. Section 4 introduces a generalized sheet model, which is applied to the particular case of the finite-angle trailing edge to derive a momentum balance relation. Then, the momentum balance relation and the conservation of circulation are incorporated in § 5 to obtain an explicit form of the unsteady Kutta condition, which allows analytical calculation of the angle, strength and shedding velocity of the trailing-edge vortex sheet. The numerical implementation and validations of this aerodynamic model are presented in § 6.
2 Unsteady aerodynamic model
The framework of the aerodynamic model for a 2-D airfoil is not fundamentally different from that for a 2-D flat plate (Xia & Mohseni Reference Xia and Mohseni2013a ). In both situations, potential flow is applied as the governing equation, which is based on solving the Navier–Stokes equation in the Eulerian limit. This has two main advantages: one is analytical representation of the entire flow field, the other is saving computational cost since the domain of interest is reduced from the entire flow field to only finite vortical structures.
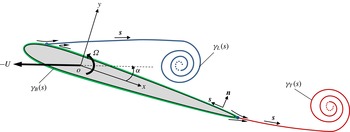
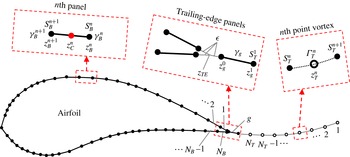
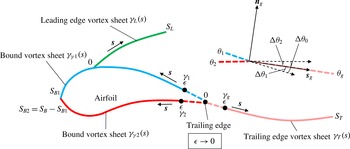
Diagram showing the unsteady flow model of an airfoil.

2.1 Vortex-sheet-based flow model
Assume that the rigid-body motion of the airfoil in a quiescent environment can be decomposed into a translational motion of velocity
 $-U(t)$
and a rotational motion of angular velocity
 $\unicode[STIX]{x1D6FA}(t)$
. Both the translational and the rotational motions can be incorporated into the boundary condition at the solid–fluid interface. As shown in figure 1, flow separation near the leading edge and at the sharp trailing edge of the airfoil causes the formation of two free vortex sheets in the wake. In a Cartesian coordinate system with the origin fixed at the rotation centre, the complex potential of the flow around an airfoil with angle of attack,
 $\unicode[STIX]{x1D6FC}(t)$
, can be formulated as
 $$\begin{eqnarray}\displaystyle w(z,t) & = & \displaystyle -\frac{\text{i}}{2\unicode[STIX]{x03C0}}\left[\right.\underbrace{\int _{0}^{S_{L}(t)}\ln (z-z_{L}(s,t))\unicode[STIX]{x1D6FE}_{L}(s,t)\,\text{d}s}_{LEV~term}\nonumber\\ \displaystyle & & \displaystyle +\,\underbrace{\int _{0}^{S_{T}(t)}\ln (z-z_{T}(s,t))\unicode[STIX]{x1D6FE}_{T}(s,t)\,\text{d}s}_{TEV~term}\left.\right]+\underbrace{w_{b}(z,t)}_{Body~term},\end{eqnarray}$$
where
 $z$
is the complex position,
 $s$
is the curve length between the separation point and a vortex element along a vortex sheet and
 $\unicode[STIX]{x1D6FE}$
is the vortex-sheet strength (circulation per unit length). The subscripts
 $_{L}$
and
 $_{T}$
denote the properties associated with the leading-edge and trailing-edge vortex sheets, respectively. So
 $S_{L}$
and
 $S_{T}$
represent the total lengths of the leading-edge and trailing-edge vortex sheets, respectively.
In (2.1),
 $w_{b}(z,t)$
represents the flow induced by the body motion of the airfoil, and is usually associated with the so-called ‘bound vortex’. Therefore, the ‘bound vortex’ can be viewed as a substitute for the solid body so that the non-penetration boundary condition can still be satisfied at the fluid–solid interface while the solid body is removed from the flow model. Again, we note here that the ‘body term’ or the ‘bound vortex’ implicitly accounts for the effects of translation, rotation or deformation, and more details will be provided in § 2.2. In general, the ‘bound vortex’ can be realized by placing image vortices inside the solid body for a Joukowski airfoil or a flat plate, where the strength and location of the image vortices can be first decided from Milne-Thomson’s circle theorem (Milne-Thomson Reference Milne-Thomson1958) in the circle plane and then mapped back to the physical plane. However, for an arbitrarily shaped airfoil which cannot be easily mapped to a circle, an analytical solution for
 $w_{b}(z,t)$
is not available. In this case, the ‘bound vortex’ can be realized by placing a bound vortex sheet along the surface of the airfoil as shown in figure 1, and
 $w_{b}(z,t)$
becomes
 $$\begin{eqnarray}w_{b}(z,t)=-\frac{\text{i}}{2\unicode[STIX]{x03C0}}\int _{0}^{S_{B}(t)}\ln (z-z_{B}(s,t))\unicode[STIX]{x1D6FE}_{B}(s,t)\,\text{d}s,\end{eqnarray}$$
where the subscript
 $_{B}$
denotes the properties associated with the bound vortex sheet. Note here that
 $s$
for the bound vortex sheet starts from the trailing edge with a counter-clockwise direction, and
 $S_{B}$
is the total length of the bound vortex sheet.
Combining (2.1) and (2.2) and taking the derivative
 $\text{d}w/\text{d}z$
, we obtain the complex-conjugate velocity field,
 $\bar{V}(z,t)=u(z,t)-\text{i}v(z,t)$
, in the form
 $$\begin{eqnarray}\displaystyle \bar{V}(z,t) & = & \displaystyle -\frac{\text{i}}{2\unicode[STIX]{x03C0}}\left[\right.\underbrace{\int _{0}^{S_{L}(t)}\frac{\unicode[STIX]{x1D6FE}_{L}(s,t)\,\text{d}s}{z-z_{L}(s,t)}}_{LEV~term}+\underbrace{\int _{0}^{S_{T}(t)}\frac{\unicode[STIX]{x1D6FE}_{T}(s,t)\,\text{d}s}{z-z_{T}(s,t)}}_{TEV~term}\nonumber\\ \displaystyle & & \displaystyle +\,\underbrace{\int _{0}^{S_{B}(t)}\frac{\unicode[STIX]{x1D6FE}_{B}(s,t)\,\text{d}s}{z-z_{B}(s,t)}}_{Bound~vortex~sheet~term}\left.\right].\end{eqnarray}$$
It should be noted that the velocity field represented by (2.3) is singular on the vortex sheets, where the jump of the tangential component of velocity is equal to the strength of the vortex sheet (Saffman Reference Saffman1992). More details regarding the evaluation of the vortex sheets will be discussed in §§2.2 and 3. At this point, the calculation of the entire flow field is reduced to determining the strength and distribution of only a few finite length vortex sheets.
2.2 Bound vortex sheet
The instantaneous velocity field around an airfoil can now be decided if the two free vortex sheets and one bound vortex sheet are given. This requires knowing the strengths and positions of the vortex sheets (
 $\unicode[STIX]{x1D6FE}_{L},\unicode[STIX]{x1D6FE}_{T},\unicode[STIX]{x1D6FE}_{B},z_{L},z_{T},z_{B}$
). Considering the case where the flow initially remains fully attached, this indicates no flow separation or free vortex sheet existed at
 $t=0$
. Under this assumption,
 $\unicode[STIX]{x1D6FE}_{L}$
,
 $\unicode[STIX]{x1D6FE}_{T}$
,
 $z_{L}$
,
 $z_{T}$
for later times might be found through solving the formation and evolution of the free vortex sheets. So we assume that
 $\unicode[STIX]{x1D6FE}_{L}$
,
 $\unicode[STIX]{x1D6FE}_{T}$
,
 $z_{L}$
,
 $z_{T}$
are known in order to solve the bound vortex sheet at any given time. Furthermore, the position of the bound vortex sheet,
 $z_{B}$
, is also known as it coincides with the surface of the airfoil at any time. As a result, the main task here is to solve for the vortex-sheet strength
 $\unicode[STIX]{x1D6FE}_{B}$
. We should note that a bound vortex sheet is treated differently from a free vortex sheet since
 $z_{B}$
is prescribed. Actually, the free vortex sheet is applied to represent the physical free shear layer, while the bound vortex sheet is introduced to ‘mimic’ the effect of a solid boundary. Therefore, it is expected that the primary role of the bound vortex sheet is to satisfy the non-penetration boundary condition, which can be expressed as
 $$\begin{eqnarray}\boldsymbol{u}(z^{\prime })\boldsymbol{\cdot }\hat{\boldsymbol{n}}(z^{\prime })=\boldsymbol{u}_{b}(z^{\prime })\boldsymbol{\cdot }\hat{\boldsymbol{n}}(z^{\prime })\quad \text{for}\;z^{\prime }=z_{B}(s^{\prime })\;\text{and}\;0\leqslant s^{\prime }\leqslant S_{B},\end{eqnarray}$$
where
 $\boldsymbol{u}(z^{\prime })=(u(z^{\prime }),v(z^{\prime }))$
is the flow velocity at the surface of the airfoil,
 $z_{B}$
, and
 $\hat{\boldsymbol{n}}(z^{\prime })$
is the unit normal vector to the surface. Note that the definitions for
 $z^{\prime }$
and
 $s^{\prime }$
only apply to the current section. Also, time
 $t$
is dropped here and in following derivations for simplicity although they should be satisfied instantaneously.
 $\boldsymbol{u}_{b}(z^{\prime })$
is the velocity associated with the surface element of the airfoil so it generally describes the deformation of an airfoil. However,
 $\boldsymbol{u}_{b}(z^{\prime })$
can be also applied to account for the translational motion in the complex-conjugate form,
 $-|U|\text{e}^{-\text{i}\unicode[STIX]{x1D6FC}}$
, and the rotational motion in the complex-conjugate form,
 $-\text{i}\unicode[STIX]{x1D6FA}\bar{z}^{\prime }$
, where
 $\bar{z}^{\prime }$
denotes the complex conjugate of
 $z^{\prime }$
.
Since the bound vortex sheet is placed at the surface of the airfoil, it creates a velocity jump across
 $z_{B}$
. Based on (2.3) and the definition of a vortex sheet (Saffman Reference Saffman1992), the two limiting values for
 $u^{\pm }(z^{\prime })-\text{i}v^{\pm }(z^{\prime })=\bar{V}_{B}^{\pm }(z^{\prime })$
can be derived as
 $$\begin{eqnarray}\displaystyle \bar{V}_{B}^{\pm }(z^{\prime }) & = & \displaystyle -\frac{\text{i}}{2\unicode[STIX]{x03C0}}\left[\int _{0}^{S_{L}}\frac{\unicode[STIX]{x1D6FE}_{L}(s)\,\text{d}s}{z^{\prime }-z_{L}(s)}+\int _{0}^{S_{T}}\frac{\unicode[STIX]{x1D6FE}_{T}(s)\,\text{d}s}{z^{\prime }-z_{T}(s)}\right.\nonumber\\ \displaystyle & & \displaystyle \left.+\;\unicode[STIX]{x2A0D}_{0}^{S_{B}}\frac{\unicode[STIX]{x1D6FE}_{B}(s)\,\text{d}s}{z^{\prime }-z_{B}(s)}\right]\pm \frac{1}{2}\unicode[STIX]{x1D6FE}_{B}(s^{\prime })\frac{\text{d}\bar{z}^{\prime }}{|\text{d}z^{\prime }|},\end{eqnarray}$$
where
 $\unicode[STIX]{x2A0D}$
denotes the Cauchy principal value which excludes the vorticity at
 $z^{\prime }$
from the integral.
 $\text{d}z^{\prime }|\text{d}z^{\prime }|^{-1}$
is the complex form of the unit tangential vector,
 $\hat{\boldsymbol{s}}(z^{\prime })$
, at the surface of the airfoil. With
 $\hat{\boldsymbol{s}}(z^{\prime })$
pointing in the counter-clockwise direction of the airfoil body,
 $\bar{V}_{B}^{+}(z^{\prime })$
becomes the velocity limit when the bound vortex sheet is approached from the outside of the airfoil, whereas
 $\bar{V}_{B}^{-}(z^{\prime })$
is the velocity limit when the vortex sheet is approached from the inside. Since
 $\boldsymbol{u}(z^{\prime })$
is the flow velocity outside the surface of the airfoil, it should take the value
 $\bar{V}_{B}^{+}(z^{\prime })$
. With
 $\hat{\boldsymbol{n}}(z^{\prime })$
written as
 $-\text{i}\,\text{d}z^{\prime }|\text{d}z^{\prime }|^{-1}$
, equation (2.4) has the complex form
 $$\begin{eqnarray}\text{Re}\left\{\left[\bar{V}_{B}^{+}(z^{\prime })+|U|\text{e}^{-\text{i}\unicode[STIX]{x1D6FC}}+\text{i}\unicode[STIX]{x1D6FA}\bar{z}^{\prime }\right]\frac{-\text{i}\,\text{d}z^{\prime }}{|\text{d}z^{\prime }|}\right\}=0.\end{eqnarray}$$
Ideally, equation (2.6) would give the strength of the bound vortex sheet,
 $\unicode[STIX]{x1D6FE}_{B}$
, if
 $\unicode[STIX]{x1D6FE}_{L}$
,
 $\unicode[STIX]{x1D6FE}_{T}$
,
 $z_{L}$
,
 $z_{T}$
and
 $z_{B}$
are given. However, a general analytical solution to (2.6) does not exist for an arbitrarily shaped airfoil. Fortunately, it is possible to solve this problem numerically by discretizing the bound vortex sheet into piecewise linear vortex panels, the details of which will be discussed in § 6.1.
It should be noted that the strength of the bound vortex sheet
 $\unicode[STIX]{x1D6FE}_{B}$
can be expressed as
 $\unicode[STIX]{x1D6FE}_{B}=\boldsymbol{u}_{f}\boldsymbol{\cdot }\hat{\boldsymbol{s}}$
, where
 $\boldsymbol{u}_{f}$
represents the potential flow velocity at the fluid–solid boundary. With a no-slip boundary condition,
 $\unicode[STIX]{x1D6FE}_{B}$
can be divided into two terms,
 $\unicode[STIX]{x1D6FE}_{b}$
and
 $\unicode[STIX]{x1D6FE}_{\unicode[STIX]{x1D6FE}}$
, according to Eldredge (Reference Eldredge2010).
 $\unicode[STIX]{x1D6FE}_{b}$
is purely associated with the body-surface motion relative to the reference frame, and it can be estimated from
 $\unicode[STIX]{x1D6FE}_{b}=\boldsymbol{u}_{b}\boldsymbol{\cdot }\hat{\boldsymbol{s}}$
.
 $\unicode[STIX]{x1D6FE}_{\unicode[STIX]{x1D6FE}}$
is the physical vortex sheet corresponding to the viscous shear layer, which is given by
 $\unicode[STIX]{x1D6FE}_{\unicode[STIX]{x1D6FE}}=\unicode[STIX]{x1D6FE}_{B}-\unicode[STIX]{x1D6FE}_{b}$
. Therefore,
 $\unicode[STIX]{x1D6FE}_{\unicode[STIX]{x1D6FE}}$
is invariant regardless of the reference frame being global or body fixed, while both
 $\unicode[STIX]{x1D6FE}_{b}$
and
 $\unicode[STIX]{x1D6FE}_{B}$
could change as the reference frame changes. To avoid ambiguity,
 $\unicode[STIX]{x1D6FE}_{B}$
in this study only represents the bound vortex sheet in the global reference frame.
2.3 Force and torque
Following previous studies (Wu Reference Wu1981; Eldredge Reference Eldredge2010), the aerodynamic force applied on the airfoil can be estimated based on the rate of change of the total impulse in the form
 $$\begin{eqnarray}\boldsymbol{F}=-\unicode[STIX]{x1D70C}\frac{\text{d}}{\text{d}t}\int _{\sum S}\boldsymbol{x}\times \unicode[STIX]{x1D738}\,\text{d}s,\end{eqnarray}$$
where
 $\boldsymbol{x}$
is the position vector of a vortex-sheet element.
 $\unicode[STIX]{x1D738}=\unicode[STIX]{x1D6FE}\hat{\boldsymbol{k}}$
, where
 $\hat{\boldsymbol{k}}$
is the unit vector normal to the 2-D plane and
 $\unicode[STIX]{x1D6FE}$
in this work should be substituted with
 $\unicode[STIX]{x1D6FE}_{L}$
,
 $\unicode[STIX]{x1D6FE}_{T}$
and
 $\unicode[STIX]{x1D6FE}_{B}$
for
 $S_{L}$
,
 $S_{T}$
and
 $S_{B}$
, respectively.
 $\unicode[STIX]{x1D70C}$
is the density.
 $\sum S$
represents the entire vortex-sheet system,
 $\sum S=S_{L}+S_{T}+S_{B}$
. Similarly, the total torque exerted by the fluid on the airfoil can be obtained from
 $$\begin{eqnarray}T_{\unicode[STIX]{x1D70F}}=-\unicode[STIX]{x1D70C}\frac{\text{d}}{2\,\text{d}t}\int _{\sum S}\boldsymbol{x}\times (\boldsymbol{x}\times \unicode[STIX]{x1D738}\,\text{d}s).\end{eqnarray}$$
The main advantage of (2.7) and (2.8) is that the calculations of force and torque are completely transformed into the dynamics of the bound and wake vortices, which can be explicitly obtained from this aerodynamic model. Equations (2.7) and (2.8) will be used to estimate aerodynamic force and torque for all simulations in § 6.
3 Unsteady Kutta condition
To implement the above-proposed flow model, we need to determine the intensities and locations of the wake vortices, i.e.
 $\unicode[STIX]{x1D6FE}_{L}$
,
 $\unicode[STIX]{x1D6FE}_{T}$
,
 $z_{L}$
and
 $z_{T}$
associated with the leading-edge and trailing-edge vortex sheets at any given time. Assuming no wake vortex initially, the task requires understanding the formation and evolution of the leading-edge and trailing-edge vortex sheets. To this end, the evolution of a free vortex sheet is dictated by the Helmholtz laws of vortex motion (Helmholtz Reference Helmholtz1867; Saffman Reference Saffman1992). According to the third Helmholtz law, the circulation of a vortex-sheet element can be treated as time invariant once it is detached from the airfoil. Furthermore, the second Helmholtz law dictates that a vortex element and its overlapping fluid particle should move together. In accordance with these principles, the velocity describing the motion of an element on a free vortex sheet can be derived using the Birkhoff–Rott equation (Lin Reference Lin1941; Rott Reference Rott1956; Birkhoff Reference Birkhoff1962), the formulation of which is similar to (2.3), with
 $\int$
replaced by
 $\unicode[STIX]{x2A0D}$
to remove the self-induced singularity of a vortex element. This gives the basic principle for evolving vortices in the wake. The only question left is how vorticity is generated and detached from the surface of the airfoil to form wake vortex sheets. We note that in reality vortex sheets could come off the airfoil from multiple separation points. However, the current study only focuses on vortex shedding at a sharp trailing edge, which is the most common vortex generation mechanism.
3.1 Previous studies and main challenge
We first consider a simple case, where the vortex sheet is formed at the edge of a flat plate or a cusped trailing edge of an airfoil. Without considering the viscous effect, a typical way of deciding the vortex-sheet formation at the trailing edge is the classical steady Kutta condition. This condition requires the flow velocity at the trailing edge to be finite or the loading at the trailing edge to be zero, based on the physical sense that flow cannot turn around a sharp edge. The application of this condition for a flat plate or a Joukowski airfoil (with cusped trailing edge) has already been demonstrated in several previous works (Streitlien & Triantafyllou Reference Streitlien and Triantafyllou1995; Yu et al. Reference Yu, Tong and Ma2003; Ansari et al. Reference Ansari, Zbikowski and Knowles2006a ; Xia & Mohseni Reference Xia and Mohseni2013a ) among others. Basically, this condition is equivalent to enforcing a stagnation point at the trailing edge in the transformed circle plane. However, Xia & Mohseni (Reference Xia and Mohseni2014) recently pointed out that a stagnation point generally does not exist at the trailing edge for the case of body rotation. As a result, they proposed to implement the unsteady Kutta condition by relaxing the trailing-edge point of the circle plane from totally stagnant to only stagnant in the tangential direction of the surface, which still conforms to the classical Kutta condition in the sense of preventing flow around the sharp edge. Here, we emphasize that these steady and unsteady Kutta conditions are problem dependent, meaning they only apply to a flat plate or an airfoil that can be mathematically mapped to a circle.
Alternatively, Jones (Reference Jones2003) modelled the flow around a flat plate using a bound vortex sheet coincident with the plate and two free vortex sheets that are emanating from the plate’s two sharp edges, which is similar to the flow model presented here for an airfoil. By removing the singularities of the flow velocity at the trailing edge, which complies with the classical Kutta condition that flow velocity should be finite at a sharp edge, Jones managed to derive an analytical unsteady Kutta condition. This condition can be summarized as follows:
-
(i)
 $\unicode[STIX]{x1D6FE}_{g}=\unicode[STIX]{x1D6FE}_{E}$
;
-
(ii)
$u_{g}=u_{E}$
; -
(iii)
$\unicode[STIX]{x1D703}_{g}=0$
.


Here,
 $\unicode[STIX]{x1D6FE}_{g}$
,
 $u_{g}$
and
 $\unicode[STIX]{x1D703}_{g}$
represent the strength, tangential velocity (relative to the edge), and angle (relative to the tangent of the plate) of the forming vortex sheet, respectively.
 $\unicode[STIX]{x1D6FE}_{E}$
is the strength of the bound vortex sheet at the sharp edge, and
 $u_{E}$
is the average tangential slip between the bound vortex sheet and the plate at the edge. Therefore, Jones’ unsteady Kutta condition allows the analytical calculation of the strength, velocity and direction of the forming vortex sheet for the sharp edge of a flat plate or a cusped airfoil, based on the existing bound vortex sheet. However, the current work is concerned with a general-shaped airfoil, for which Jones’ unsteady Kutta condition might not be suitable. Specifically, if there is a finite angle,
 $\unicode[STIX]{x0394}\unicode[STIX]{x1D703}_{0}\in [0,\unicode[STIX]{x03C0})$
, between the upper and lower surfaces of the trailing edge,
 $\unicode[STIX]{x1D703}_{g}$
, of the forming vortex sheet would be ambiguous.
This challenge is further explained below. Since the forming vortex sheet moves with the fluid as a material sheet, it resembles a streakline released from the trailing edge in the body-fixed reference frame. Recognizing that at the origin of a streakline the directions of the streakline and the streamline are identical to each other, this indicates that the ambiguity of the vortex-sheet direction is equivalent to the ambiguity of the stagnation streamline direction. In fact, for steady trailing-edge flow where the shedding of vorticity vanishes (
 $\unicode[STIX]{x1D6FE}_{g}=0$
), Poling & Telionis (Reference Poling and Telionis1986) pointed out that the steady Kutta condition requires the stagnation streamline to bisect the wedge angle of a finite-angle trailing edge. Otherwise, an unbalance between the upper and lower shear layers near the trailing edge would cause a non-zero vorticity generation which would be naturally unsteady. According to this argument, an unsteady trailing-edge flow naturally generates vorticity and causes the stagnation streamline to divert from the wedge bisector line, which has been confirmed experimentally (Ho & Chen Reference Ho and Chen1981; Poling & Telionis Reference Poling and Telionis1986). A prominent theory for the unsteady situation has been proposed by Giesing (Reference Giesing1969) and Maskell (Reference Maskell1971) that the stagnation streamline is an extension of one of the two tangents at the trailing edge. Although Basu & Hancock (Reference Basu and Hancock1978) has provided extensive discussion supporting the Giesing–Maskell model, a notable drawback of this model is that it does not reduce to the steady-state solution in the limit of vanishing vorticity. Furthermore, Poling & Telionis (Reference Poling and Telionis1986) reported that the Giesing–Maskell model holds approximately for large rate of vorticity generation, whereas the stagnation streamline direction changes smoothly between the two tangents of the trailing edge when vorticity generation is low.
3.2 The condition for a finite-angle trailing edge
In this study, we seek to derive an unsteady Kutta condition for a finite-angle trailing edge to analytically determine
 $\unicode[STIX]{x1D6FE}_{g}$
,
 $u_{g}$
, and
 $\unicode[STIX]{x1D703}_{g}$
associated with the forming vortex sheet. According to our previous study of an unsteady flat plate (Xia & Mohseni Reference Xia and Mohseni2013a
, Reference Xia and Mohseni2014), the unsteady Kutta condition can be implemented numerically by satisfying the condition
 $$\begin{eqnarray}\boldsymbol{u}_{g}\boldsymbol{\cdot }\hat{\boldsymbol{n}}_{g}=0,\end{eqnarray}$$
where
 $\boldsymbol{u}_{g}$
is the vector form of the vortex-sheet velocity relative to the trailing edge and
 $\hat{\boldsymbol{n}}_{g}$
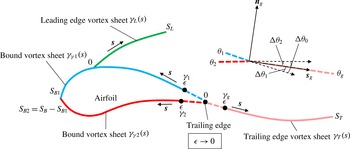
is the unit vector normal to the vortex sheet at the trailing edge as shown in figure 2. Basically, equation (3.1) enforces the streamline to be tangential to the forming vortex sheet.
The vortex-sheet configuration for (3.2).
Here, we shall extend (3.1) to the situation of a finite-angle trailing edge to express
 $\boldsymbol{u}_{g}$
in terms of
 $\unicode[STIX]{x1D6FE}_{g}$
and
 $\unicode[STIX]{x1D703}_{g}$
, as well as other parameters associated with the instantaneous background flow and the bound vortex sheet. We assume the flow field changes smoothly so that all vortex sheets are smooth curves near the trailing edge and their strengths also vary smoothly along the sheets. The vortex-sheet system for this calculation is illustrated in figure 2, where
 $\unicode[STIX]{x1D6FE}_{1}$
and
 $\unicode[STIX]{x1D6FE}_{2}$
are the bound vortex strengths and
 $\unicode[STIX]{x1D6FE}_{g}$
is the strength of the forming vortex sheet as it approaches the trailing edge. Noting that the vortex-sheet strength is not well defined at the trailing-edge point, where
 $\unicode[STIX]{x1D6FE}_{1}$
,
 $\unicode[STIX]{x1D6FE}_{2}$
and
 $\unicode[STIX]{x1D6FE}_{g}$
are discontinuous with each other, the trailing-edge point is actually a singularity point in the vortex-sheet system. Fortunately, according to the Birkhoff–Rott equation (Lin Reference Lin1941; Rott Reference Rott1956; Birkhoff Reference Birkhoff1962),
 $\boldsymbol{u}_{g}$
should be estimated in the desingularized flow field excluding the vorticity at the trailing edge point. This allows us to represent
 $\boldsymbol{u}_{g}$
, based on the vortex-sheet configuration of figure 2 and (2.3), in the limit form
 $$\begin{eqnarray}\displaystyle \bar{V}_{g} & = & \displaystyle -\frac{\text{i}}{2\unicode[STIX]{x03C0}}\lim _{\unicode[STIX]{x1D716}\rightarrow 0}\left[\int _{0}^{S_{L}}\frac{\unicode[STIX]{x1D6FE}_{L}(s)\,\text{d}s}{z_{T}(0)-z_{L}(s)}+\int _{\unicode[STIX]{x1D716}}^{S_{T}}\frac{\unicode[STIX]{x1D6FE}_{T}(s)\,\text{d}s}{z_{T}(0)-z_{T}(s)}\right.\nonumber\\ \displaystyle & & \displaystyle +\,\left.\int _{\unicode[STIX]{x1D716}}^{S_{B1}}\frac{\unicode[STIX]{x1D6FE}_{\unicode[STIX]{x1D6FE}1}(s)\,\text{d}s}{z_{T}(0)-z_{B1}(s)}+\int _{\unicode[STIX]{x1D716}}^{S_{B2}}\frac{\unicode[STIX]{x1D6FE}_{\unicode[STIX]{x1D6FE}2}(s)\,\text{d}s}{z_{T}(0)-z_{B2}(s)}\right]+\bar{V}_{CT},\end{eqnarray}$$
where
 $\bar{V}_{CT}$
is the velocity difference associated with the coordinate transformation from the global reference frame to the body-fixed reference frame.
 $t$
in (2.3) is dropped here for brevity. Recall the discussion of the bound vortex sheet in § 2.2,
 $\unicode[STIX]{x1D6FE}_{\unicode[STIX]{x1D6FE}}(s)$
rather than
 $\unicode[STIX]{x1D6FE}_{B}(s)$
should be used here for velocity calculation because
 $\unicode[STIX]{x1D6FE}_{b}(s)=0$
in the body-fixed reference frame. For convenience, we further divide
 $\unicode[STIX]{x1D6FE}_{\unicode[STIX]{x1D6FE}}(s)$
into two parts,
 $\unicode[STIX]{x1D6FE}_{\unicode[STIX]{x1D6FE}1}(s)$
and
 $\unicode[STIX]{x1D6FE}_{\unicode[STIX]{x1D6FE}2}(s)$
, as shown in figure 2. The relationships between the original and the divided bound vortex sheets are given by
 $\unicode[STIX]{x1D6FE}_{\unicode[STIX]{x1D6FE}1}(s)=\unicode[STIX]{x1D6FE}_{\unicode[STIX]{x1D6FE}}(s)$
and
 $z_{B1}(s)=z_{B}(s)$
for
 $0<s\leqslant S_{B1}$
, and
 $\unicode[STIX]{x1D6FE}_{\unicode[STIX]{x1D6FE}2}(s)=\unicode[STIX]{x1D6FE}_{\unicode[STIX]{x1D6FE}}(S_{B}-s)$
and
 $z_{B2}(s)=z_{B}(S_{B}-s)$
for
 $0<s\leqslant (S_{B}-S_{B1})$
, where
 $S_{B1}$
and
 $S_{B2}$
satisfy
 $S_{B1}+S_{B2}=S_{B}$
. In this way, the two bound vortex sheets both ‘stem’ from the trailing edge, meaning
 $\lim _{\unicode[STIX]{x1D716}\rightarrow 0}z_{B1}(\unicode[STIX]{x1D716})=\lim _{\unicode[STIX]{x1D716}\rightarrow 0}z_{B2}(\unicode[STIX]{x1D716})$
, and
 $\lim _{\unicode[STIX]{x1D716}\rightarrow 0}\unicode[STIX]{x1D6FE}_{\unicode[STIX]{x1D6FE}1}(\unicode[STIX]{x1D716})=\unicode[STIX]{x1D6FE}_{1}$
and
 $\lim _{\unicode[STIX]{x1D716}\rightarrow 0}\unicode[STIX]{x1D6FE}_{\unicode[STIX]{x1D6FE}2}(\unicode[STIX]{x1D716})=\unicode[STIX]{x1D6FE}_{2}$
.
The main challenge of calculating (3.2) is that the integrands of
 $\int _{\unicode[STIX]{x1D716}}^{S_{T}}$
,
 $\int _{\unicode[STIX]{x1D716}}^{S_{B1}}$
and
 $\int _{\unicode[STIX]{x1D716}}^{S_{B2}}$
become singular as
 $\unicode[STIX]{x1D716}\rightarrow 0$
. As a remedy, we only evaluate its leading-order terms as demonstrated in appendices A and B. Based on the smoothness assumption of the vortex sheets, there exist finite values,
 $\unicode[STIX]{x1D716}_{1}$
,
 $\unicode[STIX]{x1D716}_{2}$
and
 $\unicode[STIX]{x1D716}_{T}$
, so that
 $\unicode[STIX]{x1D6FE}_{\unicode[STIX]{x1D6FE}1}(s)$
and
 $z_{B1}(s)$
are smooth on
 $[0,\unicode[STIX]{x1D716}_{1}]$
,
 $\unicode[STIX]{x1D6FE}_{\unicode[STIX]{x1D6FE}2}(s)$
and
 $z_{B2}(s)$
are smooth on
 $[0,\unicode[STIX]{x1D716}_{2}]$
, and
 $\unicode[STIX]{x1D6FE}_{T}(s)$
and
 $z_{T}(s)$
are smooth on
 $[0,\unicode[STIX]{x1D716}_{2}]$
. Accordingly, equation (3.2) can be divided as
 $$\begin{eqnarray}\displaystyle \bar{V}_{g} & = & \displaystyle -\frac{\text{i}}{2\unicode[STIX]{x03C0}}\lim _{\unicode[STIX]{x1D716}\rightarrow 0}\left[\int _{\unicode[STIX]{x1D716}}^{\unicode[STIX]{x1D716}_{T}}\frac{\unicode[STIX]{x1D6FE}_{T}(s)\,\text{d}s}{z_{T}(0)-z_{T}(s)}+\int _{\unicode[STIX]{x1D716}}^{\unicode[STIX]{x1D716}_{1}}\frac{\unicode[STIX]{x1D6FE}_{\unicode[STIX]{x1D6FE}1}(s)\,\text{d}s}{z_{T}(0)-z_{B1}(s)}\right.\nonumber\\ \displaystyle & & \displaystyle \left.+\,\int _{\unicode[STIX]{x1D716}}^{\unicode[STIX]{x1D716}_{2}}\frac{\unicode[STIX]{x1D6FE}_{\unicode[STIX]{x1D6FE}2}(s)\,\text{d}s}{z_{T}(0)-z_{B2}(s)}\right]-\frac{\text{i}}{2\unicode[STIX]{x03C0}}\left[\int _{0}^{S_{L}}\frac{\unicode[STIX]{x1D6FE}_{L}(s)\,\text{d}s}{z_{T}(0)-z_{L}(s)}+\int _{\unicode[STIX]{x1D716}_{T}}^{S_{T}}\frac{\unicode[STIX]{x1D6FE}_{T}(s)\,\text{d}s}{z_{T}(0)-z_{T}(s)}\right.\nonumber\\ \displaystyle & & \displaystyle \left.+\,\int _{\unicode[STIX]{x1D716}_{1}}^{S_{B1}}\frac{\unicode[STIX]{x1D6FE}_{\unicode[STIX]{x1D6FE}1}(s)\,\text{d}s}{z_{T}(0)-z_{B1}(s)}+\int _{\unicode[STIX]{x1D716}_{2}}^{S_{B2}}\frac{\unicode[STIX]{x1D6FE}_{\unicode[STIX]{x1D6FE}2}(s)\,\text{d}s}{z_{T}(0)-z_{B2}(s)}\right]+\bar{V}_{CT}.\end{eqnarray}$$
Applying appendix A to the first three integrals and appendix B to the last four integrals yields
 $$\begin{eqnarray}\bar{V}_{g}=-\frac{\text{i}}{2\unicode[STIX]{x03C0}}\lim _{\unicode[STIX]{x1D716}\rightarrow 0}\left[\unicode[STIX]{x1D6FE}_{g}\text{e}^{-\text{i}\unicode[STIX]{x1D703}_{g}}\ln \left(\unicode[STIX]{x1D716}\right)+\unicode[STIX]{x1D6FE}_{1}\text{e}^{-\text{i}\unicode[STIX]{x1D703}_{1}}\ln \left(\unicode[STIX]{x1D716}\right)+\unicode[STIX]{x1D6FE}_{2}\text{e}^{-\text{i}\unicode[STIX]{x1D703}_{2}}\ln \left(\unicode[STIX]{x1D716}\right)\right]+\bar{V}_{add},\end{eqnarray}$$
where
 $\bar{V}_{add}$
represents all additional terms of
 $o(\ln (\unicode[STIX]{x1D716}))$
as
 $\unicode[STIX]{x1D716}\rightarrow 0$
.
 $\unicode[STIX]{x1D703}_{1}$
,
 $\unicode[STIX]{x1D703}_{2}$
and
 $\unicode[STIX]{x1D703}_{g}$
correspond to the angles of the vortex sheets (
 $\unicode[STIX]{x1D6FE}_{\unicode[STIX]{x1D6FE}1}$
,
 $\unicode[STIX]{x1D6FE}_{\unicode[STIX]{x1D6FE}2}$
and
 $\unicode[STIX]{x1D6FE}_{T}$
) in the complex domain as they approach the trailing edge. Now, we combine (3.4) and
 $\text{Im}\{\bar{V}_{g}\text{e}^{\text{i}\unicode[STIX]{x1D703}_{g}}\}=0$
(the complex form of (3.1)) and then divide both sides by the leading-order term,
 $\ln (\unicode[STIX]{x1D716})$
, to obtain
 $\unicode[STIX]{x1D6FE}_{g}+\unicode[STIX]{x1D6FE}_{1}\cos (\unicode[STIX]{x1D703}_{g}-\unicode[STIX]{x1D703}_{1})+\unicode[STIX]{x1D6FE}_{2}\cos (\unicode[STIX]{x1D703}_{g}-\unicode[STIX]{x1D703}_{2})=0$
. Together with the angle relations defined in figure 2, the unsteady Kutta condition takes the form
 $$\begin{eqnarray}\unicode[STIX]{x1D6FE}_{g}=\unicode[STIX]{x1D6FE}_{1}\cos \unicode[STIX]{x0394}\unicode[STIX]{x1D703}_{1}+\unicode[STIX]{x1D6FE}_{2}\cos \unicode[STIX]{x0394}\unicode[STIX]{x1D703}_{2}.\end{eqnarray}$$
For the case of a flat plate or a cusped trailing edge, where both
 $\unicode[STIX]{x0394}\unicode[STIX]{x1D703}_{1}$
and
 $\unicode[STIX]{x0394}\unicode[STIX]{x1D703}_{2}$
are zero, equation (3.5) is reduced to
 $\unicode[STIX]{x1D6FE}_{g}=\unicode[STIX]{x1D6FE}_{1}+\unicode[STIX]{x1D6FE}_{2}$
, which is consistent with condition (i) of § 3.1 given by Jones (Reference Jones2003). For a finite-angle trailing edge, equation (3.5) tells us that the strength of the forming vortex sheet
 $\unicode[STIX]{x1D6FE}_{g}$
depends on its direction
 $\unicode[STIX]{x1D703}_{g}$
and the strengths of its adjacent bound vortex sheets,
 $\unicode[STIX]{x1D6FE}_{1}$
and
 $\unicode[STIX]{x1D6FE}_{2}$
. In § 5, equation (3.5) will be combined with the momentum balance relation and the conservation of circulation to analytically determine
 $\unicode[STIX]{x1D6FE}_{g}$
,
 $u_{g}$
and
 $\unicode[STIX]{x1D703}_{g}$
of the forming vortex sheet.
4 Momentum balance at the trailing edge
The unsteady Kutta condition alone does not give the full information about the forming vortex sheet at a finite-angle trailing edge. Physically, we believe that the formation of the free vortex sheet is the outcome of the upper and lower shear flows merging at the trailing edge. As such, the momentum of the merging process must be balanced not only along the direction of the forming vortex sheet but also in the normal direction. We hypothesize that this momentum balance provides an important dynamic condition relating to the angle of the forming vortex sheet, in addition to the kinematic condition (i.e. the Kutta condition).
Before we proceed, it is necessary to discuss the main challenges of applying the conservation laws of mass and momentum to a system of vortex sheets. Take the bound vortex sheet as an example, the non-penetration and no-slip boundary conditions are the physically correct conditions for fluid–solid interactions in most applications. While the Navier–Stokes equation allows for the matching of both normal and tangential velocity components between the fluid and the solid, the Euler equation allows only for the matching of the wall-normal velocity component and it does not impose any constraints on the tangential velocity component. In order to remedy this for large Reynolds number flows, where the Euler equation is often accepted as a suitable model, we superimpose the Euler equations with a physical vortex sheet,
 $\unicode[STIX]{x1D6FE}_{\unicode[STIX]{x1D6FE}}$
, as introduced in § 2.2 to satisfy the no-slip boundary condition. Therefore,
 $\unicode[STIX]{x1D6FE}_{\unicode[STIX]{x1D6FE}}$
actually represents the physical viscous shear layer at the fluid–solid interface, in the sense of preserving the tangential velocity jump or the circulation across the shear layer. As has been demonstrated in § 3.2, the modelling of the physical vortex sheet allows us to perform calculations related to the formation of a free vortex sheet, especially in term of the sheet strength. However, since the thickness and the velocity profile of a viscous shear layer are not resolved by a vortex sheet, the mass and momentum associated with the shear layer are not captured. Although this will not directly affect the solution of the original Euler equation, it would definitely cause unbalanced equations of mass and momentum within the vortex sheet, especially in the tangential direction, and thereby affecting the correct prediction of viscous shear force exerted on the shear layer in inviscid flows.
In this section, a generalized sheet model, which incorporates the mass and momentum fluxes associated with the original shear layer, is proposed to enable the correct implementation of the momentum conservation law for a system of vortex sheets. Then, the new sheet model is applied to derive a momentum balance relation for a control volume of the merging zone near the finite-angle trailing edge.
4.1 A generalized sheet model for viscous shear layer
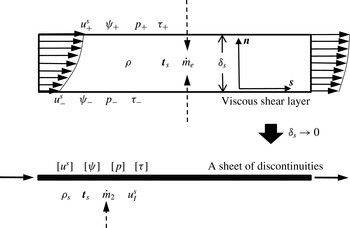
In order to properly model the dynamics of a viscous shear layer, here we propose a generalized sheet model on top of the original vortex sheet where all relevant quantities or discontinuities associated with the viscous shear layer are superimposed. A schematic of this modelling approach is illustrated in figure 3. As a first step, a sheet of discontinuity in the streamfunction
 $\unicode[STIX]{x1D713}$
is placed at the location of the original vortex sheet, so that
 $\unicode[STIX]{x27E6}\unicode[STIX]{x1D713}(s)\unicode[STIX]{x27E7}$
is equal to the volumetric flow rate of the viscous shear layer in the form
 $$\begin{eqnarray}\unicode[STIX]{x27E6}\unicode[STIX]{x1D713}\unicode[STIX]{x27E7}=\int _{0}^{\unicode[STIX]{x1D6FF}_{s}}u^{s}\,\text{d}n,\end{eqnarray}$$
where
 $\unicode[STIX]{x1D6FF}_{s}$
is the thickness of the shear layer and
 $u^{s}$
is the tangential velocity component. Thus, the mass conservation for the new sheet can be written in the differential form
 $$\begin{eqnarray}\frac{\text{d}\unicode[STIX]{x1D70C}_{s}}{\text{d}t}=\unicode[STIX]{x1D70C}\frac{\unicode[STIX]{x2202}\unicode[STIX]{x27E6}\unicode[STIX]{x1D713}\unicode[STIX]{x27E7}}{\unicode[STIX]{x2202}s}-{\dot{m}}_{e}=0,\end{eqnarray}$$
where
 ${\dot{m}}_{e}(s)$
is the per-unit-length mass entrainment associated with the shear layer and
 $\unicode[STIX]{x1D70C}_{s}$
is the per-unit-length density defined as
 $\unicode[STIX]{x1D70C}_{s}=\unicode[STIX]{x1D70C}\unicode[STIX]{x1D6FF}_{s}$
.
A generalized sheet model to represent a viscous shear layer.
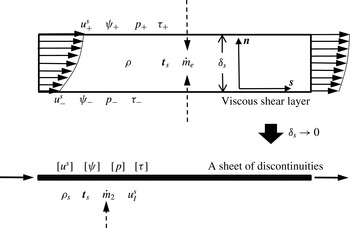
To apply the momentum conservation law to a shear layer, we define a new discontinuity,
 $\unicode[STIX]{x27E6}\unicode[STIX]{x1D712}\unicode[STIX]{x27E7}$
, in analogy to
 $\unicode[STIX]{x27E6}\unicode[STIX]{x1D713}\unicode[STIX]{x27E7}$
such that
 $$\begin{eqnarray}\unicode[STIX]{x27E6}\unicode[STIX]{x1D712}\unicode[STIX]{x27E7}=\int _{0}^{\unicode[STIX]{x1D6FF}_{s}}(u^{s})^{2}\,\text{d}n.\end{eqnarray}$$
Therefore,
 $\unicode[STIX]{x27E6}\unicode[STIX]{x1D712}\unicode[STIX]{x27E7}$
represents the momentum flux associated with the generalized sheet. Furthermore, it is assumed that the new sheet has a characteristic velocity
 $\boldsymbol{u}_{I}(s)=u_{I}^{s}\hat{\boldsymbol{s}}$
, satisfying
 $u_{I}^{s}=\unicode[STIX]{x27E6}\unicode[STIX]{x1D712}\unicode[STIX]{x27E7}/\unicode[STIX]{x27E6}\unicode[STIX]{x1D713}\unicode[STIX]{x27E7}$
. In this way, the momentum flux of the shear layer is conserved. To further generalize the vortex sheet, we also superimpose a pressure jump,
 $\unicode[STIX]{x27E6}p(s)\unicode[STIX]{x27E7}$
, a shear stress jump,
 $\unicode[STIX]{x27E6}\unicode[STIX]{x1D70F}(s)\unicode[STIX]{x27E7}$
and a surface stress (tension) tensor,
 $\unicode[STIX]{x1D64F}_{s}$
, which is related to the surface stress
 $\boldsymbol{t}_{s}$
as
 $\boldsymbol{t}_{s}=\hat{\boldsymbol{s}}\boldsymbol{\cdot }\unicode[STIX]{x1D64F}_{s}$
in two dimensions. Now, applying the Reynolds transport theorem to a sheet element with a length of
 $\unicode[STIX]{x0394}s$
, the momentum conservation can be expressed as
 $$\begin{eqnarray}\unicode[STIX]{x1D70C}\frac{\text{d}(\unicode[STIX]{x27E6}\unicode[STIX]{x1D713}\unicode[STIX]{x27E7}\hat{\boldsymbol{s}})}{\text{d}t}=\unicode[STIX]{x1D70C}\frac{\unicode[STIX]{x2202}(\unicode[STIX]{x27E6}\unicode[STIX]{x1D713}\unicode[STIX]{x27E7}\hat{\boldsymbol{s}})}{\unicode[STIX]{x2202}t}+\unicode[STIX]{x1D70C}\frac{\unicode[STIX]{x2202}(\unicode[STIX]{x27E6}\unicode[STIX]{x1D713}\unicode[STIX]{x27E7}\boldsymbol{u}_{I})}{\unicode[STIX]{x2202}s}-{\dot{m}}_{e}\boldsymbol{u}_{e}=-\unicode[STIX]{x27E6}p\unicode[STIX]{x27E7}\hat{\boldsymbol{n}}+\unicode[STIX]{x27E6}\unicode[STIX]{x1D70F}\unicode[STIX]{x27E7}\hat{\boldsymbol{s}}+\unicode[STIX]{x1D735}\boldsymbol{\cdot }\unicode[STIX]{x1D64F}_{s},\end{eqnarray}$$
where
 $\boldsymbol{u}_{e}$
is the velocity of the entrained fluid. We note that by assigning proper quantities and discontinuities this new sheet is capable of modelling the dynamics of a viscous shear layer at fluid–fluid or fluid–solid interfaces in single and multiple phase flows.
Next, we apply (4.2) and (4.4) to a special case, the physical vortex sheet
 $\unicode[STIX]{x1D6FE}_{\unicode[STIX]{x1D6FE}}$
around the surface of an airfoil with free vortex sheets attached. Equation (4.2) can be integrated around the airfoil to give
 $$\begin{eqnarray}\unicode[STIX]{x1D70C}\sum \unicode[STIX]{x27E6}\unicode[STIX]{x1D713}_{g}\unicode[STIX]{x27E7}-\int _{0}^{S_{B}}{\dot{m}}_{e}\,\text{d}s=0,\end{eqnarray}$$
where the
 $\sum$
term sums up the mass flux drained into each attached free vortex sheet, and
 $\unicode[STIX]{x27E6}\unicode[STIX]{x1D713}_{g}\unicode[STIX]{x27E7}$
is the streamfunction jump at the origin of a free vortex sheet. Considering that fluid is physically entrained from the outer flow into the shear layer, the velocity of the entrained fluid should equal the fluid-side velocity of the bound vortex sheet. This gives
 $\boldsymbol{u}_{e}=\boldsymbol{u}_{f}-\boldsymbol{u}_{b}$
in the body-fixed reference frame, where
 $\boldsymbol{u}_{b}=u_{b}^{s}\hat{\boldsymbol{s}}+u_{b}^{n}\hat{\boldsymbol{n}}$
. With the non-penetration boundary condition, we have
 $\boldsymbol{u}_{f}=u_{f}^{s}\hat{\boldsymbol{s}}+u_{b}^{n}\hat{\boldsymbol{n}}$
and
 $\unicode[STIX]{x1D6FE}_{\unicode[STIX]{x1D6FE}}=u_{f}^{s}-u_{b}^{s}$
. Neglecting surface tension and plugging in (4.2), equation (4.4) can be expanded in the
 $\hat{\boldsymbol{s}}$
and
 $\hat{\boldsymbol{n}}$
directions as
 $$\begin{eqnarray}\displaystyle & \displaystyle \unicode[STIX]{x1D70C}\left(\frac{\unicode[STIX]{x2202}\unicode[STIX]{x27E6}\unicode[STIX]{x1D713}\unicode[STIX]{x27E7}}{\text{d}t}+\unicode[STIX]{x27E6}\unicode[STIX]{x1D713}\unicode[STIX]{x27E7}\frac{\unicode[STIX]{x2202}u_{I}^{s}}{\unicode[STIX]{x2202}s}+\frac{\unicode[STIX]{x2202}\unicode[STIX]{x27E6}\unicode[STIX]{x1D713}\unicode[STIX]{x27E7}}{\unicode[STIX]{x2202}s}(u_{I}^{s}-\unicode[STIX]{x1D6FE}_{\unicode[STIX]{x1D6FE}})\right)\hat{\boldsymbol{s}}=\unicode[STIX]{x27E6}\unicode[STIX]{x1D70F}\unicode[STIX]{x27E7}\hat{\boldsymbol{s}}, & \displaystyle\end{eqnarray}$$
 $$\begin{eqnarray}\displaystyle & \displaystyle \mathbf{0}=\unicode[STIX]{x27E6}p\unicode[STIX]{x27E7}\hat{\boldsymbol{n}}. & \displaystyle\end{eqnarray}$$
Equation (4.7) is still consistent with previous studies (Saffman Reference Saffman1992; Wu, Ma & Zhou Reference Wu, Ma and Zhou2006) in that pressure is continuous across a vortex sheet. This means that the generalized sheet model does not affect the force balance in the normal direction of the sheet. In this sense, equation (2.7) still captures the total force contributed from the pressure term. Now, we further integrate equation (4.6) around the airfoil to obtain
 $$\begin{eqnarray}\unicode[STIX]{x27E6}\boldsymbol{f}_{\unicode[STIX]{x1D70F}}\unicode[STIX]{x27E7}=\unicode[STIX]{x1D70C}\int _{0}^{S_{B}}\left(\frac{\unicode[STIX]{x2202}\unicode[STIX]{x27E6}\unicode[STIX]{x1D713}\unicode[STIX]{x27E7}}{\text{d}t}+\unicode[STIX]{x27E6}\unicode[STIX]{x1D713}\unicode[STIX]{x27E7}\frac{\unicode[STIX]{x2202}u_{I}^{s}}{\unicode[STIX]{x2202}s}+\frac{\unicode[STIX]{x2202}\unicode[STIX]{x27E6}\unicode[STIX]{x1D713}\unicode[STIX]{x27E7}}{\unicode[STIX]{x2202}s}(u_{I}^{s}-\unicode[STIX]{x1D6FE}_{\unicode[STIX]{x1D6FE}})\right)\hat{\boldsymbol{s}}\,\text{d}s+\unicode[STIX]{x1D70C}\sum \unicode[STIX]{x27E6}\unicode[STIX]{x1D713}_{g}\unicode[STIX]{x27E7}\boldsymbol{u}_{g}^{\ast },\end{eqnarray}$$
where
 $\unicode[STIX]{x27E6}\boldsymbol{f}_{\unicode[STIX]{x1D70F}}\unicode[STIX]{x27E7}$
is the jump of the total shear force between the fluid and solid sides of the vortex sheet around the airfoil. Similar to (4.5), the
 $\sum$
term sums up the momentum flux,
 $\unicode[STIX]{x27E6}\unicode[STIX]{x1D712}_{g}\unicode[STIX]{x27E7}$
, entering each attached free vortex sheet.
 $\boldsymbol{u}_{g}^{\ast }$
is the momentum-based characteristic velocity of a free vortex sheet, satisfying
 $u_{g}^{\ast }=\unicode[STIX]{x27E6}\unicode[STIX]{x1D712}_{g}\unicode[STIX]{x27E7}/\unicode[STIX]{x27E6}\unicode[STIX]{x1D713}_{g}\unicode[STIX]{x27E7}$
. It is noted that the fluid side of
 $\unicode[STIX]{x1D6FE}_{\unicode[STIX]{x1D6FE}}$
is a free shear surface with zero shear stress,
 $\unicode[STIX]{x27E6}\boldsymbol{f}_{\unicode[STIX]{x1D70F}}\unicode[STIX]{x27E7}$
is actually the unsteady viscous drag exerted by the solid body, which is not captured by (2.7). Similar to that reported by Liu, Zhu & Wu (Reference Liu, Zhu and Wu2015b
), the term
 $\unicode[STIX]{x27E6}\unicode[STIX]{x1D713}\unicode[STIX]{x27E7}$
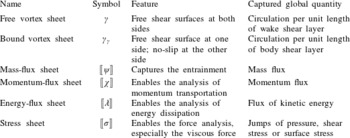
in this study is also the core parameter in drag generation, while here the calculation is performed for the unsteady case. Last, we note that other necessary global quantities and discontinuities can also be superimposed at the location of the original vortex sheet at the solution level for improved force calculation and accurate prediction of vortex-sheet formation, as summarized in table 1.
A summary of the sheet models for a viscous shear layer.
 $\unicode[STIX]{x27E6}\unicode[STIX]{x1D706}\unicode[STIX]{x27E7}$
is defined as
 $\unicode[STIX]{x27E6}\unicode[STIX]{x1D706}\unicode[STIX]{x27E7}=\int _{0}^{\unicode[STIX]{x1D6FF}_{s}}(u^{s})^{3}\,\text{d}n$
.

4.2 Momentum balance for a finite-angle trailing edge
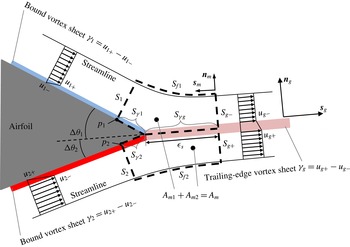
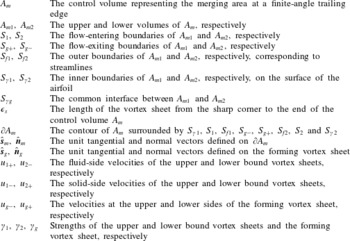
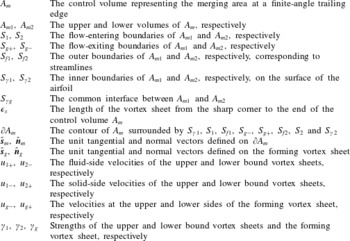
With the generalized sheet model proposed in § 4.1, we are now ready to derive the momentum balance for the merging flow at a finite-angle trailing edge, a schematic of which is provided in figure 4 with the main notations explained in table 2. To formulate the problem, a 2-D material volume
 $A_{m}$
is defined in the body-fixed reference frame with its boundary
 $\unicode[STIX]{x2202}A_{m}$
marked by the dashed contour.
 $\unicode[STIX]{x1D716}_{s}$
is the characteristic length of
 $A_{m}$
, and is defined as the length of the common interface
 $S_{\unicode[STIX]{x1D6FE}g}$
between
 $A_{m1}$
and
 $A_{m2}$
as shown in figure 4. It is noted that the bulk of the merging area
 $A_{m}$
is immersed in the inviscid flow outside the sheet system. This is because the inviscid flow also plays an essential part in dictating the flow regime near the trailing edge. In fact, for large Reynolds number situation, where mass and momentum contributions from the viscous shear layer become negligible, the direction of the trailing-edge streamline should be solely governed by the inviscid flow. Here, a few physical assumptions and conditions are listed to simplify this problem.
-
(i) The merging process does not happen until the upper and lower streams meet each other at the trailing edge, so any lead region of
$A_{m}$
before the trailing edge should be much smaller than
$A_{m}$
itself. To this end, the lengths of
$S_{\unicode[STIX]{x1D6FE}1}$
and
$S_{\unicode[STIX]{x1D6FE}2}$
are assumed to be
$o(\unicode[STIX]{x1D716}_{s})$
, whereas all other surfaces of
$A_{m}$
, including
$S_{1}$
,
$S_{f1}$
,
$S_{g-}$
,
$S_{g+}$
,
$S_{f2}$
and
$S_{2}$
, have dimension of
$O(\unicode[STIX]{x1D716}_{s})$
. -
(ii)
$S_{f1}$
and
$S_{f2}$
coincide with streamlines, so there is no mass flux across the surfaces and
$u_{n}=\boldsymbol{u}\boldsymbol{\cdot }\hat{\boldsymbol{n}}_{m}=0$
. -
(iii) Assuming the flow field changes smoothly,
$\unicode[STIX]{x2202}/\unicode[STIX]{x2202}t$
of any quantity is finite.


The formation of a free vortex sheet at a finite-angle trailing edge. The definitions of the main symbols are listed in table 2.

Nomenclature table summarizing the main notations in figure 4.
To obtain the momentum balance equations, we start with the mass conservation. Note that the dividing surface
 $S_{\unicode[STIX]{x1D6FE}g}$
overlaps with the forming vortex sheet, so there is no mass flux across it and the mass conservation for
 $A_{m}$
can be written separately for
 $A_{m1}$
and
 $A_{m2}$
in the form
 $$\begin{eqnarray}\displaystyle & \displaystyle \frac{\text{d}}{\text{d}t}\int _{A_{m1}}\unicode[STIX]{x1D70C}\,\text{d}A=\int _{A_{m1}}\frac{\unicode[STIX]{x2202}\unicode[STIX]{x1D70C}}{\unicode[STIX]{x2202}t}\,\text{d}A+\oint _{\unicode[STIX]{x2202}A_{m1}}\unicode[STIX]{x1D70C}(\boldsymbol{u}\boldsymbol{\cdot }\hat{\boldsymbol{n}}_{m})\,\text{d}s=0, & \displaystyle\end{eqnarray}$$
 $$\begin{eqnarray}\displaystyle & \displaystyle \frac{\text{d}}{\text{d}t}\int _{A_{m2}}\unicode[STIX]{x1D70C}\,\text{d}A=\int _{A_{m2}}\frac{\unicode[STIX]{x2202}\unicode[STIX]{x1D70C}}{\unicode[STIX]{x2202}t}\,\text{d}A+\oint _{\unicode[STIX]{x2202}A_{m2}}\unicode[STIX]{x1D70C}(\boldsymbol{u}\boldsymbol{\cdot }\hat{\boldsymbol{n}}_{m})\,\text{d}s=0. & \displaystyle\end{eqnarray}$$
For the bulk of
 $A_{m}$
, which contains incompressible isotropic Newtonian fluid, the momentum equation in the body-fixed reference frame is expressed as
 $$\begin{eqnarray}\frac{\text{d}\boldsymbol{u}}{\text{d}t}=\frac{1}{\unicode[STIX]{x1D70C}}\left(-\unicode[STIX]{x1D735}p+\unicode[STIX]{x1D735}\boldsymbol{\cdot }\unicode[STIX]{x1D749}\right)+\dot{\boldsymbol{u}}_{\unicode[STIX]{x1D6FA}},\end{eqnarray}$$
where
 $\unicode[STIX]{x1D749}$
is the shear stress tensor. Here,
 $\dot{\boldsymbol{u}}_{\unicode[STIX]{x1D6FA}}=-2\unicode[STIX]{x1D734}\times \boldsymbol{u}-\unicode[STIX]{x1D734}\times (\unicode[STIX]{x1D734}\times \boldsymbol{r})-\dot{\boldsymbol{U}}_{b}-\dot{\unicode[STIX]{x1D734}}\times \boldsymbol{r}$
, where
 $\dot{\boldsymbol{U}}_{b}=-\dot{\boldsymbol{U}}$
represents the linear acceleration of the airfoil and
 $\boldsymbol{U}$
is the translational background flow velocity at the infinity in the body-fixed reference frame.
 $\dot{\unicode[STIX]{x1D734}}$
is the angular acceleration of the airfoil and
 $\boldsymbol{r}$
is the position vector relative to the rotation centre. At this point, the momentum conservation for the whole
 $A_{m}$
can be derived as
 $$\begin{eqnarray}\displaystyle \frac{\text{d}}{\text{d}t}\int _{A_{m}}\unicode[STIX]{x1D70C}\boldsymbol{u}\,\text{d}A & = & \displaystyle \int _{A_{m}}\frac{\unicode[STIX]{x2202}(\unicode[STIX]{x1D70C}\boldsymbol{u})}{\unicode[STIX]{x2202}t}\,\text{d}A+\oint _{\unicode[STIX]{x2202}A_{m}}\unicode[STIX]{x1D70C}\boldsymbol{u}(\boldsymbol{u}\boldsymbol{\cdot }\hat{\boldsymbol{n}}_{m})\,\text{d}s\nonumber\\ \displaystyle & = & \displaystyle \int _{A_{m}-}\left(-\unicode[STIX]{x1D735}p+\unicode[STIX]{x1D735}\boldsymbol{\cdot }\unicode[STIX]{x1D749}+\unicode[STIX]{x1D70C}\dot{\boldsymbol{u}}_{\unicode[STIX]{x1D6FA}}\right)\,\text{d}A\nonumber\\ \displaystyle & & \displaystyle +\,\int _{S_{\unicode[STIX]{x1D6FE}1}+S_{\unicode[STIX]{x1D6FE}2}+S_{\unicode[STIX]{x1D6FE}g}}(\unicode[STIX]{x27E6}\unicode[STIX]{x1D749}\unicode[STIX]{x27E7}+\unicode[STIX]{x1D735}\boldsymbol{\cdot }\unicode[STIX]{x1D64F}_{s})\,\text{d}s,\end{eqnarray}$$
where
 $S_{\unicode[STIX]{x1D6FE}1}$
,
 $S_{\unicode[STIX]{x1D6FE}2}$
and
 $S_{\unicode[STIX]{x1D6FE}g}$
correspond to the vortex sheets in
 $A_{m}$
and
 $A_{m-}$
denotes the bulk of
 $A_{m}$
excluding
 $S_{\unicode[STIX]{x1D6FE}1}$
,
 $S_{\unicode[STIX]{x1D6FE}2}$
and
 $S_{\unicode[STIX]{x1D6FE}g}$
. The first term in the second equation is obtained by integrating equation (4.11), whereas the second term is derived from (4.4) with the pressure jump across a vortex sheet being zero.
Considering the infinitesimal size of the control volume normal to the vortex sheets, any variation of the velocity over
 $S_{1}$
,
 $S_{2}$
,
 $S_{g-}$
and
 $S_{g+}$
is neglected. Together with condition (ii) of this section, equations (4.9) and (4.10) can be further derived as
 $$\begin{eqnarray}\displaystyle & \displaystyle u_{1+}S_{1}+\unicode[STIX]{x27E6}\unicode[STIX]{x1D713}_{1}\unicode[STIX]{x27E7}+u_{g-}S_{g-}+\unicode[STIX]{x27E6}\unicode[STIX]{x1D713}_{g-}\unicode[STIX]{x27E7}=0, & \displaystyle\end{eqnarray}$$
 $$\begin{eqnarray}\displaystyle & \displaystyle u_{2-}S_{2}+\unicode[STIX]{x27E6}\unicode[STIX]{x1D713}_{2}\unicode[STIX]{x27E7}+u_{g+}S_{g+}+\unicode[STIX]{x27E6}\unicode[STIX]{x1D713}_{g+}\unicode[STIX]{x27E7}=0, & \displaystyle\end{eqnarray}$$
where the velocities associated with the vortex sheets (
 $u_{1-}$
,
 $u_{1+}$
,
 $u_{2-}$
,
 $u_{2+}$
,
 $u_{g-}$
and
 $u_{g+}$
) are normal to the surfaces of
 $A_{m}$
and are calculated from
 $u_{n}=\boldsymbol{u}\boldsymbol{\cdot }\hat{\boldsymbol{n}}_{m}$
. The jump of the streamfunction is applied here to account for the mass flux associated with a vortex sheet, similar to (4.1). And the mass flux associated with the forming vortex sheet is divided into
 $\unicode[STIX]{x27E6}\unicode[STIX]{x1D713}_{g-}\unicode[STIX]{x27E7}$
and
 $\unicode[STIX]{x27E6}\unicode[STIX]{x1D713}_{g-}\unicode[STIX]{x27E7}$
by the trailing-edge streamline.
To simplify (4.12), we first apply conditions (i) and (iii) of the current section to argue that the integral associated with
 $\unicode[STIX]{x2202}(\unicode[STIX]{x1D70C}\boldsymbol{u})/\unicode[STIX]{x2202}t$
has magnitude
 $O(\unicode[STIX]{x1D716}_{s}^{2})$
. Physically,
 $p$
is continuous so
 $\unicode[STIX]{x1D735}p$
should be finite. Moreover,
 $\unicode[STIX]{x1D735}\boldsymbol{\cdot }\unicode[STIX]{x1D749}=0$
holds for
 $A_{m-}$
because it corresponds to the inviscid flow outside the vortex sheets. Together with the boundedness of
 $\dot{\boldsymbol{u}}_{\unicode[STIX]{x1D6FA}}$
, equation (4.12) is reduced to
 $$\begin{eqnarray}\oint _{\unicode[STIX]{x2202}A_{m}}\boldsymbol{u}(\boldsymbol{u}\boldsymbol{\cdot }\hat{\boldsymbol{n}}_{m})\,\text{d}s+O(\unicode[STIX]{x1D716}_{s}^{2})=\frac{1}{\unicode[STIX]{x1D70C}}\int _{S_{\unicode[STIX]{x1D6FE}1}+S_{\unicode[STIX]{x1D6FE}2}+S_{\unicode[STIX]{x1D6FE}g}}(\unicode[STIX]{x27E6}\unicode[STIX]{x1D749}\unicode[STIX]{x27E7}+\unicode[STIX]{x1D735}\boldsymbol{\cdot }\unicode[STIX]{x1D64F}_{s})\,\text{d}s.\end{eqnarray}$$
In the current study, there is no surface tension so
 $\unicode[STIX]{x1D735}\boldsymbol{\cdot }\unicode[STIX]{x1D64F}_{s}=0$
.
 $S_{\unicode[STIX]{x1D6FE}g}$
corresponds to the free vortex sheet which physically means
 $\unicode[STIX]{x27E6}\unicode[STIX]{x1D749}\unicode[STIX]{x27E7}=0$
. Furthermore,
 $\unicode[STIX]{x27E6}\unicode[STIX]{x1D749}\unicode[STIX]{x27E7}$
is finite on the bound vortex sheets
 $S_{\unicode[STIX]{x1D6FE}1}$
and
 $S_{\unicode[STIX]{x1D6FE}2}$
according to (4.6). With condition (i), the right-hand side of (4.15) becomes
 $o(\unicode[STIX]{x1D716}_{s})$
. Now, applying the velocity boundary conditions of
 $\unicode[STIX]{x2202}A_{m}$
, the momentum balance can be written in the
 $\hat{\boldsymbol{s}}_{g}$
and
 $\hat{\boldsymbol{n}}_{g}$
directions, respectively, in the form
 $$\begin{eqnarray}\displaystyle & & \displaystyle (u_{1+}^{2}S_{1}+\unicode[STIX]{x27E6}\unicode[STIX]{x1D713}_{1}\unicode[STIX]{x27E7}u_{1+}^{\ast })\cos \unicode[STIX]{x0394}\unicode[STIX]{x1D703}_{1}+(u_{2-}^{2}S_{2}+\unicode[STIX]{x27E6}\unicode[STIX]{x1D713}_{2}\unicode[STIX]{x27E7}u_{2+}^{\ast })\cos \unicode[STIX]{x0394}\unicode[STIX]{x1D703}_{2}\nonumber\\ \displaystyle & & \displaystyle \quad =u_{g-}^{2}S_{g-}+\unicode[STIX]{x27E6}\unicode[STIX]{x1D713}_{g-}\unicode[STIX]{x27E7}u_{g-}^{\ast }+u_{g+}^{2}S_{g+}+\unicode[STIX]{x27E6}\unicode[STIX]{x1D713}_{g+}\unicode[STIX]{x27E7}u_{g+}^{\ast }+O(\unicode[STIX]{x1D716}_{s}^{2})+o(\unicode[STIX]{x1D716}_{s}),\end{eqnarray}$$
 $$\begin{eqnarray}\displaystyle & & \displaystyle (u_{1+}^{2}S_{1}+\unicode[STIX]{x27E6}\unicode[STIX]{x1D713}_{1}\unicode[STIX]{x27E7}u_{1+}^{\ast })\sin \unicode[STIX]{x0394}\unicode[STIX]{x1D703}_{1}\nonumber\\ \displaystyle & & \displaystyle \quad =(u_{2-}^{2}S_{2}+\unicode[STIX]{x27E6}\unicode[STIX]{x1D713}_{2}\unicode[STIX]{x27E7}u_{2+}^{\ast })\sin \unicode[STIX]{x0394}\unicode[STIX]{x1D703}_{2}+O(\unicode[STIX]{x1D716}_{s}^{2})+o(\unicode[STIX]{x1D716}_{s}),\end{eqnarray}$$
where the superscript
 $^{\ast }$
denotes the characteristic velocity scale based on the momentum flux of a vortex sheet, similar to (4.8).
In general, the
 $\unicode[STIX]{x27E6}\unicode[STIX]{x1D713}\unicode[STIX]{x27E7}$
and
 $u^{\ast }$
terms need to be given or solved for an actual flow. In the current study, for the large Reynolds number situation, the mass and momentum associated with the vortex sheet are neglected as a first approximation. So the
 $\unicode[STIX]{x27E6}\unicode[STIX]{x1D713}\unicode[STIX]{x27E7}$
and
 $u^{\ast }$
terms become zero in (4.13), (4.14), (4.16) and (4.17). Furthermore, the terms
 $O(\unicode[STIX]{x1D716}_{s}^{2})$
and
 $o(\unicode[STIX]{x1D716}_{s})$
can be neglected in the limit
 $\unicode[STIX]{x1D716}_{s}\rightarrow 0$
. So (4.17) gives
 $\unicode[STIX]{x0394}\unicode[STIX]{x1D703}_{1}\boldsymbol{\cdot }\unicode[STIX]{x0394}\unicode[STIX]{x1D703}_{2}\geqslant 0$
. Since
 $$\begin{eqnarray}\unicode[STIX]{x0394}\unicode[STIX]{x1D703}_{1}+\unicode[STIX]{x0394}\unicode[STIX]{x1D703}_{2}=\unicode[STIX]{x0394}\unicode[STIX]{x1D703}_{0},\end{eqnarray}$$
it yields
 $\unicode[STIX]{x0394}\unicode[STIX]{x1D703}_{1},\unicode[STIX]{x0394}\unicode[STIX]{x1D703}_{2}\geqslant 0$
which means that the direction of the forming vortex sheet should vary between the two tangents of the trailing-edge surfaces. Now, we can combine (4.13), (4.14), (4.16) and (4.17) and cancel
 $S_{1}$
,
 $S_{2}$
,
 $S_{g-}$
and
 $S_{g+}$
to obtain
 $$\begin{eqnarray}u_{1+}u_{2-}\sin \unicode[STIX]{x0394}\unicode[STIX]{x1D703}_{0}-u_{1+}u_{g+}\sin \unicode[STIX]{x0394}\unicode[STIX]{x1D703}_{1}-u_{2-}u_{g-}\sin \unicode[STIX]{x0394}\unicode[STIX]{x1D703}_{2}=0.\end{eqnarray}$$
This gives the momentum balance at a finite-angle trailing edge for large Reynolds number flow. Equation (4.19) offers another relation between the forming vortex sheet (
 $u_{g+}$
,
 $u_{g-}$
,
 $\unicode[STIX]{x0394}\unicode[STIX]{x1D703}_{1}$
and
 $\unicode[STIX]{x0394}\unicode[STIX]{x1D703}_{2}$
) and the existing bound vortex sheets (
 $u_{1+}$
and
 $u_{2-}$
). It will be applied in the next section to solve
 $\unicode[STIX]{x1D6FE}_{g}$
,
 $u_{g}$
and
 $\unicode[STIX]{x1D703}_{g}$
of the forming vortex sheet.
5 Explicit form of Kutta condition for general unsteady flow
The forming vortex sheet at a finite-angle trailing edge has been related to its connecting bound vortex sheets through (3.5) and (4.19). For bound vortex sheets, the no-slip boundary condition gives
 $u_{1-}=0$
and
 $u_{2+}=0$
, so
 $\unicode[STIX]{x1D6FE}_{1}=u_{1+}$
and
 $\unicode[STIX]{x1D6FE}_{2}=-u_{2-}$
. Thus, equation (3.5) takes the form
 $$\begin{eqnarray}\unicode[STIX]{x1D6FE}_{g}=-u_{g-}+u_{g+}=u_{1+}\cos \unicode[STIX]{x0394}\unicode[STIX]{x1D703}_{1}-u_{2-}\cos \unicode[STIX]{x0394}\unicode[STIX]{x1D703}_{2}.\end{eqnarray}$$
So far, only two equations are provided while three unknowns,
 $u_{g+}$
,
 $u_{g-}$
and
 $\unicode[STIX]{x0394}\unicode[STIX]{x1D703}_{1}$
(or
 $\unicode[STIX]{x0394}\unicode[STIX]{x1D703}_{2}$
), need to be solved.
Here, we present an additional relationship between the forming vortex sheet and the bound vortex sheets to close the equation system. Recognizing that in general vorticity generation only happens at the fluid–solid interface and that the merging zone
 $A_{m}$
behind the trailing edge is barely connected to the airfoil body, we hypothesize that the total vorticity generation as fluid passing
 $A_{m}$
should approach zero in the limiting case
 $A_{m}\rightarrow 0$
. In other words, the total change of circulation in
 $A_{m}$
should equal zero, which can be interpreted as an extension of the Kelvin’s circulation theorem. Physically, the vortex-sheet system near the trailing edge consists of two surface-bounded vortex sheets and a free vortex sheet released to form the wake. Each of these vortex sheets can be considered as a material sheet advected following its local velocity field. In this sense, the vorticity of the forming vortex sheet is not ‘generated’ at the trailing edge, but is the result of vorticity advection of the surface-bounded vortex sheets. To substantiate this hypothesis, a detailed derivation consistent with the current framework is provided in appendix C, where (C 9) or (C 10) provides the desired relationship.
At this point, we are ready to solve the explicit form of the unsteady Kutta condition using (5.1), (4.19) and (C 9). We first combine (C 9) and (5.1) to express
 $u_{g-}$
and
 $u_{g+}$
in terms of
 $u_{1+}$
,
 $u_{2-}$
,
 $\unicode[STIX]{x0394}\unicode[STIX]{x1D703}_{1}$
and
 $\unicode[STIX]{x0394}\unicode[STIX]{x1D703}_{2}$
. And the results can be further plugged into (4.19) to give
 $$\begin{eqnarray}\left.\begin{array}{@{}ll@{}}\displaystyle (u_{1+}\sin \unicode[STIX]{x0394}\unicode[STIX]{x1D703}_{1}+u_{2-}\sin \unicode[STIX]{x0394}\unicode[STIX]{x1D703}_{2})^{2}(u_{1+}\sin \unicode[STIX]{x0394}\unicode[STIX]{x1D703}_{1}-u_{2-}\sin \unicode[STIX]{x0394}\unicode[STIX]{x1D703}_{2})=0 & \text{for}\;u_{1+}\neq u_{2-},\\ \displaystyle -\cos \unicode[STIX]{x0394}\unicode[STIX]{x1D703}_{1}+\cos \unicode[STIX]{x0394}\unicode[STIX]{x1D703}_{2}=0 & \text{for}\;u_{1+}=u_{2-}.\end{array}\right\}\end{eqnarray}$$
Since
 $\unicode[STIX]{x0394}\unicode[STIX]{x1D703}_{1},\unicode[STIX]{x0394}\unicode[STIX]{x1D703}_{2}\geqslant 0$
, equation (5.2) has the simplified form
 $$\begin{eqnarray}u_{1+}\sin \unicode[STIX]{x0394}\unicode[STIX]{x1D703}_{1}-u_{2-}\sin \unicode[STIX]{x0394}\unicode[STIX]{x1D703}_{2}=0.\end{eqnarray}$$
Again, because
 $\unicode[STIX]{x0394}\unicode[STIX]{x1D703}_{1},\unicode[STIX]{x0394}\unicode[STIX]{x1D703}_{2}\geqslant 0$
and
 $0\leqslant \unicode[STIX]{x0394}\unicode[STIX]{x1D703}_{0}<\unicode[STIX]{x03C0}$
, this equation indicates that
 $u_{1+}$
and
 $u_{2-}$
cannot take different signs. In the current study of vortex shedding (
 $u_{g-},u_{g+}\geqslant 0$
), this further indicates
 $u_{1+},u_{2-}\leqslant 0$
which means no backward flow. Finally, with (4.18), equation (5.3) becomes
 $$\begin{eqnarray}\left.\begin{array}{@{}ll@{}}\displaystyle \unicode[STIX]{x0394}\unicode[STIX]{x1D703}_{1}=\cos ^{-1}\!\left(\frac{u_{1+}^{2}+u_{3}^{2}-u_{2-}^{2}}{2u_{1+}u_{3}}\right)\!,\quad \unicode[STIX]{x0394}\unicode[STIX]{x1D703}_{2}=\cos ^{-1}\!\left(\frac{u_{2-}^{2}+u_{3}^{2}-u_{1+}^{2}}{2u_{2-}u_{3}}\right)\! & \text{for}\;u_{1+},u_{2-}<0,\\ \displaystyle \unicode[STIX]{x0394}\unicode[STIX]{x1D703}_{1}=0,\quad \unicode[STIX]{x0394}\unicode[STIX]{x1D703}_{2}=\unicode[STIX]{x0394}\unicode[STIX]{x1D703}_{0} & \text{for}\;u_{2-}=0,\\ \displaystyle \unicode[STIX]{x0394}\unicode[STIX]{x1D703}_{1}=\unicode[STIX]{x0394}\unicode[STIX]{x1D703}_{0},\quad \unicode[STIX]{x0394}\unicode[STIX]{x1D703}_{1}=0 & \text{for}\;u_{1+}=0,\end{array}\right\}\end{eqnarray}$$
where
 $u_{3}=-\sqrt{u_{1+}^{2}+u_{2-}^{2}+2u_{1+}u_{2-}\cos \unicode[STIX]{x0394}\unicode[STIX]{x1D703}_{0}}$
. Therefore, equation (5.4) analytically determines the direction of the forming vortex sheet (
 $\unicode[STIX]{x1D703}_{g}$
) at the trailing edge. The current work is derived for the case where no backward flow is present at the trailing edge; and for the special case of a flat plate it predicts the angle of the trailing-edge streamline to be tangential to the plate, which is consistent with the ‘full’ Kutta condition derived by Orszag & Crow (Reference Orszag and Crow1970), Daniels (Reference Daniels1978) for flat plates. Equation (5.4) can be plugged into (C 10) and (5.1) to obtain the analytical vortex-sheet strength (
 $\unicode[STIX]{x1D6FE}_{g}$
) and relative velocity (
 $u_{g}$
). This closes the task of deriving the explicit form of the unsteady Kutta condition based on the existing bound vortex sheets. The implementation of this condition will be presented in § 6.1. In the remaining part of this section, we shall discuss the significance of this work and its potential extension to the leading-edge vortex-sheet formation on a smooth surface.
The classical Kutta condition requires the rear stagnation streamline of an airfoil to be attached to the sharp trailing edge. Physically, this means that flow cannot turn around the sharp edge. For steady flow at the trailing edge, Poling & Telionis (Reference Poling and Telionis1986) has summarized a number of conditions that are equivalent to this condition:
-
(i) Continuous pressure at the trailing edge.
-
(ii) The velocity at the trailing edge is finite or zero.
-
(iii) The shedding of vorticity vanishes (
$\unicode[STIX]{x1D6FE}_{g}=0$
). -
(iv) The stagnation streamline bisects the wedge angle of the trailing edge (
$\unicode[STIX]{x0394}\unicode[STIX]{x1D703}_{1}=\unicode[STIX]{x0394}\unicode[STIX]{x1D703}_{2}$
).


For unsteady flow at the trailing edge, only condition (i) is valid according to Basu & Hancock (Reference Basu and Hancock1978) and Poling & Telionis (Reference Poling and Telionis1986). The difference for an unsteady trailing-edge flow lies in the ambiguity of the direction of the stagnation streamline line. Giesing (Reference Giesing1969) and Maskell (Reference Maskell1971) have proposed that either
 $\unicode[STIX]{x0394}\unicode[STIX]{x1D703}_{1}=0$
or
 $\unicode[STIX]{x0394}\unicode[STIX]{x1D703}_{2}=0$
should be satisfied at the trailing edge. Although Poling & Telionis (Reference Poling and Telionis1986) have provided experimental support for this model when
 $\unicode[STIX]{x1D6FE}_{g}$
is large, they also pointed out a serious flaw that the Giesing–Maskell model does not approach the steady solution (condition (iv)) as
 $\unicode[STIX]{x1D6FE}_{g}\rightarrow 0$
. Poling & Telionis (Reference Poling and Telionis1986) further confirmed this flaw as they observed a smooth change between the scenarios of
 $\unicode[STIX]{x0394}\unicode[STIX]{x1D703}_{1}=0$
and
 $\unicode[STIX]{x0394}\unicode[STIX]{x1D703}_{2}=0$
when
 $\unicode[STIX]{x1D6FE}_{g}$
approaches zero.
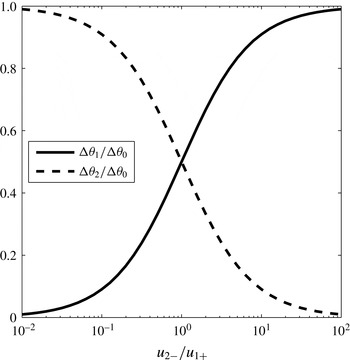
The angle of the stagnation streamline (or the forming vortex sheet) vs. the ratio between
 $u_{2-}$
and
 $u_{1+}$
.

The current model provides a compelling explanation for the flaw of the Giesing–Maskell model, as we have analytically derived in (5.4) the relationship between the angle of the stagnation streamline (or the forming vortex sheet) and the flow velocities at both sides of the trailing edge. The result of (5.4) can be interpreted by figure 5, where
 $\unicode[STIX]{x0394}\unicode[STIX]{x1D703}_{1}$
and
 $\unicode[STIX]{x0394}\unicode[STIX]{x1D703}_{2}$
vary between 0 and
 $\unicode[STIX]{x0394}\unicode[STIX]{x1D703}_{0}$
, and are solely determined by
 $u_{2-}/u_{1+}$
. We note that
 $\unicode[STIX]{x0394}\unicode[STIX]{x1D703}_{1}=0$
or
 $\unicode[STIX]{x0394}\unicode[STIX]{x1D703}_{2}=0$
can be obtained as
 $u_{2-}=0$
or
 $u_{1+}=0$
, respectively. This indicates that the Giesing–Maskell model actually corresponds to the two limiting cases of the current model. We also note that condition (iv) of the steady solution can be recovered at
 $u_{2-}/u_{1+}=1$
. Most importantly, the continuous transition between the Giesing–Maskell model and the steady solution is fully captured as
 $u_{2-}/u_{1+}$
varies between 0 and
 $\infty$
. We believe that the flaw of the Giesing–Maskell model is originated from the non-physical assumption that the potential flow on either side of the trailing edge has to be stagnant on all occasions. In fact, this stagnation assumption could be true on the suction side of the trailing edge if the preceding flow has already separated. However, if the flow remains attached on both side of the trailing edge, the flow being stagnant on either side of the trailing edge is not justified.
The current model for the trailing-edge vortex sheet is based on conservation laws and the unsteady Kutta condition which only requires a continuous pressure distribution. In this sense, there should not be any fundamental difference for the formation of a vortex sheet due to flow separation on a smooth surface. Thus, we further propose to extend this model to deciding the formation of a leading-edge vortex sheet. For this purpose, the separated vortex sheet can be viewed as being generated due to the merging of the two bound vortex sheets at both sides of the separation point. Considering the actual viscous shear layers near a separation point as shown in figure 6, the downstream-side shear layer consists of a reverse-flow layer and a separated-flow layer. In the vortex-sheet limit, the reverse-flow layer becomes the bound vortex sheet while the separated-flow layer becomes the separated vortex sheet. Apparently, the velocities at both sides of the reverse-flow layer are zero (
 $u_{2+}=u_{2-}=0$
), meaning the corresponding bound vortex-sheet strength is zero (
 $\unicode[STIX]{x1D6FE}_{2}=0$
) near the separation point. Based on the above discussions, we can attribute the formation of the separated vortex sheet to the scenario of the Giesing–Maskell model. Because
 $\unicode[STIX]{x0394}\unicode[STIX]{x1D703}_{0}=\unicode[STIX]{x03C0}$
for a smooth surface, we immediately obtain
 $\unicode[STIX]{x0394}\unicode[STIX]{x1D703}_{1}=0$
and
 $\unicode[STIX]{x0394}\unicode[STIX]{x1D703}_{2}=\unicode[STIX]{x03C0}$
, which means that the forming vortex sheet from a separation point of a smooth surface should be tangential to the surface. Finally, applying (C 10) and (5.1) gives the strength and velocity of the forming vortex sheet, which are actually equal to the values of its upstream bound vortex sheet (
 $\unicode[STIX]{x1D6FE}_{g}=\unicode[STIX]{x1D6FE}_{1}$
and
 $u_{g}=u_{1+}/2$
).
The structure of viscous sheer layers and the corresponding vortex sheets near a flow separation point on a smooth surface. It is noted that
 $u_{2+}=u_{2-}=0$
and
 $\unicode[STIX]{x1D6FE}_{2}=0$
.

6 Simulations and validations
To verify the unsteady flow model together with the vortex-sheet formation conditions for a 2-D airfoil, this section will simulate different airfoils in steady and unsteady background flows, and then compare the results with experimental data or empirical models. Here, we note that the formation of the leading-edge vortex sheet at large angle of attack (AoA) requires predicting the leading-edge separation point, which could be a topic of a future investigation. Furthermore, equation (5.4) implies that the current unsteady Kutta condition applies to the situation where no backward flow presents at the trailing edge. This means that the model does not account for any separation happening before the trailing edge, which would likely to occur for highly unsteady flows. To this end, the following assumes fully attached flow and vortex shedding only at the trailing edge. For this reason, the applications of this study are limited to small-to-medium AoA regimes, where the flow might be considered to remain attached without losing much accuracy.
Discretization of the bound and wake vortex sheets. The panels representing the bound vortex sheet have linearly varied strength. The
 $g$
panel represents the vortex-sheet segment being formed instantaneously at the trailing edge. For the
 $n$
th panel of the bound vortex sheet, the red point represents the control point located at
 $z_{C}^{n}$
, which is also the centre of the panel.
 $N_{B}$
and
 $N_{T}$
are the total numbers of bound vortex panels and wake point vortices, respectively.

6.1 Numerical approach
This section introduces the numerical approaches for implementing the vortex-sheet-based flow model. Mathematically, a vortex sheet can be viewed as a continuous sheet of point singularities of vorticity. Thus, numerical implementation of the model requires discretization of the bound and wake vortex sheets. In this work, the bound vortex sheet and the wake vortex sheet are treated differently based on the following considerations. As the shape of the airfoil is given, each element of the bound vortex sheet is considered to be fixed locally to the surface of the solid body with varying strength to instantaneously satisfy the wall boundary condition. This inspires us to segment the continuous bound vortex sheet into piecewise linear panels, the essence of which is consistent with the traditional panel method (Morino & Kuo Reference Morino and Kuo1974; Katz Reference Katz1981; Katz & Plotkin Reference Katz and Plotkin1991). On the other hand, since the wake vortex sheet is free, the motion of its element follows the Birkhoff–Rott equation while the strength being invariant under inviscid assumption. Thus, the wake vortex sheet would be constantly deforming subject to its background flow. If the same discretization technique as the bound vortex sheet were to be implemented, refinement and reconstruction of the panel system would be necessary to resolve the shrinking or stretching of each sheet element as well as the curvature change. As a result, the numerical cost would grow rapidly as time proceeds, especially when vortex sheet roll up occurs. In the current study, we discretize the wake vortex sheet with an alternative approach, the point-vortex approximation, which is more computationally efficient. The detailed approaches are provided below.
As discussed previously, the key to determining an instantaneous bound vortex sheet is to solve its strength distribution through (2.6). Accordingly, the bound vortex sheet can be discretized into piecewise linear vortex panels as shown in figure 7. For the
 $n$
th panel, assuming its strength varies linearly from
 $\unicode[STIX]{x1D6FE}_{B}^{n}$
to
 $\unicode[STIX]{x1D6FE}_{B}^{n+1}$
, the complex-conjugate velocity at
 $z$
induced by the vortex-sheet segment corresponding to this panel can be approximated as
 $$\begin{eqnarray}\displaystyle -\frac{\text{i}}{2\unicode[STIX]{x03C0}}\int _{S_{B}^{n-1}}^{S_{B}^{n}}\frac{\unicode[STIX]{x1D6FE}_{B}(s)\,\text{d}s}{z-z_{B}(s)} & {\approx} & \displaystyle -\frac{\text{i}|z_{B}^{n+1}-z_{B}^{n}|}{2\unicode[STIX]{x03C0}(z_{B}^{n+1}-z_{B}^{n})}\left\{\unicode[STIX]{x1D6FE}_{B}^{n}\left[\frac{z-z_{B}^{n+1}}{z_{B}^{n}-z_{B}^{n+1}}\ln \left(\frac{z-z_{B}^{n}}{z-z_{B}^{n+1}}\right)+1\right]\right.\nonumber\\ \displaystyle & & \displaystyle \left.-\,\unicode[STIX]{x1D6FE}_{B}^{n+1}\left[\frac{z-z_{B}^{n}}{z_{B}^{n+1}-z_{B}^{n}}\ln \left(\frac{z-z_{B}^{n+1}}{z-z_{B}^{n}}\right)+1\right]\right\},\end{eqnarray}$$
where
 $z_{B}^{n-1}=z_{B}(S_{B}^{n-1})$
and
 $z_{B}^{n}=z_{B}(S_{B}^{n})$
. For an instantaneous flow, the only unknown parameters are the strengths
 $\unicode[STIX]{x1D6FE}_{B}^{n}$
and
 $\unicode[STIX]{x1D6FE}_{B}^{n+1}$
associated with each vortex panel.
Point-vortex approximation is adopted to discretize the wake vortex sheet, similar to numerous previous studies (Moore Reference Moore1974; Krasny Reference Krasny1986a
,Reference Krasny
b
, Reference Krasny1991; Nitsche & Krasny Reference Nitsche and Krasny1994; Jones Reference Jones2003; Shukla & Eldredge Reference Shukla and Eldredge2007). According to Krasny (Reference Krasny1986a
,Reference Krasny
b
), this approximation is ill posed, meaning the discretization errors would grow in time and lead to irregular configuration of the sheet. Krasny proposed to resolve this problem by applying a filtering technique, which replaces the singular term
 $z^{-1}$
in the complex-conjugate velocity with the so-called vortex-blob kernel,
 $|z|^{2}[(|z|^{2}+\unicode[STIX]{x1D6FF}_{v}^{2})z]^{-1}$
, where
 $\unicode[STIX]{x1D6FF}_{v}$
is a small value compared to
 $|z|$
. As explained by Jones (Reference Jones2003), the essence of this technique is that the desingularization of the velocity kernel would likely to suppress the Kelvin–Helmholtz instability inherent with the discretization at wavelengths below the order of
 $\unicode[STIX]{x1D6FF}_{v}$
. Figure 7 illustrates how point vortices are distributed to represent the wake vortex sheet. As a result, the complex-conjugate velocity induced by the vortex-sheet segment corresponding to the
 $n$
th trailing-edge vortex takes the form
 $$\begin{eqnarray}-\frac{\text{i}}{2\unicode[STIX]{x03C0}}\int _{S_{T}^{n-1}}^{S_{T}^{n}}\frac{\unicode[STIX]{x1D6FE}_{T}(s)\,\text{d}s}{z-z_{T}(s)}\approx -\frac{\text{i}\unicode[STIX]{x1D6E4}_{T}^{n}}{2\unicode[STIX]{x03C0}(z-z_{T}^{n})}\left(\frac{|z-z_{T}^{n}|^{2}}{(|z-z_{T}^{n}|^{2}+\unicode[STIX]{x1D6FF}_{v}^{2})}\right),\end{eqnarray}$$
where
 $z_{T}^{n}$
and
 $\unicode[STIX]{x1D6E4}_{T}^{n}$
are the location and circulation of the
 $n$
th wake vortex, respectively. We note that
 $\unicode[STIX]{x1D6E4}_{T}^{n}$
is an invariant and
 $z_{T}^{n}$
is obtained by evolving the Birkhoff–Rott equation, so they are known quantities for an instantaneous flow.
In accordance with the unsteady Kutta condition developed in § 3.2 and to properly reconcile the different discretization schemes between the bound and wake vortex sheets, a vortex panel of constant strength
 $\unicode[STIX]{x1D6FE}_{g}$
, namely the
 $g$
panel, is employed to represent the segment of the wake vortex sheet being formed at the trailing edge. As shown in figure 7, the
 $g$
panel will be transformed into individual wake vortex as flow evolves, based on the conservation of circulation. The trailing-edge panels are
 $\unicode[STIX]{x1D716}$
(a small number compared to each panel) distance away from the trailing-edge point, which is consistent with the set-up in (3.2) and figure 2, to account for the discontinuous strength of the vortex-sheet system. The complex-conjugate velocity induced by the vortex-sheet segment corresponding to
 $g$
panel can be expressed as
 $$\begin{eqnarray}-\frac{\text{i}}{2\unicode[STIX]{x03C0}}\int _{\unicode[STIX]{x1D716}}^{S_{T}^{1}}\frac{\unicode[STIX]{x1D6FE}_{T}(s)\,\text{d}s}{z-z_{T}(s)}\approx -\frac{\text{i}\unicode[STIX]{x1D6FE}_{g}|z_{g}^{1}-z_{g}^{0}|}{2\unicode[STIX]{x03C0}(z_{g}^{1}-z_{g}^{0})}\ln \left(\frac{z-z_{g}^{0}}{z-z_{g}^{1}}\right),\end{eqnarray}$$
where
 $z_{g}^{0}=z_{T}(\unicode[STIX]{x1D716})$
and
 $z_{g}^{1}=z_{T}(S_{T}^{1})$
. Now, we have completed the task of discretizing the total vortex-sheet system.
The following summarizes the procedure for advancing the simulation from
 $t$
to
 $t^{\prime }=t+\unicode[STIX]{x0394}t$
.
Step 1: Wake evolution. By the end of the previous step, the flow field is solved, so
 $z_{B}^{n}(t)$
,
 $\unicode[STIX]{x1D6FE}_{B}^{n}(t)$
,
 $z_{T}^{n}(t)$
,
 $\unicode[STIX]{x1D6E4}_{T}^{n}(t)$
,
 $z_{g}^{1}(t)$
and
 $\unicode[STIX]{x1D6FE}_{g}(t)$
are known variables. To obtain the wake distribution for the new step, the
 $g$
panel is first replaced by a new point vortex using
 $$\begin{eqnarray}\displaystyle & \displaystyle z_{T}^{N_{T}+1}(t^{\prime })=(z_{g}^{0}(t)+z_{g}^{1}(t))/2, & \displaystyle\end{eqnarray}$$
 $$\begin{eqnarray}\displaystyle & \displaystyle \unicode[STIX]{x1D6E4}_{T}^{N_{T}+1}(t^{\prime })=\unicode[STIX]{x1D6FE}_{g}(t)|z_{g}^{1}(t)-z_{g}^{0}(t)|, & \displaystyle\end{eqnarray}$$
where the latter is essentially the conservation of circulation. Then,
 $z_{T}^{n}(t^{\prime })$
of each wake vortex is evolved by integrating the Birkhoff–Rott equation with a fourth-order Runge-Kutta scheme.
Step 2: Motion update. Since the motion of the airfoil is prescribed in this study, the translational and rotational motions of the airfoil,
 $U(t^{\prime })$
and
 $\unicode[STIX]{x1D6FA}(t^{\prime })$
, need to be updated. If the airfoil is deformable, updating
 $z_{B}^{n}(t^{\prime })$
is also necessary.
Step 3:
 $g$
panel addition. The new
 $g$
panel at
 $t^{\prime }$
should be added based on the proposed unsteady Kutta condition. This requires a full knowledge of its connecting bound vortex panels at
 $t^{\prime }$
, which are yet to be computed. Here, the bound vortex panels together with the
 $g$
panel are solved in a coupled sense. To avoid nonlinearity in solving this coupled system, the direction
 $\unicode[STIX]{x1D703}_{g}(t^{\prime })$
and shedding velocity
 $u_{g}(t^{\prime })$
of the
 $g$
panel are computed from (5.4), (5.1) and (C 10), based on the bound vortex panels of the previous time step. Consequently,
 $z_{g}^{1}(t^{\prime })$
can be decided from
 $$\begin{eqnarray}z_{g}^{1}(t^{\prime })=z_{TE}+(\unicode[STIX]{x1D716}+u_{g}(t^{\prime })\unicode[STIX]{x0394}t)\text{e}^{\text{i}\unicode[STIX]{x1D703}_{g}(t^{\prime })},\end{eqnarray}$$
where
 $z_{TE}$
is the complex coordinate of the trailing edge point.
Step 4: Equation solving. At this stage, the unknown variables are the strengths of the bound vortex panels and the
 $g$
panel. In figure 7,
 $z_{C}^{n}$
marks the control point where the wall boundary condition is satisfied for each panel. Applying the velocity approximations of (6.1), (6.2) and (6.3), the boundary condition specified by (2.5) and (2.6) can be written in the form,
 $$\begin{eqnarray}\mathop{\sum }_{m=1}^{N_{B}+1}D_{nm}\unicode[STIX]{x1D6FE}_{B}^{m}+E_{n}\unicode[STIX]{x1D6FE}_{g}=H_{n},\quad n=1,2,\ldots ,N_{B},\end{eqnarray}$$
where
 $D_{nm}$
,
 $E_{n}$
and
 $H_{n}$
are coefficients or constants expressed by
 $z_{C}^{n}$
and other known parameters. For brevity, their detailed expressions are not presented. Furthermore, the Kelvin’s circulation theorem predicts that all vortices in the flow field should satisfy
 $$\begin{eqnarray}\frac{1}{2}\mathop{\sum }_{m=1}^{N_{B}}|z_{B}^{m+1}-z_{B}^{m}|\unicode[STIX]{x1D6FE}_{B}^{m}+\frac{1}{2}\mathop{\sum }_{m=2}^{N_{B}+1}|z_{B}^{m}-z_{B}^{m-1}|\unicode[STIX]{x1D6FE}_{B}^{m}+|z_{g}^{1}-z_{g}^{0}|\unicode[STIX]{x1D6FE}_{g}=-\mathop{\sum }_{m=1}^{N_{T}}\unicode[STIX]{x1D6E4}_{T}^{m}.\end{eqnarray}$$
Therefore, equations (6.7), (6.8) and (3.5) together constitute a
 $(N_{B}+2)$
th-order linear system, which is solved analytically to give
 $[\unicode[STIX]{x1D6FE}_{B}^{1}\unicode[STIX]{x1D6FE}_{B}^{2}\ldots \unicode[STIX]{x1D6FE}_{B}^{N_{B}+1}\unicode[STIX]{x1D6FE}_{g}]^{\text{T}}$
. This completes the computation of the entire vortex-sheet system at time
 $t^{\prime }$
. Last, for flow initialization at
 $t=0$
, step 4 should be performed with
 $\unicode[STIX]{x1D6FE}_{g}=0$
and
 $N^{T}=0$
, so the
 $(N_{B}+1)$
th-order linear system of the combined equations (6.7) and (6.8) is solved to give the initial strength distribution of the bound vortex sheet.
Non-dimensional bound circulation vs. non-dimensional distance travelled. The Wagner functions for circulation are provided by Ford & Babinsky (Reference Ford and Babinsky2013) and Li & Wu (Reference Li and Wu2015).

6.2 Airfoils in steady background flow
An impulsively started NACA 0012 airfoil is simulated at various angles of attack. In the body-fixed reference frame, the problem is equivalent to that with a background flow abruptly accelerating from zero to a constant. Although the background flow can be treated as a steady flow for
 $t>0$
, the problem itself is naturally unsteady because of the formation of a starting trailing-edge vortex. Eventually, a steady flow field around the airfoil can be achieved and the lift will saturate as the starting TEV moves downstream. Therefore, the estimation of the circulation shed from the trailing edge is essential to the accurate prediction of lift generation on the airfoil. For an impulsively started thin airfoil or flat plate, Wagner (Reference Wagner1925) has provided the numerical data of the time-variant bound circulation, which can be approximated by
 $\unicode[STIX]{x1D6E4}_{b}(s^{\ast })/\unicode[STIX]{x1D6E4}_{b}(\infty )\approx 0.9140-0.3151\text{e}^{-s^{\ast }/0.1824}-0.5986\text{e}^{-s^{\ast }/2.0282}$
, given by Ford & Babinsky (Reference Ford and Babinsky2013).
 $\unicode[STIX]{x1D6E4}_{b}$
is the total bound circulation;
 $s^{\ast }=s_{t}/c$
where
 $s_{t}$
is the total distance travelled by the airfoil and
 $c$
is the chord length. Later, Li & Wu (Reference Li and Wu2015) modified this function as
 $\unicode[STIX]{x1D6E4}_{b}(s^{\ast })/\unicode[STIX]{x1D6E4}_{b}(\infty )\approx 1-0.8123\text{e}^{-\sqrt{s^{\ast }}/1.276}-0.188\text{e}^{-s^{\ast }/1.211}+3.2683\times 10^{-4}\text{e}^{-s^{\ast 2}/0.892}$
to improve its asymptotic behaviour. In this study, the formation of the TEV is solved by implementing the proposed unsteady Kutta condition at each time step. Then, the total bound circulation can be obtained using Kelvin’s circulation theorem as
 $\unicode[STIX]{x1D6E4}_{b}=-\unicode[STIX]{x1D6E4}_{TEV}$
, where
 $\unicode[STIX]{x1D6E4}_{TEV}$
is the total circulation of the trailing-edge vortices.
 $\unicode[STIX]{x1D6E4}_{TEV}$
can be calculated from
 $\unicode[STIX]{x1D6E4}_{TEV}=\int \dot{\unicode[STIX]{x1D6E4}}_{g}\,\text{d}t$
, with
 $\dot{\unicode[STIX]{x1D6E4}}_{g}$
determined by (C 10). Now, we compare the variation of the bound circulation predicted by this model with the approximated Wagner functions in figure 8. A general good agreement can be observed between this result and the modified Wagner function by Li & Wu (Reference Li and Wu2015), except at early stages (
 $s^{\ast }<5$
) where this simulation is slightly different from both Wagner functions. Since Wagner’s simulation was based on a flat plate, this difference is likely to reflect the difference of initial vortex shedding between a finite-camber airfoil and a flat plate. In addition, we note that similar to the Wagner function
 $\unicode[STIX]{x1D6E4}_{b}(s^{\ast })/\unicode[STIX]{x1D6E4}_{b}(\infty )$
in this simulation is also independent of the angle of attack, although full data are not presented here for brevity.
(a) Lift coefficient (
 $C_{l}$
) vs. non-dimensional distance travelled (
 $s^{\ast }$
) for a NACA 0012 airfoil at various angles of attack. (b) The variation of the angle of the trailing-edge vortex sheet.
 $\unicode[STIX]{x1D703}_{g}=0$
corresponds to the bisector of the finite-angle trailing edge.
 $\unicode[STIX]{x1D703}_{g}$
varies between
 $-\unicode[STIX]{x0394}\unicode[STIX]{x1D703}_{0}/2$
and
 $\unicode[STIX]{x0394}\unicode[STIX]{x1D703}_{0}/2$
that correspond to the two tangents of the trailing edge.

Figure 9(a) shows the variation of the lift coefficient,
 $C_{l}$
, for the NACA 0012 airfoil with AoA ranging from
 $0^{\circ }$
to
 $10^{\circ }$
. We can verify the saturation trend of the lift coefficient as
 $s^{\ast }$
increases, which corresponds to the transition of the flow field near the airfoil from unsteady to steady. This transition is also evident in figure 9(b), which shows the variation of the angle (
 $\unicode[STIX]{x1D703}_{g}$
) of the trailing-edge vortex sheet. The trend of
 $\unicode[STIX]{x1D703}_{g}$
approaching zero also indicates the recovery of condition (iv) of the steady-state Kutta condition summarized by Poling & Telionis (Reference Poling and Telionis1986) (§ 5). Furthermore, it is important to note here that
 $C_{l}$
at
 $s^{\ast }=0$
does not start from zero although the bound circulation increases from zero, capturing the added-mass effect. Following recent studies (Xia & Mohseni Reference Xia and Mohseni2013a
; Li & Wu Reference Li and Wu2016) that attributed major lift generation to the effect of vortex motion, this initial lift should be caused by a strong redistribution effect of the vorticity inside the bound vortex sheet.
Lift coefficient (
 $C_{l}$
) vs. angle of attack (
 $\unicode[STIX]{x1D6FC}$
) for (a) a NACA 0012 airfoil and (b) a NACA 2415 airfoil. The experimental data for (a) and (b) are from Sheldahl & Klimas (Reference Sheldahl and Klimas1981) and Abbott, von Doenhoff & Stivers (Reference Abbott, von Doenhoff and Stivers1945), respectively.

The steady-state lift coefficients of this study are compared with experimental data for NACA 0012 and NACA 2415 airfoils, as shown in figure 10. The lift calculations of this model generally match well with experiment at small angles of attack. Furthermore, better agreement can be confirmed for the experimental cases with larger
 $Re$
. This is because larger
 $Re$
corresponds to smaller mass and momentum deficits associated with the boundary layer, and is therefore better approximated by the vortex-sheet-based inviscid flow model. Lastly, the lift stall at larger AoA is not captured because this model does not account for flow separation occurring upstream of the trailing edge.
Comparison between flow visualization and simulation for a pitching and heaving NACA 0012 airfoil with
 $St=0.45$
,
 $\unicode[STIX]{x1D6FC}_{max}=30^{\circ }$
and
 $h_{0}=0.75c$
. The flow visualization image is from Schouveiler, Hover & Triantafyllou (Reference Schouveiler, Hover and Triantafyllou2005). The dash line in (b) marks the trajectory of the airfoil.

6.3 Airfoils with unsteady motions
Next, the performance of this vortex-sheet-based aerodynamic model is further justified by simulating a series of unsteady motions of the NACA airfoils. We first investigate a NACA 0012 airfoil with a combined pitching and heaving motion adapted from the experiment of Read, Hover & Triantafyllou (Reference Read, Hover and Triantafyllou2003). For all tests, the chord length and the towing speed are fixed at
 $c=0.1~\text{m}$
and
 $U_{tow}=0.4~\text{m}~\text{s}^{-1}$
, respectively. The corresponding Reynolds number is
 $4\times 10^{4}$
. The pivot for the pitching motion is fixed at
 $1/3$
chord. The phase difference angle between the pitching and heaving motions is set to
 $90^{\circ }$
. The characteristic parameters for this motion are the Strouhal number,
 $St$
, the amplitude of the angle of attack,
 $\unicode[STIX]{x1D6FC}_{max}$
, and the heave amplitude,
 $h_{0}$
, which could be adjusted by controlling the pitching and heaving motions. Figure 11 compares the wake structures between this simulation and the flow visualization for a sample case (
 $St=0.45$
,
 $\unicode[STIX]{x1D6FC}_{max}=30^{\circ }$
and
 $h_{0}=0.75c$
). The matching of the wake patterns between experiment and simulation is promising. Figure 12 further plots the instantaneous force vectors along the trajectories of two different pitching and heaving motions. The results demonstrate reasonable agreement of the force magnitude and direction between experiment and simulation. This quantitatively validates the performance of the aerodynamic model and the TEV formation conditions for airfoils undergoing unsteady motions. However, since the LEV shedding has not been considered here, the simulations with larger
 $\unicode[STIX]{x1D6FC}_{max}$
or
 $St$
values tend to overestimate the force due to possible flow separation after the leading edge.
Comparison of instantaneous thrust vectors between experiment and simulation for a NACA 0012 airfoil. The experimental results are adapted from Read et al. (Reference Read, Hover and Triantafyllou2003). For both cases,
 $St=0.4$
and
 $h_{0}=c$
.

The panels on the left show the trajectories and force vectors of different unsteady motions of a NACA 0013 airfoil adapted from the experiment of Izraelevitz & Triantafyllou (Reference Izraelevitz and Triantafyllou2014). The panels on the right show the corresponding simulated wake patterns. Note that this figure only illustrates the unsteady motions of the airfoil, and is not intended for validation.

Result of the symmetric flapping motion corresponding to figure 13(a). (a) Comparison between the measured force coefficients of Izraelevitz & Triantafyllou (Reference Izraelevitz and Triantafyllou2014) and the estimated force coefficients from this simulation. (b) Variations of
 $\unicode[STIX]{x1D6FC}$
,
 $U$
and
 $\unicode[STIX]{x1D703}_{g}$
during one cycle.

Result of the bird-like forward biased downstroke corresponding to figure 13(b). (a) Comparison between measured and estimated force coefficients. (b) Variations of
 $\unicode[STIX]{x1D6FC}$
,
 $U$
and
 $\unicode[STIX]{x1D703}_{g}$
during one cycle.

The unsteadiness of the airfoil motion can be further increased by adding an oscillatory in-line motion on top of the pitching and heaving motion introduced above. Two typical such motions were experimentally studied by Izraelevitz & Triantafyllou (Reference Izraelevitz and Triantafyllou2014), namely, the bird-like forward biased downstroke and the turtle-like backwards moving downstroke. The trajectories of these two motions are shown in figure 13(b) and (c), with the simulated flow field showing the vortical structures in the wake. For comparison, a symmetric flapping case without any additional in-line motion is shown in figure 13(a). The airfoil investigated here is a NACA 0013 type with
 $c=0.055~\text{m}$
and the pivot at the quarter chord. The Reynolds number is fixed at 11 000 which corresponds to a constant towing speed of
 $U_{tow}=0.2~\text{m}~\text{s}^{-1}$
. For the pitching and heaving motions of all cases, the characteristic parameters are
 $St=0.3$
,
 $\unicode[STIX]{x1D6FC}_{max}=25^{\circ }$
and
 $h_{0}=c$
. The controlling parameter here is the stroke angle,
 $\unicode[STIX]{x1D6FD}$
, associated with the added in-line motion.
 $\unicode[STIX]{x1D6FD}$
is defined based on the
 $x$
and
 $y$
positions of the airfoil in the carriage reference frame. The interested readers are referred to Izraelevitz & Triantafyllou (Reference Izraelevitz and Triantafyllou2014) for more details of the original experiment.
For quantitative comparison, the force and torque coefficients are estimated for the unsteady motions presented in figure 13. Similar to Izraelevitz & Triantafyllou (Reference Izraelevitz and Triantafyllou2014), the force coefficients in the
 $x$
and
 $y$
directions together with the torque coefficient are defined as
 $C_{x}=2F_{x}(\unicode[STIX]{x1D70C}U_{tow}^{2}c)^{-1}$
,
 $C_{y}=2F_{y}(\unicode[STIX]{x1D70C}U_{tow}^{2}c)^{-1}$
and
 $C_{M}=2T_{\unicode[STIX]{x1D70F}}(\unicode[STIX]{x1D70C}U_{tow}^{2}c^{2})^{-1}$
, respectively, where
 $F_{x}$
,
 $F_{y}$
and
 $T_{\unicode[STIX]{x1D70F}}$
are computed from (2.7) and (2.8). The evolution of
 $C_{x}$
,
 $C_{y}$
and
 $C_{M}$
during each cycle of the prescribed unsteady motions are compared with the experimental data in figures 14(a), 15(a) and 16(a). We again observe a generally good agreement between experiment and simulation, verifying the performance of the proposed flow model. Especially, the results of
 $C_{y}$
have promising accuracy for all three different cases. Since
 $C_{y}$
physically represents the lift coefficient, this indicates a prospective application of the current model for lift estimation without modelling the leading-edge separation. However, the void of flow separation in the current simulation seems to have a notable impact on
 $C_{x}$
, which corresponds to the thrust coefficient. This is reflected by the over-prediction of
 $C_{x}$
in some cases displayed in figures 14(a) and 15(a). Other than the flow separation, the viscous effect at the solid–fluid interface could also affect the accuracy of predicting thrust or drag using an inviscid flow model.
Result of the turtle-like backwards moving downstroke corresponding to figure 13(c). (a) Comparison between measured and estimated force coefficients. (b) Variations of
 $\unicode[STIX]{x1D6FC}$
,
 $U$
and
 $\unicode[STIX]{x1D703}_{g}$
during one cycle.

To explain the effect of the additional in-line motion on force generation of the airfoil, the variations of the airfoil velocity
 $U$
and the angle of attack
 $\unicode[STIX]{x1D6FC}$
are plotted in figures 14(b), 15(b) and 16(b). We can observe that the variations of
 $\unicode[STIX]{x1D6FC}$
in figures 15 and 16 are identical, and
 $\unicode[STIX]{x1D6FC}$
only changes in the first half-cycle while it remains zero in the second half-cycle. Since the shedding of strong vorticity mainly occurs at non-zero angles of attack, the force generation associated with vortex shedding should mostly happen during the first half-cycle. In this sense, the first half-cycle is the actual ‘stroke’ while the second half can be considered as the ‘recovery’. However, the different in-line motions during the first half-cycle cause
 $U$
to increase significantly for the bird-like downstroke in figure 15 and decrease significantly for the turtle-like downstroke in figure 16. This creates stronger and faster trailing-edge vortices of the bird-like downstroke compared to the turtle-like downstroke. As a result, the bird-like downstroke provides much higher lift than the turtle-like downstroke. Finally, we note that the angle of the trailing-edge vortex sheet,
 $\unicode[STIX]{x1D703}_{g}$
, varies smoothly within the limits of the two tangential directions of the trailing edge,
 $-\unicode[STIX]{x0394}\unicode[STIX]{x1D703}_{0}/2$
and
 $\unicode[STIX]{x0394}\unicode[STIX]{x1D703}_{0}/2$
. This also implies the correct implementation of the proposed models, and is in accordance with the experimental observation of Poling & Telionis (Reference Poling and Telionis1986) that the direction of the trailing-edge streamline changes smoothly.
7 Conclusions
An unsteady aerodynamic model for an airfoil was derived based on the dynamics of the bound vortex sheet and the wake vortices. The vorticity generation mechanism at the trailing edge was studied since it is essential to predict the vortex shedding and evolution processes in the wake. For a flat plate or a cusped trailing edge, this can be solved by applying an unsteady Kutta condition, based on the physical sense that flow cannot turn around a sharp edge. The current work extended this condition to a more general situation, the finite-angle trailing edge of an airfoil, by enforcing the flow direction at the trailing edge to be tangential to the forming vortex sheet. This resulted in an implicit Kutta condition which relates the strength of the forming vortex sheet to its adjacent bound vortex sheets.
This unsteady Kutta condition is not straightforward to implement because it also depends on the direction of the forming vortex sheet, which is ambiguous for a finite-angle trailing edge. To address this problem, this study proposed a generalized sheet model to enable momentum balance analysis for the vortex-sheet system and its surrounding flow at the trailing edge. The essence of the generalized sheet model is that a physical viscous shear layer could be adequately represented by a vortex sheet if the dynamics is captured by relevant global quantities. Specifically, the modelling of mass and momentum fluxes through jump conditions would allow the estimations of entrainment and viscous force of the original shear layer in an inviscid flow. The application of this model in the case of the finite-angle trailing edge provided another implicit relation between the forming vortex sheet and the existing bound vortex sheets.
The combination of the implicit unsteady Kutta condition and the momentum balance equation, together with the conservation of circulation, gave the analytical expression of the angle, strength and shedding velocity of a free vortex sheet formed at a finite-angle trailing edge, establishing a general unsteady Kutta condition for relevant problems. The significance of this work is that the vortex-sheet formation condition allows the angle of the forming vortex sheet to continuously change between the two tangents of the trailing edge. This resolves the paradox of the Giesing–Maskell model that it does not converge to the steady-state Kutta condition. Airfoils in various steady and unsteady flows were simulated and the resulting flow field and force calculations were compared with experimental data. The promising agreement between simulation and experiment confirmed the validity of the proposed unsteady Kutta condition as well as the vortex-sheet-based aerodynamic model.
Acknowledgements
This work is partially supported by a grant from the Office of Naval Research. We would like to thank Dr. A. DeVoria for providing helpful discussions and comments. We also appreciate the reviewers’ valuable comments that led to great improvements of this paper.
Appendix A.
This appendix, together with appendix B, provides the detailed calculation for (3.4). In this study, we are faced with the task of computing the line integral
 $\int \unicode[STIX]{x1D6FE}(s)(Z_{0}-Z(s))^{-1}\,\text{d}s$
between two different points,
 $Z(a)$
and
 $Z(b)$
(
 $0<a<b$
), along a simple open (without self-intersection) curve,
 $C_{1}$
, which starts from
 $Z_{0}$
in the complex domain, as shown in figure 17.
 $s$
is the curve length between
 $Z_{0}$
and an arbitrary point
 $Z(s)$
on
 $C_{1}$
, so
 $Z_{0}=Z(0)$
.
 $\unicode[STIX]{x1D6FE}(s)$
is a real function defined on curve
 $C_{1}$
. Given
 $C_{1}$
and
 $\unicode[STIX]{x1D6FE}(s)$
are smooth (class
 $C^{\infty }$
) for
 $a\leqslant s\leqslant b$
, it means that
 $Z(s)$
and
 $\unicode[STIX]{x1D6FE}(s)$
are infinitely differentiable on
 $C_{ab}=\{Z(s),a\leqslant s\leqslant b\}$
.
A diagram of the curve
 $C_{1}$
for calculating the integral
 $\int \unicode[STIX]{x1D6FE}(s)(Z_{0}-Z(s))^{-1}\,\text{d}s$
.

Since
 $\unicode[STIX]{x1D6FE}(s)$
is infinitely differentiable for
 $a\leqslant s\leqslant b$
, it can be expanded to Taylor series at
 $s=a$
:
 $$\begin{eqnarray}\unicode[STIX]{x1D6FE}(s)=\mathop{\sum }_{n=0}^{\infty }g_{n}(s-a)^{n}\quad \text{where}~g_{n}=\frac{\unicode[STIX]{x1D6FE}^{(n)}(a)}{n!}.\end{eqnarray}$$
Plugging in (A 1), the objective integral takes the form
 $$\begin{eqnarray}I_{ab}=\int _{C_{ab}}\frac{\unicode[STIX]{x1D6FE}(s)\,\text{d}s}{Z_{0}-Z(s)}=\int _{C_{ab}}\frac{\displaystyle \mathop{\sum }_{n=0}^{\infty }g_{n}(s-a)^{n}}{Z_{0}-Z(s)}\,\text{d}s.\end{eqnarray}$$
As the series
 $\sum _{n=0}^{\infty }g_{n}(s-a)^{n}$
converges uniformly on the interval
 $[a,b]$
, we can interchange summation and integration in (A 2) to obtain the series,
 $$\begin{eqnarray}I_{ab}=\mathop{\sum }_{n=0}^{\infty }g_{n}\int _{C_{ab}}(Z_{0}-Z(s))^{-1}(s-a)^{n}\,\text{d}s.\end{eqnarray}$$
Let
 $I_{n}$
denote the
 $n$
th term of the series in (A 3). With
 $Z(s)$
being infinitely differentiable on
 $[a,b]$
, we may substitute
 $(Z_{0}-Z(s))^{-1}$
in (A 3) with a Taylor series and then integrate to show that
 $I_{n}$
is
 $O((b-a)^{n+1})$
as
 $(b-a)\rightarrow 0$
. Thus,
 $I_{n+1}=o(I_{n})$
as
 $(b-a)\rightarrow 0$
which qualifies
 $\sum _{n=0}^{\infty }I_{n}$
as an asymptotic expansion.
At this point, for small
 $b-a$
the original integral can be approximately by the zeroth-order term,
 $$\begin{eqnarray}I_{0}=g_{0}\int _{C_{ab}}(Z_{0}-Z(s))^{-1}\,\text{d}s=g_{0}\int _{C_{ab}}\frac{\text{d}s/\text{d}z}{Z_{0}-z}\,\text{d}z,\end{eqnarray}$$
where
 $z=Z(s)$
for
 $z\in C_{ab}$
.
 $D_{z}(s)=\text{d}s/\text{d}z$
can be expanded to Taylor series,
 $$\begin{eqnarray}D_{z}(s)=\mathop{\sum }_{m=0}^{\infty }f_{zm}(s-a)^{m}\quad \text{where}~f_{zm}=\frac{D_{z}^{(m)}(a)}{m!}.\end{eqnarray}$$
So (A 4) can be derived as,
 $$\begin{eqnarray}\displaystyle I_{0} & = & \displaystyle g_{0}\mathop{\sum }_{m=0}^{\infty }f_{zm}\int _{C_{ab}}\frac{(s-a)^{m}}{Z_{0}-z}\,\text{d}z\nonumber\\ \displaystyle & = & \displaystyle \mathop{\sum }_{m=0}^{\infty }g_{0}f_{zm}\left[(-\text{ln}(Z_{0}-z)(s-a)^{m})|_{Z(a)}^{Z(b)}+\int _{C_{ab}}\ln (Z_{0}-z)m(s-a)^{m-1}\,\text{d}s\right],\end{eqnarray}$$
where the second equation is obtained using integration by parts. Let
 $R_{m}$
denote the
 $m$
th term of the series in (A 6). It can be readily verified that the first part of
 $R_{m}$
is
 $O((b-a)^{m})$
as
 $(b-a)\rightarrow 0$
. For the second part, its magnitude can be shown to be
 $O((b-a)^{m})$
, by expanding
 $\ln (Z_{0}-z)$
to Taylor series and then applying integration. Similar to the argument provided for
 $\sum _{n=0}^{\infty }I_{n}$
, we can now show that
 $R_{m+1}=o(R_{m})$
as
 $(b-a)\rightarrow 0$
, which indicates
 $\sum _{m=0}^{\infty }R_{m}$
is an asymptotic expansion. Its zeroth-order term takes the form,
 $$\begin{eqnarray}R_{0}=-g_{0}f_{z0}\ln \left(\frac{Z_{0}-Z(b)}{Z_{0}-Z(a)}\right),\end{eqnarray}$$
where
 $g_{0}=\unicode[STIX]{x1D6FE}(a)$
and
 $f_{z0}=(\text{d}z/\text{d}s)^{-1}|_{s=a}=\text{e}^{-\text{i}\unicode[STIX]{x1D703}_{a}}$
. Moreover, the leading-order terms for
 $Z_{0}-Z(b)$
and
 $Z_{0}-Z(a)$
are estimated to be
 $-b\text{e}^{\text{i}\unicode[STIX]{x1D703}_{a}}$
and
 $-a\text{e}^{\text{i}\unicode[STIX]{x1D703}_{a}}$
, respectively. In the problem of interest, we are concerned with the limiting case where
 $Z(a)\rightarrow Z_{0}$
or
 $a\rightarrow 0$
. So
 $\ln (b)=o(\ln (a))$
and
 $I_{ab}$
can be simplified as
 $$\begin{eqnarray}\lim _{a\rightarrow 0}I_{ab}=\unicode[STIX]{x1D6FE}(a)\text{e}^{-\text{i}\unicode[STIX]{x1D703}_{a}}\ln (a)+o(\ln (a)).\end{eqnarray}$$
In this way, the objective integral is approximated by the leading-order term of the asymptotic expansion. It is noted that the nature of the asymptotic expansion requires
 $b-a$
to be sufficiently small.
Appendix B.
This appendix is a continuation of appendix A. Appendix A has calculated the integral
 $\int \unicode[STIX]{x1D6FE}(s)(Z_{0}-Z(s))^{-1}\,\text{d}s$
between
 $Z(a)$
and
 $Z(b)$
for the limiting case
 $Z(a)\rightarrow Z_{0}$
. In this part, the goal is to prove that the objective integral is bounded if
 $a$
is a finite value or
 $Z(a)$
is away from
 $Z_{0}$
.
For this purpose, we only require
 $\unicode[STIX]{x1D6FE}(s)$
to be bounded for
 $a\leqslant s\leqslant b$
. Let
 $D_{m}=\min \{|Z-Z_{0}|,Z\in C_{ab}\}$
and
 $\unicode[STIX]{x1D6FE}_{M}=\max \{\unicode[STIX]{x1D6FE}(s),s\in [a,b]\}$
, the objective integral has the inequality
 $$\begin{eqnarray}\left|\int _{C_{ab}}\frac{\unicode[STIX]{x1D6FE}(s)\,\text{d}s}{Z_{0}-Z(s)}\right|\leqslant \int _{C_{ab}}\left|\frac{1}{Z_{0}-Z(s)}\right|\left|\unicode[STIX]{x1D6FE}(s)\right|\,\text{d}s<\int _{C_{ab}}\frac{\unicode[STIX]{x1D6FE}_{M}}{D_{m}}\,\text{d}s=\frac{\unicode[STIX]{x1D6FE}_{M}(b-a)}{D_{m}}.\end{eqnarray}$$
This completes the proof for the boundedness of the objective integral.
Appendix C.
The objective of this appendix is to derive Kelvin’s circulation theorem for the trailing-edge merging zone
 $A_{m}$
shown in figure 4. We begin by expressing the total change of the circulation within
 $A_{m}$
as
 $$\begin{eqnarray}\frac{\text{d}}{\text{d}t}\int _{A_{m}}\unicode[STIX]{x1D714}\,\text{d}A=\frac{\text{d}}{\text{d}t}\oint _{\unicode[STIX]{x2202}A_{m}}\boldsymbol{u}\boldsymbol{\cdot }\hat{\boldsymbol{s}}_{m}\,\text{d}s=\oint _{\unicode[STIX]{x2202}A_{m}}\frac{\text{d}\boldsymbol{u}}{\text{d}t}\boldsymbol{\cdot }\hat{\boldsymbol{s}}_{m}\,\text{d}s+\oint _{\unicode[STIX]{x2202}A_{m}}\frac{1}{2}\,\text{d}(\boldsymbol{u}\boldsymbol{\cdot }\boldsymbol{u}),\end{eqnarray}$$
where
 $\unicode[STIX]{x1D714}$
is the vorticity. The left-hand equation is based on the Green theorem. Since a vortex sheet corresponds to a velocity discontinuity, the Green theorem should be derived for a volume containing discontinuous surfaces as presented in appendix D. We note that since the velocity derivative across a vortex sheet satisfies the Dirac delta function specified in (D 5), the Green theorem should take its original form. In the right equation, since
 $\boldsymbol{u}$
is a Heaviside step function across any vortex sheet, it is single valued throughout the entire domain. So the second term on the right-hand side of (C 1) is equal to zero. Now, we plug the momentum equation (4.11) into (C 1) to obtain
 $$\begin{eqnarray}\frac{\text{d}}{\text{d}t}\int _{A_{m}}\unicode[STIX]{x1D714}\,\text{d}A=\oint _{\unicode[STIX]{x2202}A_{m}}\left[\frac{1}{\unicode[STIX]{x1D70C}}(-\unicode[STIX]{x1D735}p+\unicode[STIX]{x1D735}\boldsymbol{\cdot }\unicode[STIX]{x1D749})+\dot{\boldsymbol{u}}_{\unicode[STIX]{x1D6FA}}\right]\boldsymbol{\cdot }\hat{\boldsymbol{s}}_{m}\,\text{d}s.\end{eqnarray}$$
This gives a general equation for the total change of circulation inside
 $A_{m}$
. Now, we apply physical boundary conditions to simplify (C 2). Since
 $S_{\unicode[STIX]{x1D6FE}1}$
and
 $S_{\unicode[STIX]{x1D6FE}2}$
correspond to fluid–solid interfaces that satisfy the no-slip boundary condition, we obtain
 $\text{d}\boldsymbol{u}/\text{d}t=0$
in the body-fixed reference frame. Furthermore, the flow outside the vortex sheets are assumed to be inviscid, so we have
 $\unicode[STIX]{x1D735}\boldsymbol{\cdot }\unicode[STIX]{x1D749}=0$
on the other boundaries
 $\unicode[STIX]{x2202}A_{m}-S_{\unicode[STIX]{x1D6FE}1}-S_{\unicode[STIX]{x1D6FE}2}$
. Therefore, equation (C 2) becomes
 $$\begin{eqnarray}\frac{\text{d}}{\text{d}t}\int _{A_{m}}\unicode[STIX]{x1D714}\,\text{d}A=\int _{\unicode[STIX]{x2202}A_{m}-S_{\unicode[STIX]{x1D6FE}1}-S_{\unicode[STIX]{x1D6FE}2}}\left(-\frac{\unicode[STIX]{x2202}p}{\unicode[STIX]{x1D70C}\unicode[STIX]{x2202}s_{m}}+\dot{\boldsymbol{u}}_{\unicode[STIX]{x1D6FA}}\boldsymbol{\cdot }\hat{\boldsymbol{s}}_{m}\right)\,\text{d}s.\end{eqnarray}$$
Under condition (iii) of § 4.2,
 $\dot{\boldsymbol{u}}_{\unicode[STIX]{x1D6FA}}\boldsymbol{\cdot }\hat{\boldsymbol{s}}_{m}$
should be finite. Together with condition (i), the second integral of (C 3) has the magnitude
 $O(\unicode[STIX]{x1D716}_{s})$
. So (C 3) has the simplified form
 $$\begin{eqnarray}\frac{\text{d}}{\text{d}t}\int _{A_{m}}\unicode[STIX]{x1D714}\,\text{d}A=-\frac{1}{\unicode[STIX]{x1D70C}}\int _{\unicode[STIX]{x2202}A_{m}-S_{\unicode[STIX]{x1D6FE}1}-S_{\unicode[STIX]{x1D6FE}2}}\,\text{d}p+O(\unicode[STIX]{x1D716}_{s}).\end{eqnarray}$$
Let
 $p_{1}$
and
 $p_{2}$
be the pressure of the points shown in figure 4, the result of (C 4) becomes
 $(p_{2}-p_{1})/\unicode[STIX]{x1D70C}+O(\unicode[STIX]{x1D716}_{s})$
. Physically, pressure should be continuous at the trailing edge which means
 $p_{1}=p_{2}$
as
 $\unicode[STIX]{x1D716}_{s}\rightarrow 0$
. Therefore, equation (C 4) becomes zero in the limit
 $\unicode[STIX]{x1D716}_{s}\rightarrow 0$
, which gives Kelvin’s circulation theorem.
On the other hand, vorticity can be viewed as a material quantity moving with a fluid element. So the total change of circulation inside
 $A_{m}$
can be expressed using the Reynolds transport theorem as
 $$\begin{eqnarray}\frac{\text{d}}{\text{d}t}\int _{A_{m}}\unicode[STIX]{x1D714}\,\text{d}A=\int _{A_{m}}\frac{\unicode[STIX]{x2202}\unicode[STIX]{x1D714}}{\unicode[STIX]{x2202}t}\,\text{d}A+\oint _{\unicode[STIX]{x2202}A_{m}}\unicode[STIX]{x1D714}(\boldsymbol{u}\boldsymbol{\cdot }\hat{\boldsymbol{n}}_{m})\,\text{d}s.\end{eqnarray}$$
The first term on the right-hand side of (C 5) can be derived as
 $$\begin{eqnarray}\int _{A_{m}}\frac{\unicode[STIX]{x2202}\unicode[STIX]{x1D714}}{\unicode[STIX]{x2202}t}\,\text{d}A=\frac{\unicode[STIX]{x2202}}{\unicode[STIX]{x2202}t}\int _{A_{m}}\unicode[STIX]{x1D714}\,\text{d}A=\frac{\unicode[STIX]{x2202}\unicode[STIX]{x1D6FE}_{m}}{\unicode[STIX]{x2202}t}L_{m},\end{eqnarray}$$
where
 $\unicode[STIX]{x1D6FE}_{m}$
and
 $L_{m}$
represent the effective strength and length of the total vortex-sheet system inside
 $A_{m}$
, respectively. Again,
 $\unicode[STIX]{x2202}\unicode[STIX]{x1D6FE}_{m}/\unicode[STIX]{x2202}t$
should be finite according to condition (iii) of § 4.2. Condition (i) gives
 $L_{m}\sim O(\unicode[STIX]{x1D716}_{s})$
, so (C 6) also approaches zero in the limit
 $\unicode[STIX]{x1D716}_{s}\rightarrow 0$
. Together with (C 4) being zero as
 $\unicode[STIX]{x1D716}_{s}\rightarrow 0$
, equation (C 5) is reduced to
 $$\begin{eqnarray}\oint _{\unicode[STIX]{x2202}A_{m}}\unicode[STIX]{x1D714}(\boldsymbol{u}\boldsymbol{\cdot }\hat{\boldsymbol{n}}_{m})\,\text{d}s=0.\end{eqnarray}$$
Now, the vorticity is defined as
 $\unicode[STIX]{x1D714}=\unicode[STIX]{x2202}u_{n}/\unicode[STIX]{x2202}s_{m}-\unicode[STIX]{x2202}u_{s}/\unicode[STIX]{x2202}n_{m}$
on
 $S_{1}$
,
 $S_{2}$
and
 $S_{g}$
. Since the tangential directions of the vortex sheets,
 $\unicode[STIX]{x1D6FE}_{1}$
,
 $\unicode[STIX]{x1D6FE}_{2}$
and
 $\unicode[STIX]{x1D6FE}_{g}$
, are normal to
 $S_{1}$
,
 $S_{2}$
and
 $S_{g}$
, respectively,
 $s_{m}$
and
 $n_{m}$
are actually
 $n$
and
 $s$
in the
 $s-n$
coordinate defined locally on each vortex sheet. For a physical shear layer, the boundary layer approximation could be applied so
 $|\unicode[STIX]{x2202}/\unicode[STIX]{x2202}n|\gg |\unicode[STIX]{x2202}/\unicode[STIX]{x2202}s|$
in the
 $s-n$
coordinate. This is translated into
 $|\unicode[STIX]{x2202}/\unicode[STIX]{x2202}s_{m}|\gg |\unicode[STIX]{x2202}/\unicode[STIX]{x2202}n_{m}|$
in the
 $s_{m}-n_{m}$
coordinate. Thus,
 $|\unicode[STIX]{x2202}u_{n}/\unicode[STIX]{x2202}s_{m}|\gg |\unicode[STIX]{x2202}u_{n}/\unicode[STIX]{x2202}n_{m}|$
and
 $|\unicode[STIX]{x2202}u_{s}/\unicode[STIX]{x2202}s_{m}|\gg |\unicode[STIX]{x2202}u_{s}/\unicode[STIX]{x2202}n_{m}|$
. Together with the continuity equation,
 $\unicode[STIX]{x2202}u_{s}/\unicode[STIX]{x2202}s_{m}+\unicode[STIX]{x2202}u_{n}/\unicode[STIX]{x2202}n_{m}=0$
, it gives
 $|\unicode[STIX]{x2202}u_{n}/\unicode[STIX]{x2202}s_{m}|\gg |\unicode[STIX]{x2202}u_{s}/\unicode[STIX]{x2202}n_{m}|$
. This means that the
 $\unicode[STIX]{x2202}u_{s}/\unicode[STIX]{x2202}n_{m}$
term has a negligible contribution in the vorticity expression and is dropped in the following derivation for simplicity. Applying condition (ii) of § 4.2 (
 $u_{n}=0$
on
 $S_{f1}$
and
 $S_{f2}$
) and
 $\unicode[STIX]{x1D714}=\unicode[STIX]{x2202}u_{n}/\unicode[STIX]{x2202}s_{m}$
on
 $S_{1}$
,
 $S_{2}$
and
 $S_{g}$
, equation (C 7) takes the form
 $$\begin{eqnarray}\int _{S_{1}+S_{g}+S_{2}}u_{n}\,\text{d}u_{n}=0.\end{eqnarray}$$
Plugging in the values of
 $u_{n}$
on
 $S_{1}$
,
 $S_{2}$
and
 $S_{g}$
, equation (C 8) becomes
 $$\begin{eqnarray}{\textstyle \frac{1}{2}}(u_{1+}^{2}-u_{1-}^{2})+{\textstyle \frac{1}{2}}(u_{2+}^{2}-u_{2-}^{2})+{\textstyle \frac{1}{2}}(u_{g+}^{2}-u_{g-}^{2})=0.\end{eqnarray}$$
This provides an additional relationship between the forming vortex sheet and the bound vortex sheets, which is used in § 5 to derive the explicit form of the unsteady Kutta condition. For the free vortex sheet formed at the trailing edge, its strength and relative velocity satisfy
 $\unicode[STIX]{x1D6FE}_{g}=-u_{g-}+u_{g+}$
and
 $u_{g}=(u_{g-}+u_{g+})/2$
, respectively. Recall that
 $u_{1-}=0$
and
 $u_{2+}=0$
, equation (C 9) can be combined with (4.134) of Wu et al. (Reference Wu, Ma and Zhou2006) to give
 $$\begin{eqnarray}\frac{\unicode[STIX]{x2202}\unicode[STIX]{x1D6E4}_{g}}{\unicode[STIX]{x2202}t}=u_{g}\unicode[STIX]{x1D6FE}_{g}=\frac{1}{2}(u_{2-}^{2}-u_{1+}^{2}),\end{eqnarray}$$
where
 $\unicode[STIX]{x1D6E4}_{g}$
is the total circulation of the forming vortex sheet, so
 $\unicode[STIX]{x2202}\unicode[STIX]{x1D6E4}_{g}/\unicode[STIX]{x2202}t$
is the rate at which circulation is generated at the sharp edge to form the free vortex sheet. Note that (C 10) was experimentally derived by Fage & Johanson (Reference Fage and Johanson1927) for vorticity shedding from a flat plate. Similar formulations have also been obtained by Sears (Reference Sears1956, Reference Sears1976) and Basu & Hancock (Reference Basu and Hancock1978) for airfoils, and it can be viewed as the differential form of the well-known Morino condition (Morino & Kuo Reference Morino and Kuo1974). According to the above discussion, this condition determines the rate of circulation being shed from the trailing edge, and is valid for unsteady flows in the body-fixed reference frame.
Domain
 $D$
divided by a discontinuous interface
 $S$
.

Appendix D.
This appendix derives the Green’s theorem used in (C 1) for a domain containing discontinuous interfaces. The process is similar to the proof of the original Green’s theorem (Kaplan Reference Kaplan2002). We start with the simple case where a 2-D domain
 $D$
is enclosed by a smooth simple closed curve
 $C$
, as shown in figure 18.
 $P(x,y)$
and
 $Q(x,y)$
are continuous functions and have continuous first partial derivatives in
 $D$
, except on a dividing interface
 $S$
(
 $S=\{(x,f_{s}(x)),c\leqslant x\leqslant d\}$
).
 $C$
can be divided into
 $C_{1}$
(
 $C_{1}=\{(x,f_{1}(x)),a\leqslant x\leqslant b\}$
) and
 $C_{2}$
(
 $C_{2}=\{(x,f_{2}(x)),a\leqslant x\leqslant b\}$
).
Now, the first integral to evaluate is
 $$\begin{eqnarray}\displaystyle \iint _{D}\frac{\unicode[STIX]{x2202}P}{\unicode[STIX]{x2202}y}\,\text{d}x\,\text{d}y & = & \displaystyle \int _{a}^{b}\int _{f_{1}(x)}^{f_{2}(x)}\frac{\unicode[STIX]{x2202}P}{\unicode[STIX]{x2202}y}\,\text{d}y\,\text{d}x\nonumber\\ \displaystyle & = & \displaystyle \int _{a}^{c}[P(x,f_{2}(x))-P(x,f_{1}(x))]\,\text{d}x+\int _{d}^{b}[P(x,f_{2}(x))-P(x,f_{1}(x))]\,\text{d}x\nonumber\\ \displaystyle & & \displaystyle +\,\int _{c}^{d}\left[P(x,f_{2}(x))-P(x,f_{s}^{+}(x))\right.\nonumber\\ \displaystyle & & \displaystyle \left.+\,\int _{f_{s}^{-}(x)}^{f_{s}^{+}(x)}\frac{\unicode[STIX]{x2202}P}{\unicode[STIX]{x2202}y}\,\text{d}y+P(x,f_{s}^{-}(x))-P(x,f_{1}(x))\right]\,\text{d}x\nonumber\\ \displaystyle & = & \displaystyle \int _{a}^{b}[P(x,f_{2}(x))-P(x,f_{1}(x))]\,\text{d}x\nonumber\\ \displaystyle & & \displaystyle +\,\int _{c}^{d}\left[-\unicode[STIX]{x27E6}P(x,f_{s}(x))\unicode[STIX]{x27E7}+\int _{f_{s}^{-}(x)}^{f_{s}^{+}(x)}\frac{\unicode[STIX]{x2202}P}{\unicode[STIX]{x2202}y}\,\text{d}y\right]\,\text{d}x,\end{eqnarray}$$
where
 $f_{s}^{+}(x)$
and
 $f_{s}^{-}(x)$
represents the upper and lower limits of
 $f_{s}(x)$
, and the jump term
 $\unicode[STIX]{x27E6}P(x,f_{s}(x))\unicode[STIX]{x27E7}=P(x,f_{s}^{+}(x))-P(x,f_{s}^{-}(x))$
. Note here,
 $\unicode[STIX]{x2202}P/\unicode[STIX]{x2202}y$
is not well defined on
 $S$
and is dependent on the physical problem. In general, we assume
 $\unicode[STIX]{x2202}P/\unicode[STIX]{x2202}y$
to be finite on
 $S$
so (D 1) takes the form
 $$\begin{eqnarray}\iint _{D}\frac{\unicode[STIX]{x2202}P}{\unicode[STIX]{x2202}y}\,\text{d}x\,\text{d}y=-\oint _{C}P\,\text{d}x-\int _{S}\unicode[STIX]{x27E6}P\unicode[STIX]{x27E7}\,\text{d}x.\end{eqnarray}$$
Similarly,
 $\iint _{D}(\unicode[STIX]{x2202}Q/\unicode[STIX]{x2202}x)\,\text{d}x\,\text{d}y$
can be derived as
 $$\begin{eqnarray}\iint _{D}\frac{\unicode[STIX]{x2202}Q}{\unicode[STIX]{x2202}x}\,\text{d}x\,\text{d}y=\oint _{C}Q\,\text{d}y+\int _{S}\unicode[STIX]{x27E6}Q\unicode[STIX]{x27E7}\,\text{d}y.\end{eqnarray}$$
Therefore, combining (D 2) and (D 3) yields a general Green’s theorem for a domain with a discontinuous interface:
 $$\begin{eqnarray}\iint _{D}\left(\frac{\unicode[STIX]{x2202}Q}{\unicode[STIX]{x2202}x}-\frac{\unicode[STIX]{x2202}P}{\unicode[STIX]{x2202}y}\right)\,\text{d}x\,\text{d}y=\oint _{C}(P\,\text{d}x+Q\,\text{d}y)+\int _{S}(\unicode[STIX]{x27E6}P\unicode[STIX]{x27E7}\,\text{d}x+\unicode[STIX]{x27E6}Q\unicode[STIX]{x27E7}\,\text{d}y).\end{eqnarray}$$
Apparently, the discontinuity associated with the interface
 $S$
causes an additional jump term on the right-hand side of the original Green’s theorem.
However, here we consider a special case where the derivatives of
 $P$
and
 $Q$
on
 $S$
are not finite and have the form
 $$\begin{eqnarray}\left.\begin{array}{@{}c@{}}\displaystyle \frac{\unicode[STIX]{x2202}P}{\unicode[STIX]{x2202}n}=\unicode[STIX]{x27E6}P(s)\unicode[STIX]{x27E7}\unicode[STIX]{x1D6FF}(n),\\ \displaystyle \frac{\unicode[STIX]{x2202}Q}{\unicode[STIX]{x2202}n}=\unicode[STIX]{x27E6}Q(s)\unicode[STIX]{x27E7}\unicode[STIX]{x1D6FF}(n),\end{array}\right\}\end{eqnarray}$$
where
 $\unicode[STIX]{x1D6FF}$
is the Dirac delta function,
 $n$
and
 $s$
are the normal and tangential coordinates of
 $S$
, respectively. Therefore,
 $\unicode[STIX]{x2202}P/\unicode[STIX]{x2202}y$
on
 $S$
can be written as
 $$\begin{eqnarray}\frac{\unicode[STIX]{x2202}P}{\unicode[STIX]{x2202}y}=\unicode[STIX]{x27E6}P(x,f_{s}(x))\unicode[STIX]{x27E7}\unicode[STIX]{x1D6FF}(y-f_{s}(x))\quad \text{for}~(x,y)\in S.\end{eqnarray}$$
Now, equation (D 6) can be plugged into (D 1) to obtain
 $$\begin{eqnarray}\iint _{D}\frac{\unicode[STIX]{x2202}P}{\unicode[STIX]{x2202}y}\,\text{d}x\,\text{d}y=-\oint _{C}P\,\text{d}x.\end{eqnarray}$$
In the same way, the counterpart for (D 3) becomes
 $$\begin{eqnarray}\iint _{D}\frac{\unicode[STIX]{x2202}Q}{\unicode[STIX]{x2202}x}\,\text{d}x\,\text{d}y=\oint _{C}Q\,\text{d}y.\end{eqnarray}$$
Thus, Green’s theorem in this case has its original form
 $$\begin{eqnarray}\iint _{D}\left(\frac{\unicode[STIX]{x2202}Q}{\unicode[STIX]{x2202}x}-\frac{\unicode[STIX]{x2202}P}{\unicode[STIX]{x2202}y}\right)\,\text{d}x\,\text{d}y=\oint _{C}(P\,\text{d}x+Q\,\text{d}y).\end{eqnarray}$$
Finally, applying domain decomposition similar to that in Kaplan (Reference Kaplan2002), the above results can be extended to a general-shaped volume with multiple discontinuous surfaces.