

The relationship between socio-economic status (SES) and political violence has long been studied by social scientists (e.g., Gurr Reference Gurr1970; Krueger and Malekova Reference Krueger and Malekova2003; Sambanis Reference Sambanis2005; Berrebi Reference Berrebi2007; Blattman and Miguel Reference Blattman and Miguel2010) and is of major interest to policymakers (Lord, Nagl and Rosen Reference Lord, Nagl and Rosen2009; United States Agency for International Development 2011). Support for militancy, as opposed to participation in militancy, is a critical outcome in its own right. Where there are more supporters, terrorist groups have a larger pool of recruits and may be able to choose better fighters, an argument consistent with evidence from the Israeli–Palestinian conflict (Bueno de Mesquita Reference Bueno de Mesquita2005; Berrebi Reference Berrebi2007; Krueger Reference Krueger2007; Benmelech, Berrebi and Klor Reference Benmelech, Berrebi and Klor2012). Further, insurgents are often constrained by the strategic choices of the populace about whether or not to cooperate with government forces (and their international allies) seeking to disrupt terrorist groups. Insurgents are inherently vulnerable when those forces have information on their whereabouts (see, e.g., Fearon Reference Fearon2008; Mikulaschek and Shapiro Reference Mikulaschek and Shapiro2015). These informational constraints depend critically on how much non-combatants support the militants.Footnote 1
Numerous theoretical models posit that income may be negatively correlated with support for violent political organizations. Exclusion from economic progress and feelings of injustice induce grievances, and therefore those who feel excluded from and disadvantaged by the existing political hierarchy are more likely to support non-state actors trying to disrupt it (Paige Reference Paige1975; Scott Reference Scott1976). The original formulation of the relative deprivation hypothesis was subtle and took into account the possibility that trends in inequality matter, suggesting that the middle class may feel more deprived than the poor as wealth and opportunity are just beyond their reach. Subsequent interpretations of the hypothesis, particularly in the policy community, have focused on the poor as the locus of relative deprivation, not fully accounting for the subtlety in the original formulation. Building on the literature on grievances, other scholars have argued that poverty renders people more susceptible to militants’ political appeals (Esposito and Voll Reference Esposito and Voll1996). Recent analyses of public opinion surveys, however, have failed to yield consistent evidence of a negative relationship between income and support for militant groups. In fact, some studies find that economic circumstance is not an important determinant of support, while others even find a weakly positive correlation between income and support for militant groups in Pakistan (Blair et al. Reference Blair, Fair, Malhotra and Shapiro2013) and across a range of countries in the Middle East and Central Asia (Chiozza Reference Chiozza2007; Tessler and Robbins Reference Tessler and Robbins2007; Shafiq and Sinno Reference Shafiq and Sinno2010; Blair, Lyall and Imai Reference Blair, Lyall and Imai2013).
As civilians experience increased costs of militant violence, they may be less likely to see militant groups as a solution to their grievances; instead they may come to see militants as a source of threat and disruption.Footnote 2 Political violence at the national level disproportionately impacts the lower class. Violent activity has been found to retard economic growth (see, e.g., Gaibulloev and Sandler Reference Gaibulloev and Sandler2009) and to reduce domestic social spending on which the lower class relies (Blomberg, Hess and Orphanides Reference Blomberg, Hess and Orphanides2004). The poor also disproportionately experience negative health impacts from civil wars and insurgency (Ghobarah, Huth and Russett Reference Ghobarah, Huth and Russett2003; Collier Reference Collier2009). Thus, poorer individuals may not support violent organizations because they perceive such groups to be exacerbating their problems rather than mitigating them.Footnote 3 In the paper closest to ours, Blair et al. (Reference Blair, Fair, Malhotra and Shapiro2013) use survey data from Pakistan to show that poor individuals hold militants in lower regard than do middle-class Pakistanis. In addition, they find that the poor in Pakistan are more vulnerable to violent incidents as they tend to be concentrated in densely populated urban areas, which are often targeted by militants. The authors argue that poor Pakistanis are less supportive of militancy because they suffer more from the externalities of militant violent activity. For example, poorer areas are less equipped to deal with the externalities of violence in terms of infrastructure and healthcare, and the poor have fewer opportunities to move to less violent areas than do middle- and upper-class individuals. At least in the Pakistani context, both poverty and violence appear to dampen support for militant groups.
Despite major advances made in the study of political violence in recent years, existing studies provide evidence consistent with two potential mechanisms underlying these relationships: (1) the direct effects of poverty and violence on attitudes toward militant groups and (2) the psychological effects of perceptions of poverty and violence on attitudes. The direct effects of poverty include a general withdrawal from politics and disaffection with formal political actors (Lijphart Reference Lijphart1997; Kroh and Könnecke Reference Kroh and Könnecke2014). The direct effects of political violence include lost income and economic opportunity stemming from violent activity. In addition, threats to one’s physical safety can lower support for the groups causing the violence.Footnote 4
Another way in which poverty and violence might influence support for militant groups is psychological; in other words, people’s perceptions of poverty and violence generate support or opposition for political violence, apart from actual levels of poverty and exposure to violence. Both economists and psychologists have long claimed that relative economic standing—in addition to absolute economic standing—can greatly influence attitudes. Individuals do not make judgments in a vacuum, but instead are influenced by reference points (Loomes and Sugden Reference Loomes and Sugden1982; Sugden Reference Sugden2003). In determining whether they are deprived with respect to financial resources, for example, individuals in many countries are known to make comparisons between their own economic well-being and their perceptions of others’ well-being (Hagerty Reference Hagerty2000; Ferrer-Carbonell Reference Ferrer-Carbonell2005). Similarly, in evaluating their exposure to violence, individuals may compare their own experiences with external benchmarks, such as levels of violence in other countries or in other regions of their own country. People need not actually be exposed to violence in order to be influenced by it, as evidenced by increased threat perceptions in the United States following 9/11, even in areas of the country where it would be highly unlikely for a terrorist attack to occur (Nacos, Block-Elkon and Shapiro Reference Nacos, Block-Elkon and Shapiro2007). Consistent with economic theory, we argue that these reference points are endogenous to the information environment (Shalev Reference Shalev2000; Koszegi and Rabin Reference Koszegi and Rabin2006).
Observational data make it difficult to disentangle these two effects because perceptions and actual levels of poverty and violence are highly correlated. However, disentangling these mechanisms is important for building theories of mass responses to political violence. If relative perceptions of poverty are important determinants of support for militant groups, then economic development per se may not yield full benefits if people still feel relatively poor or if these interventions increase aspiration levels. In addition, if perceptions influence attitudes, then policy interventions informing people about how militants introduce violence and economic hardship into communities may be especially effective in reducing support.
To isolate the psychological mechanism, we designed and fielded an original, large-scale (n=16,279), face-to-face survey in Pakistan that included embedded experiments in which we manipulated people’s perceptions of their SES and levels of militant violence in their country in order to measure downstream effects on political attitudes. More specifically, we experimentally induced variation in individuals’ perceptions of where they are in the income distribution and how violent Pakistan is relative to a neighboring country. The purpose of this experimental approach is to provide a test of whether relative perceptions of poverty and violence influence attitudes toward militant groups, above and beyond absolute levels of poverty and violence. Specifically, we hypothesize that both relative poverty and higher perceived levels of violence in one’s country will decrease support for militancy. If individual support for militancy can be moved by subtle primes manipulating reference points for poverty and violence, then perceptions may play an important role in determining support in the real world.
This paper provides the first experimental evidence for the impact of perceptions of poverty and political violence on attitudes toward militant organizations. We find that respondents experimentally induced to feel poorer and to perceive Pakistan as more violent than neighboring countries exhibit decreased support for militant organizations, demonstrating that perceptions of relative poverty and violence can influence attitudes. Increasing perceptions of Pakistan as a violent country had an even greater effect than inducing individuals to feel poor. Consistent with Blair et al. (Reference Blair, Fair, Malhotra and Shapiro2013), these findings directly refute the hypothesis that poverty causes support for militancy, instead showing that making individuals feel poorer decreases support for militant groups. We build on these existing results by demonstrating that a portion of the effect of poverty and violence on support for militant groups arises from psychological perceptions per se.Footnote 5
This research design cannot speak directly to the duration of the experimental treatments embedded in the survey. Although this is an interesting question for future research, we believe that it is important to first establish whether such subtle interventions aimed at manipulating relative perceptions of poverty and violence can in fact influence attitudes toward militant groups, even if temporarily. Any change in support from such modest interventions suggests that a sustained media campaign to reduce support for Islamist militancy in Pakistan could be a promising policy intervention. This approach of employing experimental treatments to temporarily manipulate causal variables that are hypothesized to influence political processes is standard in political psychology research. This is because the purpose of a survey experiment is to isolate a hypothesized relationship in a controlled setting in hopes of understanding how this phenomenon plays out under external conditions.
Before discussing our research design, we present relevant background information about the landscape of militant politics in Pakistan. We then describe the details of our survey methodology, our approaches for measuring the dependent variable (support for militant groups), and the independent variables of interest (experimental manipulations that induced variance in perceptions of poverty and violence). Finally, we present our results and discuss their implications for theories of conflict.
Background on Islamist Militant Politics in Pakistan
Islamist militant groups have long been a feature of Pakistani politics. The state has used militant proxies in neighboring countries, and Islamist militants have engaged in political activity and violence within Pakistan itself.Footnote 6 Over the last several years Islamist violence within Pakistan has intensified. From 1991 through 2007 Pakistan suffered an average of 141 militant attacks annually, causing 899 casualties per year. From 2008 through 2011 those numbers rose steadily, to 565 attacks in 2008, 667 in 2009, 713 in 2010, and 1011 in 2011, killing an average of 4219 people per year.Footnote 7
We evaluate support for three militant groups: Sipah-e-Sahaba Pakistan (SSP), the Pakistan Taliban (also known as the Tehreek-e-Tailban-e-Pakistan (TTP)), and the Afghan Taliban.Footnote 8 These three groups are extremely important to Pakistani and international security. They are responsible for the deaths of tens of thousands of Pakistanis and Afghans over the last decade, and the Pakistan army has fought a series of limited campaigns against the TTP resulting in thousands of casualties and substantial refugee flows (Ghufran Reference Ghufran2009). At various points of time, each of these groups has directly collaborated with al Qaeda and, in recent years, elements of the SSP/LeJ (Lashkar-e-Jhangvi) and the TTP have foregone their traditional loyalty to the Afghan Taliban and al Qaeda and have sworn fealty to the Islamic State (Nazish Reference Nazish2014). The SSP/LeJ have also been responsible for attacks on American and other international targets within Pakistan. As is well known, Pakistani support to the Afghan Taliban remains one of the most problematic issues in the region as the United States seeks to draw down its military presence in Afghanistan. Many observers fear that as the United States withdraws from Afghanistan, Pakistan will intensify its ongoing support to some reconstructed version of the Taliban, rendering Afghanistan once again a sanctuary for Islamist militants operating in and beyond South Asia (Kerry Reference Kerry2011).
It is important to note that there is no evidence that any of the groups we study advance an anti-poverty agenda. While the TTP and the Afghan Taliban have episodically claimed to provide government services such as quick adjudication of disputes over land and family matters, neither has consistently advocated for economic justice or redistribution.Footnote 9 The SSP, in decades past, sometimes couched their anti-Shia rhetoric in the lexicon of urban, upwardly mobile Sunnis challenging the hold of Shia rural landlords (Zaman Reference Zaman1998; Nasr Reference Nasr2000b). This rhetoric disappeared long ago.
The three militant groups that we study are from the Deobandi tradition, and as a result they all share a common infrastructure of mosques, madrassahs, and religious scholars (ulema, plural of alim) who issue fatwas to defend their actions. They also enjoy political cover from the Deobandi political party in Pakistan, the Jamiat Ulema-e-Islam. The Deobandi school originated in 1867 at a madrassah (religious seminary) in the town of Deoband, in the modern Indian state of Uttar Pradesh. It emerged as a South Asian Muslim religious revival movement that aimed to uplift Muslims by purifying Islamic practices through, among other things, discouraging mystical beliefs, such as intercession by saints, and propitiation at graves and shrines, which are the hallmarks of Barelvi worship. Deobandis follow a more purist and reformist interpretation of Sunni Islam. They tend to be “text-based,” vigorously oppose bida (impermissible innovations), and fight for the implementation of what they believe to be true Islam against other interpretations.
SSP
Since the late 1970s, Pakistan has been home to brutal, domestic, sectarian Islamist militant groups that shared overlapping networks and membership with groups acting outside of Pakistan. These sectarian groups (e.g., the SSP and its offshoot LeJ, which is now known by the new name, Ahle Sunnat Wal Jamaat) are most notorious for targeting Pakistan’s Shias, Ahmadis, and other religious minorities such as Christians, Hindus, and Sikhs. While these groups primarily focus their violent tactics upon Pakistan’s non-Deobandi citizens, they have also occasionally collaborated with other militant groups, such as the Afghan Taliban and some India-oriented militant groups (Nasr Reference Nasr2000a; Zahab Reference Zahab2002; Zahab and Roy Reference Zahab and Roy2004). The SSP/LeJ has also worked with al Qaeda to conduct attacks within Pakistan against foreign and Pakistani governmental targets. More recently, hundreds of members of this organization have joined the Islamic State and have left to fight in Syria and Iraq (Nazish Reference Nazish2014).
The Pakistan Taliban (TTP)
Following 9/11 and Pakistan’s decision to support US military operations in Afghanistan, Pakistan’s militant landscape underwent a significant transformation. Deobandi militant groups began to factionalize, with some groups targeting the Pakistani state. In late 2001, a key Deobandi group named Jaish-e-Mohammad split in two; one faction remained allied to the state and one began targeting the Pakistani government for supporting the US war on their allies, the Afghan Taliban, and Osama bin Laden. Since then, several Pakistani militant commanders from these complex Deobandi networks have organized to challenge the Pakistani state, coalescing in 2007 under the banner of the TTP. The TTP draws from Pashtun Deobandi militants in the tribal areas and Khyber Pakhtunkhwa (KPK) as well as from the Deobandi militant groups based in Punjab, including the sectarian and anti-Indian organizations. As the sectarian groups have expanded their influence within the TTP (e.g., the now-dead TTP leader Hakimullah Mehsud had an LeJ background), the TTP’s targets have expanded beyond Pakistani government, military, and political targets and increasingly include Pakistan’s various non-Deobandi communities, including Shia, Ahmadis, Sufis, Christians, and Hindus (Siddique Reference Siddique2010; Fair Reference Fair2011). The TTP also has overlapping networks with Arab and other foreign Islamist militant networks (e.g., Uzbek, Uigher, Chechan) in the region, as well as the Afghan Taliban and the Haqqani network (Zaidi Reference Zaidi2009; Qazi Reference Qazi2011). In recent years, many TTP commanders have reoriented away from their traditional loyalties to the Afghan Taliban and al Qaeda and have embraced the Islamic State (Sherazi Reference Sherazi2014).
The Afghan Taliban
The Taliban government achieved dominance over most of Afghanistan by 1996 with the assistance of the Pakistani government (Rubin Reference Rubin2002). The 9/11 attacks made it impossible for Islamabad to continue supporting the Taliban (Musharraf Reference Musharraf2006), and when the US-led coalition routed the Taliban in late 2001, many fled to Pakistan’s tribal areas to regroup. In 2005, the Afghan Taliban launched a renewed insurgent campaign focused on ousting foreign forces, aid workers, and other foreign civilians from Afghanistan, overthrowing the Karzai regime, and restoring their role in governing Afghanistan (Giustozzi Reference Giustozzi2009). Since 2010, there has been increasing debate in Pakistan about the potential threat the Afghan Taliban pose to Pakistan itself. Some of Pakistan’s strategic elites believe that the Afghan Taliban offers Pakistan the best protection of its interests in Afghanistan after the United States withdraws. Others worry that elements of the Afghan Taliban oppose the Pakistani state, are resentful of its decades of interference in Afghanistan, and may offer reverse sanctuary to the Pakistan Taliban (Dalrymple Reference Dalrymple2013; Coll Reference Coll2014). The recent announcement that the Afghan Taliban’s leader, Mullah Omar, had died at least two years ago in Pakistan has caused important rifts within the organization. Many of the commanders reject the new leader, Mullah Akhtar Mansoor, because of his role in covering up Omar’s demise. As with the other Deobandi groups discussed here, some of the Taliban commanders have defected to the Islamic State (Tomlinson and Khan Reference Tomlinson and Khan2015).
The Survey
In order to understand how relative poverty and perceived violence affect support for Islamist militancy in Pakistan, we designed and conducted a 16,279-person, face-to-face survey, which included 13,282 interviews in the four normal provinces (Punjab, Sindh, Balochistan, and KPK), as well as 2997 interviews in six of seven agencies in the Federally Administered Tribal Areas (FATA) (Bajaur, Khyber, Kurram, Mohmand, Orakzai, and South Waziristan).Footnote 10 The survey was fielded in January and February 2012 in the four normal provinces. Data collection in the FATA was postponed until April due to severe winter weather and the seasonal migration of residents to warmer areas of the country.Footnote 11 Ours was the first large-scale, agency-representative survey to do extended interviewing on these topics in the FATA, an area which is home to numerous active militant insurgencies and sanctuaries.
We hired SEDCO (Socio-Economic Development Consultants), a well-established and experienced Pakistani survey firm, to administer the survey. We worked with SEDCO to hire and train enumerators and field managers, design a sampling plan, and implement the randomizations for the experiments. Field supervisors recruited the enumerators approximately two weeks before training, a process overseen by the authors. Enumerator training focused on human subjects protection (obtaining informed consent, debriefing participants), progressing through the survey and its skip patterns, probing responses, and dealing with respondent follow-up questions. In Online Appendix 1, we present the interviewer guidelines to protect the anonymity and confidentiality of respondent reports.
Enumerators administered the surveys by reading a paper script verbatim in a place of the respondent’s choosing. During training the enumerators selected for work in local vernaculars (Punjabi, Sindhi, Baloch, Pashto, Saraiki, Hindko) practiced translating the survey form from Urdu. We provide additional details about interviewing procedures in Online Appendix 1.
Mixed gender teams traveled to each primary sampling unit (PSU). Female enumerators traveled in groups accompanied by the field supervisor, while male enumerators traveled in teams of two. Female interviewers conducted surveys with female respondents, while male interviewers conducted surveys with male respondents. This procedure optimally accommodated concerns about safety and social customs.
In the four normal provinces, we surveyed district-representative samples of 155–675 households in 61 districts: 15 in Balochistan, 14 in KPK, 12 in Sindh, and 20 in Punjab. Within each province, we sampled the two largest districts and then chose additional districts using a simple random sample. In the FATA, we collected agency-representative samples of 270–675 people in each of the six agencies where our enumerators could travel. Samples within districts/agencies were purchased from the Pakistan Bureau of Statistics, which provided its most recent sampling frames. As Pakistan has experienced substantial, heterogeneous population growth since the last census in 1998 we do not calculate post-stratification weights. Our results should therefore be taken as representative for our sample, which, while large, does over-represent Pakistanis from the lesser-populated provinces. The overall response rate was 71 percent, with 14.5 percent of households contacted refusing to take the survey and 14.5 percent of the targeted households not interviewed because no one was home. This response rate rivals those of high-quality academic surveys in the United States such as the American National Election Study.
We conducted two, large-scale pre-tests of the survey instrument. We first pre-tested a restricted 20-minute questionnaire with a sample of 1084 respondents in two cities of Punjab (Lahore and Attock) from July 1 to July 27, 2011. This first pre-test focused on measuring income, knowledge about militant groups, and on evaluating the three experiments described below. We found that respondents were quite willing to discuss the endorsement questions but reluctant to answer an extended income battery. We revised the income battery substantially after this pre-test and altered the comparison groups for the Perceived Violence Experiment. In our second pre-test we administered a slightly different restricted questionnaire with a total sample of 1215 respondents in Peshawar and Karachi from October 28 to November 15, 2011. Here we focused on testing a battery measuring political knowledge as well as validating the revised Perceived Violence Experiment and checking that the endorsement experiment worked in Peshawar and Karachi where militant violence is more common than in Punjab. The pre-test indicated that the survey instrument was functioning reliably and was ready to be fielded on the full sample.
Research Design
This section outlines our research design. We first explain the endorsement experiment that we implemented to measure the key dependent variable of support for militant groups. We then describe the two experiments in which we exogenously vary two key independent variables: relative poverty and beliefs about the intensity of violence in Pakistan. In each section we describe the methodology of statistically analyzing the experiment.
The Endorsement Experiment
Design
Instead of asking respondents directly whether they support militant organizations, we used an endorsement experiment to measure support for specific Islamist militant organizations.Footnote 12 Endorsement experiments were first used in a conflict area to study support for political violence by Blair et al. (Reference Blair, Fair, Malhotra and Shapiro2013) (see Bullock, Imai and Shapiro Reference Bullock, Imai and Shapiro2011 for a methodological justification). Subsequent scholars have used the endorsement experiment methodology in a range of contexts (Díaz-Cayeros et al. Reference Díaz-Cayeros, Magaloni, Matanock and Romero2011; Blair, Lyall and Imai Reference Blair, Lyall and Imai2013).Footnote 13 In this study, we use the standard endorsement experiment design employing between-subject randomization, akin to Blair, Lyall and Imai (Reference Blair, Lyall and Imai2013), but different from the within-subject design used in Blair et al. (Reference Blair, Fair, Malhotra and Shapiro2013). In addition, we included a treatment condition in which the policy was endorsed by an actor who is viewed positively by the majority of the population. This allows us to benchmark the effect size of support for the militant groups.
The strategy of an endorsement experiment is to make a policy, rather than a militant organization, the primary object of evaluation. This is based on a large body of research in psychology finding that liked sources are more persuasive and influential (see Petty and Wegener Reference Petty and Wegener1998 for a review). Consequently, an endorsement effect captures how much people support the endorser. In this study, respondents were randomly assigned to one of four treatment groups or to a control group (one-fifth of the sample was assigned to each group). Respondents in the control group were asked their level of support for four policies, measured on a five-point scale, recoded to lie between 0 and 1 for the analysis.Footnote 14 Respondents in the treatment groups were asked identical questions, but were then told that one of four militant organizations/people supports the policy in question (SSP, Pakistan Taliban, Afghan Taliban, Abdul Sattar Edhi). Each of the four treatment groups was associated with one of these four actors. The difference in means between treatment and control groups provides a measure of affect toward the actors, as the only difference between the treatment and control conditions is the group endorsement.
Including Abdul Sattar Edhi, a well-known humanitarian, as the fourth actor allows us to benchmark the endorsement effects for militant groups against those for a broadly popular figure in Pakistan. The Edhi Foundation humanitarian network reaches across Pakistan providing free hospitals, homeless shelters, and emergency relief in poor communities throughout the country. Edhi is the closest thing to a universally revered public figure we could identify in Pakistan, an assessment confirmed in pre-testing. If the endorsement experiment is functioning as expected, then Edhi’s endorsement should increase support for the policies on average.Footnote 15 The Edhi endorsement effect also provides a baseline against which to compare the effect of militant group endorsements.
Using an endorsement experiment has several advantages over asking direct questions about support for militancy in a context such as Pakistan. First, as noted by Blair et al., “when the object of evaluation is a policy (as opposed to a group), social desirability concerns are lessened because respondents (particularly those of lower class, ethnicity, or social status) are not asked to explicitly and directly divulge their beliefs about militants” (Reference Blair, Fair, Malhotra and Shapiro2013, 34). Second, this approach may also mitigate the inclination to not respond to the question due to fear of these militant groups. Third, this type of question reduces security threats to the enumerators, who sometimes encounter militant groups, Pakistani intelligence organizations, or their representatives while in the field. Such third parties appear to see this approach as less injurious to their interests, likely because they believe the instrument queries policies and not groups. Ideally, respondents should consider questions about a policy endorsed by a group to be no more sensitive than being asked about the policy alone. Even if this approach does not completely remove social desirability bias, it provides a potential improvement on direct questions as long as the difference in sensitivity between endorsement conditions is less than that invoked by direct questions.
We identified policies for the experiment by closely perusing Pakistani domestic press accounts, and vetted them for suitability through pre-testing of the survey and through focus groups. We chose real policies which were relatively well known but about which Pakistanis were unlikely to have extremely hardened opinions, such that they had the potential to be swayed by the endorsements: (1) plans to bring in the army to deal with the violence in Karachi; (2) “mainstreaming” the FATA; (3) using peace jirgas to solve outstanding bilateral disputes between Afghanistan and Pakistan, including the conflict over the Durand Line; and (4) engaging in a dialogue with India over bilateral issues.Footnote 16
The question wordings for the four issues were as follows:
-
∙ Violence in Karachi: “As you may know, in recent months, Karachi has suffered continuous and intense violence. The police have been unable to stop the violence. Some politicians and people want the army to come in to deal with the violence and the extremists. Some say this is a good idea, some say it is a bad idea. How much do you support such a policy?”
-
∙ Mainstreaming the FATA: “As you may know, in recent years, there have been discussions about ‘mainstreaming’ FATA (qabaili ilaqe) and abolishing the British-era Frontier Crimes Regulation (FCR). For example, some have discussed making FATA (qabaili ilaqa) a part of Khyber Pakhtunkhwa and extending Pakistan’s constitution to this area. Some say this is a good idea, some say it is a bad idea. How much do you support such a policy?”
-
∙ Durand Line: “As you may know, the boundary between Afghanistan and Pakistan is known as the Durand Line. Afghanistan disputes this border and even claims parts of Pakistan as its own territory. The governments of Afghanistan and Pakistan have explored using peace jirgas to resolve their disputes including the location of the border. Some say this is a good idea, some say it is a bad idea. How much do you support such a policy?”
-
∙ Dialogue with India: “As you may know, there are ongoing efforts between the Indian and Pakistani governments to resolve their difference through dialogue. This has resulted in various meetings over the last several years among Indian and Pakistani officials in both India and Pakistan. The Pakistan Government’s policy is to continue to engage India in this dialogue. Some say this is a good idea, some say it is a bad idea. How much do you support such a policy?”
Respondents reported support for the policies on a five-point response scale: “a great deal,” “a lot,” “a moderate amount,” “a little,” and “not at all.” Respondents in the control group received the questions as they appeared above; respondents in the treatment group were also provided with an endorsement by one of the four militant groups/individuals immediately before being asked their level of support for the policy: “[Sipah-e-Sahaba-e-Pakistan (SSP)/The Pakistan Taliban/The Afghan Taliban/Abdul Satter Edhi] have/has voiced support for this policy.”
It was only possible to include a small number of militant groups in the endorsement experiment as each additional group requires another endorsement question and reduces the sample size per endorsement condition. In addition, as discussed above, our extensive pre-testing revealed that some groups were too sensitive to ask about, even using this indirect approach (including al Qaeda and Lashkar-e-Taiba (LeT)/Jamaat-ud-Dawa). During pre-tests, enumerators reported that asking about such groups made them uncomfortable and hindered their performance on those questions relative to the rest of the survey, resulting in high non-response rates. We settled on three groups that are extremely important to Pakistani and international security, but that were not too sensitive to ask about during the time period in which the survey was administered.
Statistical analysis
The statistical estimation of the endorsement effects (via OLS (ordinary least squares) regression)Footnote 17 is straightforward:
 $$P_{i} \,{\equals}\,\alpha {\plus}\beta E_{i} {\plus}{\epsilon}_{i} ,$$
where i indexes respondents, P i is the average level of policy support for the four items, E i a dummy variable coded “1” for respondents receiving a given endorsement and “0” for respondents in the control group, and ε i represents stochastic error. The parameter of interest is β, which tells us how much the endorsement by a group or actor increased/decreased support for the policies on average. Because the endorsement treatment was assigned at the PSU level, standard errors are clustered at that level.Footnote 18
Diagnostic checks
We also implemented a series of diagnostic checks to see if the endorsement experiment functioned as intended. First, although asking respondents directly about the militant groups raised safety concerns, we were able to ask explicitly about support for the humanitarian Edhi: “How much do you support Abdul Satter Edhi and his work?” (response options: “a great deal,” “a lot,” “a moderate amount,” “a little,” and “not at all”). Accordingly, respondents who explicitly support Edhi should have more strongly positive endorsement effects than respondents who do not report explicit support. Second, a concern that one might have about the endorsement experiment is that the endorsements themselves change people’s interpretation of the policies. This seems unlikely as the policies were explained in some detail and not simply by their taglines (e.g., “What do you think about mainstreaming the FATA?”). Accordingly, we administered a nine-item general political knowledge quiz to respondents (see Online Appendix 2) and constructed an additive index of the number of correct responses. The content of the quiz was similar to those found in American political behavior research (e.g., identifying which party controls the government, who holds certain offices, etc.). The endorsement experiment would not be functioning as expected if respondents with more pre-treatment political knowledge exhibited smaller endorsement effects, as this would suggest that the endorsement actually provides substantive information about the policy, as opposed to the endorsement tapping support for the endorser. As an additional diagnostic check, we also explicitly asked respondents whether they knew about the policies used in the endorsement experiment (see Online Appendix 2 for question wordings). We constructed an additive index of policy knowledge and ensured that the endorsement experiment is not simply providing information to low-information respondents. Finally, we also tested for heterogeneous endorsement effects by level of education. As we show below, our endorsement estimates change very little across levels of political knowledge, knowledge of the specific policies used in the endorsement experiment, and level of education.
The Relative Poverty Experiment
Design
To assess whether feelings of relative poverty increase support for militant groups, we designed and administered the Relative Poverty Experiment, experimentally inducing respondents to feel either more or less poor in comparison with others. We asked respondents “What is the approximate monthly income of your household?,” and randomly assigned them to one of two sets of response options with different reference points.
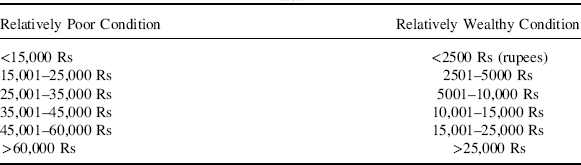
Note that the bottom income bracket in the Relatively Poor Condition has a very high threshold of 15,000 Rs a month, meaning that many respondents will place themselves in this bracket. Conversely, the Relatively Wealthy Condition has a much lower threshold, meaning that respondents are more likely to place themselves in a higher income bracket. This is indeed the case, with 39.3 percent of respondents in the Relatively Poor Condition placing themselves in the bottom income category, as compared with only 4.4 percent in the Relatively Wealthy Condition (difference: p<0.001). Accordingly, because respondents in the Relatively Poor Condition are more likely to assign themselves to the “bottom” income category, they will be made to feel poorer relative to other Pakistanis. Actual SES measured pre-treatment in terms of monthly household expenditures is almost identical in these two conditions (Relatively Wealthy Condition: 16,374 Rs; Relatively Poor Condition: 16,577 Rs; p=0.54).
This experiment builds on work using similar designs that examined how subjective relative income affects behaviors such as lottery ticket purchases and sexual trafficking (Haisley, Mostafa and Loewenstein Reference Haisley, Mostafa and Loewenstein2008; Mo Reference Mo2013).Footnote 19 Research in psychology, economics, and decisionmaking has repeatedly found that people do not evaluate their income in absolute terms when making choices but rather relative to social comparison groups (e.g., Festinger Reference Festinger1954; Crosby Reference Crosby1976), and that reference points can profoundly affect how people perceive their current situation (Kahneman and Tversky Reference Kahneman and Tversky1979).
Undeniably, this subtle experimental intervention may not be long-lasting. However, it is not theoretically relevant whether the treatment has sustained effects on political attitudes. Rather, demonstrating that support for militant groups can be shifted via the adjustment of reference points provides evidence that at least some of the effects of poverty identified in previous research are indirect and the result of perceptions.
Statistical analysis
To assess whether being made to feel relatively poorer increased or decreased support for militant groups, we estimate the following OLS regression model:
 $$P_{i} {\equals}\alpha {\plus}\beta E_{i} {\plus}\eta T_{i} {\plus}\lambda E_{i} {\times}T_{i} {\plus}{\epsilon}_{i} ,$$
where all other variables are defined as they are in Equation 1 and T i is a dummy variable coded “1” if the respondent is assigned to the Relatively Poor Condition and “0” if the respondent is assigned to the Relatively Wealthy Condition. The parameter of interest is λ, which estimates the difference-in-difference (DID) in the endorsement effects between conditions in the Relative Poverty Experiment. In other words, is the endorsement effect stronger when people are made to feel relatively more poor? As above, we cluster standard errors by PSU.
The Perceived Violence Experiment
In the Perceived Violence Experiment, we manipulated whether people thought that Pakistan was a relatively violent state. Respondents were randomly assigned at the PSU level to one of the two conditions where the only difference was how levels of violence in Pakistan were benchmarked relative to another South Asian country.Footnote 20 The goal in this experiment was to provide respondents with different reference points with which to assess how violent Pakistan is compared with other countries, with the aim of manipulating perceptions of violence. Some respondents were provided with a high reference point (a country that made Pakistan look non-violent in comparison), while others were provided with a low reference point (a country that made Pakistan look violent in comparison).
-
∙ Less Violence Condition: “We want to get your views on a range of challenges facing Pakistan. As you know, Pakistan has faced a number of economic challenges lately, including major floods each of the last two years, as well as high oil prices and the poor world economy. Pakistan has also suffered from instability and violence. In fact, on average, Pakistan suffers from less extremist violence than Afghanistan.”
-
∙ More Violence Condition: “We want to get your views on a range of challenges facing Pakistan. As you know, Pakistan has faced a number of economic challenges lately, including major floods each of the last two years, as well as high oil prices and the poor world economy. Pakistan has also suffered from instability and violence. In fact, on average, Pakistan suffers from more extremist violence than Bangladesh.”
To analyze the Perceived Violence Experiment, we use the same statistical model represented by Equation 2 except that now T i is a dummy variable with “1” indicating that the respondent was assigned to the More Violence Condition and “0” indicating that the respondent was assigned to the Less Violence Condition. The parameter estimate of λ tells us whether support for militant groups (as revealed through the endorsement effect) is greater when people feel that Pakistan is a relatively violent country. As with the Relative Poverty Experiment, our goal here is not to determine if the treatment has long-lasting effects on attitudes, but rather simply if perceptions of violence (and the resulting support for violent groups) can be psychologically manipulated.
Because the conditions in the Relative Poverty and Perceived Violence Experiments were independently manipulated, we effectively have a 2×2 design containing four cells (Relatively Wealthy/Less Violence, Relatively Poor/Less Violence, Relatively Wealthy/More Violence, Relatively Poor/More Violence). Hence, we can examine how poverty and violence interact in explaining support for militant groups. To do so, we estimate a similar equation to Equation 2, except we include three dummy variables indicating which experimental cell the respondent was assigned to (setting the Relatively Wealthy/Less Violence group as the baseline category), and interact the endorsement cue with each of the three dummy variables. This allows us to estimate the endorsement effect for each poverty/violence combination, and compare the groups with one another. In particular, we can assess whether exposure to both poverty and violence is especially meaningful.
The randomization procedures appeared to work properly. As shown in Online Appendix Figures 1–3, the experimental conditions are well balanced on pre-treatment demographic covariates for the Endorsement, Relative Poverty, and Perceived Violence Experiments. Descriptive statistics of policy support by experimental conditions are presented in Online Appendix Table 1.
Results
Because we are analyzing simple experiments and do not estimate regressions with control variables, we follow Kastellec and Leoni (Reference Kastellec and Leoni2007) and present our results graphically, plotting the treatment effects and associated 95 percent confidence intervals. Readers more accustomed to tables can find the results presented in tabular form in Online Appendix Tables 2–6. As we have clear theoretical predictions and strong priors based on existing empirical evidence, we conduct one-tailed tests where relevant. This includes tests for the following predictions: an Edhi endorsement will increase support for the policies among explicit supporters of Edhi, relative poverty will decrease support for militancy, and higher perceived levels of violence will decrease support for militancy. Finally, for all of the main analyses in this paper, we conduct the following two robustness checks: (1) include demographic controls and (2) include regional controls and cluster the standard errors at the district level instead of the PSU. All results are robust to these alternative specifications (see Online Appendix Tables 3 and 4).
Before delving into the Relative Poverty and Perceived Violence Experiments, which form the core of our study, we present the endorsement effect results that constitute our dependent variable of interest. As Figure 1(a) shows, the endorsement effects for the three groups were slightly negative, averaging about −1.0 percent. In other words, associating a policy with an endorsement from a militant group reduced support for the policies by about 1 percentage point on the 0–1 scale. Of course, we cannot interpret this effect directly as we are pooling respondents who received different treatments and the experimental stimuli may have affected support for militancy in different ways.
Endorsement effects (a) On the y-axis are the estimated coefficients for β from Equation 1 (along with 95 percent confidence intervals), which measures how much the endorsement by a militant group changed support for the policies on average. The estimated coefficient β is also presented for respondents above (open circle) and below (open square) the median on the political knowledge index (b) On the y-axis are the estimated coefficients for β from Equation 1 (along with 95 percent confidence intervals) representing the effect of the Edhi endorsement for the full sample and separately for those who explicitly said they supported Edhi “a great deal” or “a lot” and those who explicitly said they supported Edhi “a moderate amount,” “a little,” or “not at all.”
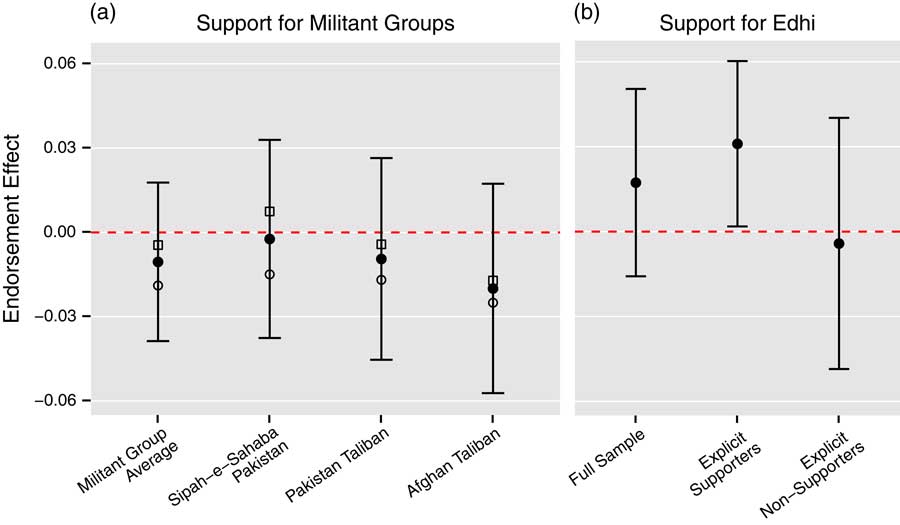
The diagnostic checks suggest that the endorsement experiment is functioning as we would expect. Our first diagnostic check assessed whether people who expressed explicit support for Edhi had more positive endorsement effects than those who did not. As Figure 1(b) illustrates, Edhi’s endorsement boosted support for the policies by 1.7 percent. Among respondents who said that they supported Edhi “a great deal” or “a lot,” his endorsement increased support for the policies by 3.1 percent, which we can significantly distinguish from 0 (p=0.04). Conversely, among respondents who reported less explicit support for Edhi, his endorsement had very close to a zero effect. We will use this 3.1 percent endorsement effect as a benchmark for comparing other endorsement effects for which we do not have direct questions for comparison. The experiment passed the second diagnostic check as well. In Figure 1(a), we also plot the point estimates of the endorsement experiments for respondents who were (1) above the median on the general knowledge scale (open circle) and (2) below the median on the general knowledge scale (open square).Footnote 21 As the figure illustrates, the point estimates in the subgroups are very close to those for the full sample, meaning that the endorsement effects were statistically and substantively similar across all knowledge subgroups.Footnote 22 In addition, the endorsement effects are substantively similar across individuals with varying levels of knowledge about the specific policies used in the endorsement experiment, as well as across individuals with varying levels of education (see Online Appendix Table 2).Footnote 23 Hence, the endorsements are not merely providing information.
We now turn to our findings on the relationship between poverty and support for militancy. Before discussing the results of the Relative Poverty Experiment, we first present observational findings showing the endorsement effects by different levels of actual poverty. Doing so allows us to benchmark our results against an observational baseline comparable with prior work. Because the survey question on household income included the manipulation of income brackets for the Relative Poverty Experiment, we could not use it to assess respondents’ actual level of poverty or wealth. Instead, we use a pre-treatment question on monthly household expenditures: “Thinking about all the things you and your family spend money on, how much money in cash did you and your family spend in the last month?” We then took this continuous response and classified respondents as “upper class” (top 20 percent), “middle class” (middle 60 percent), and “lower class” (bottom 20 percent), where percentiles are calculated within province and strata (urban/rural) as in Blair et al. (Reference Blair, Fair, Malhotra and Shapiro2013). As Figure 2(a) illustrates, lower-class respondents are less supportive of militant groups, exhibiting significantly negative endorsement effects (−4.2 percent, p=0.025).Footnote 24 The upper class income group exhibited greater support, although the endorsement effect is not distinguishable from 0 (2.4 percent, p=0.11). These findings are broadly consistent with Blair et al. (Reference Blair, Fair, Malhotra and Shapiro2013), who found that the poorest individuals in Pakistan held the most negative attitudes toward militant groups. The difference between the upper and lower class endorsement effects is large (6.6 percent, p=0.006).Footnote 25
Results of the Relative Poverty Experiment (a) On the y-axis are the estimated endorsement effects (and 95 percent confidence intervals) among various income subgroups (b) On the y-axis are the estimated coefficients from Equation 2 (and 95 percent confidence intervals) from left to right: β (the endorsement effect among respondents in the Relatively Wealthy Condition), β+λ (the endorsement effect among respondents in the Relatively Poor Condition), and λ (the difference in the endorsement effects between these two experimental groups). Note: SES=socio-economic status.
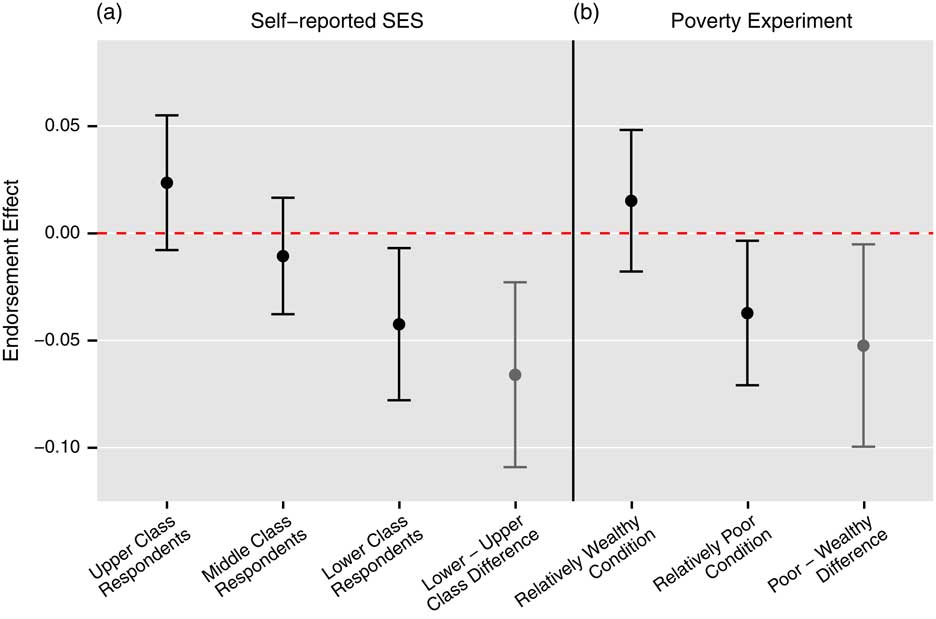
Are these differences solely due to the direct effects of poverty, or are there psychological effects of relative economic standing? We leverage the Relative Poverty Experiment to address this question. As Figure 2(b) shows, feelings of relative poverty decreased support for militant political organizations in Pakistan. Respondents in the Relatively Poor Condition (who were more likely to report a low-income category) exhibited less support for militant groups; the endorsement effect in this experimental group is negative and statistically significant (β+λ=−0.037, p=0.035). In other words, being experimentally induced to feel poorer relative to others reduced support for the militant groups. In contrast, the endorsement effect of individuals in the Relatively Wealthy Condition is indistinguishable from 0 (β=0.015, p=0.23). The DID estimate of whether the endorsement effect differs across conditions is statistically significant (λ=−0.052, p=0.034). Thus, the Relatively Poor treatment decreased support for the groups by 5.2 percent, an estimate which is about 67 percent larger than the Edhi baseline between explicit supporters and non-supporters.Footnote 26 This experimentally induced difference in the endorsement effect is roughly 79 percent of the difference in the endorsement effect between those who self-report income in the top quintile and those in the bottom quintile. These results strongly suggest that part of the observed relationship between poverty and opposition to militant groups stems from psychological feelings of relative deprivation.
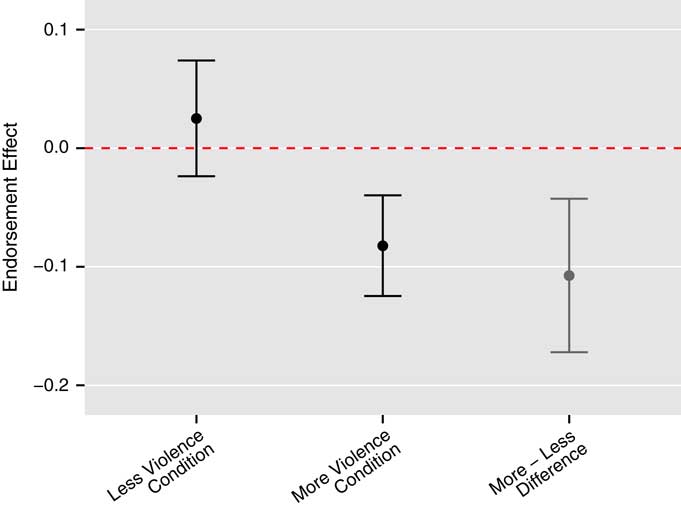
We turn to the Perceived Violence Experiment to assess whether manipulating perceptions of how violent Pakistan is relative to other countries influences support for militancy. We find that perceiving Pakistan to be a relatively violent country also reduces support for militant groups. As shown in Figure 3, when informed that Pakistan is more violent than another country in the region, people became less supportive of the militant groups responsible for violence in their country. Respondents in the More Violence Condition exhibited a statistically significant negative endorsement effect for the militant groups (β+λ=−0.082, p=0.001). Conversely, respondents in the Less Violence Condition exhibited a positive but not significant endorsement effect (β=0.025, p=0.20). The DID estimate testing whether the experimental manipulation decreased support for militant groups is negative and statistically significant (λ=−0.107, p=0.004). Substantively, learning that Pakistan is relatively more violent than a neighboring country decreased support for the militant groups by 10.7 percent, nearly 3.5 times the size of the Edhi endorsement baseline.Footnote 27 Hence, one reason why others have observed that actual violence tends to decrease support for violence is likely the psychological effect of feeling that one’s country or locality is insecure.
Results of the Perceived Violence Experiment Note: On the y-axis are the estimated coefficients from Equation 2 (and 95 percent confidence intervals) from left to right: β (the endorsement effect among respondents in the Less Violence Condition), β+λ (the endorsement effect among respondents in the More Violence Condition), and λ (the difference in the endorsement effects between these two experimental groups).
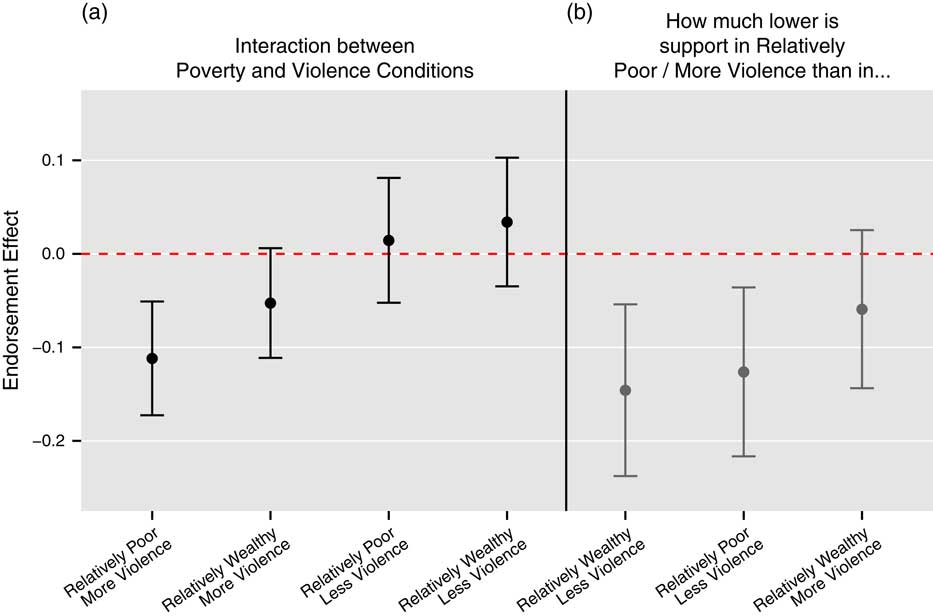
Support for the militant groups is lowest among people exposed to both the poverty and violence treatments. As Figure 4(a) demonstrates, respondents who were experimentally induced to feel poorer and to perceive their country as relatively more violent were least supportive of the militant groups, exhibiting the most significantly negative endorsement effect (−11.18 percent, p=0.002). This is a substantively large effect, exceeding 3.6 times the Edhi effect. Respondents in the other three experimental cells had higher endorsement effects, and all three are indistinguishable from 0. Figure 4(b) illustrates the differences in the endorsement effects between people in the Relatively Poor/More Violence Condition (those induced to feel poorer and to perceive their country as relatively violent) and respondents in the other three groups. Compared with respondents who were made to feel relatively wealthier and to perceive Pakistan as less violent, those in the Relatively Poor/More Violence group exhibited 14.6 percent lower support for the militant groups (p=0.005). Similarly, compared with people made to feel poorer and to perceive Pakistan as less violent, adding information about more violence on top of feeling poorer decreased support for the groups by 12.6 percent (p=0.011). Although the endorsement effect among the Relatively Poor/More Violence group is lower than that in the Relatively Wealthy/More Violence group, the difference is not statistically distinguishable from 0 (p=0.125), suggesting that the violence information was more powerful than the poverty manipulation. Nonetheless, the difference in the endorsement effect between the two groups is a substantively large 5.9 percent.
Interaction of relative poverty and perceived violence (a) On the y-axis are the estimated linear combinations of coefficients from Equation 2 (and 95 percent confidence intervals) representing the endorsement effects among each cell of the 2×2 experimental design (b) On the y-axis are the differences in the endorsement effects (and 95 percent confidence intervals) between the Relatively Poor/More Violence group and the other three experimental groups.
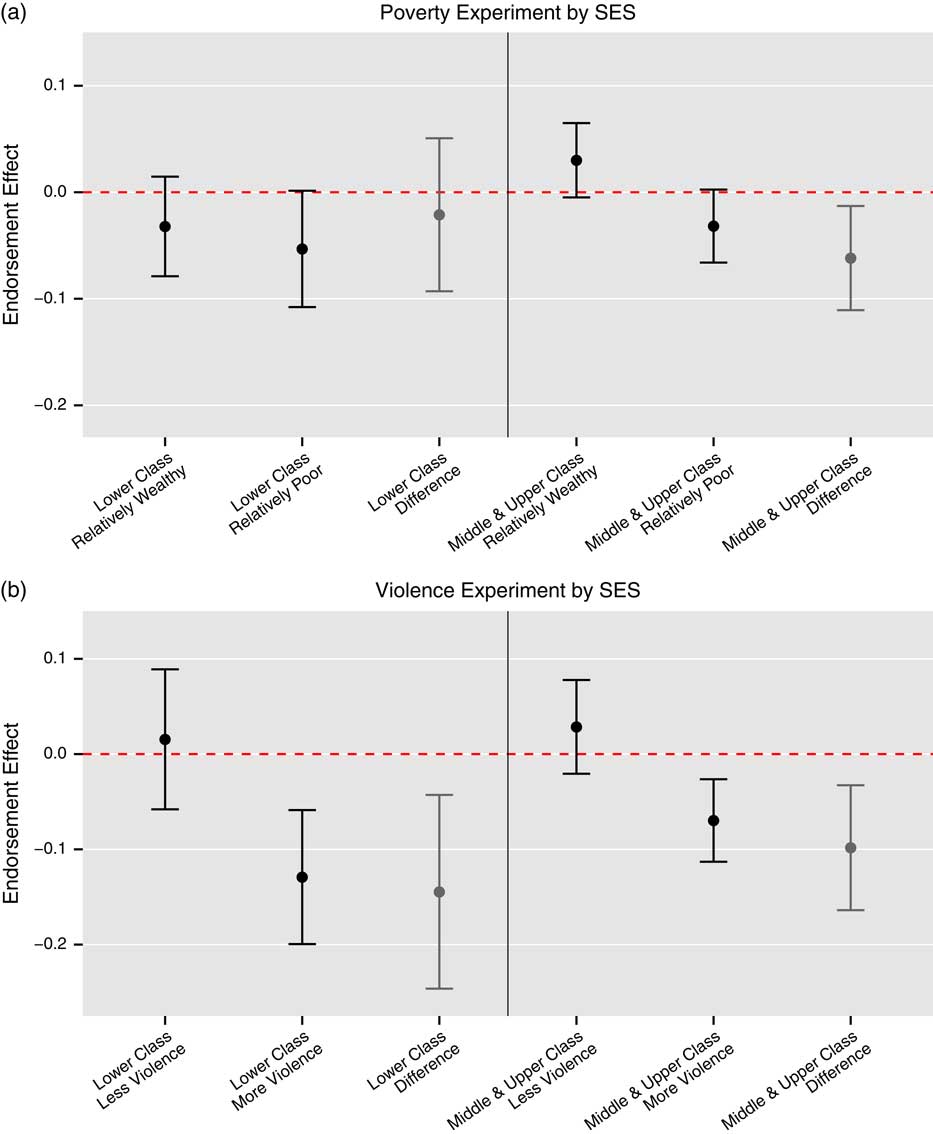
As a robustness check to ensure that the Relative Poverty Experiment was functioning as expected, we estimated the treatment effects separately across levels of actual poverty, as defined by self-reported expenditures.Footnote 28 The effect is strongest among middle-class and wealthy Pakistanis, exactly the people who should be most affected by the prime as they are not used to feeling poor. As Figure 5(a) depicts, the self-reported poor hold militant groups in low regard in both experimental conditions (regression presented in Online Appendix Table 5). Among those not in the bottom income quintile on the self-reported SES measure, however, there is a substantial impact of varying perceptions of wealth. Support for militants among middle-class and wealthy respondents is 6.2 percent lower in the Relatively Poor Condition compared with the Relatively Wealthy Condition (p=0.019).Footnote 29 The Perceived Violence Experiment had statistically similar impacts across different levels of actual poverty, though the magnitude of the effect was slightly larger among the poor (see Figure 5(b)).
Treatment effects of relative poverty and perceived violence by observed poverty (a) On the y-axis are the estimated endorsement effects (and 95 percent confidence intervals) for the Relatively Wealthy and Relatively Poor experimental conditions (along with the difference between the two conditions), plotted separately by levels of actual economic standing (b) On the y-axis are the estimated endorsement effects (and 95 percent confidence intervals) for the Less Violence and More Violence experimental conditions (along with the difference between the two conditions), plotted separately by levels of actual economic standing Note: SES=socio-economic status.
As an additional analysis, we estimated treatment effects of the Perceived Violence Experiment separately for two populations that are highly policy-relevant in terms of violence in Pakistan. We first looked at residents of the FATA, the region of Pakistan that has experienced insurgency since 2004 (if not earlier in some parts) and where militants fighting in Afghanistan have sought refuge since late 2001. The violence treatment decreased support for militant groups by a substantial 15.4 percent among residents of the FATA (p=0.042). Second, much of the violence in Pakistan has been conducted by organizations claiming to represent the interests of conservative and more Islamist elements of Pakistan’s Pashtun ethnic minority. Among native Pashto speakers, our best proxy for Pashtun identity, the violence treatment decreased support for the groups by 13.1 percent (p=0.024). Thus, sharing information on the costs of militancy drives down support in two of the most policy-relevant populations of Pakistan.
Discussion
Addressing the extant literature on the effects of economic status on support for political violence, we analyzed the relationships among perceived SES, perceived levels of violence, and support for militant organizations in Pakistan. To our knowledge, this study reports the first large-scale experimental evidence that there is a causal relationship between relative poverty, perceived violence, and level of support for violent organizations in the developing world.Footnote 30 We find that psychological perceptions of relative standing are a key reason why poverty and violence seem to be negatively correlated with support for militant politics.
While consistent with much of the academic literature, the effect is in the opposite direction of conventional wisdom; poorer people dislike militants and when people are made to feel relatively more poor they become less supportive of violent organizations. The effects are substantively large; the subtle poverty prime has an effect size of 79 percent as large as the impact of actual economic position. Combined with the fact that individuals express less support for militant organizations when told that Pakistan is more violent than its neighbors, these findings provide strong evidence for the idea that support for violent organizations is conditioned in large part by the costs they impose.
Our results should also enhance confidence in prior work on the influence of militant behavior on mass attitudes. We provide a micro-foundation for observational results and show that experimental results are in the same direction as previous correlational findings. Condra et al. (Reference Condra, Felter, Iyengar and Shapiro2010) and Condra and Shapiro (Reference Condra and Shapiro2012) argue that non-combatants turn against those who harm them by sharing information with the other side. Their evidence was indirect, however, as they exploit the randomness inherent in weapons effects to show that violence in Afghanistan and Iraq spiked following increases in civilian casualties caused by the United States and its allies and decreased following violence inflicted by insurgents. The authors interpret this empirical pattern as the result of attitudinal changes in the population consistent with the Hearts-and-Minds model of Berman, Shapiro and Felter (Reference Berman, Shapiro and Felter2011). Blair, Lyall and Imai (Reference Blair, Lyall and Imai2013) posit a similar dynamic in terms of individual attitudes based on finding a negative correlation between self-reported harm inflicted by the International Security Assistance Force (ISAF) and support for the ISAF, and a positive correlation between harm and support for the Taliban. They find a symmetric, but much weaker, set of correlations for self-reported harm inflicted by the Taliban. While those authors do not exploit any source of exogenous variation in perceived exposure to the externalities caused by the ISAF or the Taliban, our results suggest that a causal interpretation may be warranted. We provide evidence that, at least in Pakistan, the kinds of correlations between externalities and attitudes reported by Blair, Lyall and Imai (Reference Blair, Lyall and Imai2013) emerge from exogenously induced variation in perceived violence. The existence of these relationships would hardly surprise the many terrorist and insurgent leaders who have worried about the political impact of their externalities (Shapiro Reference Shapiro2013), but ours is the first experimental evidence of them.
One might wonder how these findings might apply to policy-relevant groups that we did not ask about such as LeT, al Qaeda, and the Islamic State (i.e., ISIS (Islamic State of Iraq and Syria)). The militant groups discussed in this paper are all Deobandi. In contrast, LeT and al Qaeda are both Salafist (or quair muqalid). However, despite this similar orientation, LeT and al Qaeda differ from each other in several important respects. LeT vigorously opposed attacking Pakistanis and maintains that jihad can only be waged outside of Pakistan (Fair Reference Fair2011). LeT markets itself as Jamaat-ud-Dawa and Filah-Insaniat Foundation within Pakistan, both of which purport to be non-governmental organizations engaged in relief and philanthropic work. The rebranding of LeT means that many Pakistanis see the organization not as a group that provides political violence as a public good, but rather as an organization that serves humanity but which has been maligned by enemies of Islam (Fair Reference Fair2011). In contrast, al Qaeda has vigorously waged jihad in Pakistan. LeT also is at odds with the various Deobandi groups for the same reason. Consequently, we might expect attitudes to be similar toward al Qaeda but not LeT.
Further, as noted above, many commanders of the three Deobandi groups discussed here have opted to join the Islamic State. One reason for this is the fundamentally sectarian worldview of the Deobandi maslak (Islamic interpretive tradition) in Pakistan. The SSP’s commitment to targeting Shia, Ahmadis, and non-Muslims has made them a natural collaborator of the Islamic State. Over the last few years, hundreds of Deobandi sectarian militants from the TTP and SSP have elected to join the Islamic State to kill Shia and Alawites in Iraq and Syria, respectively (Perwaiz Reference Perwaiz2014; Saud and Bukhari Reference Saud and Bukhari2014; Hassan Reference Hassan2015). The most sectarian commanders of the TTP, particularly those associated with the SSP/LeJ, are turning away from their traditional allegiance to the Afghan Taliban leadership and are embracing the Islamic State (Nazish Reference Nazish2014). For a variety of reasons, most of which pertain to politics within Afghanistan generally and the Afghan Taliban in particular, several Afghan Taliban commanders have embraced the Islamic State as well. Consequently, we speculate that our findings may also speak to patterns of support for the Islamic State.
One might also wonder how persistent the treatment effects might be, and what they might imply for our theoretical understanding of how perceptions of poverty affect political attitudes. Previous research has shown that framing and other communication effects can persist over time, at least for some types of people (Chong and Druckman Reference Chong and Druckman2010). However, the right way of interpreting these results is not that the specific experimental treatment would affect survey attitudes weeks later. Rather, the experimental manipulations are intended to simulate information that people are exposed to repeatedly in their daily lives, and likely have long-lasting and enduring effects. For example, observing income inequality might make people feel relatively rich or poor, and these constant exposures to reference points likely have enduring impacts on attitudes. The purpose of the survey experiment is to isolate this relationship in a controlled setting by showing that manipulating relative poverty one time can have substantively important effects. The domain of the laboratory/survey is necessarily artificial, but the goal is to help us understand the external environment.
Our work suggests several avenues for future scholarship. First, future research should study the correlation between non-combatant attitudes and realized militant violence. The set of places where one can independently observe both militant violence and civilian attitudes include Afghanistan, Pakistan, and Palestine. As it seems unlikely that scholars will be able to identify sources of variation in attitudes that are uncorrelated with trends in conflict except through their impact on attitudes, more complete structural models of the relationship between attitudes and conflict will likely be required.Footnote 31 Second, as Blair et al. (Reference Blair, Fair, Malhotra and Shapiro2013) and Blair, Lyall and Imai (Reference Blair, Lyall and Imai2013) argue, surveys by the World Bank and others should make more use of indirect questions to measure sensitive attitudes. Academic researchers have made tremendous progress recently in understanding survey measurement under difficult conditions, and more policy-relevant surveys should take advantage of that knowledge.



