Introduction
All glaciers may arbitrarily be divided into two classes: stable (normal) whose fluctuations are preconditioned mainly by climate change, and unstable. Unstable glaciers are understood to mean those whose velocity may change by an order of magnitude and more during a comparatively short period of time (from a few days to several years). As a result, ice redistribution occurs, accompanied by geometric and structural-and-tectonic changes. In some cases, such dynamic instability may lead to considerable advances of glacier termini. If this process is recurrent, viz. repeats itself sufficiently regularly then we are dealing with surging glaciers. Simulation of the behavior of unstable glaciers requires a broad geographical monitoring of glacierization areas based on remote sensing, and detailed observations of reference glaciers (Kotlyakov, 1977).
In the former Soviet Union, detailed studies of surging glaciers have been carried out since the mid-1960s in different mountain regions: western Pamirs (Medvezhiy glacier), Gissaro-Alai (Abramov), Tien Shan (Bogatyr), Caucasus (Kolka), Kamchatka (Bilchenok); recently an inventory has begun of unstable glaciers in different regions. This paper presents some results of this work in the Pamirs, which provide an idea of the scale and nature of fluctuations of unstable glaciers.
Unstable Glaciers of the Pamirs
At present, there are several published reports and schemes of the spread of the Pamirs’ surging glaciers (e.g. Rototaev, 1978; Dolgushin and Osipova, 1982; Kotlyakov, 1993). The Institute of Geography of the Russian Academy of Sciences, in association with the scientists of Uzbekistan, compiled an inventory of the Pamirs’ unstable glaciers. In all, there are more than 6500 glaciers, including the largest system of Fedchenko glacier, 650 km2 in area. The main sources of data for the inventory of unstable glaciers were the USSR Glacier Inventory published in the 1970s, large-scale topographic maps, aerial and space survey to the scale of 1:200 000 (three to twelve space surveys per feature), as well as literature sources, eyewitness reports and amateur photographs. A system of static and dynamic signs, direct and indirect, developed on the strength of direct observations over surging glaciers, was used (Akademiya Nauk SSSR, 1982).
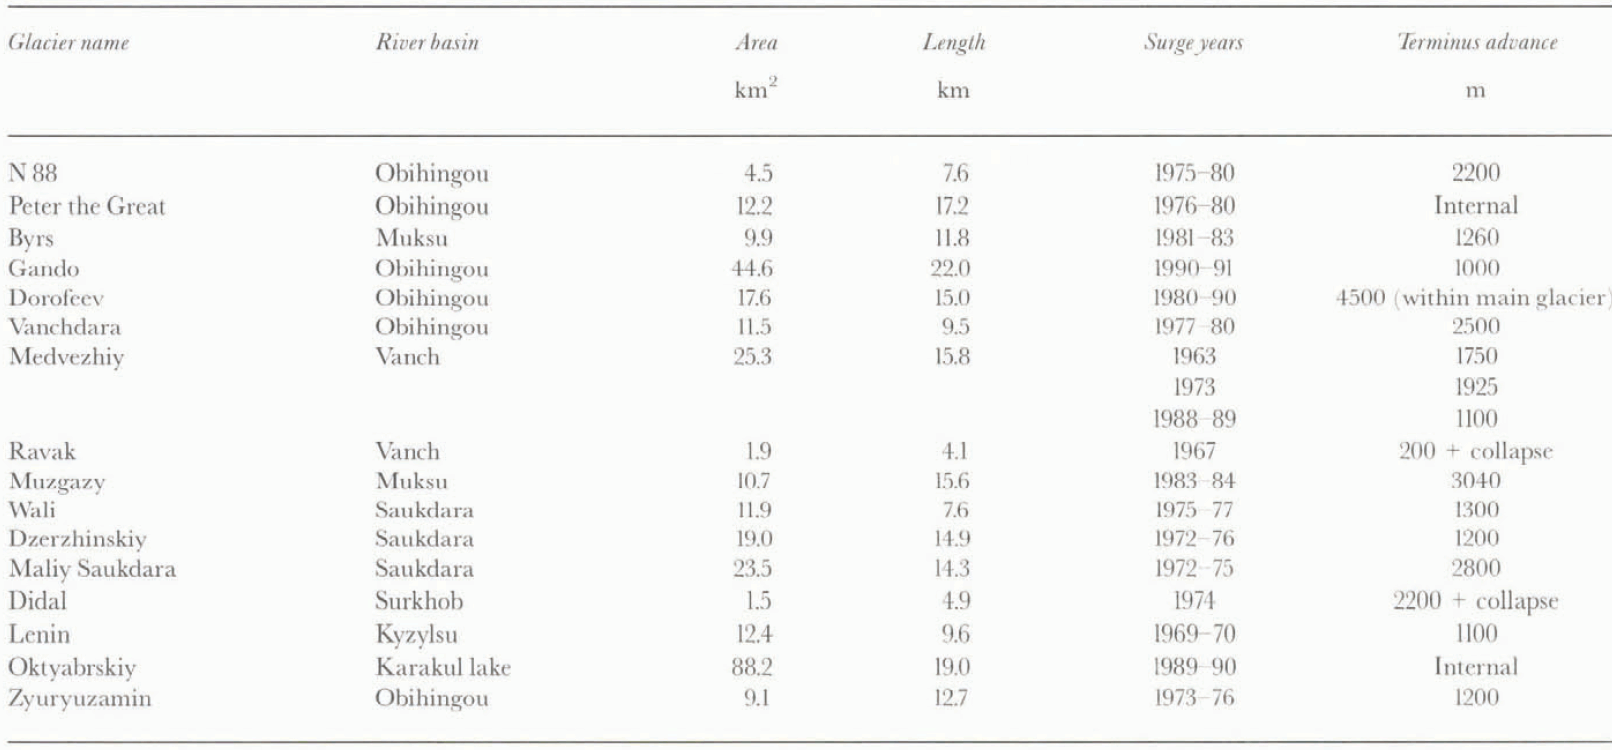
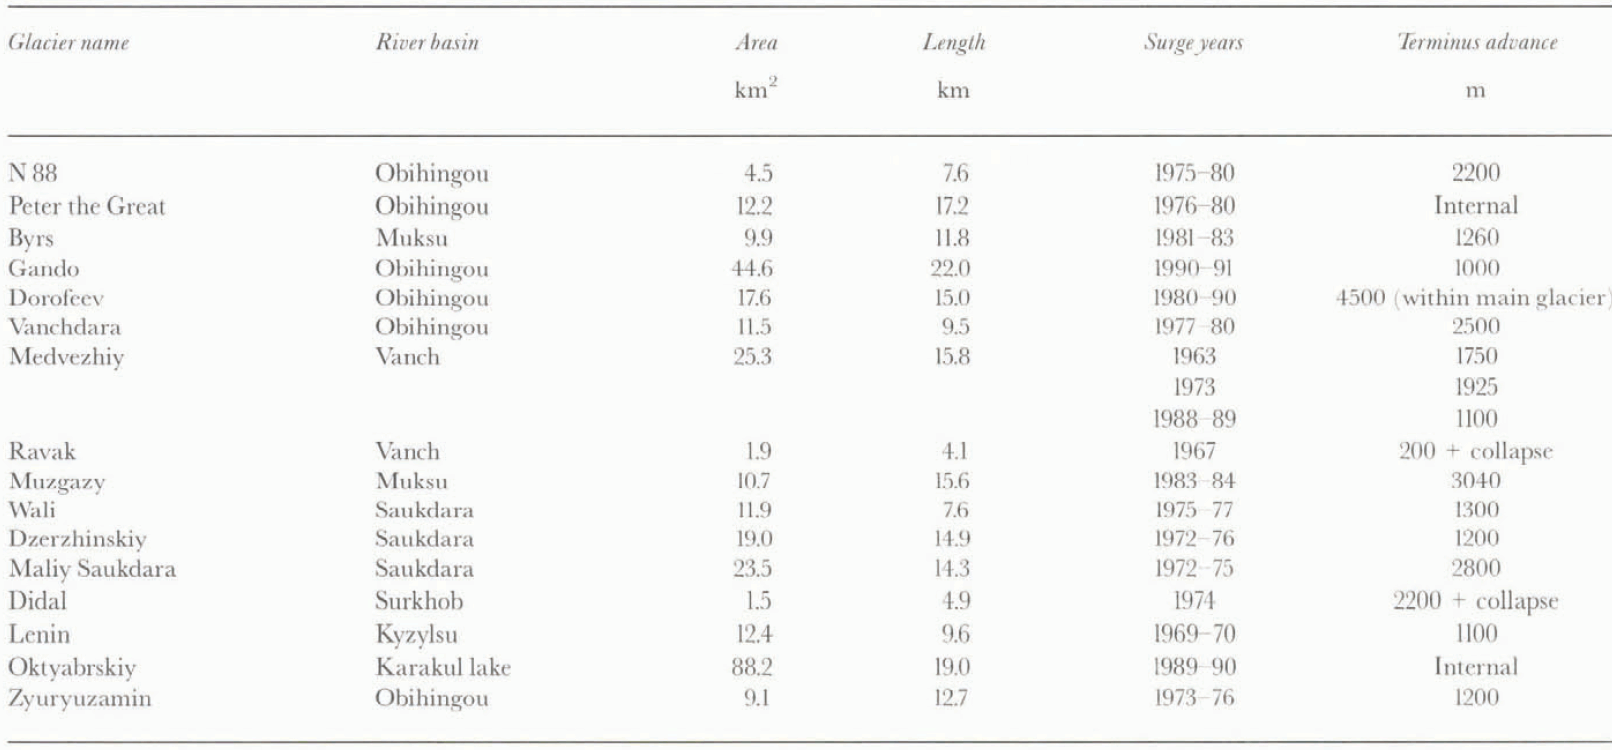
Over 600 unstable glaciers were discovered in the Pamirs, the nature of their instability being quite diverse: from severe surges with considerable advances of the termini to certain signs of instability in the past. We classified the unstable glaciers into three groups. The first group comprises surging glaciers with short-lived surges registered in between the sequential surveys. There were more than 60 such glaciers discovered in the Pamirs, the largest of them presented in Table 1.
In the second group we included glaciers with internal surges or fresh traces of recent surges, as well as glaciers with at least three indicators of recurrent activity (moraine loops, shifted front of activity, etc.), in total around 120 glaciers. The third group includes glaciers with some specific signs of current unstable dynamics or possible instability in the recent past.
In the absence of clear criteria for subdividing glaciers into surging, dynamically unstable and normal (dynamically stable), it is extremely difficult to discover surging glaciers at a stage of rehabilitation. We often had to rely on the observer’s opinion, based on his or her past research experience, while sometimes we used a method of surging-glacier image recognition (Glazyrin and Shchetinnikov, 1980).
Regularities of Fluctuations of the Pamirs’ Surging Glaciers
A general retreat of the Pamirs’ glaciers over the last century, which somewhat decelerated in the 1970s-1980s, is
Major surges of glaciers in the Pamirs
noted in the Literature (Kotlyakov, 1993; Shchetinnikov, 1993). This is confirmed by our analysis of space surveys for the period 1972–91: the central and western Pamirs exhibited an appreciable retreat of glacier termini, their tongues being covered with debris and stagnating dead ice, separation of tributaries, shrinkage of accumulation areas and other signs of degrading glacierization.
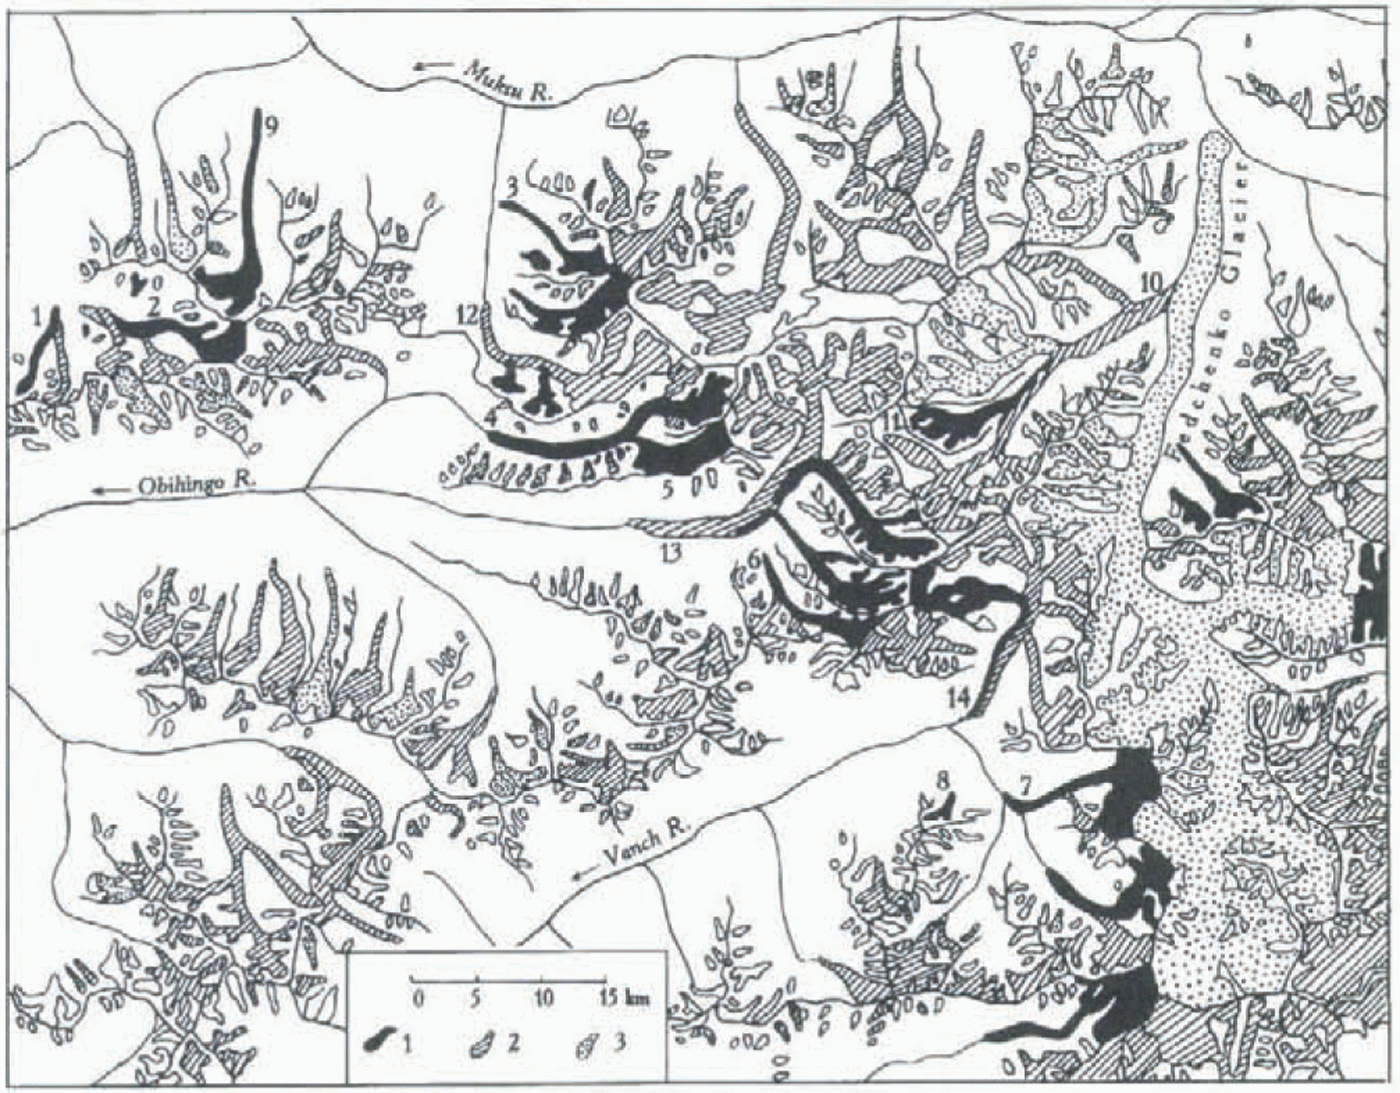
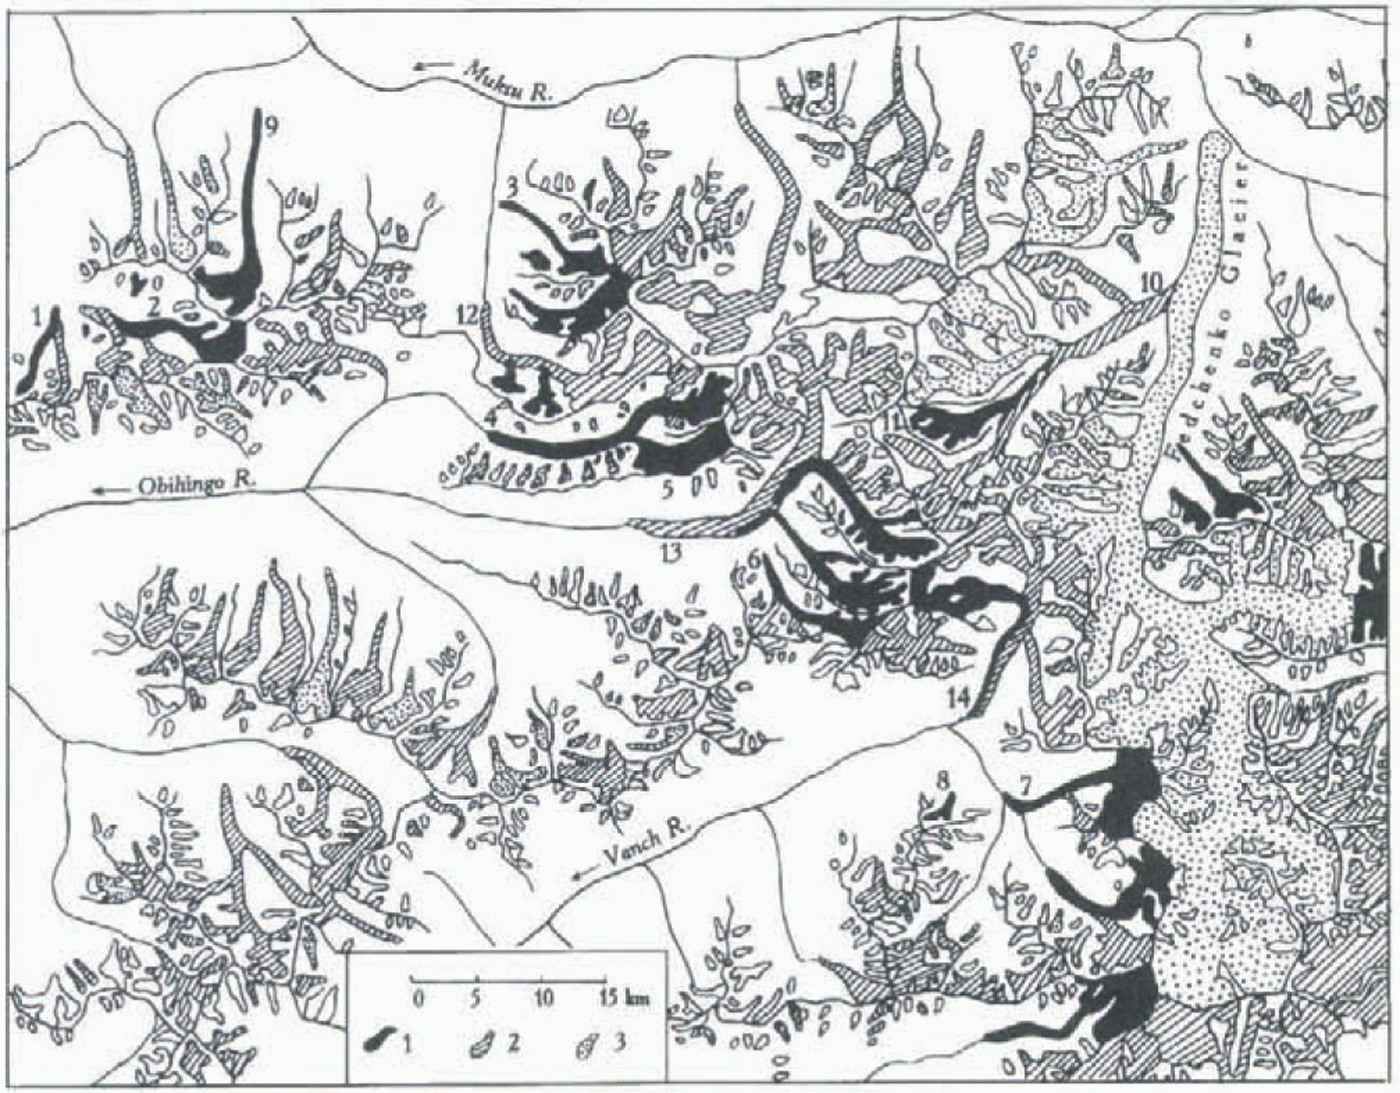
Most of the glaciers with signs of instability are concentrated in the central Pamirs (Fig. 1). In 1970–90, there occurred more than 20 severe surges, accompanied by advances of the termini (Gando, Vanchdara, N 88, Mnzgazi) and other glacier collapses (Ravak, Didal and other glaciers; see Table 1).
The central Pamirs are characterized by compound
Unstable glaciers of the central Pamirs: (1) glaciers with fixed surges: (2) glaciers with a complex of surging signs; (3) glaciers with individual signs of instability. Numbers stand for the following glaciers: 1. N 88, 2. Peter the Great, 3. Byrs, 4. Gando, 5. Dorofeev, 6. Vanchdara, 7. Meduezhiy, 8. Ravak, 9. Muzgazy, 10. Bivachniy, 11. MGU, 12. Sugran, 13. Garmo, 14. Geographical Society. For data on the surges of glaciers 1–9, see Table 1.
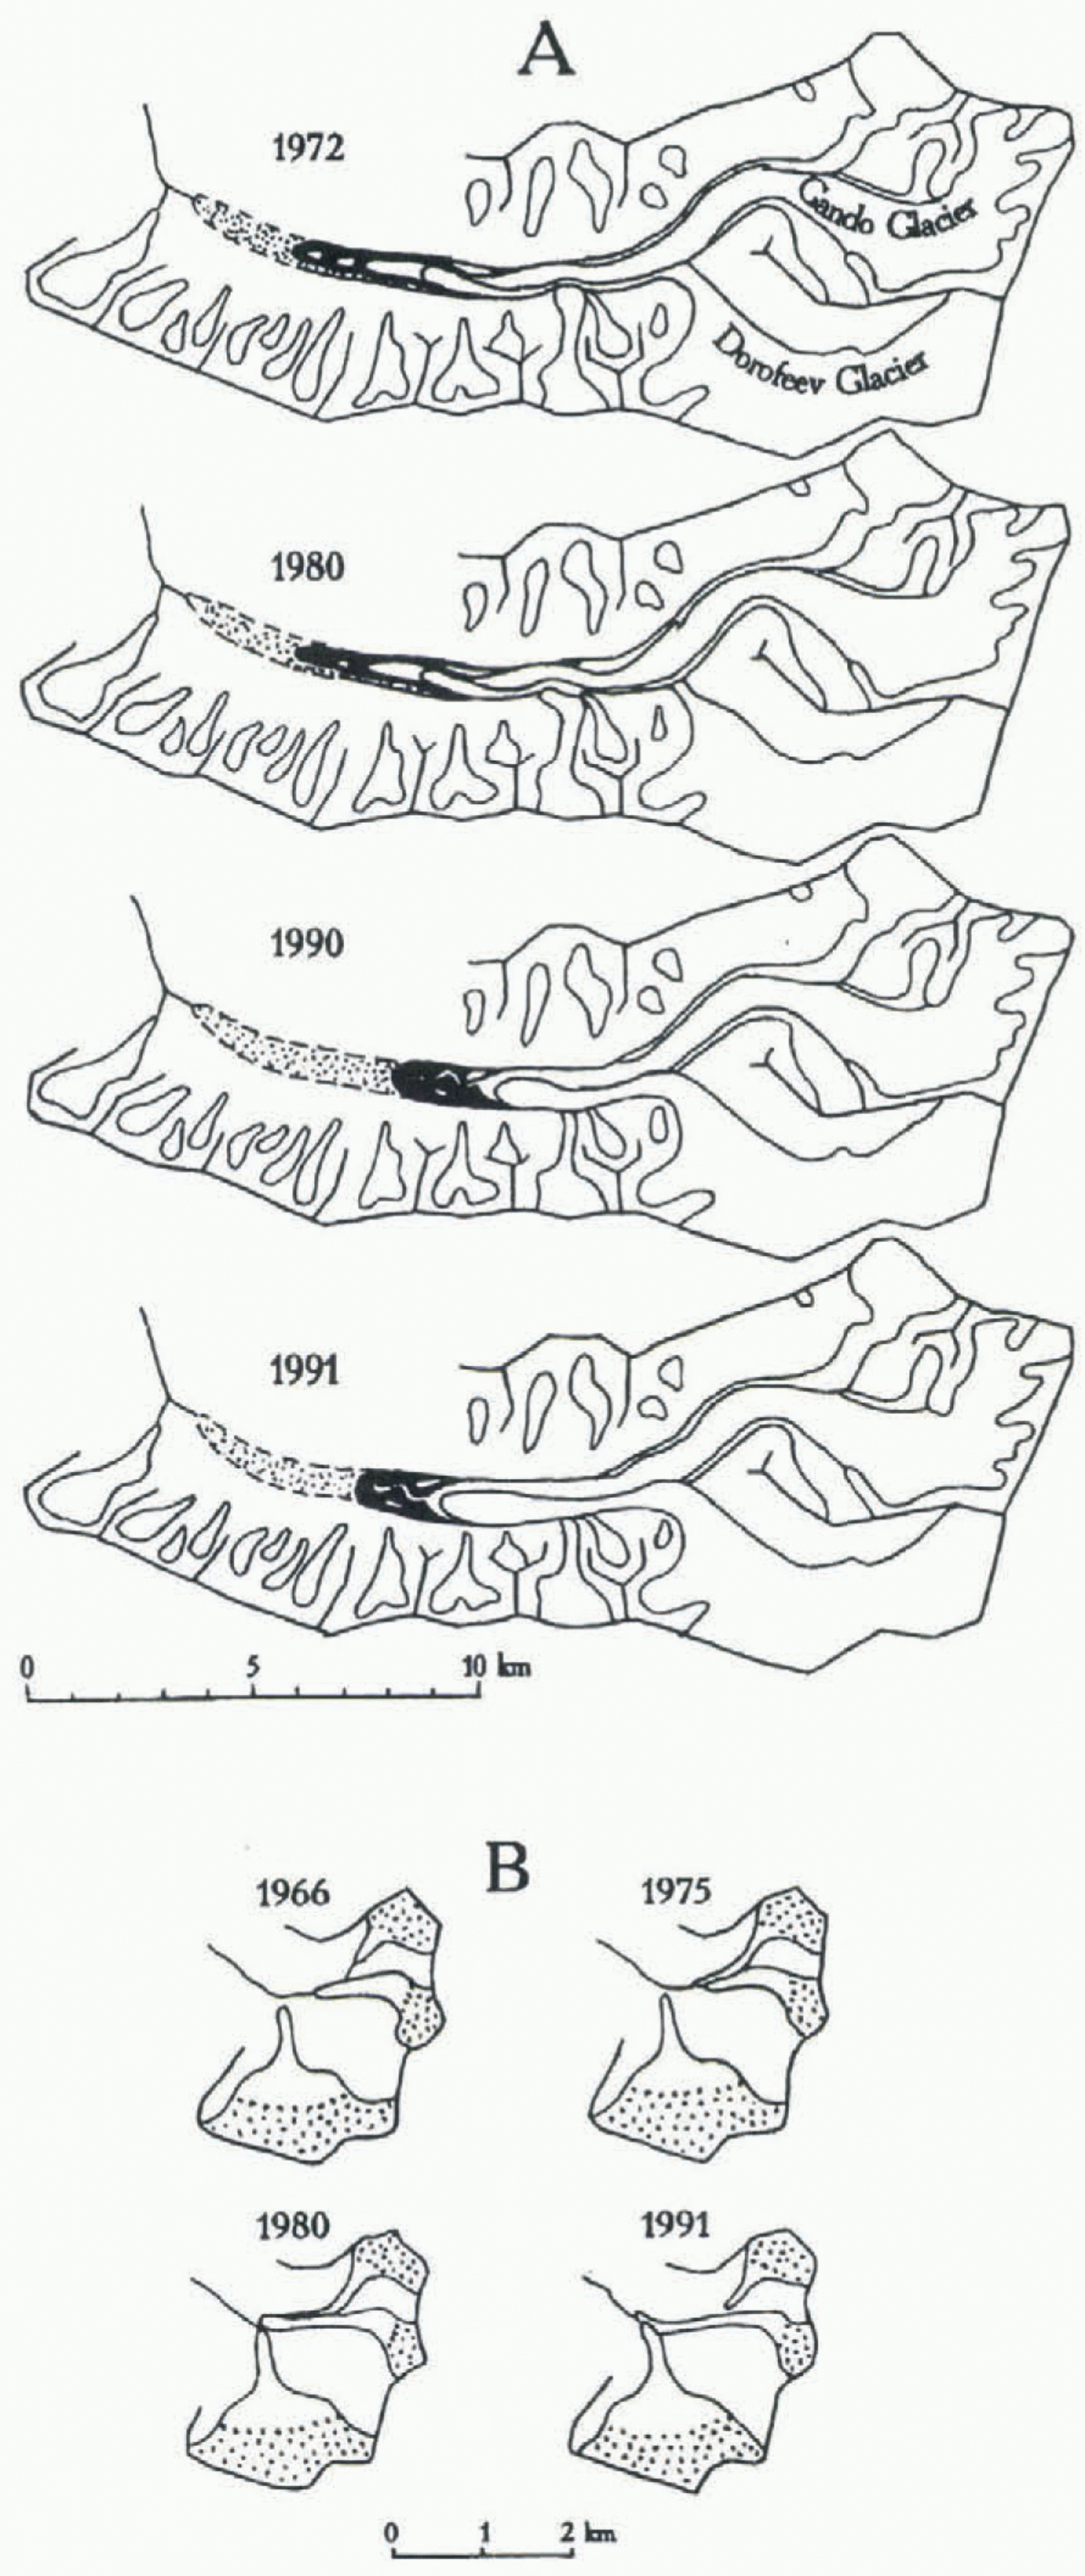
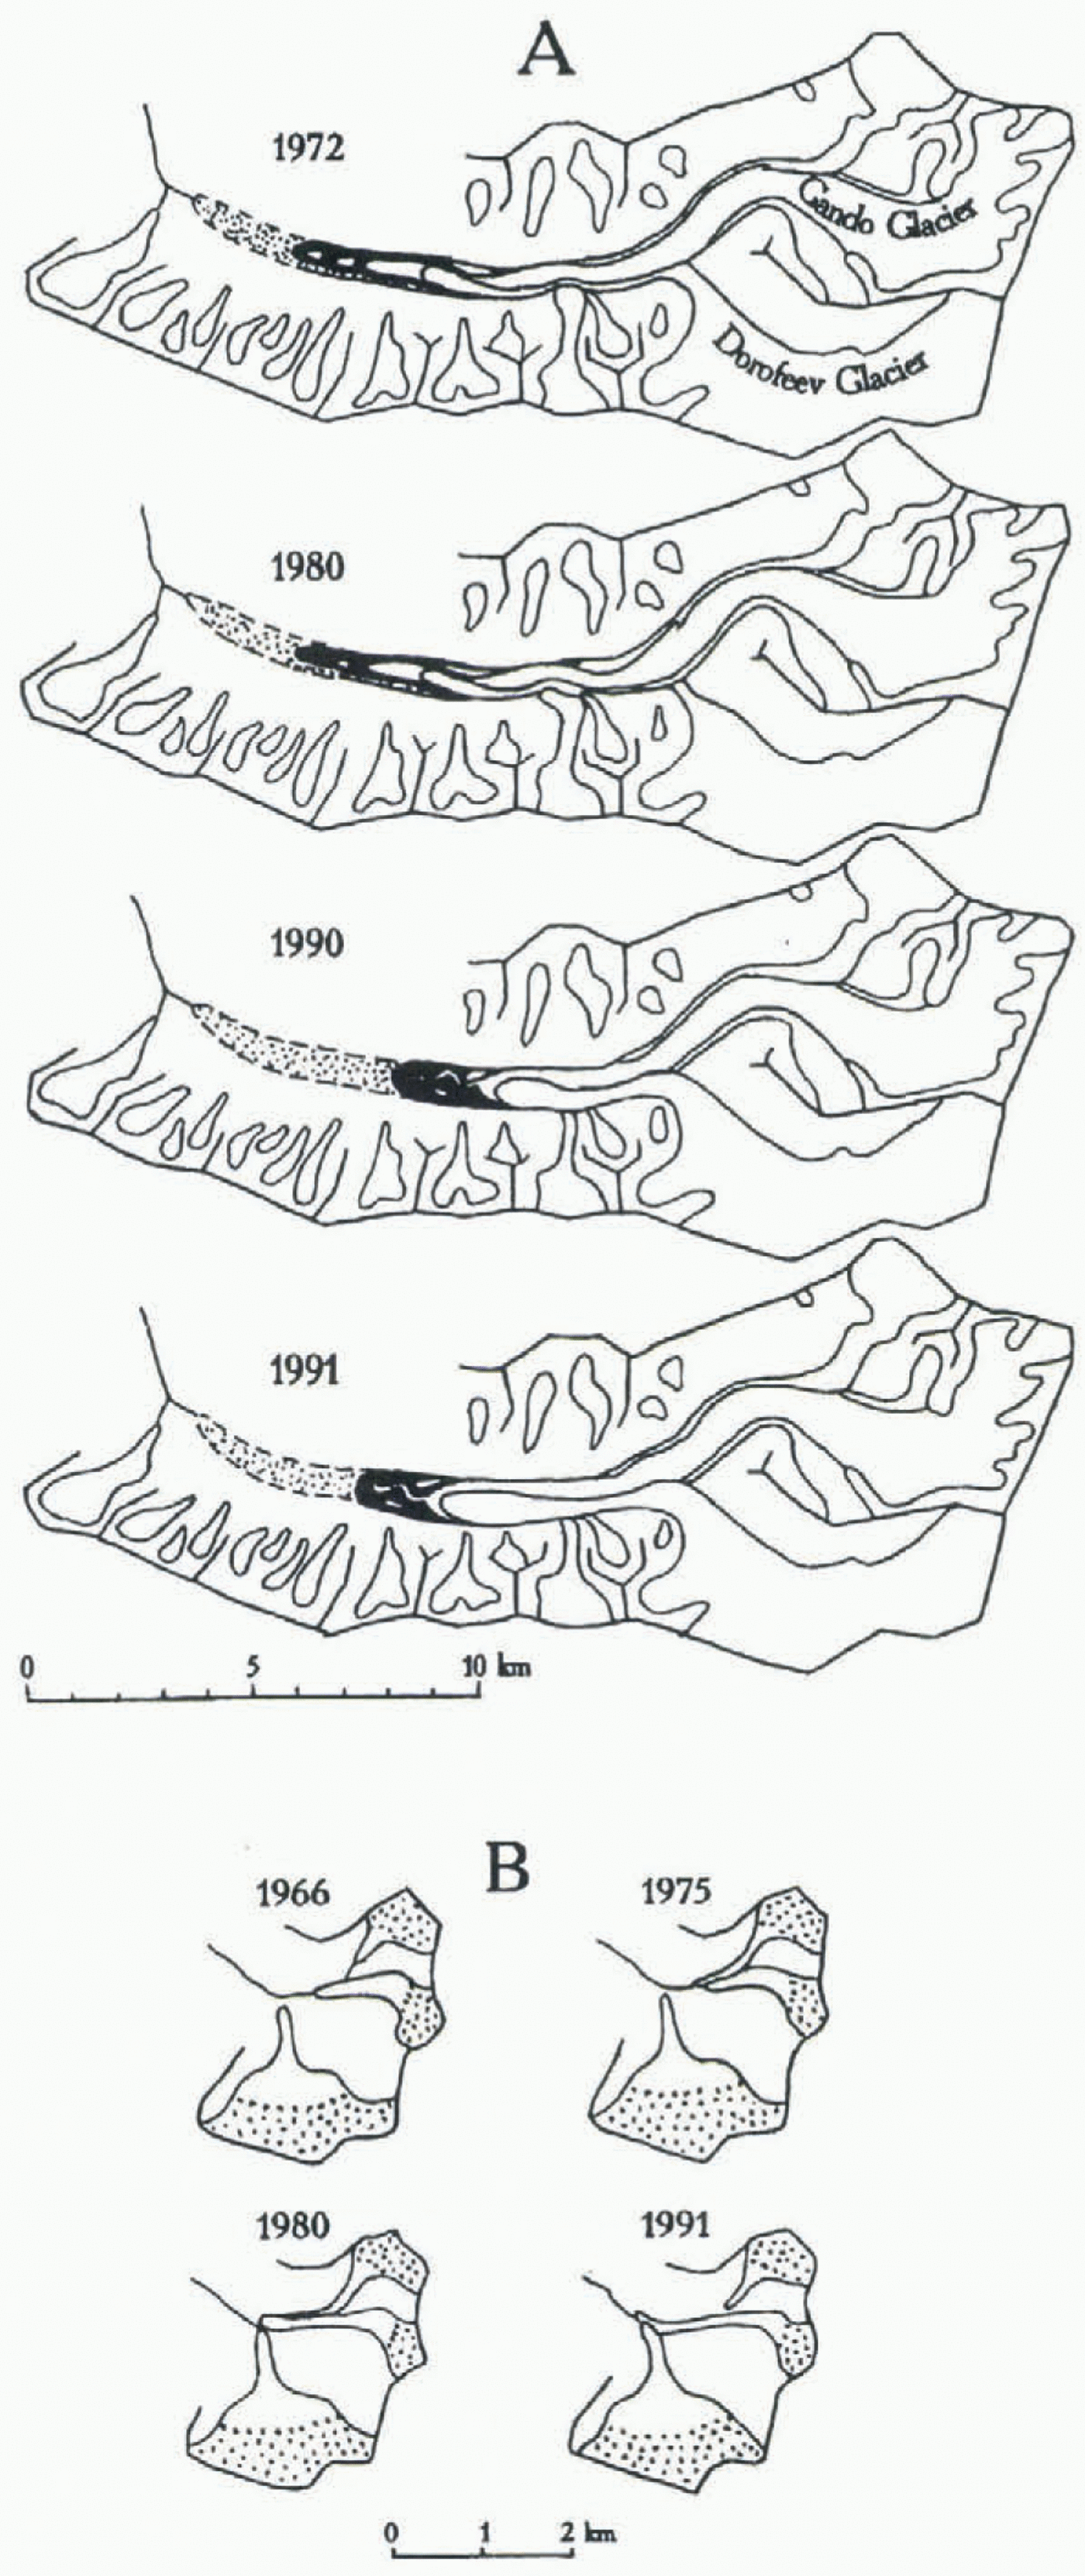
glaciers made up of numerous flows and tributaries of varying magnitude, each with its own dynamic regime. They influence one another and produce a complex picture of dynamic instability of the entire system. Gando glacier exemplifies the dynamics of such a system (Fig. 2a). A surge of Dorofeev glacier, its major left tributary, whose terminus covered 4.5 km between 1980 and 1990, triggered the advance of the common tongue by 1.0 km in 1990–91 even though the surge was not yet over at the time. However, during a period of glacier degradation the surges of many compound glaciers tend to become internal: the surges of glacier component parts or tributaries occur within the glacier and do not result in an advance of the main tongue (e.g. MGU glacier tributary of Bivachniy glacier; sec Antonova and others. 1977). The surges of two tributaries of Sugran glacier and of Shokalskiy glacier, a major left tributary of Garmo glacier. are of a similar nature.
A similar manifestation of the instability of the compound glacier system during a period of degrading glacierization is the surges of glaciers that used to make up a single dynamic system but are currently isolated from one another. At the surge stage such glaciers may again interact dynamically, forming a compound system. An example of the dynamics of such a system of surging glaciers at the southern slope of the Zaalayskiy range is given in figure 2b.
Detailed Studies of Surging Glaciers
To understand complex dynamics, studies of the peculiarities of surging glaciers’ behavior in different periods of their evolution must be carried out. The primary parameters characterizing the fluctuations of surging glaciers are surface relief and velocity of ice movement, determined in space and time. The monitoring of these parameters proceeds from the fact that the life cycle of a surging glacier (an analogue of a balance year of “normal” glaciers) comprises two fundamentally different stages: (1) the restoration of glacier dynamic integrity, and (2) the surge, or relaxation of the stresses (Dolgushin and Osipova, 1982).
The inaccessible glacier surface for ground operations,
Examples of fluctuations of glacier compound dynamic systems: (a) scheme of Gando glacier dynamics, 1972–91; (b) interaction of three surging glaciers, southern slope of Zaalayskiy range.
the great extent and specific features of an unstable glacier’s regime necessitates a particular combination of ground and remote-sensing types of monitoring. Experience shows that of all possible methods of monitoring unstable glaciers, aerotopographic methods are optimal (Osipova and Tsvetkov, 1991).
Let us trace the nature of glacier changes in the course of every major stage, taking for example Medvezhiy glacier in the Pamirs, where observations started in 1963.
1 Build-up stage
The characteristic feature of this stage is the accumulation of ice mass in the more active part of the glacier because accumulation here at this stage is greater than ablation. Such growth is accompanied by a rise of the surface and by the front of growing activity moving down the glacier.
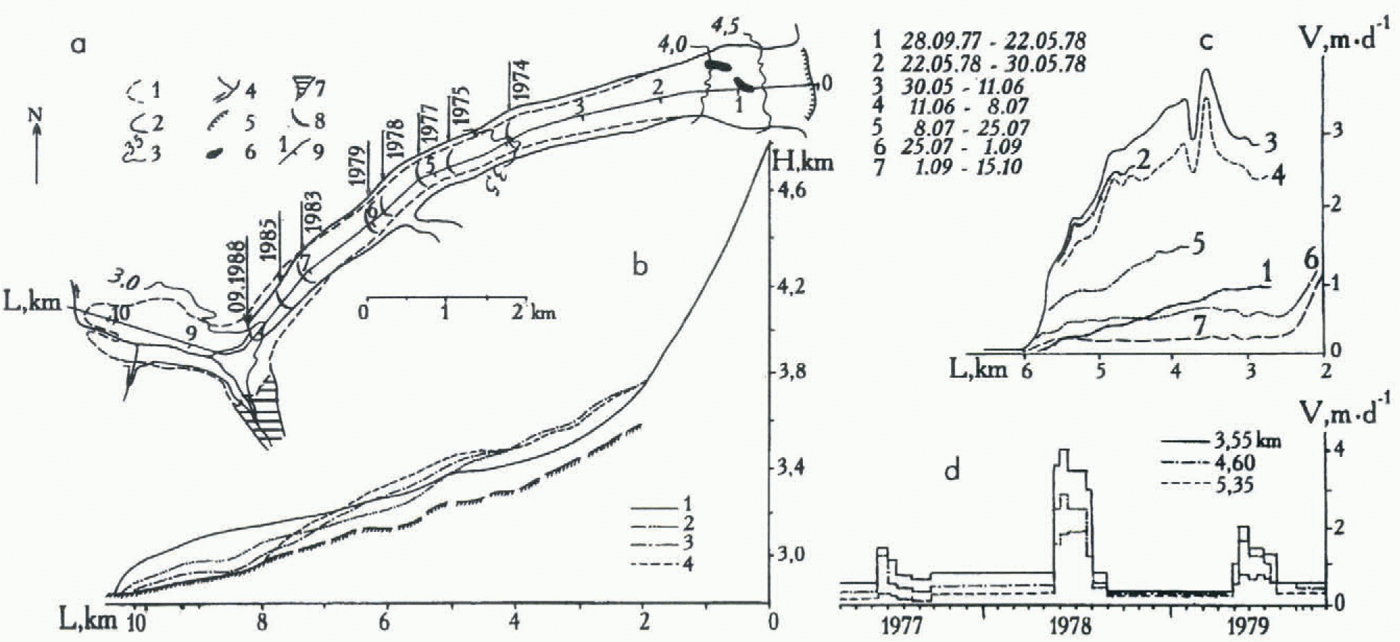
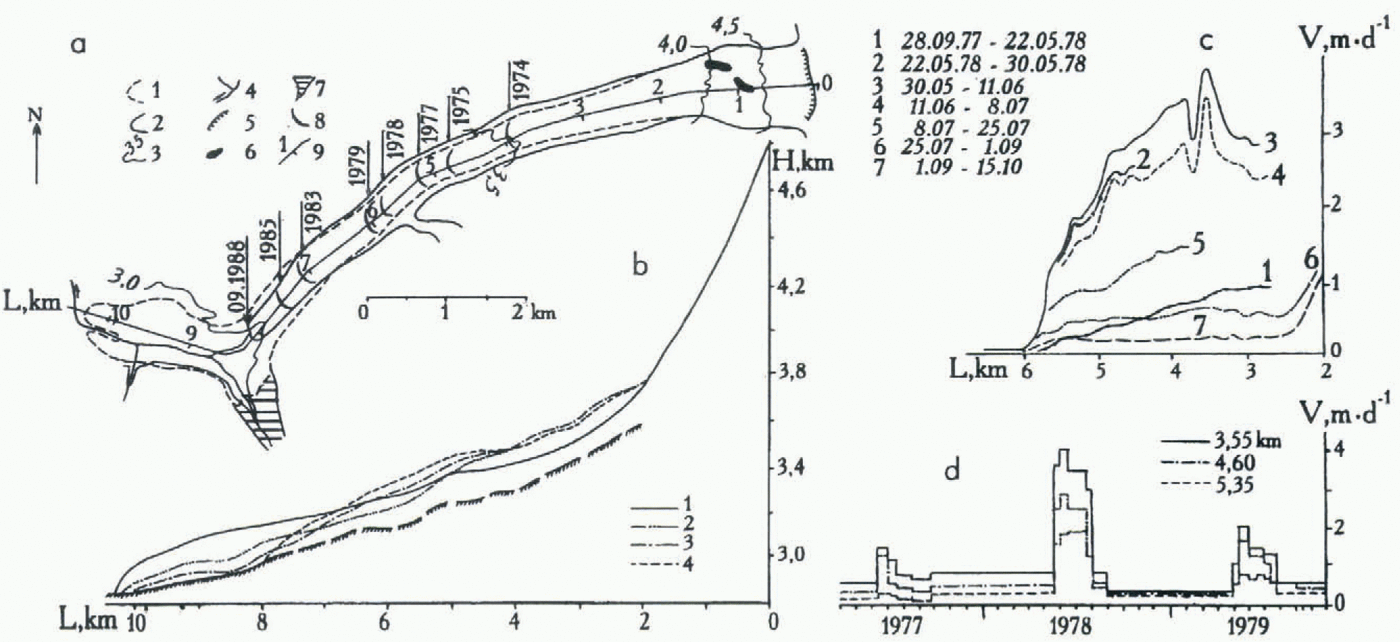
The location of the front of activity (Fig. 3a) is determined by changes in surface altitude (Fig. 3b) or in the velocity of ice movement (Fig. 3c), as well as by a special tectonic structure of the glacier surface.
The activity of Medvezhiy glacier grows spasmodically as a result of so-called microsurges (Tsvetkov and Sorotokin, 1981; Dolgushin and Osipova, 1982). In this case, the velocity of ice movement may change by an order of magnitude in the course of a year. Thus, at L = 3–4 km in 1978 the velocity was equal to 0.2 m d−1 in winter and 4 m d−1 in spring (Fig. 3c). As a rule, the annual increase in velocity in spring or early summer (Fig. 3d), associated with the penetration of meltwater inside and onto the glacier bed, spreads immediately throughout the area of glacier-growing activity. The downward displacement of the front of activity varies from year to year, in our case the velocity generally falling from 800 m year−1 at the beginning of the build-upstage to 150–200 m year−1 at the end.
2 Surge
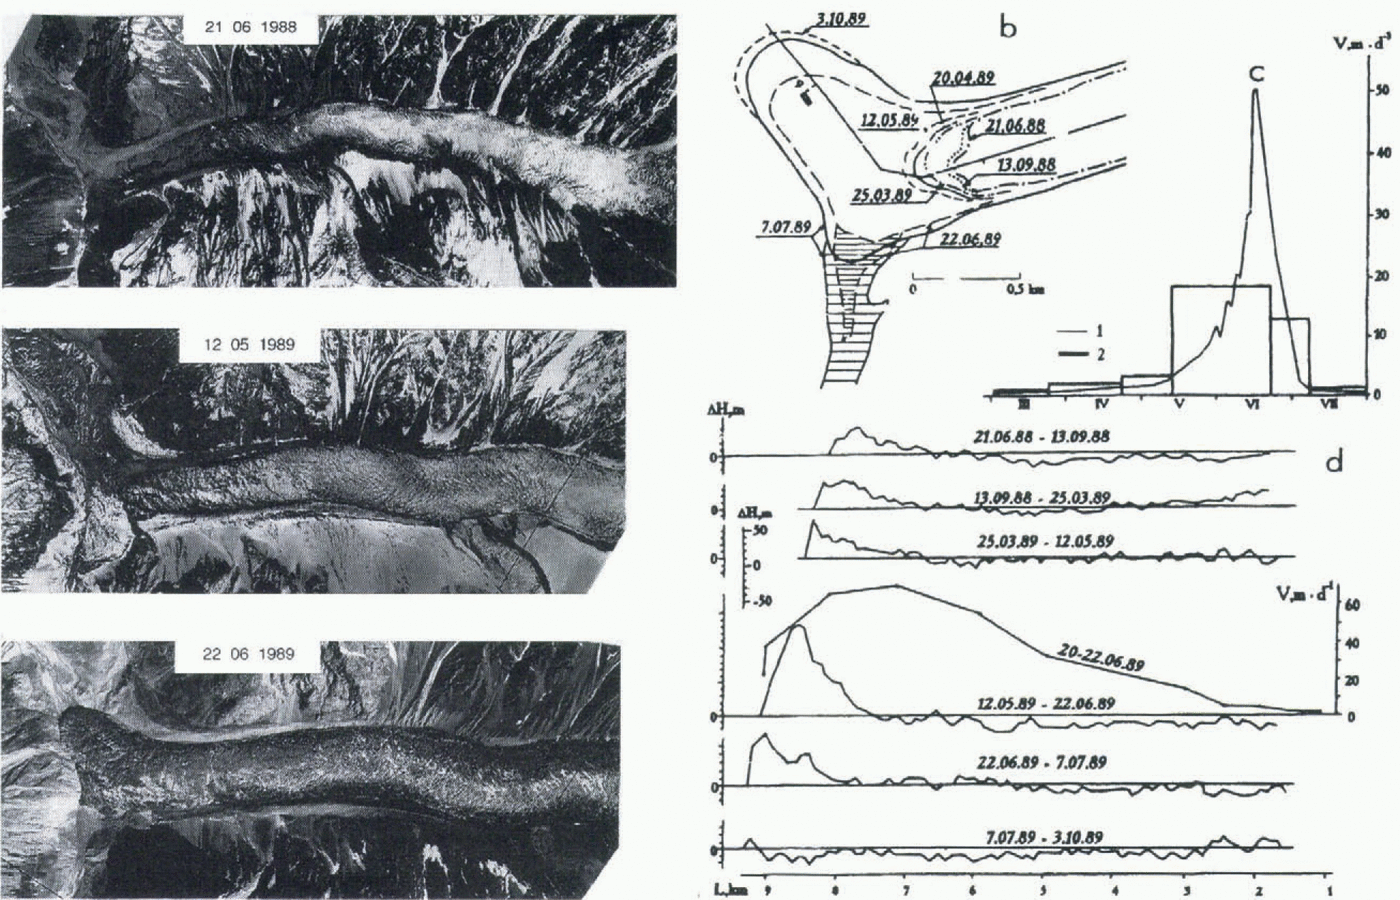
At present, the most complete surge data are available for two glaciers: Variegated Glacier, Alaska (the surge of 1982–83), and Medvezhiy glacier in the Pamirs (the surge of 1988–89). Unlike the data for the Variegated Glacier surge, which were obtained basically on land (Kamb and others, 1985), data for Medvezhiy glacier were obtained by an aerotopographic monitoring (Osipova and Tsvetkov, 1991). From the beginning of the surge in June 1988 until October 1989 when the surge came to a complete halt, eight special aerial photography missions were accomplished at a scale from 1:50 000 to 1:25 000, the data on which are given in Garelik and others (1994).
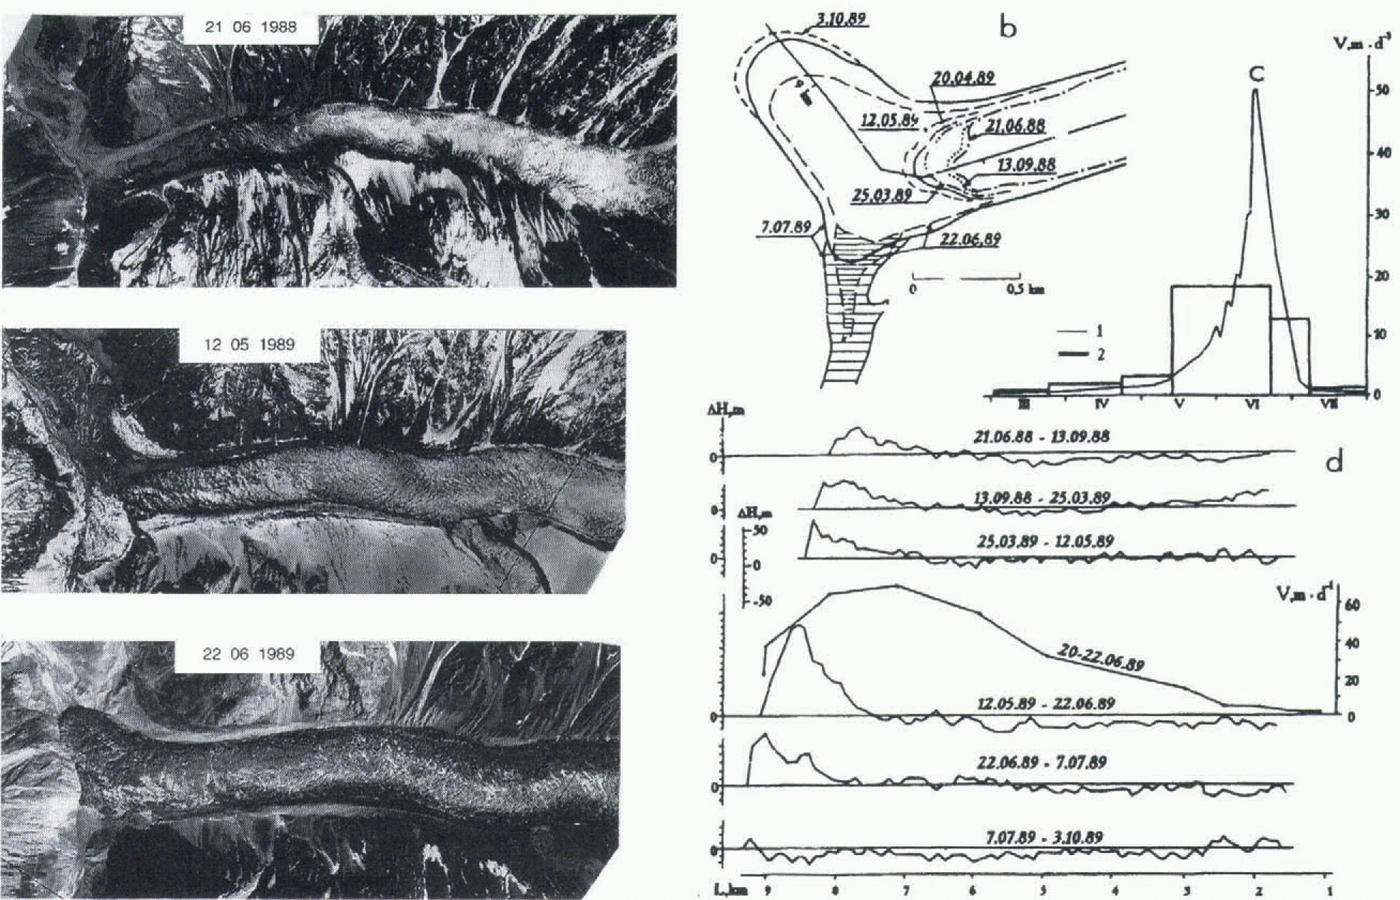
As a result, diverse information is obtained on surface dynamics throughout the Medvezhiy glacier surge (Fig. 4). It is established from a comparison of the results of the first two aerial photography surveys (June and September 1988) that a morphologically pronounced glacier terminus (lower boundary of the degradation zone, L = 8.1 km) shifted by 15–20 m, i.e. glacier movement, has begun down the valley, virtually free of residual ice. One kilometer upstream of the glacier (L = 7 km), the system of active waves can be clearly interpreted in both aerial photographs (see photograph dated 21 June 1989, Fig. 4a). As a result of the surge, the terminus of the glacier moved by 1.1 km, and the system of waves by 1.8 km. The former dead ice section whose length in June 1988 was I km was shifted forward and squeezed longitudinally to 350 m by the end of the surge in the autumn of 1989.
The maximum surge velocity occurred in June 1989. At that time, the glacier terminus moved with a velocity of up to 50 m d−1 (Fig. 4c), while the maximum velocity (up to 70 m d−1) was 1 km upstream (Fig. 4d).
The kinematics of the glacier surge can be clearly seen in the graphs of surface elevation variability (Fig. 4d). The growing intensity of vertical stretch (ice building) throughout the surge was observed in the lower l-2 km of the glacier; the upper 5–6 km zone, being subject to recurrent vertical fluctuations of surface elevation, ultimately dropped by 50–m.
Analysis of the results of aerotopographic monitoring and continuous ground observations of the advance of the glacier terminus showed that the entire surge stage may be
Medvezhiy glacier during the build-up stage, 1974–88. (a) Advance of front of growing activity: 1. glacier boundary after termination of 1973 surge; 2. glacier boundary in 1988 (before next surge); 3. isohypses in 1988 (km); 4. river; 5. upper edge of icefall; 6. nunatak; 7. dammed lake in 1973; 8. front of growing activity on particular dates; 9. longitudinal axis of glacier, including the distance L in km from arbitrary “O”. (b) Elevation of glacier surface H along longitudinal axis in particular years, (c) Intraseasonal fluctuations of ice velocity V in 1977 / 78 balance year during different time intervals. (d) Fluctuations of ice velocity V in time at three points of longitudinal axis with different coordinates L.
Medvezhiy glacier during the surge of 1988–89. (a) Fragments of three aerial photographic images of the surging part of the glacier taken at different times (scales of original aerial photographs 1:50 000 on 21 June 1988; 1:30 000 on 12 May 1989: 1:25000 on 22 June 1989). (b) Glacier and lake boundaries on different dates of aerial photography, (c) Velocity of glacier terminus advance: 1. according to the data of ground observations by “Tajikgidromel” service with 2–3 d intervals; 2. according to the data of aerophototopographic monitoring. (d) Variability of surface elevation (∆H) along glacier longitudinal axis in between sequential aerial photography surveys.
divided into three periods: beginning of the surge, June 1988–May 1989; active period, 25 May–7 July 1989 with a peak on 25 June; and termination of the surge, 7 July–early October 1989.
3 GIS “Medvezhiy glacier”
Extensive information on observations of Medvezhiy glacier has called for a computer database, portraying virtually
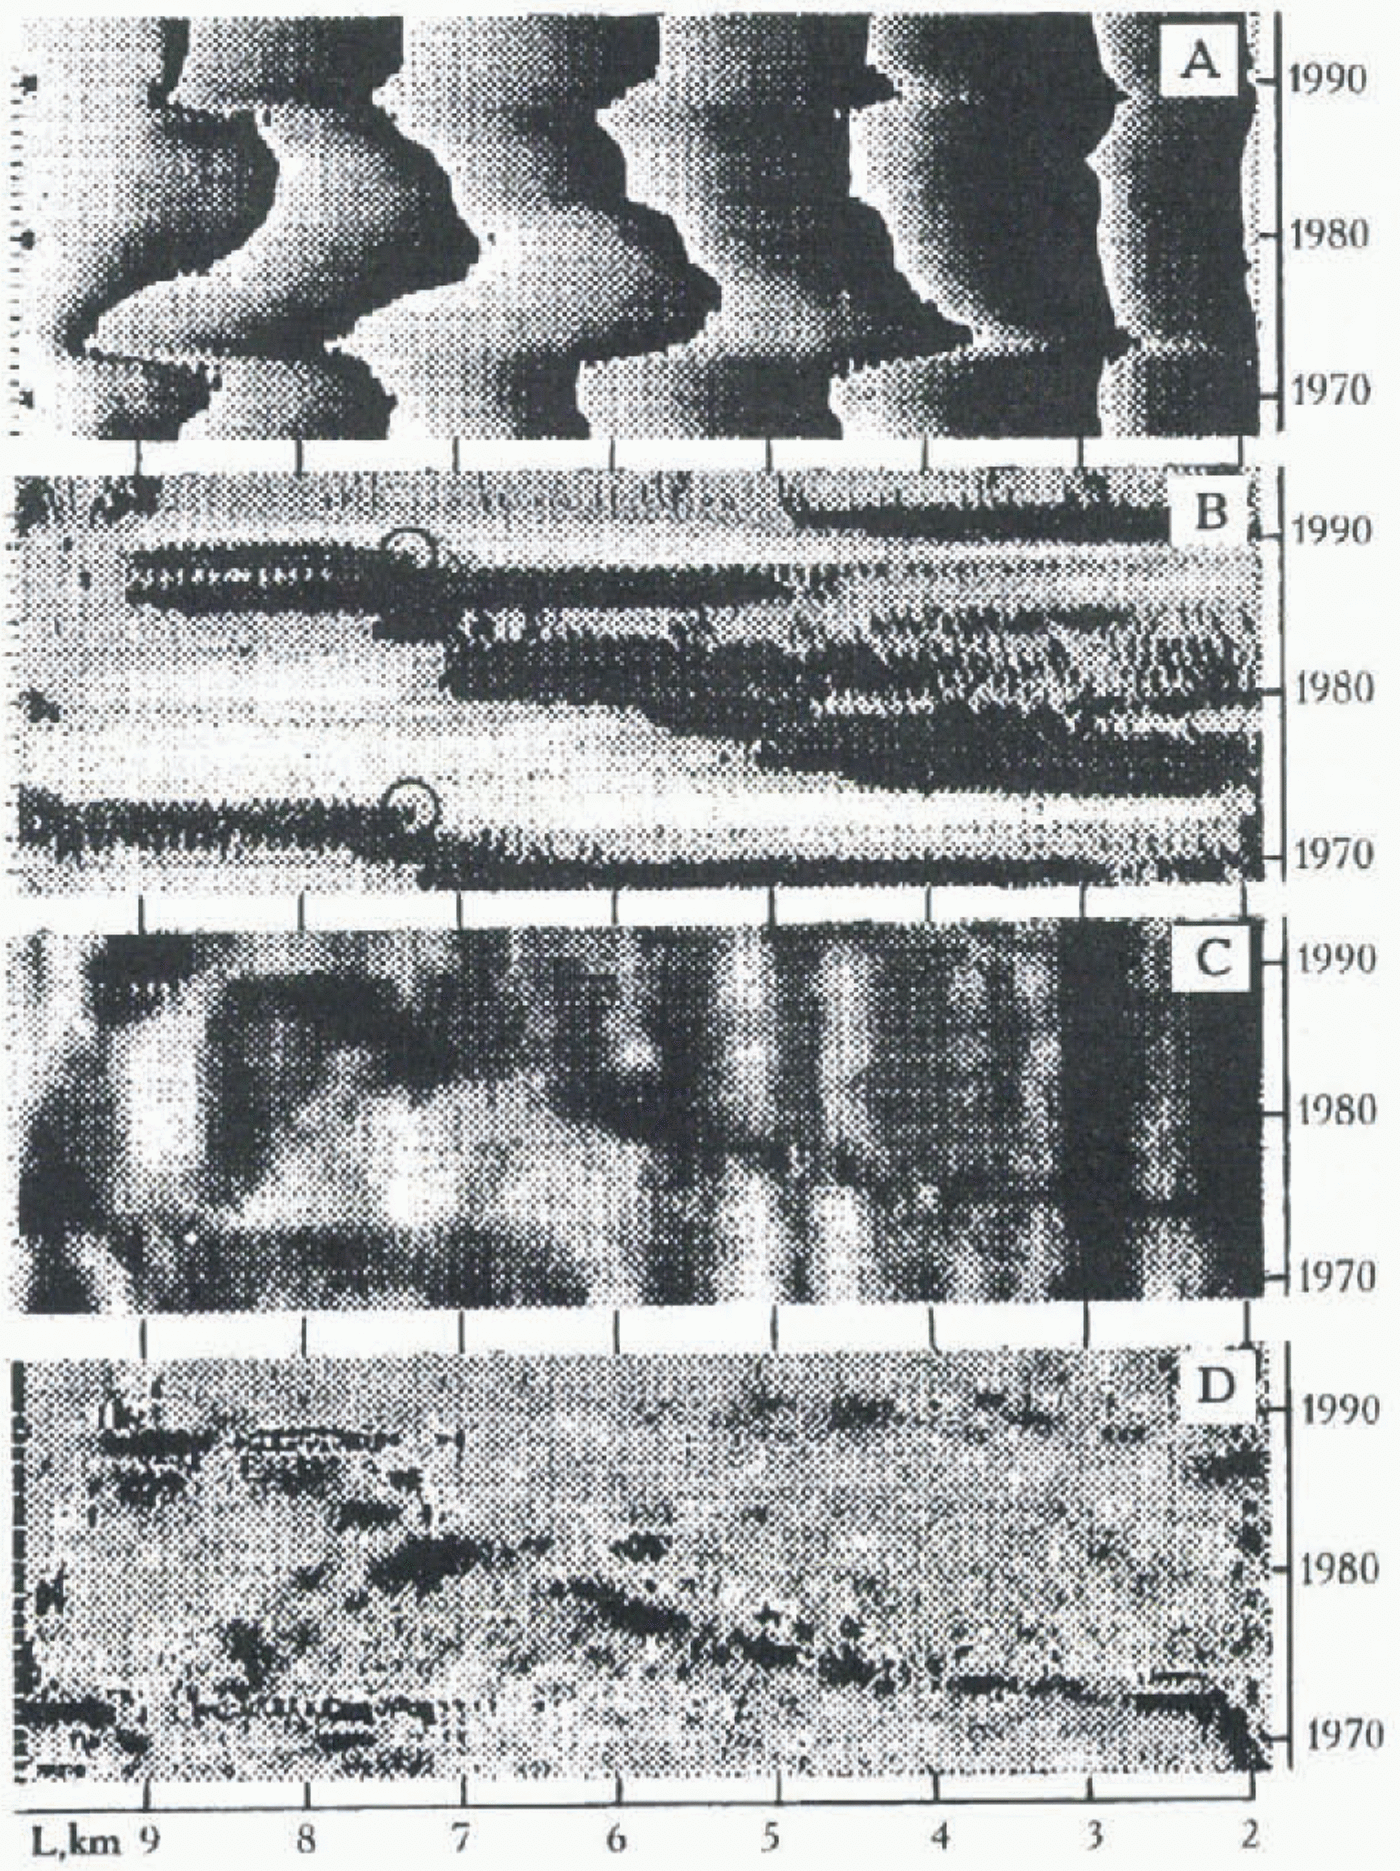
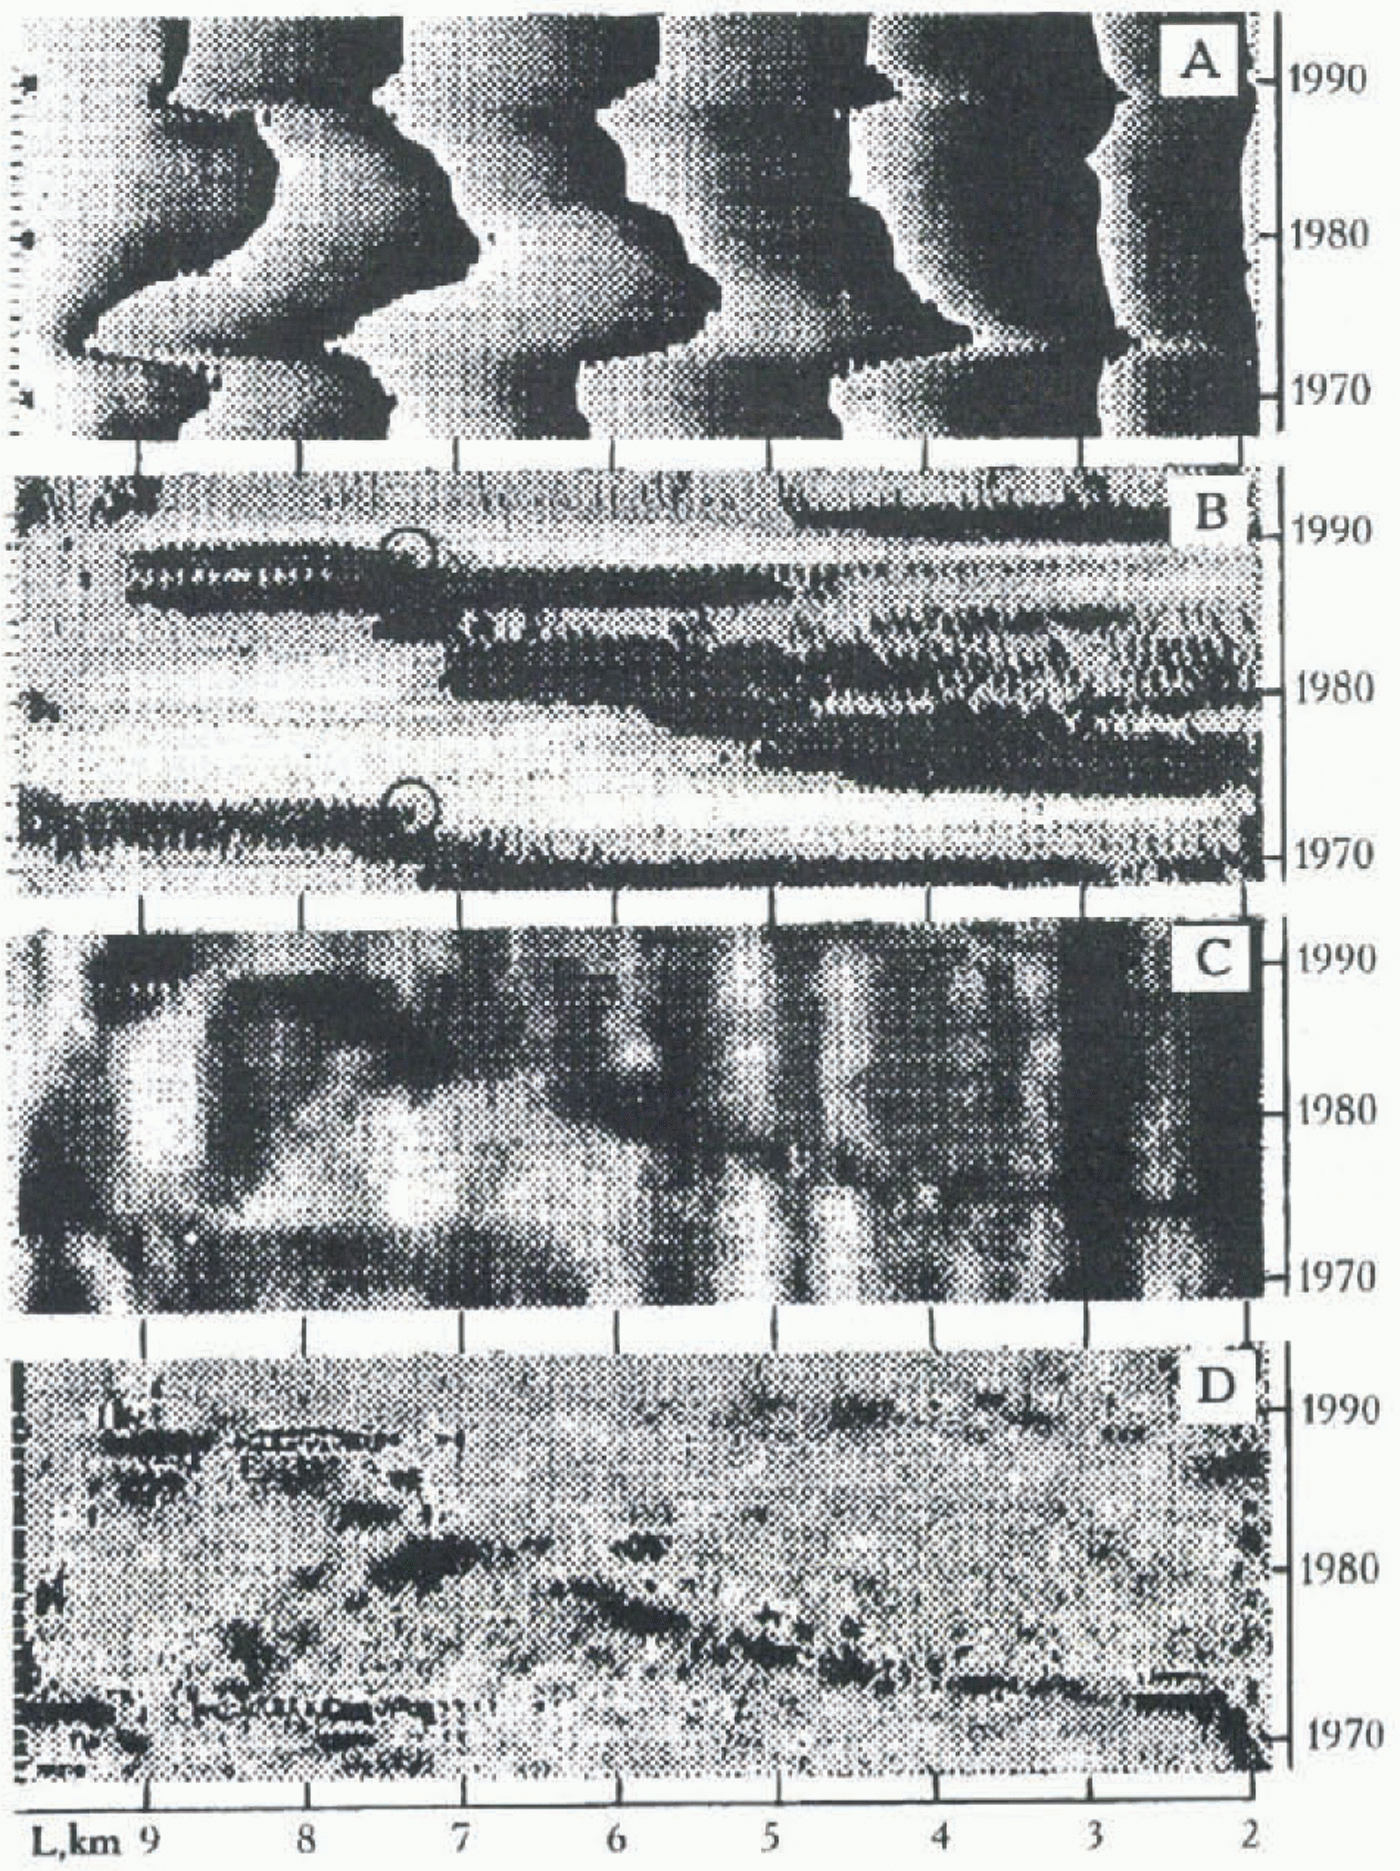
Medvezhiy glacier. Example of computer data analyses: (a) surface elevation; (b) variation of surface elevation, d h; (c) surface slope; (d) surface slope variations. Black-and-white impressions of coloured originals from computer processing, where each coloured element corresponds to a digital quantitative characteristic are presented here. Details in the text.
annual dynamics of its surface from 1967 to 1991 (Garelik and others, 1994). On the strength of this base, a procedure was developed for plotting and analyzing the space-and-time fields of various parameters of the glacier: changes of the surface height, velocity of ice movement, variability of these parameters, surface slopes as well as more complicated functions.
Computer processing of the data made it possible to further specify the role of microsurges in the process of growing glacier activity at the build-up stage. The intensity and time of microsurges are determined by the passage of the front of growing glacier activity through bed riegels, of which there are at least four in the surging section of Medvezhiy glacier.
To illustrate one of the types of computer analysis, we present here a series of space–temporal fields that characterize the dynamics of the glacier surface in 1968–91 (Fig. 5). The initial data for plotting such fields are longitudinal profiles of different characteristics such as surface altitude, inclination of surface, etc. (horizontal axis on diagrams), which have been received on a particular measuring date (vertical axis). Boundaries between transverse black-and-white strips in figure 5a correspond to the absolute height of the surface: 3000 m at L = 9 km (near the glacier front), 3150 m, etc., to 3750 m at L = 2 km (below the icefall). Sharp bends of these strips mark the surges of 1973 and 1988–89. figure 5a is a source of the material for its derivatives.
figure 5b, c and d gives only a qualitative idea: in figure 5b, black colour corresponds to the positive variations of the surface elevation in the zone of activation and on the advancing glacier’s tongue; grey and white colours mark near-zero and very negative ∆H in the zone of degradation, respectively. Zero-change areas (circled in figure 5b) during both surges are shown in the figure at the same disposition, at L = 7.2–7.3 km, i.e. after the surges of 1973 and 1989 the boundary between the evacuation and outflow zones has occupied the same position. At this point, the lower downstream bed riegel is located. Circled points in figure 5b indicate the beginning of the last microsurge overgrowing into a surge of the entire glacier.
In figure 5c and d the displacement of black sections along the horizontal axis with time corresponds to an increase of the surface slope and the surface slope variations in connection with glacier surface changes during the surges and in the build-up stages.
Conclusion
Extensive geographical studies of fluctuations of the Pamirs’ unstable glaciers and classification of such glaciers became possible early in the 1970s, thanks to large-scale space photography. As a result of these studies, a widespread survey of glaciers in the Pamirs and the great diversity of the types of instability were established. We regard nearly 10% of all glaciers in the region as unstable; surges of the termini of 60 glaciers were observed. Such glaciers for the most part are in the central and western Pamirs; the east and south are dominated by glaciers with signs of instability in the past.
Virtually all compound glaciers (glacier systems) have unstable components: both the trunk and tributaries, existing or separated recently. A study of the character of instability calls for detailed observations on reference glaciers. Our research proved that aerotopographic monitoring is of great value, especially for the study of surging glaciers at a stage of surges.
Analysis of the results of annual observations of Medvezhiy glacier in 1963–91, which included two build-up stages and three surges, showed that the character of the process of glacier fluctuations is quite regular. Only the duration of the stages and the scale of changes are different. Computer analysis of the data confirmed the significant role of bed riegels and related microsurges for the surge process.
We studied many specific features of fluctuations of the Pamirs’ unstable glaciers during the period of general deglaciation in central Asia in 1970–90. It is possible that, given more favorable climatic conditions for glacier growth, the nature and scales of the fluctuations of such glaciers will be different. In any case, the specificity of fluctuations of unstable glaciers requires special monitoring programs on both a national and a worldwide scale.
Acknowledgements
The authors feel it is their duty to express appreciation to the International Science Fund whose support (grant N 4Z 000) made it possible to accomplish part of these studies.
We deeply regret the untimely and sudden death of our friend and colleague Dr Isaiah Garelik: at his initiative and under his guidance CIS “Medvezhiy glacier” was set up at the Institute of Geography of the Russian Academy of Sciences, and the first studies on computer data analysis were implemented.