INTRODUCTION
A conspicuous component of the marine turtle epibiotic community is the coronulid barnacle of the genus Chelonibia. Twenty-nine nominal species of ‘turtle barnacles’ are currently recognized (Epibiont Research Cooperative, 2007). These represent two balanomorph families: the Chelonibiidae (acorn barnacles) and the Platylepadidae (gooseneck barnacles). Studies of hawksbill sea turtle (Eretmochelys imbricata) epibiota revealed that two common obligate commensal barnacle species attached to the carapace are Chelonibia caretta and C. testudinaria with the former being the most common (Frick et al., Reference Frick, Mason, Williams, Andrews and Gerstung2003; Schärer, Reference Schärer2003).
Although the life history of C. caretta remains unknown in terms of dispersal potential, the complete life cycle of the congeneric C. testudinaria has been described by Zardus & Hadfield (Reference Zardus and Hadfield2004), who documented that development from the first naupliar stage to the cyprid stage occurs in nine days. In laboratory assays, barnacle settlement occurred one or two days after completing development, however, it remains unknown how long C. testudinaria can remain in the cyprid stage in nature. Other barnacle species settle within two to six weeks (Lucus et al., Reference Lucus, Walker, Holland and Crisp1979; Shanks, Reference Shanks1986; Pineda et al., Reference Pineda, DiBacco and Starczak2005).
One of the largest nesting locations for hawksbills in the Caribbean Sea is Mona Island, Puerto Rico (Beggs et al., Reference Beggs, Horrocks and Krueger2007; van Dam & Diez, personal communication). Tagged adult hawksbill turtles from Mona Island, are capable of travelling to foraging habitats as geographically distant as Central America and the British Virgin Islands (van Dam et al., Reference van Dam, Diez, Balazs, Colón Colón, McMillan and Schroeder2008). Unlike barnacles on fixed substrates, turtle barnacles are attached on a mobile substrate and are capable of dispersing both as larvae and as adults. Higher rates of dispersal should prevent significant population subdivision as populations cease diverging due to drift or local adaptation. We have evaluated this hypothesis by analysing the genetic variation at the mitochondrial genes COI/16S (914 bp) from 34/27 C. caretta collected from Mona Island and have compared our nucleotide diversity levels to previous population studies of barnacles inhabiting fixed substrates.
MATERIALS AND METHODS
Barnacles were sampled from several adult and juvenile hawksbills at Mona Island, Puerto Rico a known breeding location of this species. The sampling sites were located on the southern coast of Mona Island (18°5′27″N and 67°53′37″W). Barnacles were collected from nesting and foraging turtles during August and September of 2006 and 2007. Chelonibia sp. barnacles attached to the carapace were removed from three females (17 barnacles) and six males (18 barnacles). One of these barnacles was collected from a juvenile turtle from Culebra Island, eastern Puerto Rico. A specimen of Chelonibia testudinaria was collected from another juvenile turtle from Mona Island and was used as outgroup in the genealogical analysis. Barnacles were preserved in 100% ethanol for DNA analysis.
Total genomic DNA was extracted using a Gentra DNA purification kit (Qiagen, Inc.). A fragment of the 16S rRNA gene was amplified using primers from Crandall & Fitzpatrick (Reference Crandall and Fitzpatrick1996). A fragment of the COI was amplified with the universal primers from Folmer et al. (Reference Folmer, Black, Hoeh, Lutz and Vrijenhoek1994). Amplification was performed using the Master Taq® kit. To amplify the COI and the 16S gene, the thermal cycler profile began with a denaturation step at 94°C for 2 minutes, followed by 40 cycles of 95°C for 15 seconds, 45°C for 30 seconds (COI; 42°C for 50 seconds), and 72°C for 30 seconds (COI; 1 minute), ending with an extension step at 72°C for 5 minutes. Some DNA templates that were difficult to amplify were further cleaned by a Qiagen PCR Clean Up Kit and Mg+2 hot beads. PCR products were visualized by electrophoresis on a 1% agarose gel, and cleaned using ExoSap. Sequence reactions were prepared with the BigDye Terminator v.3.1 Cycle Sequencing Kit for both strands of the purified amplicon and loaded in an ABI 3130xl Genetic Analyzer. The resulting DNA sequences were verified by aligning reads from both 5′ and 3′ directions for the majority of individuals, using the software CodonCode Aligner and further curated in MacClade (Maddison & Maddison, Reference Maddison and Maddison2000). The haplotypic (h) and genetic diversity (π) (Nei, Reference Nei1987) of barnacles was estimated in DNAsp (Rozas et al., Reference Rozas, Sánchez-DelBarrio, Messeguer and Rozas2003). The DNA neutrality tests Tajima's D (Tajima, Reference Tajima1989) and Fu's Fs (Fu, Reference Fu1997) were applied to test for significant departures from neutrality (Kimura, Reference Kimura1968). Additionally, a hierarchical analysis of molecular variance (AMOVA; Excoffier et al., Reference Excoffier, Smouse and Quattro1992) was applied to detect population differentiation between barnacles collected from male and female turtles. AMOVA and pairwise ΦST comparisons were performed in Arlequin ver. 3.1 (Excoffier et al., Reference Excoffier, Laval and Schneider2005) by using the K2P + Γ (0.222) (Kimura, Reference Kimura1980) model of nucleotide substitution. We used the K2P model to increase resolution in our data set which was characterized by many closely related haplotypes. The significance of ΦST was assessed by 10,000 permutations of groups and haplotypes. A parsimony haplotype network was constructed for the concatenated sequences using the Templeton et al. (Reference Templeton, Crandall and Sing1992) algorithm as implemented in TCS v.1.21 (Clement et al., Reference Clement, Posada and Crandall2000). Genealogical trees of the mitochondrial sequences were built with the maximum parsimony method in MEGA 4 (Tamura et al., Reference Tamura, Dudley, Nei and Kumar2007). DNA sequences have been deposited in GenBank under Accession Numbers FJ385704–FJ385766.
RESULTS
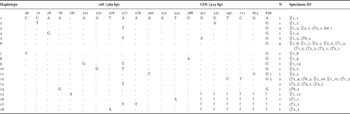
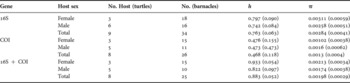
After verifying and trimming the DNA traces, a 389 bp segment of the mitochondrial gene 16S from 34 individual barnacles and a 525 bp segment of COI from 27 barnacles were included in the analysis. Two barnacles from turtles Female 1 and Male 1 did not yield high quality sequences for either gene. We identified 18 different haplotypes (Table 1). Four haplotypes of barnacles (Hap 3, 5, 6 and 12) were shared by female and male turtles, while nine haplotypes were found only on females and six only on males (Table 1). Of the 18 haplotypes, 13 were singletons. There were 14 segregating sites (including two indels) in 16S and six segregating sites in COI. There were seven transitions and five transversions in 16S while all nucleotide substitutions in COI were transitions. Haplotypic diversity (h) of barnacles ranged from 0.822 to 0.933 for male and female turtle hosts, respectively for the concatenated data (Table 2). Nucleotide diversity (π) ranged from 0.00198 to 0.00213 for males and females, respectively for the concatenated data (Table 2). There were no significant differences in estimates of h and л when barnacles were grouped according to the gender of the host, for neither gene nor the combined data (Table 2).
Barnacle haplotypes and relative positions segregating sites from 914 bp of the concatenated sequences of the mitochondrial 16S and COI genes sampled across 35 specimens from 3 female (♀), 6 male (♂), and 1 juvenile (Juv) hawksbill turtles. Hap., haplotypes; -, gaps; ?, missing data; N, number of barnacles sharing this haplotype. The Specimen ID column refers to the GenBank codes of sequenced barnacles as well as the gender of their respective turtle host.

Host gender estimates of Chelonibia caretta haplotypic diversity h (±SD) and nucleotide diversity π (±SD) for 16S and COI, separately and combined (16S + COI).

When we included all barnacles with complete sequences (16S + COI, N = 25), the increased number of singletons resulted in significant deviations from neutrality (Tajima's D = –1.92072, P < 0.05; Fu's Fs = –10.675). The significantly negative values of Tajimas's D and Fu's Fs tests are consistent with an expanding population or a purifying selection scenario. When we applied the tests gene-by-gene, we detected significant deviations from neutrality with 16S but borderline non-significant with COI, as most of the singletons were observed in the 16S region.
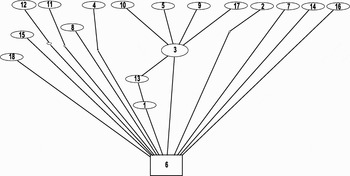
When barnacle sequences were partitioned by individual hosts, AMOVA indicated that most of the genetic variation of barnacles (98.24%) was observed within individual turtles, suggesting that the sampled C. caretta were not significantly differentiated between hosts (ΦST = 0.01761, P = 0.408 ± 0.018). When partitioned by gender of the host turtles, AMOVA suggested that most of the genetic variance (89.52%) was observed within rather than among gender for the concatenated genes. The overall ΦST = 0.1048, which is not significant (P = 0.077 ± 0.003). The population specific ΦSTs were 0.1148 for barnacles attached to males and 0.0981 for barnacles attached to females. There was no genetic differentiation driven by the gender of the host, regardless if we concatenated or separated the genes. Pairwise ΦST comparisons did not indicate significant genetic differentiation of barnacles among hosts or gender of hosts (data not shown). The haplotype network analysis reflected the plethora of singletons and the lack of genetic population structure in the barnacles (Figure 1). The haplotype relationships as depicted in the network analysis are consistent with a demographic scenario of population expansion or purifying selection. Genealogical analysis of the concatenated 16S + COI sequences (914 bp) resulted in a mostly unresolved topology (data not shown).
Parsimony haplotype network based on the concatenated mitochondrial sequences COI + 16S of Chelonibia caretta. The size of ovals is proportional to the observed number of sequences for that corresponding haplotype (see Table 1 for haplotypic frequency and definition). The minimum number of steps is represented by the small empty circles between each haplotype. The boxed haplotype (6) is the hypothesized root of the network and the closed loop represents homoplasy, as indicated by the TCS analysis (Clement et al., Reference Clement, Posada and Crandall2000).

DISCUSSION
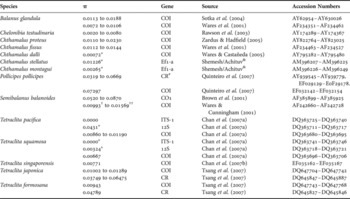
Genetic diversity is the most basic unit of ecosystem diversity, playing a central role in how populations/species respond to changing environments. Comparisons of genetic diversity levels between Chelonibia caretta (Table 2) with those reported from barnacle species settled on fixed substrates (e.g. rocks, piers and mangrove roots) reveals that the commensal barnacles harbour low levels of genetic variability (Table 3). Chelonibia caretta exhibited similar to slightly lower values of genetic diversity than the congeneric C. testudinaria (0.002–0.008; Table 3), but the latter commensal species was collected from a much wider geographical region and from a different turtle host species (Rawson et al., Reference Rawson, Macnamee, Frick and Williams2003). The mitochondrial gene COI is the most frequently sequenced gene in population studies of barnacles and comparisons of nucleotide diversities reveal that previously reported values are about an order of magnitude higher than those of C. caretta (Table 3). Nucleotide diversities from other mitochondrial and nuclear genes yield similar or higher genetic diversities. However, comparisons may not be appropriate since different genes are usually under different selection constraints.
Estimates of genetic diversity (π) of barnacle species from the literature. When population information was available, the range of genetic diversity is provided (CR#). Studies containing less than 5 sequences per species were not included. Studies that did not include GenBank submission number were not included. Sequences also include flanking rRNA and tRNA sequences.

(†) π value was generated by pooling all European populations together. (††) π value was generated by pooling all North American populations together. (*) π value was generated by pooling all sequences of the study because sampled populations consisted of fewer than 5 individuals. (&) Unpublished manuscript. CR, control region; Ef1-a, elongation factor 1 alpha.
The population dynamics of hosts and their epibionts should be tightly linked. Barnacles attached to fixed substrates are capable of dispersing during the larval stage whereas barnacles attached to mobile substrates (e.g. turtles, boats and driftwood) can disperse during both larval and adult stages. Because C. caretta is an obligate commensal of marine turtles, its dispersal potential should be influenced by the migratory behaviour of its hosts, as it has been shown for the congener C. testudinaria (Rawson et al., Reference Rawson, Macnamee, Frick and Williams2003). The parsimony network analysis and the molecular variance of the sampled barnacles indicate that they are genetically homogeneous, irrespective of the host or its gender. Such pattern of molecular variance suggests that barnacles settle on turtles in mating and/or foraging areas, where both sexes can be found concomitantly. Alternatively, rates of gene flow between barnacle populations are high enough to result in panmixia. The nesting population of Mona Island is genetically distinct from other Caribbean rookeries (Díaz-Fernandez et al., Reference Díaz-Fernandez, Okayama, Uchiyama, Carrillo, Espinosa, Marquez, Diez and Koike1999; Velez-Zuazo et al., Reference Velez-Zuazo, Ramos, van Dam, Diez, Abreu-Grobois and McMillan2008), but the hawksbills feeding in the adjacent coral reef habitats are genetically composed of turtles from geographically distinct rookeries (Bowen et al., Reference Bowen, Bass, Garcia-Rodriguez, Diez, van Dam, Bolten, Bjorndal, Miyamoto and Ferl1996). Because our samples were collected from Mona Island (and only one from Culebra Island) absence of population structure may not be indicative of the demography of the Caribbean populations of the barnacle. Additional sampling of C. caretta from genetically distinct Caribbean rookeries will be sufficient to test this hypothesis. On the other hand, the complex life history of the hawksbill turtle with ontogenetically onset migration, repeated movements between foraging, breeding and nesting habitats and large variation of migratory behaviour between and within sexes (van Dam et al., Reference van Dam, Diez, Balazs, Colón Colón, McMillan and Schroeder2008; Velez-Zuazo et al., Reference Velez-Zuazo, Ramos, van Dam, Diez, Abreu-Grobois and McMillan2008) may explain the absence of population structure in the commensal barnacles. Significant recruitment to foraging habitats of Mona Island from other Caribbean rookeries (Velez-Zuazo et al., Reference Velez-Zuazo, Ramos, van Dam, Diez, Abreu-Grobois and McMillan2008), exposes resident hawksbills to migrant hawksbills with epibiont loads from other Caribbean regions. If the exposure to allochthonous turtles through habitat sharing is long enough, then a mechanism is provided to genetically homogenize the epibiont barnacle populations. In foraging habitats, cyprids from different geographical origins can settle equally on resident and non-resident feeding turtles regardless of the host or its gender. The success of cyprid settlement on the host carapace depends on the density of the hosts and barnacles, and the period of exposure of the host to the barnacles (Zardus & Hadfield, Reference Zardus and Hadfield2004). Based on our results, the most likely time and place for cyprid settlement should be nearshore habitats where turtles aggregate to mate or forage.
The hawksbill sea turtle Eretmochelys imbricata has declined as much as 80% during the last century (Meylan & Donelly, Reference Meylan and Donelly1999) and has been listed as critically endangered by the International Union for the Conservation of Nature (Baillie & Groombridge, Reference Baillie and Groombridge1996). Any reductions of the host population will be accompanied by a reduction of the epibiont populations, since hawksbill turtles constitute the primary habitat. The hawksbill turtle populations in the Atlantic are depleted (Meylan, Reference Meylan1999), and with an estimated female census size of 5000 turtles in the Caribbean (McClenachan et al., Reference McClenachan, Jackson and Newman2006), the number of suitable turtle hosts/habitats for barnacles is now limited. Because turtle barnacles have unique life histories tightly linked to their host's life history, they are susceptible to the same demographic processes, such as rapid population declines. Even though the observed excess of singletons in the mtDNA of barnacles may be explained by a population expansion, this pattern represents a genetic footprint of the past, when host populations were abundant. Similarly, other marine species (e.g. the sea urchin Diadema antillarum (Lessios et al., Reference Lessios, Garrido and Kessing2001) and whales (Roman & Palumbi, Reference Roman and Palumbi2003)) that have undergone recent drastic declines, harbour patterns of genetic variation indicative of much higher past population sizes than the current ones.
The US Endangered Species list comprises primarily host species; however, these species are interconnected or affiliated with many other organisms (predators, preys, parasites, commensals, etc.). As many as 6300 affiliated species have been estimated to be co-endangered along with the host species (Koh et al., Reference Koh, Dunn, Sodhi, Colwell, Proctor and Smith2004), indicating how closely linked the evolutionary destinies of affiliate–host groups are. The Chelonibia caretta–Eretmochelys imbricata is an affiliate–host species pair where the host has been included in the Endangered Species List; therefore, we suggest that the barnacle C. caretta should also be considered a candidate for listing due to drastic declines of its primary habitat.
ACKNOWLEDGEMENTS
We are grateful to the Department of Natural and Environmental Resources of Puerto Rico for providing collection permits and indebted to Carlos Diez and Robert van Dam for the barnacles. Tania Insua-Lado assisted in the molecular procedures. Financial support was provided by an NSF–EPSCOR grant awarded to N.V.S. DNA sequencing was performed at the Sequencing and Genotyping facility, University of Puerto Rico-Río Piedras which is supported in part by NCRR AABRE Grant No. P20 RR16470, NIH-SCORE Grant No.S06GM08102, University of Puerto Rico Biology Department, NSF-CREST Grant No.0206200.