INTRODUCTION
Low dry matter intake (DMI) has been identified as a major factor limiting milk production of highly productive dairy cattle in grazing systems, as reviewed by Bargo et al. (Reference Bargo, Muller, Kolver and Delahoy2003) and Wales et al. (Reference Wales, Stockdale, Doyle and Murphy2005). Numerous factors influence grass intake by cattle, such as plant characteristics including cultivar and chemical composition and management practices including grazing intensity and herbage allowance (Chilibroste Reference Chilibroste, Dijkstra, Forbes and France2005; Rearte Reference Rearte and Murphy2005; Wales et al. Reference Wales, Stockdale, Doyle and Murphy2005).
The soluble sugar content of grass is of particular interest with respect to DMI, profile of nutrients available for absorption in the cow and ultimately milk production. Sugars are a readily available source of energy for rumen microbes (Boudon et al. Reference Boudon, Peyraud and Faverdin2002). Since leaf proteins in grass are also rapidly degraded in the rumen, matching the energy supply from sugars with the protein supply may increase rumen microbial protein synthesis and reduce ammonia levels and losses of N with urine (Miller et al. Reference Miller, Moorby, Davies, Humphreys, Scollan, Macrae and Theodorou2001; Tas et al. Reference Tas, Taweel, Smit, Elgersma, Dijkstra and Tamminga2006b). Dairy cattle prefer grass with a high sugar content and high digestibility of organic matter (DOM) (Smit et al. Reference Smit, Tamminga and Elgersma2006). Herbage intake increased when a high-sugar and low-neutral detergent fibre (NDF) ryegrass cultivar was offered to zero-grazed cows in early lactation, but milk production was not affected (Moorby et al. Reference Moorby, Evans, Scollan, Macrae and Theodorou2006). However, cultivars with elevated water-soluble carbohydrate content did not consistently result in greater herbage intake and milk production in grazing dairy cattle (Tas et al. Reference Tas, Taweel, Smit, Elgersma, Dijkstra and Tamminga2006a) or in zero-grazed dairy cattle in mid and late lactation (Miller et al. Reference Miller, Moorby, Davies, Humphreys, Scollan, Macrae and Theodorou2001; Taweel et al. Reference Taweel, Tas, Smit, Elgersma, Dijkstra and Tamminga2005).
Sugars in grass are produced in the leaves and stored in the stem and pseudo-stem (Fulkerson & Donaghy Reference Fulkerson and Donaghy2001). More than most other nutrients in the plant, sugar concentrations undergo diurnal fluctuation. During the day, sugars accumulate and during the night they are consumed during respiration. This results in a higher sugar content in grass in the afternoon than in the morning (Van Vuuren et al. Reference Van Vuuren, Van Der Koelen and Vroons De Bruin1986; Delagarde et al. Reference Delagarde, Peyraud, Delaby and Faverdin2000; Orr et al. Reference Orr, Rutter, Penning and Rook2001). In general, cows tend to have patterns of peak grazing activity during the day and the major grazing event and highest intake occurs around dusk (Rook & Huckle Reference Rook and Huckle1997; Taweel et al. Reference Taweel, Tas, Dijkstra and Tamminga2004). In view of the diurnal pattern of grass sugar content and cow intake behaviour, provision of a fresh plot of grass allowance following afternoon milking rather than morning milking may increase intake of the relatively sugar-rich grass and thus may increase nutrients available for milk production by the cow. Orr et al. (Reference Orr, Rutter, Penning and Rook2001) aimed to maximize the use of high-sugar afternoon grass by offering cows new areas of grass in a strip grazing system after the afternoon milking, when water soluble carbohydrate content was 204 g/kg DM, rather than after the morning milking when this content was 175 g/kg DM. Grass intake did not differ between treatments, but milk production was increased by 5% in the afternoon allocation group (Orr et al. Reference Orr, Rutter, Penning and Rook2001). In addition, Gibb (Reference Gibb, Elgersma, Dijkstra and Tamminga2006) reported milk fat and protein contents from the experiment by Orr et al. (Reference Orr, Rutter, Penning and Rook2001) and these were increased by 4·7 and 0·4 g/kg, respectively, in AA. Cows receiving their fresh allocation in the afternoon spent more time grazing between allocation and the next milking (16.45 to 07.45 h) than cows receiving fresh allocation in the morning between allocation and the next milking (07.45 to 16.45 h). Similarly, in beef heifers, afternoon allocation resulted in longer grazing time in the afternoon and improved average daily gain, compared to morning allocation, but herbage intake did not differ (Gregorini et al. Reference Gregorini, Eirin, Refi, Ursino, Ansin and Gunter2006). In those experiments, however, no rumen fermentation data were available.
The aim of the current experiment was to determine the influence of grazing management, viz. daily allocation to a new plot of ryegrass after morning or after afternoon milking in a strip grazing system, on intake, intake behaviour, rumen fermentation characteristics and milk production in grazing dairy cows.
MATERIALS AND METHODS
Experimental design and treatments
The experiment was carried out between 13 July and 1 September 2005 after approval by the Institutional Animal Care and Use Committee of Wageningen University. The study was conducted as paired comparisons in a randomized block design with repeated measurements. After adaptation to grazing for 2 weeks, two groups of 10 dairy cows were assigned to their respective treatments and adapted to these treatments for 1 week. The treatments, daily move to a previously ungrazed strip (hereafter termed ‘move’) after morning milking (MA; 06.00 h) or after afternoon milking (AA; 16.00 h) to a fresh 0·125 ha plot, were repeated during three rotations. Each of the repetitions lasted 14 days. Water was available ad libitum.
Herbage
A uniform stand of perennial ryegrass (Lolium perenne L.), established in August 2003, was used during the experiment. The mixture used was Havera, a mixture composed of 0·70 L. perenne tetraploid cultivar Elgon and 0·30 L. perenne diploid cultivar Veritas (proportions by seed number). The fertilizer application rates were 95 kg N/ha as ammonium nitrate and 23 kg P/ha in the form of pentoxide in spring and 75 kg N/ha as potassium ammonium sulphate prior to each rotation. The paddock was divided into 42 plots of 0·125 ha that were stepwise cut to approximately 40 mm height (three plots for both treatments every 2 or 3 days), to have approximately equal DM on offer per day after 21 days of regrowth. Herbage mass on offer was estimated using the sward surface height and pasture mass double sample technique as described in Abrahamse et al. (Reference Abrahamse, Dijkstra, Vlaeminck and Tamminga2008). Briefly, within on average 20 quadrats of 0·5×0·5 m during each rotation, herbage height was measured and pasture mass was determined after cutting grass at 40 mm from ground level prior to each rotation. The regression of pasture mass against herbage height was used to calculate herbage mass from observations of herbage height during the experiment (on average 15 SSH measurements per plot per day).
Animals
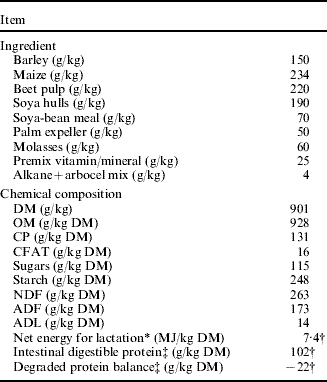
Twenty Holstein cows, of which six were previously fitted with a rumen cannula (100-mm i.d.; Bar Diamond Inc., Parma, Idaho, USA) in the dorsal sac, were paired by parity, days in milk (DIM), and milk yield during the adaptation period and randomly assigned to the treatments. At the start of the experiment, cows produced 31·2±1·3 kg of milk/day (values expressed as means±s.e.), were 127±11 DIM, body weight (BW) was 536±13 kg, and body condition score (BCS) was 2·2±0·3 (recorded on a five-point scale). Cows were milked twice daily at 06.00 and 16.00 h using a mobile milking parlour, and cows were let out on pasture around 1 h after the start of milking. Individual milk yield was recorded throughout the experiment and individual milk samples were collected at each milking and stored in a refrigerator at 4°C using sodium azide and bronopol as preservative. Fat, protein and lactose contents were determined according to ISO 9622 (Melkcontrolestation, Zutphen, The Netherlands) and milk urea was determined using the pH-difference technique (ISO 14637). Fat and protein corrected milk (FPCM) yield (kg/day) was calculated as (0·337+0·0116×fat (g/kg)+0·006×protein (g/kg))×milk yield (kg/d). Herbage intake per animal per rotation was estimated using the alkane technique as described by Abrahamse et al. (Reference Abrahamse, Dijkstra, Vlaeminck and Tamminga2008). Cows received 2·70 kg DM/day of a concentrate with C32 alkanes in two equal portions during milking throughout the experiment (Table 1). Intake of concentrate was complete, and daily C32 alkane supplementation was 897 mg/d. Intake of herbage was calculated based on C32 and C33 alkane concentrations in feed and in faecal samples taken twice daily around milking from each cow.
Ingredient and chemical composition of the concentrate
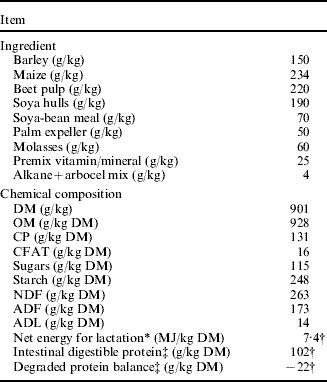
* Calculated with VEM system (Van Es Reference Van Es1975).
† Provided by the feed manufacturer (Research Diet Services, Wijk bij Duurstede, The Netherlands).
‡ Calculated as in Tamminga et al. (Reference Tamminga, Van Straalen, Subnel, Meijer, Steg, Wever and Blok1994).
Herbage and concentrate sampling
During every milking, around 40 representative herbage samples were randomly taken from both treatments at 40 mm above ground level and oven dried for 24 h at 70°C. Similarly, samples from residual grass after the move to a new plot were taken. At the end of the experiment, samples were pooled into three samples per treatment per rotation (morning, afternoon and residual). Also, a representative concentrate sample was taken and dried per rotation. Herbage and concentrate samples were ground through a 1 mm sieve and analysed for DM, inorganic matter (ash), crude protein (CP), crude fat (CFAT), NDF, acid detergent fibre (ADF), acid detergent lignin (ADL), sugars (soluble in 0·40 (w/w) ethanol) and starch as described by Abrahamse et al. (Reference Abrahamse, Dijkstra, Vlaeminck and Tamminga2008). Net energy for lactation (NEL) was calculated using the net energy for lactation (VEM) system (Van Es Reference Van Es1975) and intestinal digestible protein (DVE) and degraded protein balance (OEB) were calculated according to Tamminga et al. (Reference Tamminga, Van Straalen, Subnel, Meijer, Steg, Wever and Blok1994). Data used for these calculations were obtained from the concentrate supplier (concentrates) and from near infrared reflectance spectroscopy (NIRS) carried out by BLGG in Oosterbeek, The Netherlands (grass samples). Also, DOM was determined using NIRS by BLGG in Oosterbeek, The Netherlands.
Grazing behaviour
Temporal patterns of grazing behaviour of all cows per treatment were recorded using IGER solid-state automatic behaviour recorders (Ultra Sound Advice, London, UK; Rutter et al. Reference Rutter, Champion and Penning1997). The 10 available jaw recorders were fitted to five cows of each treatment after moving to a new plot and removed after 24 h. The consecutive day, the remaining 10 cows were monitored using the jaw recorders. The data were analysed with the Graze Data Analyses Program (version 8.0, IGER, Devon, UK), identifying jaw movements and different behaviours (grazing, ruminating and idling; Rutter Reference Rutter2000).
Rumen measurements
Rumen fluid samples were taken after every milking from the six rumen-cannulated animals. A solid, perforated plastic tube (850 mm long; 25 mm in diameter) was used to collect equal amounts of rumen fluid from the front and middle of the ventral sac and from the cranial sac. The pH was measured immediately using an electronic pH meter (pH electrode HI 1230, Hanna Instruments B. V., IJsselstein, The Netherlands). Duplicate samples were taken, either acidified with phosphoric acid or with trichloroacetic acid, and stored at −20°C pending volatile fatty acids (VFAs) and ammonia-nitrogen (NH3-N) analysis, respectively, as described by Taweel et al. (Reference Taweel, Tas, Smit, Elgersma, Dijkstra and Tamminga2005).
Statistical analysis
All statistical analyses were carried out by analysis of variance (ANOVA) using the PROC MIXED procedure of SAS (version 9.1; SAS Institute Inc., Cary, NC). Repeated measurements by ANOVA were performed on all data except for offered herbage, herbage chemical composition and herbage intake, with day as the repeated subject, since multiple measurements per animal cannot be regarded as independent units of observations (Littell et al. Reference Littell, Henry and Ammerman1998). A first-order autoregressive covariance structure [AR(1)] fitted the data best and was used to account for within-cow variation. Data are presented similarly for all variables, with treatment means for morning and afternoon samples for both MA and AA, except for milk yield and composition, with s.e.m. values for the interaction between treatment and time and P-values for treatment effects and for the interaction between treatment and time. Effects of rotation and the interaction between rotation and treatment are not discussed as these were of minor interest in view of the aim of the current paper. Differences were considered significant at a probability of P<0·05 and post-hoc analyses were carried out using the Tukey test for pairwise comparisons. When interactions were not significant (P>0·05), they were excluded from the model.
After averaging DM content of herbage per treatment, rotation and sample time combination, the average chemical composition of offered grass per rotation per treatment was analysed with treatment, rotation and time of sampling (morning, afternoon and residue) as fixed factors. The interaction between treatment and time of sampling was also included in the model. After averaging offered herbage per treatment and rotation, offered herbage and NEL, DVE, OEB and DOM, these variables were tested using a simpler model including only the effects of treatment and rotation.
Herbage intake was analysed similarly, although as herbage intake was determined per cow per rotation, day was excluded from the model and cow was included as a random factor in the model. Grazing behaviour was analysed with treatment, rotation, day, time between milkings (time denotes period between two milkings: from 06.00 to 16.00 (the time between the morning and afternoon milking) and from 16.00 to 06.00 (the time between afternoon and morning milking)) and the interaction between treatment and time.
The model for rumen fluid variables was similar to the model for grazing behaviour but also included the interaction between treatment and rotation, since this interaction was significant for most rumen fluid variables, and included time denoting actual sampling time at milking. Milk data from the two milkings following a move to a fresh plot were pooled per animal and values were analysed with treatment, rotation, day and the value of each of the variables measured during the adaptation period as covariate. As the interaction between treatment and rotation showed no significant differences, it was not included in the model.
RESULTS
Pasture composition and intake
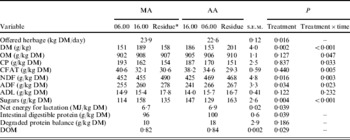
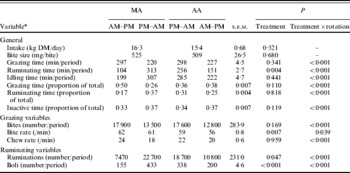
Chemical composition of pasture was similar between treatments, except for a higher DM, sugar, NEL, DVE and DOM content but lower NDF and ADF content in AA than MA (P<0·05, Table 2). All variables differed between both times of sampling (06.00 and 16.00 h, P<0·05, data not shown). Most interesting, however, was the significant interaction between treatment and time of sampling in all variables, except for ADL content of pasture. Pasture CP and CFAT contents were lower after the first 10 or 14 h grazing than directly after moving to a new plot. Grass NDF content was lower immediately after the afternoon move to fresh pasture in AA than in all other treatment and time combinations. The most pronounced differences existed in sugar contents between the four treatment and time combinations. Sugar content was greatest around afternoon milking, although differences between maximum and minimum sugar content were larger in MA than in AA, and pasture in MA that had already been grazed for 10 h showed a higher sugar content than grass offered fresh at 16.00 h in AA. The amount of pasture offered was greater in MA than AA (P=0·016) due to an unexpected difference in grass height (169 mm in AA and 176 mm in MA, P=0·009), but intake of pasture did not differ between treatments (Table 3).
Offered herbage and herbage chemical composition of cows moved after morning (MA) or afternoon milking (AA) to a new plot
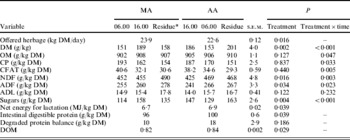
* The residue was taken from the plot at turnout.
Herbage intake and intake behaviour of dairy cows moved after morning (MA) or afternoon milking (AA) to a new plot
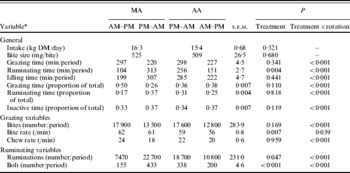
* AM–PM indicates the period between morning and afternoon milking, PM–AM indicates the period between afternoon and morning milking.
Grazing behaviour
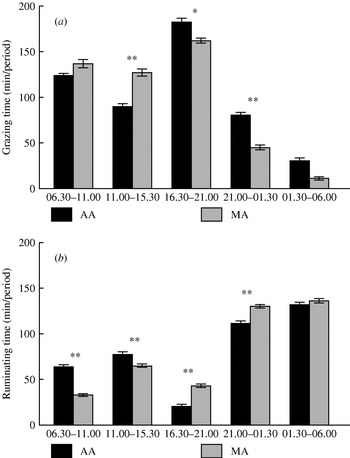
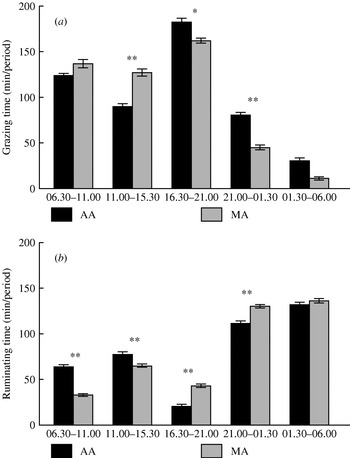
All rumination variables and the bite rate during grazing differed between treatments, with a longer rumination time (417 v 407 min/day, P=0·004) in MA compared with AA, more ruminations (30 500 v 29 500 per day, P=0·047) and also more rumination boli (588 v 538 per day, P<0·001) (Table 3). However, there was an interaction between treatment and period of the day for all variables. Grazing time, bites and chews were greater in the period immediately after the move to a fresh plot of grass (i.e. in AM–PM, the period between morning and afternoon milking in MA and in PM–AM, the period between afternoon milking and morning milking in AA) with a larger difference in chews between AM–PM and PM–AM in MA than in AA. When expressing grazing time as proportion of available time in both treatments and periods of the day, the time budget of the cows shows, on average per treatment, a similar distribution between grazing (0·36), ruminating (0·29) and inactivity (0·35). When examining differences between AM–PM and PM–AM, a shift occurs in that grazing time per period of the day is higher in AM–PM (0·44) compared to PM–AM (0·31, P<0·001) at the expense of ruminating (0·21 v 0·34 in AM–PM and PM–AM, respectively, P<0·001). Ruminating time (in minutes as well as in proportion of available time), the number of ruminations and the number of boli was greater during PM–AM than during AM–PM. The differences between AM–PM and PM–AM were much larger in MA than in AA (Table 3). To further investigate differences within the day between MA and AA, grazing and ruminating time was separated into five periods of 4·5 h (Fig. 1). To group data into these periods, it was necessary to split the time between morning and afternoon milking into two periods while the time between afternoon and morning milking was split into three periods. The time that was excluded from this analysis (06.00–06.30 and 15.30–16.30 h) was during milking and so chosen to minimize the loss of data. Clearly, grazing time is larger directly after the move following morning milking in MA and following afternoon milking in AA, while rumination time shows the opposite effect. Simultaneously, Fig. 1 shows a diurnal effect in grazing and ruminating, with most grazing taking place between 06.00 and 21.00 h and most rumination time between 21.00 and 06.00 h.
Grazing time (a) and ruminating time (b) during different periods of the day when dairy cows are moved after morning (MA) or afternoon (AA) milking to a new plot. Asterisks above the columns indicate the significance of the difference between treatments per period of the day (*P<0·01; **P<0·001) and bars representing s.e.m. are given.
Rumen variables and milk production
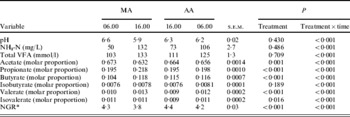
Rumen fluid pH, NH3-N and total VFAs were similar between treatments (Table 4). In MA, the proportions of acetate and butyrate were lower but those of propionate, valerate and isovalerate were higher, resulting in a lower NGR than in AA (Table 4). Again, for all rumen variables, a significant interaction between treatment and time was found, mainly caused by the larger differences between morning and afternoon sampling in MA than in AA.
Rumen pH, ammonia-nitrogen (NH3-N) and molar proportions of individual VFAs of dairy cows moved after morning (MA) or afternoon milking (AA) to a new plot
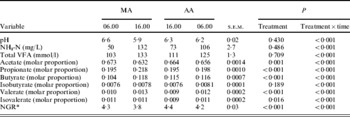
* The non-glucogenic to glucogenic VFA ratio (NGR) was calculated as [acetate+2×(butyrate+isobutyrate)+valerate+isovalerate]/[propionate+valerate+isovalerate].
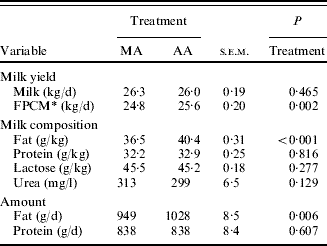
Milk yield, milk protein, lactose and urea content were similar between treatments, but milk fat content was higher in AA than in MA (P<0·001, Table 5). Because of this higher milk fat content, milk fat and FPCM production were greater in AA than in MA (P=0·006 and P=0·002, respectively).
Milk yield and milk composition of dairy cows moved after morning (MA) or afternoon milking (AA) to a new plot
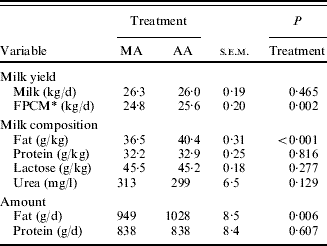
* Fat- and protein-corrected milk.
DISCUSSION
The aim of the current experiment was to determine the effect of daily move to fresh pasture after either morning or afternoon milking on intake, intake behaviour, rumen fermentation characteristics and milk production in grazing dairy cows. Daily strip grazing is a frequently adopted grazing strategy in modern dairy farming and has been shown to improve productivity of dairy cows when compared with a move to a fresh plot every 4 days (Abrahamse et al. Reference Abrahamse, Dijkstra, Vlaeminck and Tamminga2008), although the role of timing of a move in herbage allocation has not received much attention in dairy nutrition. Little information is available on the combined effects of grazing behaviour, rumen fermentation and milk production in such grazing systems. In the present experiment, it was shown that cows have longer grazing times immediately after the move to a fresh plot than in the hours preceding the move to a new plot. Such a grazing behaviour, in combination with changes in grass composition due to daytime variation and cows grazing down the sward, resulted in a higher NGR in rumen fluid in cows when moved following afternoon milking than morning milking. This was accompanied by an increased milk fat content in AA, resulting in a higher FPCM production.
Grazing behaviour
It is well known that grazing dairy cows consume the largest part of their intake during daylight hours. Rook et al. (Reference Rook, Huckle and Penning1994) found 0·88 of intake occurred during daylight hours, while Penning et al. (Reference Penning, Rook and Orr1991) found 0·90 of intake occurred during the 17 h of daylight. This decreased to 0·72 later in the season, when daylight was reduced to 12 h. Also in the current experiment, cows were found to show large differences in grazing time between AM–PM and PM–AM. Although grazing time did not differ between treatments, the average proportion of time spent on grazing was much larger AM–PM (0·44) than PM–AM (0·31). There are limited data available on cows allocated fresh pasture after morning or afternoon milking in strip grazing systems. Gregorini et al. (Reference Gregorini, Eirin, Refi, Ursino, Ansin and Gunter2006) investigated grazing behaviour in beef cattle, allocating animals at 07.00 or 15.00 h. Their findings show similar effects on grazing time to those found in the current experiment. Total grazing time was much lower, however, caused by their observational method (visual observations during daylight) and lower herbage intake in these animals (on average 5·1 kg DMI/heifer/day) (Gregorini et al. Reference Gregorini, Eirin, Refi, Ursino, Ansin and Gunter2006). A similar experiment was carried out with dairy cattle (Gregorini et al. Reference Gregorini, Gunter and Beck2008). The proportion of time spent eating was found to be greatest following the movement of cows to a new plot. However, these results cannot directly be compared with the results from the current experiment as Gregorini and co-workers allocated cows to a fresh plot either at 08.00 or 15.00 h, but grazing was limited in both treatments to the period between 08.00 and 19.00 h. Orr et al. (Reference Orr, Rutter, Penning and Rook2001), in a similar experimental setup as the current experiment, showed large differences in the time spent grazing during day and night upon a move to a fresh grazing plot after afternoon milking, although these differences after morning move were smaller. The difference between the current findings and those presented by Orr et al. (Reference Orr, Rutter, Penning and Rook2001) may be explained by differences in both the duration of the periods between milking and timing of the move to a fresh plot, which was at 07.45 or 16.45 h in the experiment by Orr et al. (Reference Orr, Rutter, Penning and Rook2001). As mentioned above, cows eat more during daylight hours, implying that grazing time AM–PM would be increased if the duration between morning and afternoon milking is increased from 9 h in Orr et al. (Reference Orr, Rutter, Penning and Rook2001) to 10 h in the current experiment. Also, cows are known to have their main grazing bout during dusk, indicated clearly by Taweel et al. (Reference Taweel, Tas, Dijkstra and Tamminga2004) in a continuous stocking system, showing a linear increase in grazing time between dawn (06.00 to 12.00 h), afternoon (12.00 to 18.00 h) and dusk (18.00 to 24.00 h). Similar findings can be found in Fig. 1, with a longer grazing time at the end of the day in both treatments. This might also have played a role in the larger differences found between AM–PM and PM–AM in AA and the smaller difference in MA in Orr et al. (Reference Orr, Rutter, Penning and Rook2001) than in the current experiment.
Sugar content in grass
The sugar content of grass depends on the balance between synthesis due to radiation on the one hand and growth and maintenance (during respiration), utilizing sugars to grow new shoots and hence regain photosynthetic capacity, on the other. Since sugars are produced during photosynthesis and respiration occurs mainly during the night, substantial amounts of sugars are transported down the plant during the day and stored in the stem and pseudo-stem (Fulkerson & Donaghy Reference Fulkerson and Donaghy2001). Sugar content in grass is also influenced by removal of leaves due to grazing, since sugars are produced in the top layer of the sward, where most radiation is intercepted (Delagarde et al. Reference Delagarde, Peyraud, Delaby and Faverdin2000; Smit & Elgersma Reference Smit, Elgersma, Luscher, Jeangros, Kessler, Huguenin, Lobsiger, Millar and Suter2004). Indeed, sugar increased during the day (121 g/kg DM at 06.00 h v 153 g/kg DM at 16.00 h, P<0·001) as expected. The concentration of sugars at 16.00 h in the current experiment was numerically higher in MA (158 g/kg DM) than in AA (147 g/kg DM). Since grass is defoliated with a gradual decrease in grass height, and sugars show the highest variability in the top layer of the sward as described by Delagarde et al. (Reference Delagarde, Peyraud, Delaby and Faverdin2000), one could argue that sugar content would be expected to be highest at 16.00 h in AA. Although the concentration of sugars during the evening increased between the lowest and highest layer of the sward, during the morning it is lowest in the lowest part of the grass (0–50 mm; 175 g/kg organic matter (OM)) but highest in the second layer from the bottom (50–100 mm; 212 g/kg OM) (Delagarde et al. Reference Delagarde, Peyraud, Delaby and Faverdin2000). This is probably due to transportation of sugars to the lower layers from the bottom of the plants (Fulkerson & Donaghy Reference Fulkerson and Donaghy2001). The fact that sugar content at 16.00 h in MA (grass already grazed for 10 h) was higher than in AA (grass in a fresh plot) suggested that the effect of transportation of sugars played a larger role in the final sugar content of grass than photosynthesis.
Nutrient intake and rumen fermentation
Both treatment groups spent most of their time grazing during the period of the day following afternoon milking, but grazing time in AA during this period was longer than grazing time in MA in this same period (Fig. 1). Combining the grazing times AM–PM and PM–AM in both treatments in this experiment (Table 3) with the chemical composition of grass during these periods of the day (averaged between the move to a fresh plot and turnout), intake of sugars is expected to be higher in AA than in MA. A better estimation of intake of specific components would be a calculation based on the number of bites and bite size. However, herbage intake was not estimated in AM–PM or PM–AM separately. However, in earlier experiments, both Gibb et al. (Reference Gibb, Huckle and Nuthall1998) and Taweel et al. (Reference Taweel, Tas, Dijkstra and Tamminga2004) reported larger bite mass in the evening than in the morning. When using the bite mass of either Gibb et al. (Reference Gibb, Huckle and Nuthall1998) or of Taweel et al. (Reference Taweel, Tas, Dijkstra and Tamminga2004) (after averaging bite size during dawn and afternoon to 406 mg/bite and used together with 563 mg/bite during dusk) to calculate sugar intake by multiplying bites and bite size, daily sugar intake is larger in AA than MA in the current experiment (on average 149 g sugar or 7·7% higher sugar intake), while ADF intake is slightly lower (on average 75 g ADF or 2·1% lower ADF intake). This is related to a higher NGR in rumen fluid in AA than in MA (P<0·001), since on roughage diets increased fermentation of sugar results in increased production of acetate and reduced production of propionate compared with starch or fibre (Bannink et al. Reference Bannink, Kogut, Dijkstra, France, Kebreab, Van Vuuren and Tamminga2006). Indeed, when the effect of the different chemical components of grass in MA and AA on NGR is estimated using the stoichiometric coefficients given by Bannink et al. (Reference Bannink, Kogut, Dijkstra, France, Kebreab, Van Vuuren and Tamminga2006), NGR is expected to be 0·19 higher in AA than in MA. However, the lower NGR in the current experiment in MA might also have been influenced by the longer interval between the large first meal after the move to a new plot and time of sampling rumen fluid, which was longer in AA (14 h) than in MA (10 h). Besides, the large meal in AA was terminated more hours before rumen fluid sampling than in MA as cows tend to eat the largest part of their grass during daylight hours. This effect can also be observed from the pH of rumen fluid. Although grazing time was longest in AA between 16.30 and 21.00 h, the pH at 06.00 was higher than the pH in MA at 16.00 h. The higher NGR was related with a higher milk fat content in AA than in MA, resulting in more FPCM being produced in AA than in MA. The higher milk fat content in AA was in line with the higher fat content in the afternoon treatment reported by Gibb (Reference Gibb, Elgersma, Dijkstra and Tamminga2006). The efficiency of FPCM production (expressed as kg FPCM production per kg of DM herbage intake) shows a tendency to be higher in AA than in MA (1·7 v 1·5, P=0·079), while the efficiency of milk production (expressed as kg milk/kg of DM herbage intake) only shows a numerical increase in AA as compared to MA (1·7 v 1·6, P=0·536). Milk urea content was similar between treatments. However, when investigating the separate milk urea values per milking, larger differences appear between the morning and afternoon milking in MA (289 and 335 mg/l, respectively) than in AA (314 and 283 mg/l, respectively). These values were related to rumen NH3-N values and the ratio of CP to sugar in grass, calculated by averaging the values for CP and sugar at the time of NH3-N and urea sampling with the value of 12 h earlier. This is in line with findings of Gustafsson & Palmquist (Reference Gustafsson and Palmquist1993), who found that changes in rumen fluid NH3-N content were quickly observed in milk urea. This shows that indeed, matching energy and protein supply in the rumen to reduce NH3-N production influences excretion of urea in milk. However, it does not prove that movement strategies in grazing management do have the opportunity to reduce emission of N in grazing systems, as no treatment effect on milk urea content was found, and urinary losses of N as well as microbial protein yield were not determined during this experiment.
CONCLUSION
Time of allocation to a fresh plot altered grazing behaviour over the day. In combination with the variation in chemical composition of the grass, this probably resulted in a larger intake of sugars in AA than in MA. Indeed, these observations were accompanied by an increased NGR in rumen fluid, and an increase in milk fat content, of AA cows. However, herbage intake and milk production were similar between treatments.
The authors thank the personnel of the experimental farm De Ossekampen for their assistance. The students involved in this experiment, M. Dekker, D. van Vilsteren, L. Yeheyis Engedaw, R. Jonker and A. van Veen, are acknowledged for their help during the experiment. The financial support from the Product Board Animal Feed (PDV) and the Dutch Dairy Board (PZ) is greatly acknowledged.