




No CrossRef data available.
Article contents
Visualization of morphological details in congenitally malformed hearts: virtual three-dimensional reconstruction from magnetic resonance imaging
Published online by Cambridge University Press: 24 May 2005
Abstract
In recent years, three-dimensional imaging has provided new opportunities for visualizing congenital cardiac malformations. We present the initial clinical experience using a recently implemented system, which employs some of new interactive, real-time, techniques. We show how three-dimensional rendering based on magnetic resonance imaging can provide detailed spatial information on both intrinsic and extrinsic cardiac relations, and hence how a virtual examination can potentially provide new means to a better understanding of complex congenital cardiac malformations.
Information
- Type
- Original Article
- Information
- Copyright
- © 2003 Cambridge University Press
In 1988, Laschinger and colleagues1 introduced virtual models based on magnetic resonance imaging to visualize complex spatial relationships in patients with congenital cardiac malformations. The images produced using magnetic resonance at of that time, however, suffered major limitations in terms of resolution of the images, and in the ability to compensate for motion. In combination with insufficient computer power, which prevented real-time interaction, this hindered the adoption of the techniques as clinically useful tools. Following the recent technical advances in high-resolution imaging, as well as the boost in computer performance, unique opportunities have now emerged for three-dimensional reconstruction and visualization of complex cardiac morphology. As a consequence, informative overviews of the use and potential application of the different techniques using magnetic resonance imaging visualization in paediatric cardiology have become available.2, 3 These applications focus on post-processing of data acquired with standard protocols, with the thickness of the slices exceeding the in-plane size of the pixel. Reliably to process, validate, and interpret three-dimensional datasets, however, it is important that image data have near equal resolution in all three directions, so-called isotropic voxels. Otherwise, a change of viewing angle leads to changes in resolution, thus compromising the diagnostic validity. We recently presented a real-time system for visualization, which provided three-dimensional, computer-generated virtual models of cardiac morphology in healthy volunteers.4 We have now extended our preliminary experience to clinical cases, combining the acquisition of high resolution, near isotropic, images with realtime and interactive three-dimensional visualization. Our aim was to demonstrate the clinical feasibility of this approach in order to offer surgeons and cardiologists additional information when optimising the strategies for treatment in patients with congenital cardiac disease.
Materials
We studied four patients using cardiac magnetic resonance imaging, with subsequent three-dimensional reconstruction and virtual reality display.
Our first patient was a 2-year-old boy with Fallot's tetralogy and a disconnected and hypoplastic left pulmonary artery. He had previously had a modified Blalock shunt placed between the left subclavian artery and the assumed left pulmonary artery. Subsequently, doubt was raised about the patency of the distal anastomosis of the shunt. To confirm that the shunt was, indeed, anastomosed to the left pulmonary artery, and to assess the location of the ventricular septal defect, we carried out magnetic resonance imaging and three-dimensional reconstruction.
Our second patient was a 22-year-old man with concordant atrioventricular and discordant ventriculo-arterial connections, with an intact ventricular septum, who underwent a Mustard procedure at the age of 9 months. He had been extremely well, but was referred because of newly developed atrioventricular junctional tachycardia and shortness of breath. After conversion to sinus rhythm, we carried out magnetic resonance imaging and three-dimensional visualization to evaluate the intracardiac anatomy, particularly the venous pathways.
The third patient was a 4-year-old boy with tricuspid atresia, discordant ventriculo-arterial connections, subaortic stenosis, and coarctation. He had previously undergone repair of the coarctation, a first stage Norwood reconstruction, and a bidirectional Glenn shunt. We carried out magnetic resonance imaging and three-dimensional reconstruction to confirm the suspicion raised by echocardiography of a proximal stenosis on the pulmonary trunk.
The final patient was a 24-year-old woman with mirror-imaged atrial arrangement and atrioventricular septal defect with common atrioventricular junction, double outlet right ventricle, and infundibular and valvar pulmonary stenosis. A modified left Blalock-Taussig shunt had been constructed in 1982, producing good palliation, with only mild cyanosis and good effort tolerance. Final repair had previously not been offered because of the assumed complexity of the anatomy. To reassess this policy, we carried out magnetic resonance imaging.
Methods
To allow virtual, real-time, exploration of the cardiac morphology, data was acquired and processed for each individual as follows.
Acquisition of data
We used a Philips 1.5 T Intera scanner with Power Track 6000 gradients, System 8 software, and a commercially available 5-element cardiac synergy coil to acquire all datasets. For all acquisitions, sensitivity encoding5 was used to reduce the period of scanning, with a factor up to 1.8. After initial testing on volunteers, a commercially available three-dimensional steady state free precession segmented k-space sequence6 was chosen as optimal with respect to contrast, and signal to noise versus scan time, for acquisition of isotropic voxels. The steady state free precession pulse sequence was initially used to obtain a “low”-resolution three-dimensional volume, with 2.2 mm3 isotropic voxels recorded in late diastole using electrocardiographic triggering. For anaesthetized infants and small children, respiratory correction was not required. In larger individuals, scanning was performed during free breathing, where a navigator7 on the right hemidiaphragm was used for prospective correction of motion correction, using a gating window of 4 to 5 mm. Use of the navigator to correct for respiratory motion approximately doubled the scan time. The length of the window of acquisition was set between 50 and 120 ms, depending on the heart rate. Scan parameters were a repetition time of 3.6 ms, an echo time of 1.8 ms, 90° flip angle, and approximately 26 k-space lines per segment depending on the desired length of the window of acquisition. A spectrally selective fat saturation pulse, and a T2 preparation pulse,8 were used to increase the contrast between the blood pool and fat and muscle, respectively. The duration of scanning was approximately 2 min.
After this initial scan, the quality of the images was quickly evaluated visually to adjust the length of the window and, if motion-related artifacts were present, the settings for respiratory compensation and navigation. The same sequence was then used for a “high”-resolution volume with 1.4 mm3 isotropic voxels, using a repetition time of 4.2 ms, and an echo time of 2.1 ms, with the scan lasting 3.5 min. Again the navigator, if used, would typically double the period required for scanning. Both volumes covered the heart and vessels from below the apex to above the aortic arch, giving between 70 and 120 sagittal slices.
If our focus was primarily on the vascular system, we carried out contrast-enhanced three-dimensional magnetic resonance angiography,9 acquiring 30 to 50 slices varying in thickness from 2.5 to 3.5 mm, with an in-plane resolution of approximately 1.4 mm2, in three consecutive series. To keep the period of scanning within a single breath, electrocardiographic triggering was omitted, despite the obligatory blurring of the inner cavities and septal structures caused by cardiac contraction. Samples of the three sequences are shown in Figure 1. All examinations were performed within 45 min.

Figure 1. The two leftmost images show samples from two three-dimensional steady state free precession acquisitions, both from volumes with isotropic voxels. The resolution is 2.2 mm3 (left, sagittal view) and 1.4 mm3 (middle, sagittal view). The rightmost image (coronal view) shows a typical slice from a contrast-enhanced magnetic resonance angiography.
Segmentation and generation of the model
To build a patient-specific surface model, the data was analyzed to identify and separate cavities and vessels from muscles and other soft tissue. The aim was to colour the cardiac cavities and vessels red and blue according to the assumed anatomy. Generally, the colouring was strictly morphological. In some cases, however, this approach was clearly inappropriate, and was substituted by a functional colour-coding. The process of segmentation was made feasible by the use of specifically developed software. Technical details on the algorithm used have previously been reported.10, 11 To obtain the desired colouring, we initially chose an intensity interval corresponding to the intensity of the blood pool. Next, a small set of points from the “right” and “left” heart were marked in blue or red, respectively. Based on these inputs, the software suggested a morphological colouring, which could be accepted or revised to adjust for obvious misinterpretations. The coloured and segmented data-volume (Fig. 2, middle) was automatically transformed to a set of colour-coded contours, defined as the outlines of each coloured region (Fig. 2, right). Identically coloured contours from neighboring slices were connected automatically using an adapted version of a contour stitching method12 to form the three-dimensional model of the heart. The process is illustrated in Figure 3.

Figure 2. The left image shows the unprocessed, high resolution, steady state free precession image sample from Figure 1 (SSFP 1.4 mm sagittal view). The middle image depicts the computed colouring. In blue it shows the right ventricle, and the right pulmonary artery. In red, it shows the aortic root, the aortic arch and descending aorta, as well as the left atrium. The right image shows the resulting contours, from which the virtual model is built.

Figure 3. The contours resulting from the segmentation are layered and connected to make up a three-dimensional wireframe of triangles. The individual contours can be identified as lying in planes parallel to the shown slice. The wireframe is lit and shaded and then visually perceived as a smooth three-dimensional surface. The insert highlights the transition from contours to triangles.
Visualization
A scaleable system running on hardware ranging from low cost personal computers to dedicated high performance graphical computers was developed. Similarly, display systems ranging from ordinary desktop monitors to large stereoscopic displays were tested. Model interacting was achieved by either a regular mouse or with devices that recognized and tracked the movements of the hands of the users. A setup with stereoscopic glasses and tracking is depicted in Figure 4. The shutter glasses (3D Revelator, Elsa, Germany) gave the illusion that the model was physically present in front of the user. Model interaction was achieved with two hand-held, pencil-shaped styluses and a Fastrak (Polhemus, Vermont, USA). The position and orientation of each stylus were tracked in three dimensions and registered and interpreted by the software. The interface was based on recognition of gestures within the model itself (The Vodgets OS, RoninWorks, Holland). A more detailed description is published elsewhere.4

Figure 4. Stereoscopic glasses bring the virtual model “out of the screen” to obtain a full three-dimensional understanding. Styluses track the position and orientation of each hand, shown with yellow jacks in the model, and provide input for a gesture-based interaction interface.
Results
In all cases, the images were successfully acquired and both electrocardiographically triggered and untriggered data were obtained. From the contrast-enhanced angiographies, vascular models were available shortly after acquisition, whereas data processing of the intra-cardiac aspects, based on the triggered images, typically required from one to two hours of segmentation and validation. The isotropic property of the data was extremely important in the phase of validation, since it allowed inspection of the data in any plane (Fig. 5).

Figure 5. When an isotropic protocol is used for acquisition, the volume can be resliced arbitrarily. The resulting resolution of the images is not dependant on the angulation of the slices in the volume.
A posterior view of the reconstructed heart of our first patient is shown in Figure 6. The left pulmonary artery could not be identified in any of the images. The internal right and inferior views are shown in Figure 7. The view of the right side of the heart (left side panel) was chosen to represent a view very similar to what the surgeon would observe during surgery. The ventricular septal defect is clearly outlined (white circles), and the surgeon is able to measure its dimensions. On the inferior view (right side panel), the ventricular septal defect is seen from inside the left ventricle looking towards the right ventricle. The model clearly depicts the course of the outflow tracts to the aorta and the pulmonary trunk. Based on this information, the child had the shunt occluded with a coil. Although the intracardiac anatomy, including the ventricular septal defect, was clearly depicted, it was decided to delay further surgery.

Figure 6. The posterior view of our first patient shows the aorta (AO), left atrium (LA), left ventricle (LV), the pulmonary trunk (PUL), and the Blalock shunt (B-SHUNT). The right pulmonary artery (RPA) is seen, whereas no left pulmonary artery was found. IVC: inferior caval vein; RV: right ventricle; SVC: superior caval vein.

Figure 7. The heart of our first patient has been opened to show both internal aspects (light shaded) and external aspects (dark shaded). The right view (left side panel) shows the right ventricle (RV), the left ventricle (LV), and the right atrium (RA). Also, the outflow tracts of the right ventricle are seen (AO, PUL). A circle marks the ventricular septal defect (VSD). The inferior view (right side panel) highlights the ventricular septal defect as seen looking from the left ventricle towards the right ventricle. The aortic root is visible through the defect.
The anterior, posterior, and inferior views of the structure of our second patient are shown in Figure 8. The anterior view (top left panel) shows the discordant ventriculo-arterial connections. The inferior view (top right panel) reveals the internal aspects of the two ventricles. The systemic venous pathway entering the morphologically left ventricle is visible. On the posterior view (bottom panel), the crucial information on the degree of stenosis in the pulmonary venous pathway (white circle) can be identified and measured. Based on the overall information, ablation of an incisional pathway was successfully performed. Since the patient was completely asymptomatic, with a high exercise tolerance, it was decided after lengthy discussions to delay relief of the pulmonary venous obstruction.

Figure 8. The heart of the second patient is seen from anterior- (top left), inferior- (top right), and posterior views (bottom). The anterior view shows the aorta (AO) arising from the trabeculated right ventricle (RV), and the pulmonary trunk (PUL) from the left ventricle (LV). On the inferior view, both ventricles have been cut open, the inside shown with light shading. The pulmonary trunk and the entry of the systemic venous pathway (SVP) are seen within the left ventricle. From the posterior view, the left atrium (LA) has been cut open to visualize the stenotic pulmonary venous pathway (marked with a circle). Also the superior- (SVC), and inferior caval veins (IVC) are shown. LPV: left pulmonary vein; RLPV: right lower pulmonary vein; RUPV: right upper pulmonary vein.
We show an anterior and a posterior external view of the heart of our third patient in Figure 9. The anterior view (left side panel) shows the hypoplastic rudimentary right ventricle, the dominant left ventricle, the discordantly connected aorta and pulmonary trunk, as well as the reconstructed ascending aorta and aortic arch subsequent to the first stage of the Norwood procedure. As seen posteriorly (right side panel), the stenotic part of the left pulmonary artery is marked with a white circle, and it can be seen that the compression is produced by the neo-aorta. The stenosis was subsequently relieved by stenting. We have provisionally scheduled total cavo-pulmonary connection to be performed within 1 year.

Figure 9. The anterior view (left) shows the left ventricle (LV) of the third patient, and a hypoplastic right ventricle (RV). The aorta (AO) exits from the right ventricle, and a circle marks the reconstructed ascending aorta and aortic arch subsequent to the first stage of the Norwood procedure. On the posterior view (right), the white circle marks the stenotic part of the left pulmonary artery (LPA), and the yellow circle marks the superior cavo-pulmonary connection. The green circle highlights the atrial septal defect seen as the purple rim.
The reconstructed heart from our final patient, achieved using contrast-enhanced magnetic resonance angiograms, is shown in Figure 10. The right upper pulmonary vein was shown to drain to the brachiocephalic vein, an anomaly that was not known prior to the examination. The atrioventricular septal defect as interpreted by the observers is marked in purple, and is easily seen on the anterior view. In Figure 11, we compare surface rendering, volume rendering, and maximum intensity projection of the angiography. The patient was offered complete repair. In view of the associated risks, and her current wellbeing, she decided to decline surgery.

Figure 10. The heart of our fourth patient is seen from the posterior (left side panel) and anterior (right side panel) aspects. The course of the pulmonary veins and arteries can easily be seen. The right upper pulmonary vein (RUPV) drains directly to the brachiocephalic vein. The Blalock-Taussig shunt (BT-SHUNT) is clearly identified. The anterior view shows the aorta (AO) and partly hidden, the pulmonary trunk, both arising from the right ventricle (RV). The atrioventricular septal defect is shown as a purple rim. LLPA: left lower pulmonary artery; LLPV: left lower pulmonary vein; LUPA: left upper pulmonary artery; LUPV: left upper pulmonary vein; RLPA: right lower pulmonary artery; RLPV: right lower pulmonary vein; RUPA: right upper pulmonary artery.

Figure 11. Three different techniques are shown for rendering the images acquired from our first patient, a surface rendered model (left), volume rendered data (middle), and a maximum intensity projection (right).
Discussion
During the last decade, magnetic resonance imaging has become a strong candidate to be considered a leading non-invasive imaging technique, and one which is particularly suitable for the increasing number of older children and young adults with congenital cardiac disease. Times needed for acquisition of data have been dramatically reduced, correction for respiratory motion and electrocardiographic triggering have been improved, and the increased availability of scanners has made access to cardiac magnetic resonance imaging much easier. Three-dimensional reconstruction, however, has until now only been feasible for the assessment of the external appearance of the heart, the inner aspects being more difficult to display in a format that could easily be used and interpreted. We have applied a virtual format that potentially could provide surgeons and cardiologists with a user-friendly, interactive, mode not only to assist in treatment planning and diagnosis, but also to serve as an alternative format for presenting cardiac morphology for the purposes of teaching. In time, the technique will provide a platform for virtual surgical training.
Acquisition of data and processing were pre-requisites for interactive visualization of the virtual model. Contrast-enhanced angiography, and isotropic, three-dimensional steady state free precession imaging sequences, provided the basis for development of detailed models of some typical postoperative congenital cardiac malformations. For the contrast-enhanced angiographic datasets, the time required for imaging was less than 10 min, and post-processing typically only required an additional 10 min before the model could be presented. While this non-electrocardiographically triggered data provided detailed information about the vascular structures, great care had to be taken when interpreting intracardiac structures. Due to the lack of triggering, these studies contained a blurred mixture of data reflecting systolic and diastolic ventricular images that potentially could lead to false dropouts and misdiagnoses, such as a thin but intact septum appearing deficient. The electrocardiographically triggered steady state free precession pulse sequences, on the other hand, could be used for modeling intracardiac anatomy by triggering to end-diastole. The use of isotropic voxels ensured that no structures larger than the size of the voxel were unidentified, no matter their physical orientation. All important morphology could be modeled due to this property. Furthermore, the concept of three-dimensional “whole heart acquisition” allows for acquisition and subsequent visualization of any desired plane independent of the whims of the user.
Despite high quality magnetic resonance images, blurring produced by residual motion, along with blurring and regional variation in the intensity of the images, frequently prevented automatic colouring, and thus contouring, of the anatomic structures. When the computer derived segmentation proved incomplete, manual corrections were required. Although this could often be done swiftly, validation could take several hours to be complete. Such validation of the computed contours, nonetheless, is of outmost importance, since their shape and colour will be reflected exactly in the virtual model. This is particularly true when the model is used for clinical decision-making. Final validation can rarely be performed by a technician alone, but requires close collaboration with the clinician. Further development of scanning protocols and software, coupled with extended experience with these techniques, will certainly reduce significantly the time required for manual processing, ultimately making the model available rapidly after the examination.
Displaying magnetic resonance images three-dimensionally is clearly appealing, but the currently available systems each have drawbacks. Compromises have to be made when deciding which format to employ. Maximum intensity projections are generally computed from contrast-enhanced angiograms, with a high degree of suppression of structures outside the contrast-enhanced blood pool. Based on raw data, they only require very limited post processing, and are easily rendered. Maximum intensity projections, however, are two-dimensional. Only by rotating the data can a pseudo three-dimensional impression be obtained. Their major limitation is the lack of intrinsic visualization of the heart. Volume rendering is a true three-dimensional technique adopted much more easily by the inexperienced investigator. To obtain sufficient tissue contrast for the rendering, it is usually based on raw, contrast-enhanced, angiographic data. If so, visualization of the inner aspects of the heart is inaccurate due to the non-triggered nature of the sequence. A surface rendered model is also truly three-dimensional. It is most often used when the contrast of the images is not sufficient for volume rendering. In our setup, we used surface rendering for the electrocardiographically triggered, non-contrast-enhanced acquisitions to visualize both intracardiac and vascular structures. Time-consuming and subjective manipulation of the data is generally required due to non-optimal contrast of the images. Great care must be taken to make the interpretation of the images as objective as possible. Due to the more time-consuming aspect of this format for display, it has previously been considered unsuitable for clinical purposes.3 These problems however, are expected to become less important with future improvements in resolution, and contrast, of the images and the robustness of imaging protocols. The current implementation of isotropic steady state free precession sequences is a major step forward in this respect. Generally, images of robust quality were obtained at the lowest resolution with this sequence. For the highest resolution used, the repetition time of 4.2 ms is at the upper limit. When we tried to obtain even higher resolution, and consequently longer repetition times, serious susceptibility artifacts started to appear. Future improvements in gradient strength, and magnetic field homogeneity, should overcome these limitations. In the patients we studied, no artifacts were seen related to stenotic flows, but this is likely to be an issue for the higher resolutions scans in patients with tight stenoses. Likewise, we created no banding artifacts.
Effective virtual exploration of a generated model of a congenital malformed heart demands the ability to zoom, rotate, and move towards interesting details in realtime. We have developed dedicated software to achieve this goal. An intuitive interface based on physical gestures inside the model has proved very effective in maintaining the overview, while at the same time allowing the user to grab and closely examine any interesting detail, whether on the surface of the heart or within the cardiac cavities and great vessels. An online movie is provided for the reader to examine (www.greenwich-medical.co.uk). To investigate the inner aspects of a model while still positioned outside, a cutter was developed. The cutting plane was chosen in real-time by the position and orientation of the hand. This feature was used to generate Figures 7 and 8. The selected plane could also be mapped with the plane of the corresponding magnetic resonance image to compare the generated model to the underlying data for purposes of validation if in doubt about a certain feature of the model.
The colouring scheme provided a visual aid when exploring the model. It presented directly to the viewer what generally was considered to be the structure of the morphologically left and right heart as the data was segmented and validated. Highlighting in purple the regions where red and blue met helped to draw attention to these locations, albeit adding complexity and segmentation effort. Whether colouring, compared to a monochrome model, offers any benefit to the clinician remains to be determined.
The current status of three-dimensional magnetic resonance imaging makes it of particular clinical importance for the growing number of adults with complex congenital cardiac malformations in whom transthoracic echocardiography often provides only suboptimal imaging. Transoesophageal echocardiography provides high quality imaging, but requires sedation or general anesthesia. Furthermore, the times needed for echocardiographic examination will remain static, so that echocardiography may not remain the most important imaging technique in many of these patients. Echocardiography, nevertheless, offers the most integrated display of structure, function and flow, and on-line three-dimensional imaging is now available on standard echocardiography platforms. It seems reasonable to combine the advantages and disadvantages of the available modalities, aiming at getting the most important information for the patient. A major limitation in the reconstruction as presented here is difficulty in delineating very thin structures such as valves and tendinous cords. Valvar structures can, however, be located in new magnetic resonance image sequences.14 Also, integration of quantitative information on flow,15 or even a full three-dimensional description of the flow field in the model,16 will add considerably to its usability. The future impact of this new technique remains unknown, but the prospect is to have a non-invasive, rapid, and versatile technique that will improve clinical decision-making. The patients illustrated here were typical ones who, in due course, would be standard candidates for three-dimensional reconstructions. Virtual three-dimensional imaging will soon provide clinicians with superior means of understanding the spatial relations in complex congenital cardiac malformations, and offer an optimal means of presenting specific issues concerning treatment to patients and relatives.
Acknowledgements
We thank the Danish Heart Foundation for (grant # 01-2-3-27A-22924), the Danish Medical Research Council for (grant # 28809), and the Danish Agency for Trade and Industry which, (through EUREKA project 2061; INCA-MRI), helped fund this project.
References
Laschinger JC, Vannier MW, Gutierrez F, et al. Preoperative three-dimensional reconstruction of the heart and great vessels in patients with congenital heart disease. J Thorac Cardiovasc Surg 1988; 96: 464–473.Google Scholar
Wick GW III. Three- and four-dimensional visualization of magnetic resonance imaging data sets in pediatric cardiology. Pediatr Cardiol 2000; 21: 27–36.Google Scholar
Sørensen TS, Therkildsen SV, Makowski P, Knudsen JL, Pedersen EM. A new virtual reality approach for planning of cardiac interventions. Artif Intell Med 2001; 22: 193–214.Google Scholar
Pruessmann KP, Weiger M, Scheidegger MB, Boesiger P. SENSE: Sensitivity Encoding for Fast MRI. Magn Reson Med 1999; 42: 952–962.Google Scholar
Fuchs F, Laub G, Othomo K. TrueFISP-technical considerations and cardiovascular applications. Eur J Radiol 2003; 46: 28–32.Google Scholar
Wang Y, Rossman PJ, Grimm RC, Riederer SJ, Ehman RL. Navigator-based real-time respiratory gating and triggering for reduction of respiration effects in three-dimensional coronary MR imaging. Radiology 1996; 198: 55–60.Google Scholar
Botnar RM, Stuber M, Danias PG, Kissinger KV, Manning WJ. Improved coronary artery definition with T2-weighted, free-breathing, three-dimensional coronary MRA. Circulation 1999; 99: 3139–3148.Google Scholar
Geva T, Greil GF, Marshall AC, Landzberg M, Powell AJ. Gadolinium-enhanced 3-dimensional magnetic resonance angiography of pulmonary blood supply in patients with complex pulmonary stenosis or atresia: comparison with x-ray angiography. Circulation 2002; 106: 473–478.Google Scholar
Vincent L, Soille P. Watersheds in digital spaces: an efficient algorithm based on immersion simulations. IEEE Trans Pattern Anal Mach Intell 1991; 13: 583–598.Google Scholar
Meyer F, Beucher S. Morphological Segmentation. J Visual Commun Image Representation 1990; 1: 21–46.Google Scholar
Barquet G, Sharir M. Piecewise-linear interpolation between polygonal slices. Comp Vis Image Understanding 1996; 63: 251–272.Google Scholar
Okuda S, Kikinis R, Geva T, Chung T, Dumanli H, Powell AJ. 3D-shaded surface rendering of gadolinium-enchanced MR angiography in congenital heart disease. Pediatr Radiol 2000; 30: 540–545.Google Scholar
Kozerke S, Scheidegger MB, Pedersen EM, Boesiger P. Heart motion adapted cine phase-contrast flow measurements through the aortic valve. Magn Reson Med 1999; 42: 970–978.Google Scholar
Beerbaum P, Korperich H, Barth P, Esdorn H, Gieseke J, Meyer H. Noninvasive quantification of left-to-right shunt in pediatric patients: phase-contrast cine magnetic resonance imaging compared with invasive oximetry. Circulation 2001; 103: 2476–2482.Google Scholar
Kozerke S, Hasenkam JM, Pedersen EM, Boesiger P. Visualization of flow patterns distal to aortic valve prostheses in humans using a fast approach for cine 3D velocity mapping. J Magn Reson Imaging 2001; 13: 690–698.Google Scholar
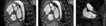
The two leftmost images show samples from two three-dimensional steady state free precession acquisitions, both from volumes with isotropic voxels. The resolution is 2.2 mm3 (left, sagittal view) and 1.4 mm3 (middle, sagittal view). The rightmost image (coronal view) shows a typical slice from a contrast-enhanced magnetic resonance angiography.

The left image shows the unprocessed, high resolution, steady state free precession image sample from Figure 1 (SSFP 1.4 mm sagittal view). The middle image depicts the computed colouring. In blue it shows the right ventricle, and the right pulmonary artery. In red, it shows the aortic root, the aortic arch and descending aorta, as well as the left atrium. The right image shows the resulting contours, from which the virtual model is built.

The contours resulting from the segmentation are layered and connected to make up a three-dimensional wireframe of triangles. The individual contours can be identified as lying in planes parallel to the shown slice. The wireframe is lit and shaded and then visually perceived as a smooth three-dimensional surface. The insert highlights the transition from contours to triangles.

Stereoscopic glasses bring the virtual model “out of the screen” to obtain a full three-dimensional understanding. Styluses track the position and orientation of each hand, shown with yellow jacks in the model, and provide input for a gesture-based interaction interface.

When an isotropic protocol is used for acquisition, the volume can be resliced arbitrarily. The resulting resolution of the images is not dependant on the angulation of the slices in the volume.

The posterior view of our first patient shows the aorta (AO), left atrium (LA), left ventricle (LV), the pulmonary trunk (PUL), and the Blalock shunt (B-SHUNT). The right pulmonary artery (RPA) is seen, whereas no left pulmonary artery was found. IVC: inferior caval vein; RV: right ventricle; SVC: superior caval vein.

The heart of our first patient has been opened to show both internal aspects (light shaded) and external aspects (dark shaded). The right view (left side panel) shows the right ventricle (RV), the left ventricle (LV), and the right atrium (RA). Also, the outflow tracts of the right ventricle are seen (AO, PUL). A circle marks the ventricular septal defect (VSD). The inferior view (right side panel) highlights the ventricular septal defect as seen looking from the left ventricle towards the right ventricle. The aortic root is visible through the defect.

The heart of the second patient is seen from anterior- (top left), inferior- (top right), and posterior views (bottom). The anterior view shows the aorta (AO) arising from the trabeculated right ventricle (RV), and the pulmonary trunk (PUL) from the left ventricle (LV). On the inferior view, both ventricles have been cut open, the inside shown with light shading. The pulmonary trunk and the entry of the systemic venous pathway (SVP) are seen within the left ventricle. From the posterior view, the left atrium (LA) has been cut open to visualize the stenotic pulmonary venous pathway (marked with a circle). Also the superior- (SVC), and inferior caval veins (IVC) are shown. LPV: left pulmonary vein; RLPV: right lower pulmonary vein; RUPV: right upper pulmonary vein.

The anterior view (left) shows the left ventricle (LV) of the third patient, and a hypoplastic right ventricle (RV). The aorta (AO) exits from the right ventricle, and a circle marks the reconstructed ascending aorta and aortic arch subsequent to the first stage of the Norwood procedure. On the posterior view (right), the white circle marks the stenotic part of the left pulmonary artery (LPA), and the yellow circle marks the superior cavo-pulmonary connection. The green circle highlights the atrial septal defect seen as the purple rim.

The heart of our fourth patient is seen from the posterior (left side panel) and anterior (right side panel) aspects. The course of the pulmonary veins and arteries can easily be seen. The right upper pulmonary vein (RUPV) drains directly to the brachiocephalic vein. The Blalock-Taussig shunt (BT-SHUNT) is clearly identified. The anterior view shows the aorta (AO) and partly hidden, the pulmonary trunk, both arising from the right ventricle (RV). The atrioventricular septal defect is shown as a purple rim. LLPA: left lower pulmonary artery; LLPV: left lower pulmonary vein; LUPA: left upper pulmonary artery; LUPV: left upper pulmonary vein; RLPA: right lower pulmonary artery; RLPV: right lower pulmonary vein; RUPA: right upper pulmonary artery.

Three different techniques are shown for rendering the images acquired from our first patient, a surface rendered model (left), volume rendered data (middle), and a maximum intensity projection (right).
 You have
Access
- 12
- Cited by