Implications
Variable eating quality is a major factor in declining beef consumption. In Australia, this is addressed with Meat Standards Australia (MSA), which uses carcass measurements to deliver an individual eating quality guarantee. In contrast to Australia, young bulls and dairy breeds are very important for European beef production. If a similar system was to be used in Europe, it must take these types of production into account. This study found that variation in eating quality due to breed and sex is not completely explained by the current MSA model, and would therefore need separate adjustments in an equivalent European model.
Introduction
The inability of consumers to reliably select beef of a consistent quality is seen as a major factor in the global decline in beef consumption (Morgan et al., Reference Morgan, Wheeler, Koohmaraie, Savell and Crouse1991; Polkinghorne et al., Reference Polkinghorne, Watson, Thompson and Pethick2008a). In Australia, this issue is being addressed with the MSA system. Through a unique ‘cut by cooking method’ eating quality prediction model, MSA uses carcass traits to deliver beef to consumers with an eating quality guarantee (Polkinghorne et al., Reference Polkinghorne, Watson, Thompson and Pethick2008a and Reference Polkinghorne, Thompson, Watson, Gee and Porter2008b; Watson et al., Reference Watson, Gee, Polkinghorne and Porter2008b). Such a system to guarantee beef eating quality would be well accepted by European beef consumers (Verbeke et al., Reference Verbeke, Van Wezemael, de Barcellos, Kügler, Hocquette, Ueland and Grunert2010), and would also enable products within such a system to command a premium price (Lyford et al., Reference Lyford, Thompson, Polkinghorne, Miller, Nishimura, Neath, Allen and Belasco2010).
At present, only females and castrated males have been tested with MSA protocols and are eligible for grading with the MSA system (Polkinghorne et al., Reference Polkinghorne, Watson, Thompson and Pethick2008a). However, young bulls form an important part of many different production systems, particularly in Europe. In addition, a large proportion of beef production in Europe is from dairy breeds and dairy crosses as a by-product of the dairy industry (Hocquette and Chatellier, Reference Hocquette and Chatellier2011). Therefore, for any eating quality prediction system to be relevant in these markets, meat from bulls and dairy breeds would also need to be considered.
There are a number of differences between bulls, heifers and steers that have been identified within the beef production industry. It is well established that bulls grow more rapidly, are more feed efficient and produce higher yielding carcasses with less fat than steers (Field, Reference Field1971). Female cattle also have more favourable genes for fat deposition and a hormonal profile that directly influences fatty acid proportion and distribution in muscles (Venkata Reddy et al., Reference Venkata Reddy, Sivakumar, Jeong, Woo, Park, Lee, Byun, Kim, Cho and Hwang2015). Along with the effect on lean meat yield, it is likely that these differences in adiposity would have an effect on eating quality. Many studies have shown increased marbling level, or intramuscular fat (IMF) is associated with greater tenderness, juiciness, flavour liking and overall liking (Thompson, Reference Thompson2004; Chriki et al., Reference Chriki, Renand, Picard, Micol, Journaux and Hocquette2012). Therefore, the lower levels of IMF and lower marbling scores of bulls (Drayer, Reference Drayer2003; Choat et al., Reference Choat, Paterson, Rainey, King, Smith, Belk and Lipsey2006; Chriki et al., 2013) would result in a lower eating quality. In addition to the sex effect on adiposity, the tenderness of meat from female cattle would be positively affected by the smaller fibre diameter and, in some cases, less collagen than meat from bulls (Boccard et al., Reference Boccard, Naudé, Cronje, Smit, Venter and Rossouw1979; Seideman et al., Reference Seideman, Cross and Crouse1989; Chriki et al., 2013). These differences, combined with the increased IMF effectively diluting the collagen within the muscle (Lee et al., Reference Lee, Henricks, Skelley and Grimes1990), are reflected by the lower shear force values for meat from heifers (Morgan et al., Reference Morgan, Savell, Hale, Miller, Griffin, Cross and Shackelford1993; Chriki et al., 2013) and higher tenderness scores (Dikeman et al., Reference Dikeman, Reddy, Arthaud, Tuma, Koch, Mandigo and Axe1986; Morgan et al., Reference Morgan, Savell, Hale, Miller, Griffin, Cross and Shackelford1993; Węglarz, Reference Węglarz2010). However, these results are not consistently reported in the literature and other studies have also found no difference in shear force (Drayer, Reference Drayer2003) and scores for tenderness and flavour (Mandell et al., Reference Mandell, Gullett, Wilton, Kemp and Allen1997) between bulls, heifers and steers. Therefore assuming that the key difference between the sexes will be marbling, the current MSA model, whereas not having a separate adjustment for bulls, does account for the effect of marbling on eating quality and therefore will adequately describe the eating quality of bulls when classed as steers in the model.
As with sex, the amount, composition and distribution of adipose tissue within a carcass is one of the most distinct differences between beef and dairy breeds. Holsteins tend to deposit marbling at a younger age and have less subcutaneous fat (Garcia-de-Siles et al., 1977; Lizaso et al., Reference Lizaso, Beriain, Horcada, Chasco and Purroy2011) than beef breeds. This led to higher juiciness and flavour scores for the loins of Holsteins when compared with a beef breed (Lizaso et al., Reference Lizaso, Beriain, Horcada, Chasco and Purroy2011). As adipose tissue is late maturing, the higher IMF levels may be related to the earlier age at maturity exhibited by dairy breeds (Lawrie, Reference Lawrie1985). However, an earlier age at maturity may also be the cause of increased collagen and reduced collagen solubility seen in the loin of Holsteins when compared with beef breeds (Boccard et al., Reference Boccard, Naudé, Cronje, Smit, Venter and Rossouw1979; Christensen et al., Reference Christensen, Ertbjerg, Failla, Sañudo, Richardson, Nute, Olleta, Panea, Albertí, Juárez, Hocquette and Williams2011; Lizaso et al., Reference Lizaso, Beriain, Horcada, Chasco and Purroy2011). Nonetheless, these differences in collagen did not translate to any differences in shear force (Christensen et al., Reference Christensen, Ertbjerg, Failla, Sañudo, Richardson, Nute, Olleta, Panea, Albertí, Juárez, Hocquette and Williams2011; Lizaso et al., Reference Lizaso, Beriain, Horcada, Chasco and Purroy2011). Furthermore, many studies have failed to find any difference in sensory scores or consumer acceptability between dairy and beef breeds raised under similar circumstances (Mills et al., Reference Mills, Comerford, Hollender, Harpster, House and Henning1992; Christensen et al., Reference Christensen, Ertbjerg, Failla, Sañudo, Richardson, Nute, Olleta, Panea, Albertí, Juárez, Hocquette and Williams2011; Lizaso et al., Reference Lizaso, Beriain, Horcada, Chasco and Purroy2011). In contrast, McKay (Reference McKay1970) found no difference in collagen content between breeds, despite the beef (Hereford) samples scoring higher for tenderness and overall preference than Holstein samples. Similarly, Boccard et al. (Reference Boccard, Naudé, Cronje, Smit, Venter and Rossouw1979) found that beef breed samples had higher collagen solubility and tenderness scores than dairy breed samples. It is likely that the majority of the variation in the literature can be explained by differences in feeding regimes and the age of the animal at slaughter. Consequently, assuming that the difference between breeds is attributable to IMF and growth path differences, the current MSA model should have the capacity to account for these differences with an adjustment for both marbling score and growth path as described by ossification score and carcass weight.
Therefore, based on the balance of the evidence available, we hypothesise that meat from bulls would have lower consumer scores than heifers and steers, and that this will be largely driven by differences in marbling. As such the MSA model should accurately predict the eating quality of bulls when classed as steers. In addition, we hypothesise that dairy breeds will exhibit moderately increased eating quality mediated through higher levels of IMF and different growth paths to slaughter. Therefore, given that the MSA model contains adjustments for both marbling score and growth path (ossification and carcass weight), these differences would therefore also be adequately explained by the MSA model.
Material and methods
Animals and muscle samples
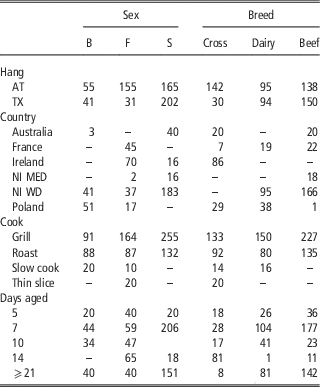
The data set was formed through combining the records of animals selected for a number of specific, smaller, experiments. As a result this data set provides across-section of European cattle types (Table 1). The Polish carcasses were processed at three facilities situated in the north-east of Poland. The Irish carcasses were processed at two commercial abattoirs and one pilot-scale abattoir. The French carcasses were processed at a single facility in the west of France. The carcasses from Northern Ireland were processed at five different facilities distributed across the region. All cattle travelled <5 h to reach the abattoirs. The cattle were slaughtered commercially according to standard practice in each country. Post slaughter carcasses were either hung by the Achilles tendon or they underwent tenderstretching, indicating they were instead hung by the obturator foramen or the pelvic ligaments. Tenderstretching was only performed at a subset of the abattoirs. There was a range of 5 to 28 days postmortem ageing for the samples, and all samples were wet aged.
Number of carcasses from which muscle samples were taken within subgroups of the data set

B=bull; F=female; S=steer; Cross=beef and dairy breed cross; Dairy=dairy breed; Beef=beef breed; AT=Achilles hung; TX=tenderstretch hung; NI MED=the carcasses from Northern Ireland from which meat samples were prepared to a medium doneness; NI WD=the carcasses from Northern Ireland from which meat samples were prepared to a well-done doneness; Days aged=the number of days a meat sample is aged postmortem before preparation.
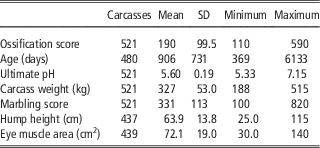
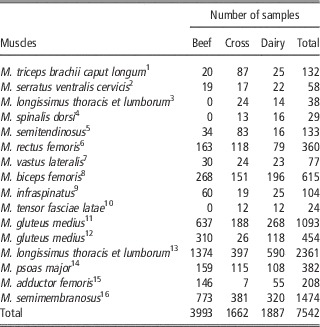
All carcasses were graded by personnel trained in MSA and United States Department of Agriculture (USDA) meat grading according to standard MSA protocols for characteristics such as ossification (an estimate of maturity), marbling and ultimate pH. Ultimate pH was recorded at 24 h post slaughter. Ossification score was measured following the guidelines from the USDA (1997). It is a visual measure of the calcification in the spinous processes in the sacral, lumbar and thoracic vertebrae and provides a scale between 100 and 590, in increments of 10 for MSA, and is an assessment of physiological age of a bovine carcass (Anonymous, 2005). Marbling score is a measure of the fat deposited between individual fibres in the rib eye muscle ranging from 100 to 1100 in increments of 10. Marbling was assessed at the quartering site of the chilled carcass and was calculated by evaluating the amount, piece size and distribution of marbling in comparison with the MSA reference standards (Anonymous, 2005; MLA, 2006). Ultimate pH was recorded at 24 h post slaughter. All cattle were growth-promotant free as these are prohibited in the European Union. There was a wide range in the other carcass traits measured such as marbling score and carcass weight; however, due to the constraints of such an observational study not all measurements were recorded for all carcasses (Table 2). A total of 18 different muscles were collected, though not all muscles were collected from each carcass (Table 3).
Number of carcasses and the raw maximum, minimum, mean and SD

Ultimate pH, ossification and marble score were recorded as standard Meat Standards Australia measurements by trained graders. The number of carcasses varies for each measure because not all measurements were recorded for all carcasses.
Different muscles tested by breed class

1 Blade (BLD096).
2 Chuck (CHK078).
3 Cube roll (CUB045).
4 Cube roll (CUB081).
5 Eye round (EYE075).
6 Knuckle (KNU066).
7 Knuckle (KNU099).
8 Silverside (OUT005).
9 Blade (OYS036).
10 Rump tail (RMP087).
11 Eye of rump centre (RMP131).
12 Eye of rump side (RMP231).
13 Striploin (STR045).
14 Tenderloin (TDR062).
15 Topside (TOP001).
16 Topside (TOP073).
There was an uneven distribution of cattle and samples amongst the effects controlled for in this study (Tables 1 and 3). This distribution within the data set reflects the differences in beef production/consumption in the different countries. Animal breed was divided into three categories: beef breeds, dairy breeds and crosses between the beef and dairy breeds. The beef breeds were made up of Angus (six), Hereford (three), Murray grey (19), Shorthorn (two), Belted Galloway (one), Belgian blue (26), Charolais (99), Blonde d’Aquitaine (11), Limousin (48), Montbeliarde (one), Romagnola (one) and Simmental (10). The dairy breeds were made up of Holstein (150), Ayrshire (one) and Normande (four). The cross-breeds were crosses between the previously mentioned beef and dairy breeds, with varying percentages of beef and dairy genetics. In total, 16 different muscles were represented in the 7542 different samples; however the number and type of muscles sampled varied between carcasses, countries and other factors in the study (Tables 1 and 3).
Meat preparation and consumer panels
Meat preparation and consumer assessment of eating quality for the four cooking methods were performed according to protocols for MSA testing (Anonymous, 2008; Watson et al., 2008a). The grill cooking method was performed in all countries and the roast cooking method was performed in all countries except for France. In Northern Ireland the roast and grill samples were prepared to either a medium or a well-done cooking doneness. All other samples were prepared to a medium cooking doneness. The slow cooking method was only used in Poland and the Korean BBQ was tested only in Ireland. As the samples were prepared in batches, each consumer only scored samples prepared by a single cooking method. For each of the four cooking methods each consumer received seven portions: the first portion (a ‘link’ sample) was derived from either a generic striploin or rump muscle and expected to be of average quality – the sensory scores for this portion were not part of the final statistical analysis. The remain six portions of beef tested by the consumer were from one of the experimental samples. These samples were served in accordance with a 6 x 6 Latin square, designed to present each consumer with a diverse quality range and to balance potential order or halo effects.
In total, there were 69 770 consumer responses, with each individual consumer giving six separate responses meaning ~11 300 consumers or people. The consumer demographics are explained in further detail by Bonny et al. (Reference Bonny, Gardner, Pethick, Legrand, Polkinghorne and Hocquette2015). Consumers scored meat from their country of origin and were sourced through both commercial consumer testing organisations and local clubs and charities. They were selected to reflect the general population with the only requirement being that they considered meat an important part of their diet. Consumers scored samples for tenderness, juiciness, flavour liking and overall liking, by making a mark on a 100-mm line scale, with the low end of the scale representing a negative response and the high end of the scale representing a positive response. For a more detailed description of the testing procedures see Anonymous (2008).
Meat quality (MQ4) score
Within each country each muscle from each carcass was assessed by 10 individual untrained consumers. The tenderness, juiciness, flavour liking and overall liking values were weighted and combined to create a single MQ4 score. The weightings were calculated using a discriminant analysis, as performed by Watson et al. (Reference Watson, Gee, Polkinghorne and Porter2008a) and are 0.3×tenderness, 0.1×juiciness, 0.3×flavour liking, 0.3×overall liking. The highest and lowest two scores for each trait and MQ4 score were removed and an average was calculated for the remaining six scores. These clipped scores were aligned with the muscle, carcass and animal traits for analysis. There is a high correlation between all four sensory scores with a minimum partial correlation coefficient between any of the scores of 0.66 calculated on a subset of the data (Bonny et al., Reference Bonny, Pethick, Legrand, Wierzbicki, Allen, Farmer, Polkinghorne, Hocquette and Gardner2015). The predicted MQ4 scores were calculated using the current 2009 MSA model with the bulls being classed as steers.
Statistical analysis
Both the actual consumer observed MQ4, and the difference between the actual and the predicted MQ4, from the current MSA model (SP2009), were analysed using a linear mixed effects model (SAS v9.1). Initially, a base model was established which included fixed effects for carcass hanging method, cooking method, muscle type, sex, country and breed. Postmortem ageing period in days was included as a covariate. The samples from Northern Ireland were split into two groups such as: NI MED, the samples from Northern Ireland from which were prepared to a medium doneness and NI WD, the samples from Northern Ireland from which were prepared well done. These two groups of samples were classed as separate countries in the statistical models, that is NI MED and NI WD, therefore encompassing the variation due to the different cooking doneness and negating the need for a cooking doneness term within the model. Animal identification number within carcass source country, kill group (animals slaughtered on the same day at the same abattoir) and consumer country were included as random terms. Terms in the model and their first-order interactions were removed in a step-wise fashion is non-significant.
The predicted means for the sexes and breeds were compared using the LSDs, generated using the PDIFF function in SAS (SAS v9.1). The DF was determined using the Kenward and Rodger technique (SAS v9.1). For the model with the difference between the actual MQ4 and the MSA-predicted MQ4 as the dependent variable, significant effects in the model indicated that the accuracy of the prediction differed between subgroups with numbers further away from 0, indicating lower prediction accuracies.
Results
Actual MQ4
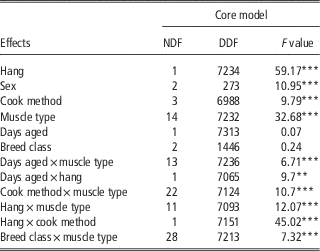
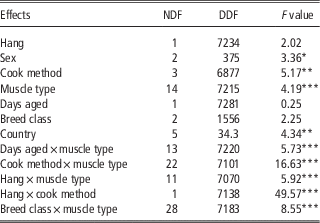
The F values for the core model are presented in Table 4. Cooking method, muscle type and sex were significant main effects in the model and the sex effect did not vary within any of the other terms in the model. The predicted mean of the actual MQ4 of samples from bulls (52.1±1.40) was lower (P<0.05) than both the females (54.4±1.32) and steers (56.0±1.32), which did not differ from each other. When the covariates of marbling and ossification score were included in the model, the difference between sexes did not change.
F values for the core model predicting actual meat quality score (MQ4Footnote ^)

NDF=numerator degrees of freedom; DDF=denominator degrees of freedom.
^ MQ4 is a weighted combination (0.3, 0.1, 0.3, 0.3) of four sensory scores: tenderness, juiciness, flavour liking and overall liking as scored by untrained consumers.
**P<0.01, ***P<0.001.
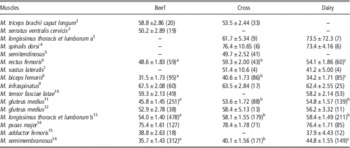
There were marked differences between breeds (breed×cut interaction, P<0.05; Table 4), but this was only evident for five out of the 16 muscles tested (Table 5). Balanced comparisons for breed could only be made within subgroups of cooking method and hang method and so only the grilled samples from carcasses Achilles hung carcasses are reported. As the relationship between breed and MQ4 did not vary between cooking and carcass hang methods (Table 4), the results presented can be considered representative of all other cooking and carcass hang methods in the study. In each of the five muscles where differences were evident, beef breeds had MQ4 scores that were on average about 7 units lower than the dairy and/or cross-breeds. Alternatively, the comparison between dairy and cross-breeds varied across the muscles. In two cases, for the m. biceps femoris and the m. rectus femoris, the dairy breeds had ~6 units lower eating quality (P<0.05) than the cross-breeds, whereas for the m. gluteus medius and the m. longissimus thoracis et lumborum there were no differences between dairy and cross-breeds. Alternatively, for the m. semimembranosus the dairy breeds had 5 units higher eating quality (P<0.05) than the cross-breeds. None of the covariates tested had any effect on the differences between breed in the model.
Predicted means (±SE) of the actual meat quality score (MQ4Footnote ^) for each of the muscles within each breed for the grilled samples from Achilles hung carcasses (n)

–=cells without data.
a,b,cValues within a row with different superscripts differ significantly at P<0.05.
^ MQ4 is a weighted combination (0.3, 0.1, 0.3, 0.3) of four sensory scores: tenderness, juiciness, flavour liking and overall liking as scored by untrained consumers.
1 Blade (BLD096).
2 Chuck (CHK078).
3 Cube roll (CUB045).
4 Cube roll (CUB081).
5 Eye round (EYE075).
6 Knuckle (KNU066).
7 Knuckle (KNU099).
8 Silverside (OUT005).
9 Blade (OYS036).
10 Rump tail (RMP087).
11 Eye of rump centre (RMP131).
12 Eye of rump side (RMP231).
13 Striploin (STR045).
14 Tenderloin (TDR062).
15 Topside (TOP001).
16 Topside (TOP073).
MSA prediction accuracy
The F values from the core model predicting the difference between the predicted and the actual MQ4 are presented in Table 6. As with the model predicting the actual MQ4, breed interacted with muscle type and cooking method, muscle type and sex were significant as main effects. The predicted mean of the actual MQ4 of samples from bulls (−3.82±1.45) was smaller (P<0.05) than the females (−1.25±1.38). Steers (−1.89±1.34) did not differ from bulls and females. The small negative values indicate that in all cases the MQ4 was slightly over predicted by the MSA model.
F values and DF for the core model analysing the difference between the predicted and actual meat quality score (MQ4Footnote ^)

NDF=numerator DF; DDF=denominator DF.
^ MQ4 is a weighted combination (0.3, 0.1, 0.3, 0.3) of four sensory scores: tenderness, juiciness, flavour liking and overall liking as scored by untrained consumers; predicted MQ4 was calculated with carcass traits using the Meat Standards Australia model.
*P<0.05, **P<0.01, ***P<0.001.
When ultimate pH was included as a covariate in the model, the difference between the bulls and either the females or the steers was increased by ~1 MQ4 point (data not shown). There was no change in the difference between the females and the steers. Similarly, when marbling score was added to the model as a covariate, the difference between the bulls and the females or the steers increased by ~1.5 MQ4 points (data not shown) suggesting that the distribution of marbling score and pH in this data set actually masked differences between the sexes and that the coefficients for marbling score and ultimate pH in the MSA model are not adequately describing the influence of these carcass traits on the eating quality of meat from bulls. There was no change in the difference between the females and the steers. No other covariates tested had an effect on sex in the model.
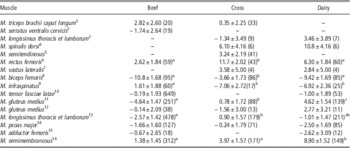
Similar to the previous model predicting the actual MQ4, balanced comparisons for the prediction accuracy of the different breed categories could only be made within subgroups of cooking method and hang method. As with the previous model, only the grilled samples from carcasses Achilles hung are reported (Table 7). As the relationship between breed and MSA prediction accuracy did not vary between cooking and carcass hang methods, the results presented can be considered representative of all other cooking and carcass hang methods in the study. The degree of under or over prediction of the MSA model varied between muscles (P< 0.05; Table 6), with positive values indicating an under prediction of the actual MQ4 score by the MSA model and negative values indicating an over prediction by the MSA model. The ability of the MSA model to predict eating quality also differed between the breeds (P<0.05; Table 6) for six out of the 16 muscles tested (Table 7). For the muscles with significant effects, the beef breeds generally had lower scores (P< 0.05) than the cross and dairy breeds, by between 2.5 and 7.5 units. This is evidenced by the predicted means for the beef breeds which were either closer to 0 where the MSA system had under predicted the muscles, or more negative where the MSA system had over predicted the muscles. The contrast to this trend was for the m. infraspinatus where the beef breed had eating quality scores about 8.5 units higher than the cross or dairy breeds. None of the covariates tested had any effect on the prediction of breed in the model.
Predicted means (±SE) of the difference between the actual and the predicted meat quality score (MQ4Footnote ^) for each of the muscles within each breed for the grilled samples from Achilles hung carcasses (n)

–=cells without data.
a,b,cValues within a row with different superscripts differ significantly at P<0.05.
^ MQ4 is a weighted combination (0.3, 0.1, 0.3, 0.3) of four sensory scores: tenderness, juiciness, flavour liking and overall liking as scored by untrained consumers; predicted MQ4 was calculated with carcass traits using the Meat Standards Australia model.
1 Blade (BLD096).
2 Chuck (CHK078).
3 Cube roll (CUB045).
4 Cube roll (CUB081).
5 Eye round (EYE075).
6 Knuckle (KNU066).
7 Knuckle (KNU099).
8 Silverside (OUT005).
9 Blade (OYS036).
10 Rump tail (RMP087).
11 Eye of rump centre (RMP131).
12 Eye of rump side (RMP231).
13 Striploin (STR045).
14 Tenderloin (TDR062).
15 Topside (TOP001).
16 Topside (TOP073).
Discussion
Sex
Aligning with our hypothesis, samples from bulls had lower eating quality scores than samples from females and steers. This effect was still present after correcting for marbling score, despite evidence that this was likely to be due to differences in IMF (Drayer, Reference Drayer2003; Choat et al., Reference Choat, Paterson, Rainey, King, Smith, Belk and Lipsey2006; Chriki et al., 2013). Furthermore, it was not affected by correction for any of the other covariates tested in this study. This suggests that a more complex relationship exists between marbling, sex and eating quality than could be identified in this analysis, or that other factors which were not measured such as fibre diameter and/or collagen content may be driving this difference (Chriki et al., 2013).
Contrary to our hypothesis, the prediction accuracy for bulls, classed as steers within the MSA prediction model, was lower than for females. Our expectation that both sexes would be predicted with similar accuracy was based upon our assumption that IMF was the factor driving this difference, which would have been accounted for by the marbling score adjustment in the MSA model. Yet, contrary to this, a further correction of the MSA prediction accuracy model for either marbling score or ultimate pH actually increased the differences in the prediction accuracy between the sexes. This demonstrates that the distribution of marbling score and ultimate pH within this data set was actually masking or minimising the differences in prediction accuracy between the sexes. In the absence of differences in IMF driving the differences in eating quality, other factors such as variations in fibre diameter and collagen content could be playing a role (Boccard et al., Reference Boccard, Naudé, Cronje, Smit, Venter and Rossouw1979; Seideman et al., Reference Seideman, Cross and Crouse1989; Chriki et al., 2013). However, these findings indicate that even after accounting for differences in carcass traits, bulls still differ in eating quality when compared with females and steers and this would need to be taken into account when estimating the eating quality of meat sourced from bull carcasses. In addition, the coefficients used by the Australian MSA model for marbling score and ultimate pH do not exactly reflect the influence of these factors on eating quality in this data set. However, as a result of the relatively small subsample of data used in this experiment, additional data are required to properly elucidate the slope of these relationships for European consumers.
Within the data there was a suggestion of a reduced capacity of the meat from bulls to improve with ageing (data not shown), which could have resulted from differences in muscular calpastatin activity and rates of protein turnover between the sexes (Morgan et al., Reference Morgan, Savell, Hale, Miller, Griffin, Cross and Shackelford1993; Koohmaraie et al., Reference Koohmaraie, Kent, Shackelford, Veiseth and Wheeler2002). However, due to the structure of the data set comparisons of the ageing rate within bulls compared with the other sexes was confounded, usually by country. Therefore, to explore this comparison properly, future experiments should make this comparison using samples consumed within the same taste panel session.
Breed
Aligning with our hypothesis, dairy breeds generally had higher sensory scores than beef breeds, however this was for certain muscles only (Table 5). This agrees with the work of Lizaso et al. (Reference Lizaso, Beriain, Horcada, Chasco and Purroy2011), who found higher juiciness and flavour scores for the loins of Holsteins when compared with a beef breed. However, in contrast to previous work, this was not explained by marbling score, an estimate of IMF (Lizaso et al., Reference Lizaso, Beriain, Horcada, Chasco and Purroy2011), or any other of the covariates tested. Therefore, it is possible that other factors, such as collagen content or fibre type, are responsible for the difference seen in eating quality between the breeds (Boccard et al., Reference Boccard, Naudé, Cronje, Smit, Venter and Rossouw1979; Christensen et al., Reference Christensen, Ertbjerg, Failla, Sañudo, Richardson, Nute, Olleta, Panea, Albertí, Juárez, Hocquette and Williams2011; Lizaso et al., Reference Lizaso, Beriain, Horcada, Chasco and Purroy2011). Alternatively, this result may be due to the limitations of marbling score, which is measured on the striploin, to describe adiposity within the diverse range of muscles found over an entire carcass which differ in structure and function. This is evidence by work in beef (Brackebrush, 1991), and lamb (Anderson et al., 2015) which demonstrates considerable variation in IMF correlations between the loin muscle and other muscles throughout the carcass. Furthermore, differences in production methods and feeding regimes and age at slaughter present in this study would also complicate the results. Similar production and physiological differences are likely to be underpinning the eating quality differences between the dairy breeds and the cross-breeds (Table 5). However, as the percentage of beef or dairy genetics in the cross-breeds was not fixed in this study, it is likely to have led to the greater variability in the results.
Contrary to our hypothesis, the MSA model did not predict different breeds with equal accuracy and the difference in accuracy varied by muscle (Table 7). Where there were significant differences, the beef breeds had consistently lower predicted means than both the dairy and cross-breeds. Hence, the difference between breeds is not accounted for by the existing adjustments within the MSA model for factors such as marbling score, ossification, carcass weight or fatness. Furthermore, the difference in prediction accuracy between breeds was unchanged by any of the covariates tested in the model, demonstrating that the inaccuracy is not simply a case of needing to adjust the coefficients for these terms within the MSA model. It is important to note that the MSA model also varied in its prediction accuracy of individual muscles, therefore a combination of a muscle-based adjustment along with a single breed adjustment is required to raise all breeds and muscles to similar prediction accuracies.
Conclusion
The MSA beef quality prediction system in Australia improves consumer satisfaction by delivering beef of a consistent and guaranteed quality. It is well known that part of the variation in meat can be attributed to breed and sex, and the MSA model reflects this with adjustments for Bos indicus content and sex (heifer or steer). Bulls and dairy breeds are an important part of the beef industry in Europe and would need to be considered for any meat quality prediction system to be relevant. However, there is little information on the ability of the MSA model to predict bulls and dairy breeds. This study has identified that there are differences in eating quality between the sexes and breeds. Previous work has indicated that a proportion of the differences between the sexes and breeds can often be explained by factors such as marbling and maturity score, which are included in the MSA model. Eating quality differences were not able to be explained by simple relationships between breed, sex, ossification score and marbling or by the more complex eating quality prediction model in the MSA system, which encompasses a range of other carcass traits. However, the remaining differences in quality could be encompassed by further dairy breed and bull adjustments along with some optimisation of other coefficients such as marbling and ultimate pH. Therefore, with minor adjustments, a complex eating quality prediction system such as the MSA model is flexible enough to adequately describe eating quality within the European beef production system.
Acknowledgements
This research was supported by Meat and Livestock Australia and Murdoch University. Data were obtained through the financial contributions of the European research project ProSafeBeef (Contract No. FOOD-CT-2006-36241), the Polish ProOptiBeef Farm to Fork project funded by the EU Innovative (POIG.01.03.01-00-204/09), the French ‘Direction Générale de l’Alimentation’ and FranceAgriMer, the Irish Department of Agriculture Food and The Marine under the FIRM programme, and the Northern Ireland Department of Agriculture and Rural Development ‘Vision’ programme. Furthermore, this project would not have been possible without the practical support of the Association Institut du Charolais, the Syndicat de Défense et du promotion de la Viande de Boeuf de Charolles and the gourmet restaurants ‘Jean Denaud’ and representatives of the beef industry across Europe. The international travel required for this project has been funded by ‘Egide/Fast’ funds from the French and Australian governments, respectively (project no. FR090054) and by ‘Egide/Polonium’ funds from the French and Polish governments, respectively. The assistance and participation the Beef CRC and Janine Lau (MLA, Australia), Alan Gee (Cosign, Australia), Ray Watson (Melbourne University, Australia) and John Thompson (UNE) are also gratefully acknowledged.