Introduction
Stromatolites are laminated bio-sedimentary structures built by microorganisms, principally filamentous cyanobacteria. They exhibit the longest geological record of any type of fossil – from ca. 3.5 Ga through to the present. In addition to their palaeobiological importance to understanding the history of life, they represent a potentially rich reservoir of other information, such as length of day, obliquity, palaeolatitude and ancient tidal ranges (cf. Hofmann, Reference Hofmann1973).
Although cyanobacteria are usually implicated in stromatolite formation, many other organisms can contribute to the production of laminated, stromatolite-like structures. These organisms include a variety of different bacteria (Ley et al., Reference Ley, Harris, Wilcox and Spear2006), fungi (Bontognall et al., Reference Bontognali, D'Angeli, Tisato, Vasconcelos, Bernasconi, Gonzales and De Waele2016), protists such as diatoms (Winsborough and Golubic, Reference Winsborough and Golubić1987) and metazoans such as sponges (Pei et al., Reference Pei, Duda, Schoenig, Luo and Reitner2021). However, looking at the recent and fossil record, it is apparent that cyanobacteria are the dominant stromatolite builder.
The formation of a stromatolite is a complex process involving the development and lithification of a microbial mat – a cohesive fabric of microbes and sediment representing a complicated microbial ecosystem. The cohesiveness of a mat is largely due to extracellular polymeric substances (EPSs) secreted by the microbes, which bind all the components together. Microbial mats are microbiologically and metabolically diverse (e.g. Wong et al., Reference Wong, White and Visscher2018). For instance, Ley et al. (Reference Ley, Harris, Wilcox and Spear2006) recognized 752 species from 42 bacterial phyla. The vertically differentiated microbial communities in a mat follow chemical, nutrient and light gradients from the surface to depth within the mat (Visscher et al., Reference Visscher, Reid and Bebout1998; Prieto-Barajas et al., Reference Prieto-Barajas, Valencia-Cantero and Santoyo2018). Within the mat, following these gradients, recycling of compounds occurs (Paerl et al., Reference Paerl, Pinckney and Steppe2000). Growth at the surface of a mat is of obvious critical importance when addressing possible morphologies.
In addition to the microbiology and physico-chemical gradients, microbial mats must contend with and/or involve other factors that produce the stromatolite, such as carbonate precipitation, trapping and binding of sediment, diffusion of material down slopes, variations in sunlight, current, temperature, salinity and nutrient availability. Although, in general, all of these factors help shape the surface expression of the mat and hence the morphology of the stromatolite, we here assume that sunlight on the surface is a significant factor, an assumption supported by the fact that the surface is characteristically dominated by a community of cyanobacterial phototrophs. The filamentous cyanobacteria in these communities commonly orient perpendicularly to the growth surface during daylight hours (Petroff et al., Reference Petroff, Sim and Maslov2010; Berelson et al., Reference Berelson, Corsetti, Pepe-Ranney, Hammond, Beaumont and Spear2011), providing enhanced surface area conducive to trapping and binding of mineral precipitate in the direction normal to the surface.
There have been a number of attempts to explain stromatolite morphogenesis. Some early attempts were not mathematical, but looked for qualitative evidence of patterns in microstructure, macrostructure, lateral variation and depositional environments (e.g. Horodyski, Reference Horodyski1977; Semikhatov et al., Reference Semikhatov, Gebelein and Cloud1979). A few of them related morphology with microbiology in modern microbial mats (Logan et al., Reference Logan, Hoffman, Gebelein, Logan, Read, Hagan, Hoffman, Brown, Woods and Gebelein1974) and in ancient stromatolites (Awramik, Reference Awramik and Walter1976).
Numerous studies have applied mathematical modelling to the problem. Hofmann (Reference Hofmann1969) explored the use of different growth factors in producing geometric patterns in stromatolites and he modelled these by computer. As groundbreaking as this was, the paper only addressed final shapes, and did not deal specifically with morphogenesis. Since then, numerous mathematical studies have used the Kardar–Parisi–Zhang (KPZ) equation to model the growing surface of a stromatolite (e.g. Grotzinger and Rothman, Reference Grotzinger and Rothman1996; Batchelor et al., Reference Batchelor, Burne, Henry and Watt2000; Cuerno et al., Reference Cuerno, Escudero, García-Ruiz and Herrero2012). In its most general form, the KPZ equation can include the effects of vertical sedimentation, diffusive downhill spreading of sediment, surface-normal mineral precipitation, phototropic and surface-normal mat growth, surface tension effects in precipitation, uncorrelated random noise representing surface heterogeneity and environmental fluctuations (cf. Grotzinger and Knoll, Reference Grotzinger and Knoll1999). Much of that research focused on whether it could differentiate abiogenic from biogenic structures (cf. Grotzinger and Rothman, Reference Grotzinger and Rothman1996; Batchelor et al., Reference Batchelor, Burne, Henry and Watt2003, Reference Batchelor, Burne, Henry and Jackson2004). This is not a trivial issue. If stromatolite-like structures are found on Mars, it will of course be of profound importance to determine whether they are abiogenic or biogenic.
While all relevant phenomena must be considered in a general quest to understand stromatolite morphogenesis, in this work we primarily consider the implications of surface-normal growth of photosynthetic microbial populations and associated mineral precipitation. The surface of the microbial mat and its response to conditions at the surface determine the shape of the mat and therefore of the stromatolite. We also address phototropic growth (growth in the direction of direct irradiance) and show that it generates qualitatively similar morphologies to those of surface-normal growth. Our model is a form of the KPZ equation, but with only the surface normal growth term, or alternatively a phototropic growth term included.
Methods
A simplified surface growth model
The formation of stromatolites is a complex process involving the development of a diverse microbial community in the presence of a range of potential effects. The purpose of the present work is to consider the possible effects of variations in a single factor – irradiance – in the context of stromatolites dominated by either surface-normal growth or phototropic growth. A subtlety must be addressed: both of these types of growth are phototrophic (i.e. growth sensitive to the amount of light received). The distinctions we adopt between these terms are explained in detail below.
Growth rate as a function of irradiance
While dependent on many factors, numerous studies have shown (Sorokin and Krauss, Reference Sorokin and Krauss1958; Shear and Walsby, Reference Shear and Walsby1975; Van Liere and Walsby, Reference Van Liere, Walsby, Carr and Whitton1982; Eilers and Peeters, Reference Eilers and Peeters1988; Wolf et al., Reference Wolf, Picioreanu and van Loosdrecht2007) that photosynthetic activity of pelagic cyanobacteria (phytoplankton) is a strong function of irradiance at low lighting levels, increasing to a broad maximum at optimal irradiance, beyond which growth decreases (Fig. 1).
Schematic graph of phytoplankton growth rate versus irradiance. Following common practice, growth rate is indicated by population doublings per day. Irradiance is scaled to that which yields maximum growth (doubling). The rate increases rapidly at small irradiance, reaches a broad maximum, then exhibits a slower decline (adapted from Shear and Walsby (Reference Shear and Walsby1975) and others).

Physically, this is because as irradiance increases, the rate-limiting factor changes from the amount of light available to the rate of enzyme-catalysed reactions. Beyond optimal light levels, photosynthetic rates are depressed by photooxidation and photorespiration. While this functional behaviour was first recognized experimentally with pelagic organisms, it has also been applied to phototrophic biofilms, which Wolf et al. (Reference Wolf, Picioreanu and van Loosdrecht2007) define as light-driven microbial communities attached to a surface. Phytoplankton can secrete EPSs (Decho and Gutierrez, Reference Decho and Gutierrez2017) and thus functionally behave in a similar manner to biofilms (Popall et al., Reference Popall, Bolhuis, Muyzer and Sánchez-Román2020). As discussed here and in Fig. 1, this has potentially important consequences for stromatolite morphology. In the literature, a common means of quantifying this growth function uses the number of population doublings per day versus irradiance. This is the metric we adopt in the present work.
Describing the population in a small portion of surface on a microbial mat
In a developing microbial mat, diverse bacterial populations are distributed with depth (cf. Toneatti et al., Reference Toneatti, Albarracín, Flores, Polerecky and Farías2017). The physics of absorption and scattering of light over depth in solid, heterogeneous media is complex, and a thorough description requires the use of the Beer–Lambert law in the presence of numerous light-absorbing and light-scattering materials present in the mat (cf. Eilers and Pieters, Reference Eilers and Peeters1988; Wolf et al., Reference Wolf, Picioreanu and van Loosdrecht2007). Because the functional form shown in Fig. 1 was derived from aqueous suspensions of planktonic cyanobacteria, we cannot necessarily expect a direct application to growth of a microbial mat. Nonetheless, we assume here that a similar function applies to growth near the surface of a microbial mat, and we believe a more complete analysis would add complexity which would obscure the insights afforded by our simpler model. In this work, we assume that the production rate of bulk stromatolite volume in the form of microbial components, EPSs, other organic material, as well as precipitated carbonate and/or other minerals, is proportional to the rate of growth of the local population itself, and we assume that the accretion of matter occurs locally within an assumed euphotic layer of thickness δ0 within which all incident light is absorbed. For modelling purposes, we treat this thin layer as an effectively two-dimensional, smooth surface, on which all actively growing organisms are confined.
Consider a small patch of surface area A on a stromatolite (Fig. 2), small enough that it may be considered planar. The orientation of any such area is defined by the local unit surface normal $\hat{n}{}_{\rm A}$ , which is perpendicular (normal) to the surface, and we denote the direction towards incident direct irradiance by the unit vector $\hat{n}{}_{\rm S}$
 . We further define the angle between $\hat{n}{}_{\rm S}$
 and $\hat{n}{}_{\rm A}$
 as λ, so that cos λ equals the vector dot product $\hat{n}_{\rm S}\cdot \hat{n}_{\rm A}$
 . In Fig. 2, the radiant flux (W) received by area A (solid green) is equal to its projection A cos λ (black hashed) in the direction of $\hat{n}{}_{\rm S}$
 , multiplied by the direct irradiance (W m−2). These assumptions provide a simple starting point for the present model. The thickness δ0 of the outer layer in which photosynthetic activity is confined is typically less than 1 mm (Pentecost, Reference Pentecost1978; Evans, Reference Evans2003) in extant microbial mats. For our purposes, δ0 is the thickness of the euphotic layer, the upper boundary of which remains coincident with the surface. Given an initial population density ρ (organisms per m3, averaged over the euphotic layer), the number N of organisms within the volume Aδ0 is N = ρAδ0, or equivalently, N = σA where σ = ρδ0 (organisms per m2) is the number of organisms per unit area of the local surface.
Sketch of a small patch of surface area on a microbial mat.

Parameterization of the growth rate function
We will hereafter refer to I 0cosλ as the irradiance at a point on the surface, where I 0 is the direct irradiance. A suitably simple function describing the daily increase ΔN in the population N, mimicking experimental results like those shown in Fig. 1 is given by

where

and

Equation (1a) is a simple Gaussian, symmetric about ℓ = 1 and shifted vertically by one unit. The quantity ℓ is the total irradiance (W m−2) received at a chosen location, normalized by the irradiance $\tilde{I}$ that corresponds to maximal growth, and D is the number of population doublings per day, per surface element, at optimal irradiance. In equations (1a) and (1c), $\ell _0\equiv I_0/\tilde{I}$
 and $\ell _{\rm d}\equiv I_{\rm d}/\tilde{I}$
 are the normalized direct and diffuse irradiance, respectively, and cos λ represents the reduction of incident radiation on surfaces that are not optimally oriented for light collection as described above (Fig. 2). While it is a subject in forthcoming work, we will generally neglect diffuse illumination in this paper.
Note that if ℓ = 1 at any location on the surface, growth at that location will occur at the largest possible rate for the specific organism involved. The largest value of ℓ is ℓ0 (the direct irradiance), that occurs when λ = 0, i.e. $\hat{n}_{\rm S}\cdot \hat{n}_{\rm A} = 1$ . We define suboptimal direct irradiance as the direct irradiance when ℓ0 < 1, and superoptimal direct irradiance as the direct irradiance when ℓ0 > 1. If the direct irradiance at the crest of the structure is suboptimal, all points on the structure receive less than optimal irradiance. If the direct irradiance is superoptimal, then optimal growth rate (ℓ = 1) will occur away from the apex, on the flanks of the growing structure. Superoptimal irradiance causes photodamage and a drop in photosynthesis (Raven, Reference Raven2011), hence reduced growth rate at the apex. As will be shown, these ranges roughly prescribe two different growth morphologies.
The curves in Fig. 3 show the predicted doublings per day at all values of ℓ, derived using equation (1a), for various values of D. Note the similarity to the data in Fig. 1. We emphasize that the functional form of equation (1a) was chosen for its simplicity: experimental results (cf. Shear and Walsby, Reference Shear and Walsby1975), typically exhibit a slower, asymmetric drop in production rate above the optimal value generated by the equation. For this reason, the rightmost regions of the curves are dashed. The argument of the exponential in equation (1a) is a simple parabolic function of ℓ with a maximum at ℓ = 1, in which case ΔN = (2D − 1)N, which matches the definition of D given above. For example, if D = 1, then ΔN = N, so the new population N 1 after 1 day of growth is N 1 = N 0 + ΔN = 2N 0, where N 0 is the original population. Note also that when ℓ = 0 (no sunlight) there is no growth in the population.
Model population doublings per day per surface element as functions of normalized irradiance, derived using equation (1a). Curves are shown for various values of D. Lines are dashed at large irradiance, where the simple parameterization does not match experimental data.

If the daily increase in accreting mat thickness is given by Δh, then given the simplifying assumptions described above, we have Δh/δ0 ≈ ΔN/N so that the rate of surface-normal growth is approximated by

where τ d is the length of a day. As a useful example, note that for a horizontal mat with vertical illumination (λ = 0), with optimal direct irradiance (ℓ0 = 1, so $I_0 = \tilde{I}$ ), equation (2) gives

so that if there is one population doubling per day (D = 1), then dh/dt = δ0/τd. In that case the euphotic layer generates an increase in mat thickness by δ0 each day. We emphasize that because equation (2) was derived in a heuristic, order-of-magnitude manner, it cannot be expected to yield precise results. For example, we note that for δ0 ~ 0.1 mm, yearly growth (several hundred days) is unrealistically large unless D is only ~ a few. We regard δ0/τd as a factor to be adjusted as necessary to yield physically reasonable results. It is important to note that this model assumes that the local population N is being continuously buried by new growth, so that only the part of the population residing in the euphotic layer is growing at any one time. The population may double many times per day, but new growth is always within a distance δ0 of the surface at any point in time.
As mentioned above, the results presented here apply to unidirectional irradiance that does not vary with seasons. The characteristic length-to-width ratio of a stromatolite is roughly equal to the amount of vertical growth observed in the specimen at hand, divided by the characteristic spatial wavelength of the substrate irregularities from which the stromatolite developed. Therefore, surface irregularities of large horizontal wavelengths will simply require proportionately longer durations of growth in order to generate stromatolites with large length to width ratios. For example, digitate stromatolites of width ~1 cm (and much longer length) could grow from surface irregularities of ~1 cm spatial wavelength in a timescale of several years if yearly growth increments are also ~1 cm. The effects of seasonally varying direction (and/or intensity) of irradiance will be treated in a forthcoming paper.
Phototropic versus surface-normal growth
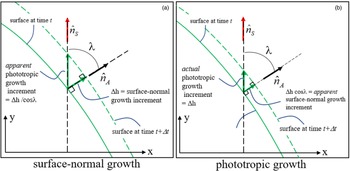
For this work, we will primarily assume that all accretion of matter on the microbial mat occurs in the direction normal to the surface. As shown in Fig. 4, an alternative assumption of phototropic accretion (growth in the direction of incident light, which need not be vertical) is easily adopted, by dividing dh/dt in equation (2) by cos λ. This simple modification only requires that the accreted layer is thin relative to the characteristic length scale over which the surface curves appreciably – an assumption already inherent in the model.
Surface normal growth (a) and phototropic growth (b) result in differences in geometry. Note that Δh has the same magnitude in both cases.

Results
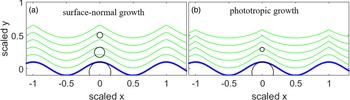
At any location on a microbial mat, let us assume that the amount of linear growth Δh during an increment of time Δt depends only on the irradiance received, as is implied by equation (2). Differences in surface geometry arise, dependent on whether this growth is directed normal to the surface, or alternatively, in the direction of incident direct irradiance. Consider a vertical section through a growing stromatolite, for which surface coordinates are shown by y(x), where the direction $\hat{n}_{\rm S}$ towards incident irradiance defines the y-axis. Figure 4(a) shows the geometry when this growth is normal to the surface. For a given value of x, the apparent phototropic growth (the change in y(x) during time Δt) is Δh/cos λ, which increases as λ approaches 90°. In Fig. 4(b), the value of Δh is the same, but in this case the actual growth is phototropic, so the change in y(x) during Δt is simply Δh. A notable difference is that phototropic growth results in thinner layers where surfaces are inclined relative to incident radiation. The differences in layer thickness between the two cases become vanishingly small near the apex of the structure, where λ = 0. Figures 5(a) and (b) show numerical simulations, using equation (2), representing surface-normal growth and phototropic growth, respectively, resulting from vertical, direct, suboptimal irradiance, starting on a simple sinusoidal substrate. In both cases, ℓ0 = 0.7 and D = 5.
Surface normal growth (a) and vertical growth (b) starting from a sinusoidal substrate (blue, thicker) with ℓ0 = 0.7 and D = 5. Direct irradiance is vertically incident. Inscribed circles approximately illustrate radii of curvature, R, at apices at three horizons. R decreases more rapidly for phototropic growth (case b).

Results in both cases are qualitatively similar, although thicknesses normal to sloped surfaces appear relatively thicker near peaks in case (a), as described in Fig. 4. Also, as predicted later in Section ‘Conclusions’ by equations (8a) and (8b) (also see Figs 12(a) and (b)), the radius of curvature R at apices decreases more rapidly with successive layers under phototropic growth, as illustrated by inscribed circles beneath the apices in Fig. 5.
Simple model with unidirectional irradiance
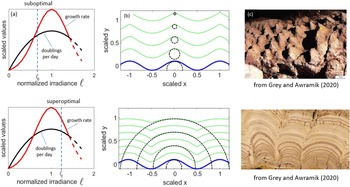
Figure 6 shows results of two numerical integrations of model microbial mats on a numerical grid, assuming surface-normal growth. The irradiance is constant and vertically incident, and growth starts on a simple sinusoidal substrate (blue, thicker). Surface morphologies at successive dates are shown in green (thinner lines). For both superoptimal and suboptimal direct irradiance, the peaks and troughs grow at the same constant rate, because their surface normals remain vertically oriented. However, for suboptimal direct irradiance (top panels), the growth is larger towards extrema than on other parts of the surface, leading to uphill migration of inflection points (where curvature changes sign). Peaks become sharper, and troughs begin to ‘fill in’. The end results are cone-like structures that are relatively widely spaced. The reverse is true when direct irradiance is superoptimal (lower panels): near extrema, growth is slower than on the slopes, leading to broad domical stromatolites with little space between them. Tops flatten as time proceeds, as faster-growing sides catch up with apices. The end result is a flat mat, with gaps between individual maxima eventually becoming simply deep creases in it. At the top and bottom right of Fig. 6(c) are examples of stromatolites whose forms resemble these predictions.
Two distinct morphologies develop under vertically incident, unidirectional irradiance. Top: when direct irradiance is suboptimal, cone-like shapes develop, with relatively wide spaces between them. Bottom: when direct irradiance is superoptimal, broad domes develop with narrow spaces between them. Dashed circles indicate radius of curvature at vertices. Examples of stromatolites similar to these model predictions are shown at the right. (c) Top: conical stromatolites from ca. 3.45 Ga Strelley Pool Formation, Western Australia (photo by SM Awramik). (c) Bottom: ca. 50 Ma Green River Formation, Wyoming (photo by SM Awramik).

We note here that these morphogenetic phenomena could potentially also be a result of other influences that can be described by a vector flux – for example, the presence of depositional flow or current – if orientations of such vector influences relative to local surface normals influence growth rate in any quantifiable manner.
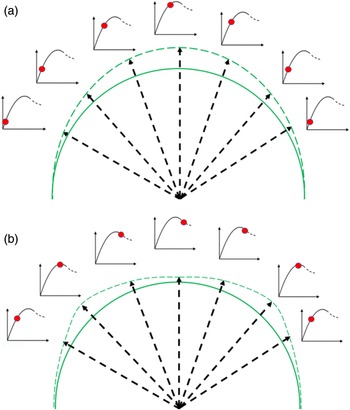
A schematic case of surface-normal growth at suboptimal direct irradiance is depicted in more detail in Fig. 7(a), for a substrate that is initially hemispherical in shape. The initial form is solid green, and the (exaggerated) surface after 1 day is shown in dashed green. Radial arrows show the growth increments and their directions. Note that the curvature at the apex is increased and the radius of curvature R at the apex is decreased. By contrast Fig. 7(b) shows an example of superoptimal direct irradiance. Curvature at the apex is decreased (R is increased).
Exaggerated growth on an initially hemispherical mat, demonstrating (a) the case of suboptimal direct irradiance, and (b) superoptimal direct irradiance. Numerous inset graphs represent growth rate versus irradiance as in Fig. 1, with solid (red) dots depicting growth rates at each location. For suboptimal and superoptimal direct irradiance, the largest growth occurs at the apex and away from the apex, respectively.

The development of the forms described above may be conveniently examined by considering the evolution of R for an evolving stromatolite as described in the next section.
Evolution of radius of curvature R for a simplified stromatolite
The purpose of this section is to develop a differential equation that describes how one aspect of a stromatolite – the radius of curvature R near the apex – may change in time, and hence in stratigraphic position, due to the dependence of growth rate on irradiance. Here we clarify that the apex is the point for which λ = 0, i.e. the point on the surface that receives the maximum irradiance – where $\hat{n}_{\rm A}$ is parallel to $\hat{n}_{\rm S}$
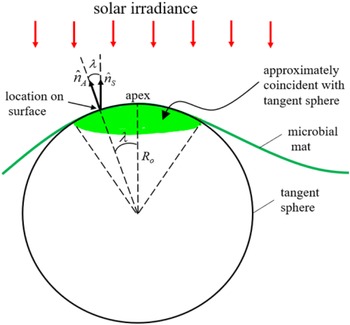
 , so that ℓ = ℓ0. While R cannot encapsulate the complexities of the entire structure, its time evolution can define possible histories that lead to domical versus conical stromatolite morphologies. Consider a horizontal microbial mat with a simple, smooth bump on its surface (an incipient stromatolite), symmetric about the axis through its maximum (Fig. 8).
Vertical section of microbial mat (green) and tangent sphere defining initial radius of curvature R 0 for incipient stromatolite. Green shaded area represents (exaggerated) region well-approximated by the spherical surface, although there is no sharp boundary; the spherical surface approximation steadily improves as the apex is approached.

Here the maximum is defined relative to the direction of $\hat{n}_{\rm S}$ , which is shown as vertical in the figure, but which need not be vertical in general (see Section ‘Results for non-vertical irradiance’). The initial radius of curvature R 0 of the mat at the maximum is indicated by the radius of an inscribed sphere, tangent to the surface precisely at the apex as shown in Fig. 8. We refer to this sphere as the tangent sphere throughout this work. We restrict our calculations to locations on the mat which are very close to the apex, in which case, to an excellent approximation, the mat may be considered to lie on the surface of the tangent sphere itself. The green shaded area in Fig. 8 represents this region, exaggerated for clarity. We prescribe that the mat is subject only to direct sunlight, and on each small area of the surface, we assume that growth is purely surface-normal in nature, as described in Section ‘Evolution of the radius of curvature near apices’. As discussed previously, the orientation of the surface at any point is defined by that of the local unit normal vector $\hat{n}_{\rm S}$
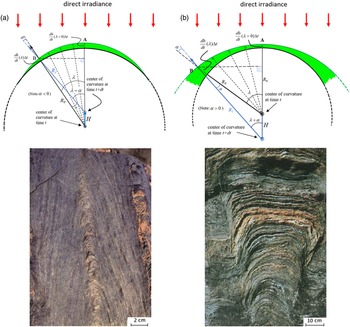
 , which is, in turn, defined by λ. Because growth is a function of received irradiance, which itself depends only on λ in our model, the rate of growth (dh/dt)(λ) at any prescribed location near the maximum/apex depends only on λ as well. For a total direct solar irradiance I 0, the irradiance received at each location is I 0cosλ, maximizing at λ = 0. The top panels of Figs 9(a) and (b) schematically depict vertical cross-sections of the mat (green circular arcs) after a time Δt, for cases of suboptimal (a) and superoptimal (b) direct irradiance. Growth increments at the apex (λ = 0, point A) and at several chosen non-zero values of λ are demarcated with green arrows, superimposed on the complete growth increment (green highlighted areas). We direct our attention to the largest of these, corresponding to the points labelled B. We will restrict λ to small values, but for visual clarity, the values depicted in Figs 9(a) and (b) are exaggerated. At each value of λ, the mat has grown by a small increment (dh/dt)(λ)Δt, which is also exaggerated for clarity. Note that in Fig. 9(a), growth is smaller at larger values of λ, corresponding to suboptimal direct irradiance as described in the previous section (see Fig. 7(a)). Surface elements with normal vectors inclined relative to the vertical (larger λ) receive less radiant flux, but even the direct irradiance is suboptimal, so they grow successively slower at larger λ. Note that the radius of curvature has decreased to the value R 1, and the centre of curvature has evolved upwards by an amount given by H (blue vector pointing up). In Fig. 9(b), growth increments increase with increasing values of λ, corresponding to superoptimal direct irradiance (see Fig. 7(b)): surface elements with normal vectors inclined relative to the direct irradiance (larger λ) receive less radiant flux, so they grow faster. Note that the radius of curvature has increased to the value R 1, and the centre of curvature has evolved downwards by an amount given by H (blue vector pointing down).
Evolved surface of microbial mat after a time Δt for (a) suboptimal and (b) superoptimal direct irradiance, respectively. Relevant non-zero value of λ and net growth of mat are both exaggerated for visual clarity. Possibly relevant specimens are shown directly below each diagram. The stromatolite with sharp apical geometry (bottom left) may have grown under suboptimal conditions. The stromatolite with broad flattening (bottom right) may have developed in superoptimal direct irradiance. Bottom left image from ca. 1100 to 1200 Ma Atar Formation, Mauritania (photo by SM Awramik). Bottom right image from ca. 1750 to 2500 Ma Stark Formation, Northwest Territories, Canada (photo courtesy of P. Hoffman).

From the length of the horizontal dashed lines in Figs 9(a) and (b), the following relation is seen to be true:

At point B in the figures, the angle α is measured between the radial unit vector (black arrow) directed away from the original centre of curvature (grey dot) and the similar vector (blue arrow) directed away from the centre of curvature at time Δt (blue dot). We define α as positive in Fig. 9(b) so it is negative in Fig. 9(a).
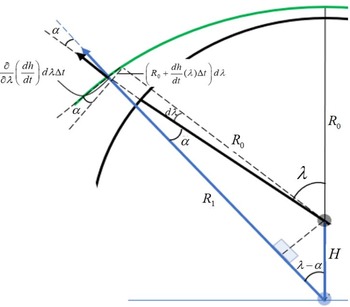
Figure 10 displays a construction at point B in Fig. 9(b), from which we determine the value of α: two radial lines of equal length (one solid and one dashed) extend almost to point B from the original centre of curvature (grey dot). These radial lines differ in orientation by an increment dλ, so that their distal ends are separated by a distance (R 0 + (dh/dt)(λ)Δt)dλ. Over the same range of λ, the distance to the mat surface varies by (∂/∂λ)((dh/dt)(λ))dλΔt. From this it can be seen that

where we have included the approximation for very small Δt, so that α is small as well. We now combine equations (3) and (4), while requiring that Δt become infinitesimally small: Δt → dt, so that

Trigonometric construction at point B in Fig. 9(b) used to evaluate the angle α for superoptimal illumination.

We now restrict λ to values where λ ≪ 1 (radians) in order to consider the tangent sphere to be effectively coincident with the evolving surface. Combining equation (3) with equation (4) then allows dR/dt to be evaluated using equation (5). It is now convenient to take the limit as λ → 0 in the resulting expression. The following differential equation results:

When examining stromatolites, equation (6) is of limited usefulness, since the time intervals between laminae are unknown. A more useful equation is obtained by dividing both sides by the rate of growth at the apex:

Equation (7) describes the rate of change of R with respect to position in the model stromatolite, where position is measured normal to the surface at the apex. This equation applies for surface-normal growth.
The first term ( = 1) in equation (7) represents the simple radial growth which would be expected if the irradiance at λ = 0 were the same for all λ. This term, if alone, would generate isopachous growth. The second term represents the rate of change of R due to variation of growth rate with λ. This term is negative for suboptimal irradiance and positive for superoptimal irradiance. Note that the second term appears to diverge for small values of λ (due to divergence of cot λ), but all physically meaningful forms for (dh/dt)(λ) must be even functions of λ (i.e. symmetric about λ = 0), for which the derivative is proportional to λ ≈ sinλ, thus eliminating the apparent divergence. The relevant example of (dh/dt)(λ) in the model described in this work is found by inserting equation (1c) into equation (2).
Equation (7) describes the evolution of the radius of curvature at the point of maximum illumination (the apex), which coincides with the crest of the incipient stromatolite. It is, however, useful to note that the same development leading to equation (7) can be applied at the minima of the original substrate, in which case we may simply reverse the sign of R and apply the same equation. Thus, without the need for numerical integrations such as those that generated the central panels of Fig. 6, we can conclude for strongly suboptimal direct irradiance that while R at the maxima goes to zero, R at the minima continues to increase without bound. An accurate numerical integration in this case must therefore lead to asymptotically sharp maxima and flat minima (R|max ima → 0, R|min ima → ∞). The reverse is true for superoptimal direct irradiance, where the radius of curvature at the minima approaches zero, while it increases without bound at the maxima. It bears noting that in our numerical integrations we have had to apply local-average filters after each timestep in order to avoid the eventual development of spurious numerical instabilities in the output. An unfortunate side effect of such filtering is that eventually, each profile's range of heights diminishes. Equation (7) will also apply to the case where the solar irradiance is inclined to the vertical by some constant small angle, as long as the point where λ = 0 on the incipient stromatolite is still a maximum with respect to the direction of $\hat{n}_{\rm S}$ .
Evolution of the radius of curvature near apices
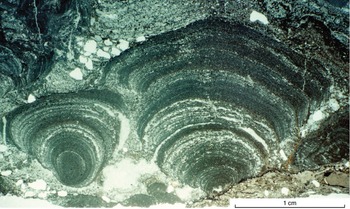
We now use equation (7) to examine the evolution of the radius of curvature R very close to the apex of growth of an ideal stromatolite. One would expect the first term ( = 1) in equation (7) to dominate in the case where virtually all irradiance is diffuse (i.e. isotropic) in nature – for example, in an aqueous environment filled with a preponderance of light-scattering particles. In this case growth is consequently isopachous. An example of a stromatolite that may have grown in diffuse illumination appears in Fig. 11.
Turbinate stromatolite on the right suggests growth in a diffuse, possibly isotropic irradiance field. Thin section photomicrograph from ca. 2.7 Ga Tumbiana Formation, Western Australia (photo by SM Awramik).

The second term in equation (7) represents the effects of directional variation in growth rate and is easily understood: if dh/dt increases with λ (i.e. away from the apex), the stromatolite's vertex will tend to become more domical (larger radius of curvature) as adjacent elements ‘catch up’ to the vertex due to their relatively faster growth. The second term contributes in the same sense as the first when the direct irradiance is superoptimal.
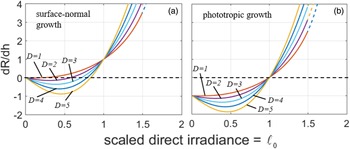
Applying equation (2) to equation (7) yields

for surface normal growth. A similar calculation assuming phototropic growth gives

which differs only by the lack of the additive term ( = 1) on the right-hand side. Equations (8a) and (8b) afford a simple way to examine the change of shape of the region near the apex of a model stromatolite. Figure 12 shows equations (8a) and (8b) as functions of ℓ0, for various values of D. Note that for phototropic growth, dR/dh < 0 for all values of D if ℓ0 < 1, whereas for surface-normal growth, dR/dh < 0 over smaller ranges of ℓ0-values for each value of D. When dR/dh < 0, irregularities on a model microbial mat tend to become pointed (i.e. small radius of curvature) as time proceeds, eventually superficially resembling Conophyton. Equations (8a) and (8b) indicate that dR/dh is a constant for constant irradiance. So, for dR/dh < 0, R is predicted to approach zero at a constant rate relative to height in the geologic column. To confirm the validity of equations (8a) and (8b), circles were inscribed tangent to the apices in Fig. 5. Their radii verify the predicted constant rates of change, although equation (8) was not used. However, in the simulations, as R approaches zero, the resolution of the numerical grid provides a lower limit to R. In the natural world, other processes, not included in our model, must result in a minimum radius of curvature at the apex of such stromatolites.
Plots of dR/dh for surface normal growth (a) and phototropic growth (b). In the natural world, other processes, not included in our model, must result in a minimum radius of curvature at the apex of such stromatolites.

For both surface-normal and phototropic growth, dR/dh > 0 for large enough values of ℓ0. In these cases the shape of the apex will become increasingly domical, eventually flattening out, as height in the column increases. When dR/dh < 0, growth is slower at larger λ (i.e. away from the vertex) – the apex grows outwards faster than nearby surface elements, causing R to shrink. As I 0 approaches $\tilde{I}$ (ℓ0 approaches 1), the direction-dependence of dh/dt weakens due to reduced slope of equation (2) near its maximum at $I_0 = \tilde{I}$
 , and growth becomes increasingly isotropic, eventually leading to concentric, radial growth (dR/dh = 1) at some critical value of ℓ0. In both Figs 8(a) and (b), at large enough values of ℓ0, increased growth away from the apex causes R to increase. Note that in the case of surface-normal growth, as ℓ0 increases, positive dR/dh occurs before ℓ0 = 1 because the first term in equation (8a) (equal to 1) dominates as d(dh/dt)/dλ weakens near the maximum. Also note that if ℓ0 > 0.8, then dR/dt > 0 for all values of D shown, and the shape of the apex will become increasingly domical, eventually flattening out, over time.
For surface-normal growth (Fig. 12(a)), for small enough values of ℓ0, dR/dh is negative due to slower growth at larger λ (i.e. away from the vertex) – the apex grows outwards faster than nearby surface elements, causing R to shrink. Similar behaviour occurs for phototropic growth (Fig. 12(b)), but in that case, dR/dh becomes negative precisely when ℓ0 < 1. Regardless of whether growth is surface-normal or phototropic, when ℓ0 > 1 (I 0 exceeds $\tilde{I}$ ), increasing growth away from the apex causes R to increase.
In summary, Figs 12(a) and (b) illustrate the general growth behaviour of an existing column as a function of ℓ0. Regardless of whether growth is surface-normal or phototropic, at small enough ℓ0 and given sufficient time, columns should evolve into narrow forms with sharp apices, resembling conical stromatolites. At values of ℓ0 near unity, relatively rapid development of domical forms is expected. Finally, when ℓ0 significantly exceeds unity, columns develop flattened tops with surface normals directed towards maximal irradiance.
Results for non-vertical irradiance
In natural environments, the direction of the direct irradiance, denoted by $\hat{n}_{\rm S}$ , changes with time of day, with the seasons and with latitude. Incorporating these factors into stromatolite modelling is a complex but fascinating problem, especially so because astronomical signals may potentially be encoded in the morphology of certain stromatolites. We examine here one of the simpler problems: our model's predictions in the case of a constant, but non-vertical, direction of $\hat{n}_{\rm S}$
 . For the sake of brevity, we will consider only surface-normal growth.
Representative results are shown in Fig. 13, for the same sinusoidal substrate as assumed previously. In the case of suboptimal direct irradiance (Fig. 13(a)), the value of R decreases with height just as was seen for vertical irradiance, but the horizontal positions of the maxima drift, such that once peaks are well-defined (R near zero), the line connecting successive peaks (dashed) eventually points in the direction of $\hat{n}_{\rm S}$ . When direct irradiance is superoptimal (Fig. 13(b)), the effects of reduced growth at the apex (defined here as the point where $\hat{n}_{\rm A} = \hat{n}_{\rm S}$
 ) are evident. Eventually, a sub-planar region develops whose normal is coincident with $\hat{n}_{\rm S}$
 , while increased growth is seen for surfaces that are less optimally oriented for light collection.
Surface-normal growth on sinusoidal substrate for (a) suboptimal direct irradiance and (b) superoptimal direct irradiance, with direction towards incident direct irradiance inclined to the vertical by 20°. Dashed lines connect apices in (a), and represent average surface normals of subplanar regions in (b).

Discussion
Photosynthetic activity as a function of irradiance
Microbial mat photosynthetic activity increases as a function of irradiance at low lighting levels, attains a broad maximum at optimal irradiance and beyond that maximum exhibits a diminished growth rate. In order to realize a relatively simple model, we have mathematically defined the photosynthetic microbial mat as a thin layer that is effectively a two-dimensional, smooth surface, on which all actively growing organisms are confined. Specifically, we have parameterized the growth rate function and described the consequent suboptimal and superoptimal direct irradiance effects on stromatolite growth rates. If the direct irradiance is superoptimal, then optimal growth rate will occur away from the apex, on the flanks of the growing structure. This is due to the fact that superoptimal irradiance can cause photodamage (Raven, Reference Raven2011) and consequently, a drop in photosynthesis and growth rate at the apex. Broad domes develop with only narrow spaces separating them. On the other hand, our model predicts that when direct irradiance is suboptimal, narrow, cone-like shapes develop, with relatively wide spaces between them, since growth is greatest towards the more-optimally illuminated apical region. We have provided examples of actual stromatolites resembling suboptimal and superoptimal stromatolites. Figure 9(a) exhibits sharp apices that, all other contributing factors being equal, perhaps developed during a period of suboptimal direct irradiance. Similarly, Fig. 9(b) exhibits the broad flattening of a column that may have developed in superoptimal direct irradiance.
A simple irradiance growth model
We have posited a simple model for stromatolite growth under unidirectional irradiance, and have described the consequent evolution of the radius of curvature at the point of maximum illumination, defined for our purposes as the apex of the stromatolite. Growth directions in the real world are affected by multiple factors. We have examined one of the simpler problems: our model's predictions in the case of a constant, but non-vertical, direction for irradiance. Notably, under suboptimal direct irradiance the model results exhibit a form of heliotropism, since a line connecting the apices at successive horizons points in the direction of $\hat{n}_{\rm S}$ . For superoptimal irradiance, the results are less obvious, but flattened tops tend to eventually point in the direction of $\hat{n}_{\rm S}$
 .
We can define three vectors relative to which growth direction can be measured: the normal to the surface ($\hat{n}_{\rm A}$ ), the direction towards the sun ($\hat{n}_{\rm S}$
 ) and the true vertical (which is, in general, not the same as $\hat{n}_{\rm S}$
 ). In the literature on stromatolites, the distinction between the latter two is generally not addressed. There is considerable variation in the assumptions employed by researchers in the field of stromatolite morphogenesis as to whether vertical or surface-normal growth results from biotic activity. For example, Batchelor et al. (Reference Batchelor, Burne, Henry and Watt2003) adopt the assumption that vertical growth is evidence of biotic activity, while surface normal growth is primarily abiotic. Vertical growth can result from vertical sedimentation and/or mineral precipitation, or, indeed, from photosynthesis by organisms growing upwards towards vertically incident direct sunlight. However, filamentous cyanobacteria can orient themselves perpendicular to the local surface within a short time after initiation of solar illumination (Petroff et al., Reference Petroff, Sim and Maslov2010), possibly providing an ideal environment for surface normal growth due to biotic activity. Filamentous cyanobacteria preserved in stromatolites at Yellowstone National Park alternate between surface-normal and surface-parallel orientations, and this difference defines visible layering (Berelson et al., Reference Berelson, Corsetti, Pepe-Ranney, Hammond, Beaumont and Spear2011). Grotzinger and Rothmann (Reference Grotzinger and Rothman1996) originally interpreted surface-normal growth as abiotic. Grotzinger and Knoll (Reference Grotzinger and Knoll1999) later proposed that surface normal growth could be partly biotic in nature.
In this work, growth has been assumed to be entirely surface-normal or entirely phototropic, with a rate that is determined solely by the total daily solar insolation reaching any given surface element. This is of course an over-simplification, but the fact that some features (e.g. domical versus conical) of stromatolite morphology can be successfully reproduced by this approach appears to justify its use a-posteriori. It is also interesting to note that if the growth of laminae is directly proportional to incident sunlight, surface-normal growth and growth directed towards incident lighting generate substantially similar morphologies.
Application of the model to the search for life on Mars
Numerous previous studies have explored the possibility of identifying stromatolites during the in situ exploration of Mars (e.g. Walter and DesMarais, Reference Walter and Des Marais1993; Brown et al., Reference Brown, Cudahy and Walter2004; Storrie-Lombardi and Brown, Reference Storrie-Lombardi and Brown2004; Clarke and Stoker, Reference Clarke and Stoker2013). If stromatolite-like structures are found on Mars, the modelling presented here may yield insight into their morphogenesis, and assist in their interpretation as biogenic or abiogenic in origin. For example, our model predicts that under low light (suboptimal) conditions we can expect conical stromatolite morphology to be more likely than domical, while the reverse is predicted for superoptimal conditions.
The amount of solar radiation available for photosynthesis on the surface of Mars or Earth at any one time is dependent on three variables: (1) the distance from the Sun, (2) solar zenith angle and (3) the opacity of the atmosphere. The maximum possible irradiance is given by considering solar distance alone. Currently, solar irradiance available for Earth at a distance to the Sun of 1.0 a.u. is ~1370 W m−2 (Kopp and Lean, Reference Kopp and Lean2011), while for Mars at a mean orbital distance of ~1.5 a.u. it is ~590 W m−2 (Appelbaum and Flood, Reference Appelbaum and Flood1989). Both of these values would have been ~30% smaller in the early solar system (Endal, Reference Endal1981).
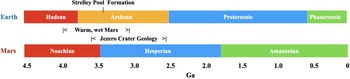
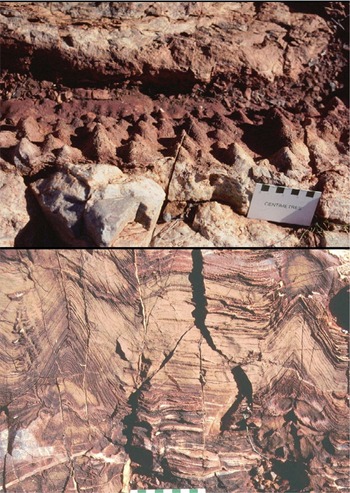
Figure 14 compares timelines on Earth and Mars. During the early Archaean on Earth (ca. 3.43 Ga) both domical and conical stromatolites appeared in abundance at Strelley Pool (Fig. 15) (Allwood et al., Reference Allwood, Grotzinger, Knoll, Burch, Anderson, Coleman and Kanik2009). Available illumination appears to have been marginal since stromatolite formation was limited to shallow water sites (Allwood et al., Reference Allwood, Walter, Kamber and Burch2006). Mean available irradiance at that time on Earth was ~1040 W m−2 using the model developed by Appelbaum and Flood (Reference Appelbaum and Flood1989). During that same time period (early Hesperian) Mars is believed to have been warm and wet (ca. 3.7–3.0 Ga). However, the mean solar irradiance available would have been only ~450 W m−2, less than half the illuminance of Strelley Pool during the same time period. Our model would predict that, if this low level of irradiance was sufficient to support photosynthesis at all, conical forms would been more likely than domical, other contributing factors being equal.
Timeline for stromatolite formation on Earth and Mars.

Strelley Pool conical stromatolites ca. 3.4 Ga (photos by SM Awramik).

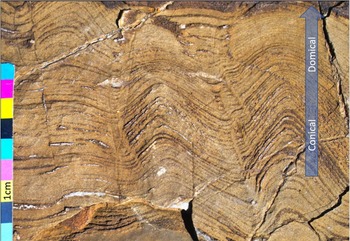
Of course, numerous factors including water depth, flow patterns, sedimentation rates, microbial species and local mineralogy can modify growth rates predicted from available irradiance. Petroff et al. (Reference Petroff, Sim and Maslov2010) have posited the importance of nutrient diffusion gradients and competition for scarce resources as a constraining variable for the growth of conical stromatolites. In a similar fashion, Depetris et al. (Reference Depetris, Peter, Bordoloi, Bernard, Niayifar, Kuhl, de Anna and Battin2021) have noted the impact of shear and oxygen diffusion on the morphogenesis of phototrophic biofilms. As a result, we would speculate that both domical and conical stromatolites could certainly be found in specific niche environments on either Earth or Mars. But for a photosynthetic system, we consider irradiance as the constraining variable. The discovery of conical stromatolite-like structures on Mars would be of particular significance given that the biogenicity of many other types of stromatolites has been called into question (Grotzinger and Rothman, Reference Grotzinger and Rothman1996). Figure 16 shows that for Strelley Pool an early period of conical stromatolite formation was followed by a shift to domical morphology. Our model would predict such a shift, for example, if irradiance increased from suboptimal to superoptimal across the spring and summer months. Finding a similar shift in stromatolite morphology on Mars would suggest the possibility of an adaptive biogenic response to changing environmental conditions.
Three examples of the Strelley Pool stromatolites shifting from conical to domical morphology (photograph by M. Storrie-Lombardi).

Conclusions
We have presented a simple model of stromatolite morphogenesis that explicitly includes the known sensitivity of cyanobacterial growth to incident irradiance. Our results differ from those of previous researchers in notable ways. Batchelor et al. (Reference Batchelor, Burne, Henry and Jackson2004) assumed that vertical growth is biotic and surface normal growth is abiotic. Their modelling predicted structures resembling Conophyton, with sharp apices forming when vertical growth exceeds surface normal growth. Grotzinger and Knoll (Reference Grotzinger and Knoll1999) posited that stromatolite morphogenesis and stromatolite abundances through time, whether biotic or not, may be more an indication of seawater chemistry than biotic or abiotic growth.
In our work, we find that Conophyton-like vertical views develop with purely surface normal growth or phototropic growth (biotically driven), when such growth is a strongly increasing function of intensity, and the irradiance is suboptimal in magnitude. Furthermore, we have found that a line connecting these sharp apices can point in the direction of the maximum sunlight. This supports the possibility that such lines could potentially follow the continuously changing average sunward direction through the seasons. However, near optimal irradiance levels the rate of growth becomes a weak function of irradiance (Fig. 1), and a correspondingly weak function of direction, so that the stromatolites expand and become more domical in vertical views. We also realize that there are a number of factors such as sedimentation, growth near the air–water interface and wave or current activity that can modify the effects of irradiance on shape. However, without sunlight the stromatolites discussed in this paper would not exist. Irradiance is important. We propose the term photomorphism to describe the disparate morphologies that may arise due to the effects addressed with the model presented here and propose the term photomorphogenesis to describe the process. Model results appear to explain, at least qualitatively, common morphologic end-members (i.e. cone-like and domical forms) characterizing a number of stromatolites.
Finally, we note that the geology of Jezero Crater was set in place between 3.8 and 2.6 Ga. The mineralogy of the area includes significant olivine and carbonate deposits (Brown et al., Reference Brown, Viviano and Goudge2020) in a setting dominated by lakes and sites potentially conducive to stromatolite development. In essence, the stage has been set for Perseverance to search for fossil stromatolites on the surface of Jezero Crater. Our model predicts that if such formations exist, they will most likely exhibit conical morphologies.
Acknowledgements
We thank Paul Hoffman for permission to use Fig. 9(b). Grey and Awramik (Reference Grey and Awramik2020) presented critically important images of stromatolite morphology that helped us formulate our model.
Author contributions
GWO developed the mathematical model. SMA and MCS-L contributed their field expertise to further development of the model. All authors contributed to preparation of the manuscript.
Financial support
Funding for MCS-L was provided by the Kinohi Institute, Inc.
Conflict of interest
The authors have no conflicting interests.
Notations
- A
very small area on the surface of a growing microbial mat (m2)
- δ0
thickness of euphotic layer (m)
- ρ
density of photosynthetic organisms in euphotic layer (# m−3)
- N
number of photosynthetic organisms in volume ρδ0A
- σ
surface density of organisms = ρ/δ0
- $\hat{n}_{\rm S}$

unit vector in the direction towards incident direct irradiance
- $\hat{n}_{\rm A}$
unit vector normal to the surface at a given point
- λ
angle between $\hat{n}_{\rm A}$
and $\hat{n}_{\rm S}$- I 0
magnitude of incident direct irradiance (W m−2)
- $\tilde{I}$
magnitude of direct irradiance which yields maximal growth (W m−2)
- I d
magnitude of diffuse irradiance (isotropic incident light) (W m−2)
- $\ell _0 = I_0/\tilde{I}$
normalized direct irradiance
- $\ell _{\rm d} = I_{\rm d}/\tilde{I}$
normalized diffuse (i.e. isotropic) irradiance
- ℓ = ℓ0cosλ + ℓd
normalized total irradiance for a given value of λ
- D
maximum number of population doublings per daypopulation doublings per day on surface elements where λ = 0 and $I_0 = \tilde{I}$
- h
position of a point on the mat surface measured relative to the tangent sphere, in the radial (surface normal) direction at time t
- H
vertical displacement of centre of curvature during time Δt
- τday
length of one day (sec)
- R
radius of curvature of sphere tangent to apex of evolving stromatolite (m)
- (dh/dt)(λ)
instantaneous rate of surface-normal growth as function of λ
- α
at a chosen point on the surface, this is the small angle between the unit vector directed away from the centre of curvature at time t and the unit vector directed away from the (new) centre of curvature at time t + dt
- R 0
radius of curvature at apex of stromatolite at time t
- R 1
radius of curvature at apex of stromatolite at time t + Δt