It is a frequently stated claim that phonetic and/or lexical features show greater degrees of social stratification than systemic features at a “deeper” level of linguistic structure, such as grammatical relationships and phonological contrasts (Labov, Reference Labov1993; Meyerhoff & Walker, Reference Meyerhoff and Walker2013). Explanations for this effect, which has been called the Interface Principle (Labov, Reference Labov1993), tend to cluster around three explanatory parameters: (i) accounts based on general linguistic principles (Hinskens, Reference Hinskens1998; Hudson, Reference Hudson1996), (ii) frequency-based explanations (Boberg, Reference Boberg2004; Cheshire, Reference Cheshire, Klemola, Kytö and Rissanen1996; Rydén, Reference Rydén and Kastovsky1991), and (iii) explanations rooted in sociocognitive constraints.
Hinskens (Reference Hinskens1998:160), for example, has argued that the proportion of variable linguistic phenomena increases as one comes closer to the periphery of the grammar. If this were the case, we would expect more variability in the domain of the sound system than in morphology and even less so in syntactic structure.Footnote 1 Research on grammaticalization and exemplar theory supports this contention. Given that many structural changes are driven by changes in phonetic realization (see Detges & Waltereit, Reference Detges, Waltereit, Detges and Waltereit2008; Hopper & Traugott, Reference Hopper and Traugott2003), we would expect to find more socially meaningful variability in the latter than in the former (see Labov, Reference Labov2001).Footnote 2 Among accounts that consider frequency as the main determining parameter for the appearance of social stratification, Cheshire (Reference Cheshire, Klemola, Kytö and Rissanen1996; see also Rydén, Reference Rydén and Kastovsky1991) hypothesized that (morpho)syntactic variables might be less accessible for social and identity marking functions due to their comparative rareness. If a variable—or indeed some of its variants—occurs at low frequencies, it might be less available for social assessment, which, in turn, would make it less likely for them to become perceptually associated with specific social groups or situations. On the other hand, there are good reasons to assume that it may in fact be the rarity of, for example, a double negative that draws listeners' attention to certain (morpho)syntactic forms, which then results in the variants taking on social meaning (see Buchstaller, Reference Buchstaller2009; Hoffman, Reference Hoffman, Lindquist and Mair2004; Podesva, Reference Podesva2011). Finally, sociocognitive approaches to the Interface Principle have been formulated via the sociolinguistic monitor, a cognitive mechanism that is hypothesized to govern frequency-linked perceptual awareness (Labov, Reference Labov1993; Labov et al., Reference Labov, Ash, Ravindranath, Weldon and Nagy2011; Levon & Fox, Reference Levon and Fox2014; Wagner & Hesson, Reference Wagner and Hesson2014). According to this heuristic, listeners track the speech signal for socially meaningful cues among alternate ways of saying the same thing, and they evaluate them against the listener's stored social meaning for these cues. It has been stipulated that the tracking function of the monitor itself is only sensitive to variability in surface forms, rendering (morpho)syntactic variation invisible to the monitor and thus leading “members of the speech community [to] evaluate the surface form of language but not more abstract structural features” (Labov, Reference Labov1993:4). In other words, monitor-based accounts view the Interface Principle as the reflection of a human cognitive inability to associate social meaning with linguistic structure, resulting in comparatively less social stratification of “deep” (i.e., (morpho)syntactic) features.
To date, the validity of the Interface Principle has been mostly inferred from studies of language production (Labov, Reference Labov1993; see also, e.g., Kroch, Reference Kroch, Beals, Denton, Knippen, Melnar, Suzuki and Zeinfeld1994; Meyerhoff & Walker Reference Meyerhoff and Walker2013; Naro, Reference Naro1981), and we lack experimental research that examines how listeners perceive fine-grained changes in the frequency of grammatical features. The dearth of experimental research on the topic is problematic for three reasons. First, the belief that we can model listeners' perceptual capacity based on patterns of speech production alone relies on a model of sociolinguistic cognition that views linguistic practice as a direct reflex of underlying evaluations. There is, however, a growing body of evidence from both social psychology and sociolinguistics that the relationship between evaluation and behavior is mediated by various external factors, including listener attitudes, speech context, and individual cognitive style (see, e.g., Preston, Reference Preston2011; Wagner & Hesson, Reference Wagner and Hesson2014). Second, the empirical findings of production research do not consistently support the claims of the Interface Principle. As we will discuss in detail, it is not the case that studies of production have always found (morpho)syntactic variables to be less socially stratified, and there are in fact numerous studies that have identified the precisely opposite pattern. Yet even if all production-based evidence did point in the same direction, the third problem with relying solely on investigations of language use to justify the Interface Principle is that doing so introduces a certain amount of circularity into the argument (Kerswill & Williams, Reference Kerswill, Williams, Jones and Esch2002). In effect, using production evidence alone would force us to claim that the reason why morphosyntactic variables may be less socially stratified in production is because they are not perceived as readily as surface forms, while at the same time arguing that the reason we know they are not perceived as readily as surface forms is because they are not as socially stratified in production. Avoiding an explanation based on this kind of circularity requires us to introduce independent evidence on how morphosyntactic forms are perceived, totally divorced from a consideration of how they are used. Only then can we truly investigate whether there exists a causal relationship between the two.
With these concerns in mind, this article reports on a perception study that examines how both social and psychological factors moderate British listeners' perceptual evaluations of two variables that are situated at different levels of linguistic structure: TH-fronting, or the labiodental realization of the voiceless interdental fricative (as in (1a), see Kerswill, Reference Kerswill, Britain and Cheshire2003; Schleef & Ramsammy, Reference Schleef and Ramsammy2013), and the Northern Subject Rule (NSR), or the use of verbal –s suffixes when the subject NP is not third-person singular in function (as in (1b), see Buchstaller, Corrigan, Holmberg, Honeybone, & Maguire, Reference Buchstaller, Corrigan, Holmberg, Honeybone and Maguire2013; Childs, Reference Childs, Pérez, Carrilho and Magro2013; Godfrey & Tagliamonte, Reference Godfrey and Tagliamonte1999; McCafferty, Reference McCafferty2004; Montgomery, Reference Montgomery, Fenton and McDonald1994; Murray, Reference Murray1873).
(1)
a. I fink [think] we should go home now.
b. They really likes ice-cream.
These two variables are differentiated both by their location in linguistic modularity (i.e., phonetic realization versus morphosyntactic structure) and by their perceived geographical epicenter. Whereas TH-fronting is generally considered stereotypical of Southern British English varieties and rare in North Eastern varieties, the Northern Subject Rule is perceptually linked with Northern varieties of English in England (see Childs, Reference Childs, Pérez, Carrilho and Magro2013; Cole, Reference Cole2008; Pietsch, Reference Pietsch, Kortmann, Herrmann, Pietsch and Wagner2005).Footnote 3, Footnote 4 Considering the perceptual responses triggered by TH-fronting and the NSR therefore provides us with an ideal test case of the ways in which social and linguistic factors may come together to constrain the operation of the sociolinguistic monitor. As such, our experiment represents a first attempt to contribute external evidence with which to evaluate the validity of the Interface Principle.
SALIENCE, SOCIAL STRATIFICATION, AND LINGUISTIC STRUCTURE
The sociolinguistic monitor, and with it the Interface Principle, fundamentally relies on the notion of salience, a notoriously underdefined concept in linguistic theory that we can nevertheless broadly gloss as referring to the relative perceptual prominence of a linguistic form or feature (Kerswill & Williams, Reference Kerswill, Williams, Jones and Esch2002). More specifically, the workings of the monitor crucially involve social salience, or the ability of listeners not only to notice a particular form, but also to associate that form with a given social group or personality trait (Levon & Fox, Reference Levon and Fox2014; Niedzielski & Preston, Reference Niedzielski and Preston2003; Preston, Reference Preston, Zeigler, Gilles and Scharloth2010, Reference Preston2011). While older accounts tend to model salience as a static or unidimensional property of language (e.g., Gundel, Hedberg & Zacharaski, Reference Gundel, Hedberg and Zacharaski1993; Tomlin, Reference Tomlin, Noonan and Downing1995, Reference Tomlin, Nyuts and Pederson1997; Trudgill, Reference Trudgill1986), more recent models focus on the dynamic nature of salience, arguing that it is defined jointly by a feature's formal characteristics as well as by listeners' social backgrounds, their prior experiences with the form and the specific sociolinguistic context in which the form is encountered (Campbell-Kibler, Reference Campbell-Kibler2011; Jensen, Reference Jensen2014; Kerswill & Williams, Reference Kerswill, Williams, Jones and Esch2002; Levon & Fox, Reference Levon and Fox2014; Niedzielski, Reference Niedzielski1999; Niedzielski & Preston, Reference Niedzielski and Preston2003; Preston, Reference Preston, Zeigler, Gilles and Scharloth2010, Reference Preston2011). In this paper, we draw on this more processual understanding of the term to define social salience as the relative propensity of a linguistic form to be associated with indexical meaning by listeners in a given context. According to this definition, more highly salient forms are those that manifest a greater degree of evaluative consensus across listeners and/or do so in a more unconstrained fashion. With this definition in hand, the question of whether lexical and grammatical variables differ in their social salience (and, consequently, are differentially available to the workings of the sociolinguistic monitor) thus becomes an empirical one that can be assessed by a comparative examination of listeners' evaluations of the two types of variables.
As we have noted, the existing evidence in support of the Interface Principle comes primarily from production-based research (e.g., Boberg, Reference Boberg2004; Sankoff, Reference Sankoff, Bailey and Shuy1972). Yet, the prevalence of counterexamples, coupled with the fundamental indeterminacy of grammatical structure (Cornips & Corrigan, Reference Cornips and Corrigan2005; Labov, Reference Labov1978), means that the assertion that grammatical variables are less subject to evaluation and hence less socially stratified than phonetic/lexical variables is not entirely uncontroversial. Such counterexamples include work on historical changes in English (Nevalainen, Reference Nevalainen, Hornero, Luzón and Murillo2006; Raumolin-Brunberg, Reference Raumolin-Brunberg2005; Raumolin-Brunberg & Nevalainen, Reference Raumolin-Brunberg, Nevalainen and Kastovsky1994), Meyerhoff's (Reference Meyerhoff1997) analysis of phonetically null versus overt pronominal subjects in Bislama, and research on morphosyntactic variation in French, particularly negation (Ashby, Reference Ashby1981; Coveney, Reference Coveney1996), subject doubling (Coveney, Reference Coveney2005; Nadasdi, Reference Nadasdi1995), and future time reference (Roberts, Reference Roberts2014). In fact, a study that compared variability on different levels of the grammar in English (Cheshire, Kerswill, & Williams, Reference Cheshire, Kerswill, Williams, Auer, Hinskens and Kerswill2005) found no evidence that there is less social variation in morphosyntax and syntax than in phonology.
What these findings suggest is that listeners' recognition and evaluation of linguistic variability, that is, the social salience of a form, is influenced by factors that are orthogonal to the level of linguistic structure at which a variable is situated. Cheshire (Reference Cheshire, Cornips and Corrigan2005), Cheshire and Milroy (Reference Cheshire, Milroy, Milroy and Milroy1993:11), Romaine (Reference Romaine1984), and Beal and Corrigan (Reference Beal, Corrigan and Iyeiri2005, Reference Beal, Corrigan, Elspass, Langer, Scharloth and Vandenbussche2007) all proposed that sociohistorical processes of standardization might influence the association of socially relevant information with linguistic forms. Because many nonstandard morphosyntactic and syntactic variants (such as agreement morphology, negation, and relativization) have undergone codification and thus function as linguistic shibboleths, they tend to be avoided by middle-class speakers.Footnote 5 As a result, “many morphosyntactic variables exhibit a sharp pattern of variation [in urban English-speaking communities], where middle class speakers show near-total avoidance of the non-standard variants. In these communities, phonological variation typically patterns differently: stratification is not sharp but gradient, with all speakers using all variants but with frequencies that vary in proportion to their position on the social class hierarchy” (Cheshire et al., Reference Cheshire, Kerswill, Williams, Auer, Hinskens and Kerswill2005:3).Footnote 6 Indeed, contrary to the persistent myth in the (socio)linguistic literature, there is plenty of evidence that grammatical variables stratify social groups more sharply than phonological ones (Cedergren & Sankoff, Reference Cedergren and Sankoff1974; Chambers, Reference Chambers2002; Wolfram, Reference Wolfram and Alatis1969); some researchers have even assumed that this pattern (abrupt for syntax, gradient for phonology) is quasi-universal (at least for the English language, see Chambers, Reference Chambers2002:350).
The (near-)categorical distribution of grammatical variables by social class seems also to have resulted in a sampling bias whereby research on vernacular morphosyntax tends to focus on the lower end of the socioeconomic spectrum while undersampling or downright ignoring the higher socioeconomic strata (Cheshire et al., Reference Cheshire, Kerswill, Williams, Auer, Hinskens and Kerswill2005; Gordon, Reference Gordon2000; Romaine, Reference Romaine1979, and many others). By removing social variability from the sample, the results that come out of such a design ostensibly support the belief that more abstract levels of linguistic structure are not stratified socially. This bias is further reinforced by a well-known, subfield-specific social attention effect, whereby research on grammatical variation tends to focus on language-internal constraints, often at the expense of exploring the effect of social factors (Milroy & Gordon, Reference Milroy and Gordon2003; see also Meyerhoff, Reference Meyerhoff1999). The resultant dearth of information on the social conditioning of structural features might have led to the assumption that there is nothing to be known.
Note in this respect that the very categorization of linguistic phenomena as being “above (and beyond) the phonological” (Sankoff, Reference Sankoff, Bailey and Shuy1972:45; see Romaine, Reference Romaine1984; Winford, Reference Winford1984) is an old and as of yet unresolved issue in linguistic theorizing. Multiple negation, for example, was classified by Romaine (Reference Romaine1984) as morphosyntactic or morpholexical. Labov (Reference Labov1993), on the other hand, has argued that variables that exhibit clear social stratification (such as negative concord) should be conceptualized as cases of lexical variability.Footnote 7 Meyerhoff and Walker (Reference Meyerhoff and Walker2013:409) suggested that “one might make a similar argument for some of the morphosyntactic variables in French that are also stratified by social class or level of education. … In these cases, there is also clearly a lexical quality to the variation.” Given the lack of unequivocal parameters for assigning individual linguistic phenomena into distinct taxonomies (Cheshire, Reference Cheshire1987), the use of such an argument risks introducing the same kind of circularity we have already described; if a certain construction exhibits social stratification, it is considered to be lexical and thus visible to the sociolinguistic monitor. At the same time, its social stratification is then interpreted as support for the Interface Principle and our assessment of the variable as lexical.Footnote 8
What all of this means is that the question whether listeners evaluate morphosyntactic and phonetic variability differently has yet to be conclusively addressed on the basis of production data. While scrutinizing patterns of production certainly provides relevant information on the potentially differential treatment by communities and speakers of grammatical versus phonetic variables (cf. Meyerhoff & Walker's [Reference Meyerhoff and Walker2013] finding that use of particular existential forms differentiates individuals from different villages in Bequia), this article sets out to explore—with independent perceptual evidence—whether two variables that are situated at different levels of linguistic structure—one phonetic and one morphosyntactic—are differentially available to listeners' social evaluations, as would be predicted by current formulations of the sociolinguistic monitor.
METHODS
To test listeners' sensitivity to phonetic versus grammatical variability, we designed an experimental task modeled on Labov et al.'s (Reference Labov, Ash, Ravindranath, Weldon and Nagy2011) “newscast” paradigm (see also Levon & Fox, Reference Levon and Fox2014; Wagner & Hesson, Reference Wagner and Hesson2014). In this type of study, listeners are presented with multiple recordings of the same speaker reading a sample news broadcast. Listeners are told that the speaker is applying for a job as a newscaster and has recorded multiple “takes” of the broadcast to send with her application. Listeners are asked to help the speaker decide which recording to send by rating each of the recordings for their perceived professionalism. Potential sites for the occurrence of the variable(s) to be tested are distributed throughout the sample newscast. In Labov et al.'s (Reference Labov, Ash, Ravindranath, Weldon and Nagy2011) original study, for example, the newscast contained 10 instances of verbal ING (and hence 10 possibilities for either the alveolar or velar realization of the variable). The recordings presented to listeners differ from one another solely in terms of the quantitative distribution of different realizations of the relevant variable, moving from, for instance, 0% alveolar realization of ING in one recording to 100% alveolar realizations of ING in another and passing through multiple intermediate steps along the way.Footnote 9 The goal of the newscast paradigm is to examine the gradient nature of sociolinguistic evaluation by examining listeners' perceptual judgments of different quantitative distributions of variants. The context of a simulated news broadcast is chosen in order to prime for a more public and/or formal speech style that is relatively free from orthogonal nonstandard variants and governed by overt language norms in which the evaluative dimension of perceived professionalism is heightened (Labov, Reference Labov1966).
The categorical operationalization of phonetic space for the purpose of testing frequency-based perceptions allowed us to adapt Labov's et al.'s (Reference Labov, Ash, Ravindranath, Weldon and Nagy2011) original design to investigate listeners' sensitivity to variation in morphosyntax. In the current study, we test listeners' perceptions of two variables, one phonetic and one syntactic, at the same time. The two variables that we chose are both well-established across varieties of English throughout the United Kingdom, though each is more closely associated (both ideologically and distributionally) with a particular region of the country. As has been noted, our phonetic variable is TH-fronting, or the labiodental realization of the voiceless interdental fricative (e.g., fink for think). TH-fronting is a traditional Cockney feature that originated in the English of London in the mid-19th century. Over the past 40 years, however, the feature has begun diffusing rapidly throughout the United Kingdom, moving into the whole of the Southeastern region as well as into parts of the North and Scotland (including Manchester, Hull, and Glasgow; Kerswill, Reference Kerswill, Britain and Cheshire2003; Schleef & Ramsammy, Reference Schleef and Ramsammy2013; Stuart-Smith & Timmins, Reference Stuart-Smith, Timmins, Caie, Hough and Wotherspoon2006; Williams & Kerswill, Reference Williams, Kerswill, Foulkes and Docherty1999). It has, however, not (yet) established itself throughout the North East of England. Kerswill (Reference Kerswill, Britain and Cheshire2003), for example, reported incipient usage in Durham, though he does state that the use increased dramatically from 1983 (when it was totally absent) to 2002. Watt and Milroy (Reference Watt, Milroy, Foulkes and Docherty1999:30) claimed that in the mid-1990s labiodental forms were “relatively scarce” in Newcastle, and Adam Mearns (personal communication, 2014) stated that they do not seem to have increased much since.
In all areas where it does occur, TH-fronting is sharply socially stratified, with fronted variants occurring more frequently in the speech of young, working-class (and particularly male) speakers (cf. Beal, Burbano-Elzondo, & Llamas, Reference Beal, Burbano-Elzondo and Llamas2012:47). The diffusion of TH-fronting has been accompanied by a steady increase in conscious awareness of the variable. It is possible, for example, to buy T-shirts with the slogan “Norf London” printed on them, thus demonstrating the enregisterment of the feature (cf. Johnstone & Kiesling, Reference Johnstone and Kiesling2008). This example of dialect commodification, moreover, is telling because it illustrates that despite the fact that TH-fronting has in practice become a central component of many urban vernaculars throughout Britain, in popular perception it remains a London (or, at most, Southern) feature (Kerswill, Reference Kerswill, Britain and Cheshire2003; Schleef & Ramsammy, Reference Schleef and Ramsammy2013).
Our syntactic variable is the so-called NSR, or the use of the verbal –s suffix when the subject noun phrase (NP) is not third-person singular in function (e.g., they really likes ice cream; Buchstaller et al., Reference Buchstaller, Corrigan, Holmberg, Honeybone and Maguire2013; Childs, Reference Childs, Pérez, Carrilho and Magro2013; de Haas, Reference de Haas2011; McCafferty, Reference McCafferty2003, Reference McCafferty2004). As its name suggests, the NSR originated in Scottish and Northern varieties of English, which developed from Old Northumbrian (Wales, Reference Wales2006:49). It was subsequently transported to other locations in the United Kingdom, to Ireland, and to parts of the United States, becoming “restructured through extension” in the process (Godfrey & Tagliamonte, Reference Godfrey and Tagliamonte1999:112; see also Montgomery, Reference Montgomery1989; Poplack & Tagliamonte, Reference Poplack and Tagliamonte1989). Research on contemporary varieties of UK Englishes shows that the NSR displays regionally specific patterns of both social and stylistic variation (Buchstaller et al. Reference Buchstaller, Corrigan, Holmberg, Honeybone and Maguire2013; Childs, Reference Childs, Pérez, Carrilho and Magro2013; Pietsch, Reference Pietsch, Kortmann, Herrmann, Pietsch and Wagner2005) and there is evidence that the character of the NSR itself is changing (by, for example, losing certain internal syntactic constraints). Indeed, while the traditional character of the NSR appears to be receding from use in some areas (e.g., the Scottish border), it is becoming more vibrant or at least holding on in certain other northern communities (e.g., Tyneside: Buchstaller et al., Reference Buchstaller, Corrigan, Holmberg, Honeybone and Maguire2013; Childs, Reference Childs, Pérez, Carrilho and Magro2012; Pietsch, Reference Pietsch, Kortmann, Herrmann, Pietsch and Wagner2005; Buckie: Smith, Durham, & Fortune, Reference Smith, Durham and Fortune2007).Footnote 10 Moreover, listeners' perceptions indicate that the NSR clearly remains a recognized feature of Northern varieties of English and distinct from the verbal paradigms of both Standard English and other non-Northern nonstandard varieties (Buchstaller & Corrigan, forthcoming; Buchstaller et al., Reference Buchstaller, Corrigan, Holmberg, Honeybone and Maguire2013; Childs, Reference Childs, Pérez, Carrilho and Magro2013; see also Mossé [Reference Mossé1952] for a historical account).
Despite the continued attested presence of the NSR in some Northern varieties, we acknowledge that the NSR and TH-fronting are not perfectly matched in terms of their overall vitality. As we have stated, TH-fronting is a more recent innovation that has been rapidly diffusing throughout the United Kingdom over the past 30 years and that carries strong stereotypical connotations. In contrast, the NSR is more of a relic form that remains fairly localized and is associated with comparatively less metapragmatic meaning. Mindful of this difference, we nevertheless use the NSR in our experiment both because of its regional association with the north of the United Kingdom (as compared to TH-fronting's stereotypical association with the south) and because it is clearly “syntactic” (as opposed to lexical) in nature. Other grammatical variables in the United Kingdom that are more closely matched to TH-fronting with respect to recency and vibrancy, include be like quotatives, innovative intensifiers, and question tags (Barnfield & Buchstaller, Reference Barnfield and Buchstaller2010; Moore & Snell, Reference Moore, Snell, Gregersen, Parrott and Quist2011; Tagliamonte & Hudson, Reference Tagliamonte and Hudson1999). Yet these other variables are either not clearly marked for regional origin, or they are more on the lexical side of the spectrum of grammatical variation (or both). Because our primary goal is to compare how listeners evaluate variables of different linguistic types, we choose to examine a feature that is clearly of an abstract syntactic nature (in this case agreement) over some other that may be a better match in terms of overall vitality. We will return to this point in the discussion of our results.
In our experiment, we embedded TH-fronting and the NSR into a sample newscast passage (see the appendix). The passage is made up of 10 “headlines,” each containing one environment for the variable application of TH-fronting and one for the NSR, in other words, one location where /θ/ can be realized as either [θ] or [f] and one location where verbal –s could or could not appear. Example headlines are provided in (2) and (3):
(2) The latest exhibit of a throne ([θ] or [f]) made of weapons is proving to be a popular attraction at the British Museum. During peak times, visitors waits ([-s] or [-Ø]) for up to two hours to see the exhibit, which is rarely shown to the public.
(3) A man who woke up alone in a dark plane cabin early on Thursday ([θ] or [f]) morning is suing British Airlines for compensation. Security experts takes ([-s] or [-Ø]) the incident seriously as it is unclear how the man was able to remain on the plane after all members of the ground crew had left.
All headlines contained two sentences. The potential TH-fronting site was always in the first sentence and the potential NSR site was always in the second. For potential TH-fronting environments, we limit ourselves to word-initial locations and exclude all numerals (e.g., three) and the lexemes think and thing as these have been shown to behave differently than other TH-fronting contexts (Clark & Trousdale, Reference Clark and Trousdale2009). For the NSR, we use only full NP subjects (i.e., no pronouns as the original NSR applies only with full NPs and nonadjacent pronouns, a constraint that differentiates Northern and South Western Englishes; see Godfrey & Tagliamonte, Reference Godfrey and Tagliamonte1999:109). We also avoid matrix be and have as well as epistemic verbs and verbs of movement and emotion (because these contexts have been shown to differ even among northern localities, see Buchstaller et al., Reference Buchstaller, Corrigan, Holmberg, Honeybone and Maguire2013; Childs Reference Childs, Pérez, Carrilho and Magro2013; Smith et al., Reference Smith, Durham and Fortune2007).
The passage was read by a young woman from the southeast of England who speaks Standard Southern British English.Footnote 11 She was recorded in a sound-attenuated booth reading the passage three times: once with no tokens of TH-fronting or the NSR, once with 100% TH-fronting but no NSR, and once with 100% NSR but no TH-fronting. From these recordings, we constructed nine versions of the newscast that contained varying frequencies of both TH-fronting and the NSR (see Table 1). This was achieved by cutting and pasting TH-fronted realizations and NSR realizations into the original recording that contained neither TH-fronting nor NSR. In both cases, only the relevant segment ([f] for TH-fronting and [s] for the NSR) was pasted in. Because a full factorial design would have resulted in an unmanageably large number of stimuli for testing, we elected to construct a partial factorial task, as presented in Table 1. These stimuli together present differing frequency distributions of both TH-fronting and the NSR, including one stimulus where both nonstandard variants occur 100% of the time, one in which they both occur 0% of the time, and two stimuli where one variant occurs 100% of the time and the other occurs 0% of the time. This design preserves the orthogonality of TH-fronting and the NSR in the task (r = −.137, p = .728) and hence allows us to examine both variables together in our quantitative models. When modifying the recordings to create individual versions of the stimuli themselves, we adopted the method used in Levon and Fox (Reference Levon and Fox2014) and progressively modified tokens of the two variables from the middle of the passage outward. This means that in stimuli where there is 10% TH-fronting or NSR, it is the tokens in headline 5 that are modified; for 20% TH-fronting or NSR, headlines 5 and 7 are modified; for 30%, headlines 5, 7, and 3 are modified; and so on. This is done in an effort to avoid the “first token encountered” effect described by Labov et al. (Reference Labov, Ash, Ravindranath, Weldon and Nagy2011:439). By beginning our modifications in the middle of the passage and moving progressively outward, we ensure that the first token our listeners encounter is the standard form of the variable in all stimuli but the 100% nonstandard versions. Aside from the modifications of the two target variables, all nine versions of the passage are identical. Both authors and a pretest group of three trained linguists all agreed that the nine stimuli sounded “natural” (in the sense that they did not sound as if they had been modified).
Frequency distribution of TH-fronting and the NSR in the nine stimuli

These nine versions of the stimulus passage were presented to 84 listeners (71 women and 13 men) in London and in Newcastle. All listeners were native speakers of British English between the ages of 18 and 33 (mean age = 19.4 years) and were all undergraduate students at either the University of London or Newcastle University.Footnote 12 Thirty-two came from Southern dialect regions in the United Kingdom, 47 from Northern dialect regions, and 5 from the English Midlands.Footnote 13 While we recognize that using undergraduate students as our respondent population necessarily restricts the generalizability of our findings, we justify this use in two ways. First is the issue of comparability between the current study and previous research in this paradigm (e.g., Labov et al., Reference Labov, Ash, Ravindranath, Weldon and Nagy2011; Levon & Fox, Reference Levon and Fox2014; Wagner & Hesson, Reference Wagner and Hesson2014), all of which have been conducted (at least partially, in the case of Labov et al., Reference Labov, Ash, Ravindranath, Weldon and Nagy2011) with undergraduate students of a similar age as we use here. Second, our primary goal in the current research is to examine relative differences, if any, in the perception of phonetic versus grammatical variation. As such, we focus principally on variation within the individual making the establishment of a socially stratified sample for between-group comparisons less crucial for our purposes. In other words, it is not our intention to provide a comprehensive analysis of how TH-fronting or the NSR is evaluated in the United Kingdom (a task that would clearly require a more diverse sample). Instead, our aim is to investigate whether the two types of variables trigger different perceptual reactions, thus somewhat mitigating the need for representativity in our listener population. That said, we nevertheless concede that having a more varied group of listeners would help to strengthen our analysis and increase the types of between-subjects factors we are able to consider. The following discussion can therefore be considered a first attempt at an experimental assessment of Labov's (Reference Labov1993) Interface Principle with the acknowledged caveat that further research with a more diverse listener population is also required.
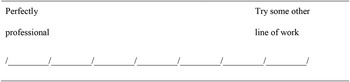
During the task, listeners were presented the nine versions of the stimuli in the order listed in Table 1. Order of presentation was not varied based on prior results (Levon & Fox, Reference Levon and Fox2014) that demonstrated that order had no effect on results in tasks of this kind. As in Labov et al.'s (Reference Labov, Ash, Ravindranath, Weldon and Nagy2011) original study, listeners were told that they would hear recordings made by a woman who was studying to be a journalist and who was applying for a job as a newscaster. For each recording, listeners were asked to rate how “professional” the recording sounds on the same seven-point Likert scale used by Labov and colleagues (which ranged from 1 = “perfectly professional” to 7 = “try some other line of work”; see Figure 1). After having rated all nine versions, respondents provided basic demographic information (including age, sex, birthplace, linguistic background, etc.). They also then completed two questionnaires, each designed to measure different types of individual differences that may exist within the sample.
“Professionalism” rating scale (taken from Labov et al., Reference Labov, Ash, Ravindranath, Weldon and Nagy2011).

The first questionnaire was an Attitudes to Regional Identity survey, which was designed to measure listeners' attitudes toward their regional identities and the language varieties associated with these regions. Adapted from the questionnaire originally used by Cargile and Giles (Reference Cargile and Giles1997) in their study of the effect of in-group affiliation on perceptions of out-group speech (which was itself adapted from Brown, Condor, Mathews, Wade, & Williams's [Reference Brown, Condor, Mathews, Wade and Williams1986] Group Identification Scale), the questionnaire contained eight statements relating both to respondents' own beliefs and emotions regarding their regional origin (e.g., I identify as a Southerner/Northerner) and to the extent to which they engage in practices associated with those regions (e.g., I have a Southern/Northern accent). When completing the questionnaire, respondents reported their relative agreement/disagreement with each of the statements on a five-point Likert scale that ranged from “rarely” to “very often.” In our sample, all respondents score relatively highly on the Attitudes to Regional Identity questionnaire (overall average of 4.1 out of 5), indicating a generally high level of pride in their regional identities and the associated linguistic practices. Perhaps surprisingly given the language ideological landscape of the British Isles (Coupland & Bishop, Reference Coupland and Bishop2007; Giles & Powesland, Reference Giles and Powesland1975; Wales, Reference Wales2006), there is no significant difference in responses between respondents from the North (average = 4.12) and respondents from the South (average = 4.06, p = .29). The only overall significant difference in the sample on the Attitudes to Regional Identity score is between women (average = 4.03) and men (average = 4.50, p = .000), indicating that the men are generally “prouder” of their regional identities (or at least they reported themselves to be) than the women are. This result is not necessarily unexpected given the long-standing claim that men tend to be more invested in local norms and practices (e.g., Trudgill, Reference Trudgill1974), though because men represent only 15% of our respondent population, we do not wish to make too much of this result.
The second survey that respondents completed was the Broad Autism Phenotype Questionnaire (BAPQ; Hurley, Losh, Parlier, Reznick, & Piven, Reference Hurley, Losh, Parlier, Reznick and Piven2007), a questionnaire used to assess nonclinical populations for characteristics associated with Autism Spectrum Condition (ASC). In their recent study, Wagner and Hesson (Reference Wagner and Hesson2014) used the BAPQ to demonstrate that individual differences in listeners' cognitive processing styles (as measured by the BAPQ) can influence how they perceive and evaluate linguistic variability. In particular, Wagner and Hesson argued that “the characteristics associated with ASC represent impairments in the skills that one might assume to be implicitly involved in executing social judgments based on linguistic variation” (Reference Wagner and Hesson2014:655). The questionnaire itself contains 36 diagnostic statements to which listeners indicate their relative agreement/disagreement on a six-point Likert scale (ranging from 1 = very rarely to 6 = very often). Though presented out of order, the 36 items are organized into three subscales of 12 statements, each one associated with a different ASC component. The first subscale is labelled the Aloofness scale and measures an individual's ability, interest, and/or enjoyment of social interaction (or lack thereof). These characteristics are assessed by agreement with statements such as “I enjoy being in social situations.” The second subscale, called the Rigidity scale, measures an individual's interest in change/ability adjusting to change as well as their sensitivity to patterns and routines. These characteristics are assessed by statements such as “I am flexible about how things should be done.” The third subscale, finally, is the Pragmatic Language scale, which aims to tap into an individual's ability to engage in the social aspects of language, including their relative ease of effective communication and their ease/difficulty in holding fluent, reciprocal conversations. These characteristics are assessed via statements such as “I enjoy chatting with people.” Like Wagner and Hesson (Reference Wagner and Hesson2014), we collapsed the individual BAPQ results into an average score for each of the three subscales (i.e., Aloofness, Rigidity, Pragmatic Language) as well as an overall composite score. On all four scales, higher values indicate more ASC-like traits and cognitive styles (see Hurley et al., Reference Hurley, Losh, Parlier, Reznick and Piven2007).
Within our respondent population, we find a mean composite BAPQ score of 2.82 (SD = .40). This figure is below the established cutoff threshold of 3.15 for this scale, above which respondents are more likely to be independently diagnosed as having the Broad Autism Phenotype. That said, we nevertheless have a fair amount of variation around the cutoff point in our data, particularly on the Pragmatic Language scale, where we find a mean value of 2.84 (SD = .48) in our sample, as compared to the cutoff point for this subscale of 2.75. In fact, for all four scales (the composite score and the three subscales) over 20% of our respondents score higher than the cutoff threshold. We state these distributional facts to illustrate the existence of variation in BAPQ scores within our respondent population and so justify our inclusion of the BAPQ measures in our quantitative analysis. In addition, unlike the original BAPQ study (Hurley et al., Reference Hurley, Losh, Parlier, Reznick and Piven2007, though cf. Wagner & Hesson, Reference Wagner and Hesson2014) we find low interitem correlations (r < .3) between responses on the three subscales, thus allowing us to include all three as independent predictors in a regression model.
Listeners' ratings of the perceived professionalism of the nine experimental stimuli were analyzed via linear mixed-effects regression models implemented using the lme4 and lmerTest packages in R (version 3.1.2; R Core Team, 2015). Models were stepped-down from full models that included frequency of TH-fronting, frequency of the NSR, BAPQ composite score, or scores for the three BAPQ subscales (i.e., we built separate models, one with the composite score only and a second with the three subscales entered as individual predictors), Attitudes to Regional Identity score, listener sex, listener region, and all interactions of the above factors.Footnote 14 Respondent was entered as a random intercept. As has already been mentioned, preliminary analyses demonstrated low interitem correlations (r < .3) between the BAPQ subscales and between frequency of TH-fronting and frequency of NSR, which effectively means that no problematic issues of multicollinearity are present in the model. This was further verified via Variance Inflation Factor scores, which are all below the conventional threshold of 3 (O'Brien, Reference O'Brien2007). Next, we will detail the results of these analyses. In the interest of brevity, we focus only on those factors that are shown to have a significant impact (or participate in a significant interaction) on perceived professionalism.Footnote 15
FINDINGS
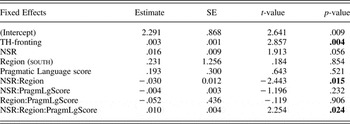
Table 2 presents the results of the best-fit regression model for our data, focusing on the significant predictors or predictors that participate in a significant interaction. So, for example, both Aloofness and Rigidity scores were originally included in the model presented in Table 2, but were not selected as significant and so are not shown here. Similarly, the composite BAPQ score was not selected as significant and so will not be discussed further. In our analyses, the only cognitive style measure that is shown to have an effect—and only in interaction with the occurrence of the NSR—is the Pragmatic Language score, which we will discuss in detail. Note too that listener sex and the Attitudes to Regional Identity measure were not shown to have a significant effect on perceived professionalism, and so will not be discussed further.Footnote 16
Best model for perceived professionalism
Observations: n = 708; Respondents, n = 79; SD = .764; log likelihood: −1106.594

Notes: The following were not selected as significant: Speaker Sex, Attitudes to Regional Identity, Aloofness, Rigidity.
Bold values are statistically significant.
We see in Table 2 that the factors shown to significantly constrain our listeners' perceptions of professionalism include frequency of TH-fronting (p = .004) and a complex, three-way interaction among frequency of NSR, listener's region of origin, and Pragmatic Language score (p = .024). Interestingly, the frequency distributions of TH-fronting and the NSR themselves are not shown to interact. This indicates that listeners treat these variables separately, and there is no empirical support for the notion of an additive effect on perceived professionalism (i.e., whereby TH-fronting and NSR combine to influence evaluative judgments). When we examine average scores on the professionalism scale, however, there does appear to be a nonsignificant trend in this direction (see Table 3). The guise with both 0% TH-fronting and 0% NSR, for example, receives an average professionalism rating of 2.82 overall. This is in comparison to the guise with 0% TH-fronting and 100% NSR, which receives an average score of 3.46, and the one with 0% NSR and 100% TH-fronting, which receives an average score of 3.03. These results indicate that across the entire frequency range (i.e., from 0% to 100%), TH-fronting and NSR are correlated with .21 and .64 point decreases, respectively, in ratings of perceived professionalism (recall that the higher the score, the lower the perceived professionalism). The guise with 100% TH-fronting and 100% NSR receives an average rating of 3.68, or .22 to .65 points higher than either 0% TH-fronting or 0% NSR on its own. This result points to the possibility that listeners are sensitive to the combination of the two variables and downgrade the speaker to a greater extent when both variables are more frequent.
Cross-tabulation of ratings of perceived professionalism in guises with 0% and 100% NSR and TH-fronting

Note: Lower scores correspond to a higher degree of perceived professionalism.
Furthermore, it appears that NSR contributes more to this perceptual effect than TH-fronting does. The difference in average rating between the baseline condition (0% TH-fronting and 0% NSR) and the fully nonstandard condition (100% TH-fronting and 100% NSR) is .86 points. We can compare this to the .64 point change in average ratings between the baseline condition and the NSR-only condition (i.e., 0% TH-fronting and 100% NSR) versus the only .21 point difference between the baseline condition and the TH-fronting-only condition (i.e., 100% TH-fronting and 0% NSR). What this comparison appears to indicate is that categorical use of the NSR is responsible for more of the decrease in perceived professionalism evident between the baseline and the fully nonstandard conditions. While TH-fronting certainly contributes to this effect as well, its role appears to be somewhat diminished, at least in quantitative terms. If confirmed on a larger dataset, this result could support findings from production research that suggest that morphosyntactic variables may play a larger role in subdividing a population of speakers (see, for example, the categorical differences for morphosyntax found in Cheshire et al., Reference Cheshire, Kerswill, Williams, Auer, Hinskens and Kerswill2005). In the current study, however, this pattern does not achieve significance either in the full regression model in Table 2 or in subsequent pairwise comparisons of the guises with the most extreme values (as in Table 3).Footnote 17 On the basis of these findings, we treat the frequency of TH-fronting and NSR as independent effects on the ratings of perceived professionalism among our listeners.
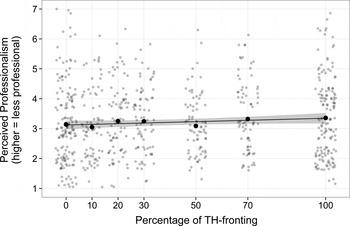
As has already been noted, frequency of TH-fronting constrains listener judgments of perceived professionalism in isolation, having no interactions with any of the other (external) factors considered. This effect is a relatively small one, associated with a coefficient of only .003, which translates to a predicted decrease of .3 points in perceived professionalism ratings across the entire frequency range (i.e., from 0% to 100%, see Figure 2). The effect is thus noticeably smaller than the effect of TH-fronting on perceptions of professionalism in London, Salford, and Sheffield reported in Levon and Fox (Reference Levon and Fox2014), where the authors found a predicted difference of one point across the same frequency range. Note, however, that in Levon and Fox's study, frequency of TH-fronting was only shown to have an effect among Northern listeners, whereas in the current sample perceptions of the variable do not interact with listener region of provenance. The result in Table 2 is nevertheless similar to the finding in Levon and Fox (Reference Levon and Fox2014) in that (as model comparisons confirm) the effect of TH-fronting is linear in nature, not logarithmic (cf. Labov et al., Reference Labov, Ash, Ravindranath, Weldon and Nagy2011).Footnote 18 In sum, we find a small but consistent effect of TH-fronting in our sample, such that an increase in the frequency of the fronted variant is correlated with a corresponding gradient decrease in listeners' perception of the speaker as “professional.” The direction of this correlation follows the expected direction of listeners' perceptions of a nonstandard form when overtly prestigious language norms are foregrounded and solicited.
Average ratings of perceived professionalism by frequency of TH-fronting.

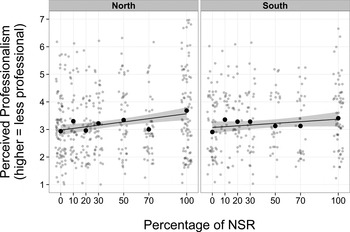
Unlike TH-fronting, the effect of NSR on the speaker's professionalism ratings is conditioned by an interaction with both listener region and score on the Pragmatic Language subscale. We begin our discussion with the interaction between frequency of NSR and region, which is represented graphically in Figure 3. There, we see that the frequency of occurrence of the NSR is negatively correlated with the speaker's perceived professionalism (i.e., the upward slope of the lines in Figure 3) and that that effect appears significantly larger for Northern listeners (left side of the plot) than for Southern ones (right side of the plot). When we consider the relevant coefficients in Table 2, we find a predicted decrease of 1.6 points in perceived professionalism across the frequency range of NSR (from 0% to 100%) for Northern listeners. For Southern listeners, in contrast, that effect is substantially reduced, yielding a predicted decrease in perceived professionalism of only .43 points across the 0% to 100% range. Subsequent pairwise comparisons of the Northern and Southern listeners separately confirm the existence of a significant main effect of NSR among Northern listeners only (F (1,373.14) = 15.85, p = .000), while for Southern listeners that effect is further conditioned by a significant interaction with Pragmatic Language score.
Average ratings of perceived professionalism by frequency of NSR and listener region.

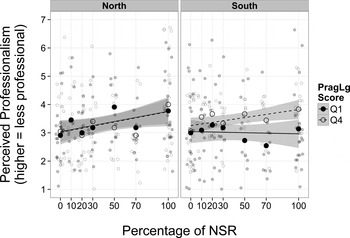
Figure 4 once again plots the average ratings on the perceived professionalism scale for Northern and Southern listeners separately. In this instance, we also distinguish between those listeners in the first quartile on the Pragmatic Language scale (i.e., those individuals with the least ASC-like traits; represented by closed circles and solid lines) and those in the fourth quartile on the Pragmatic Language scale (i.e., individuals with the most ASC-like traits; plotted as open circles and dashed lines). We see clearly in Figure 4 that, for Northern listeners, this distinction between most versus least ASC-like traits has no effect on the NSR result. The two lines overlap perfectly, and the average values are very close to one another throughout. For Southern listeners, in contrast, the lines diverge substantially from the 50% mark onward, with listeners in the fourth quartile of the Pragmatic Language scale progressively downgrading increased frequencies of NSR while those in the first quartile do not. Pairwise comparisons confirm this pattern. For Southern listeners with low Pragmatic Language scores (i.e., in the first quartile, which means they have few ASC-like traits), frequency of NSR has no effect on perceived professionalism (F(1,86.992) = .081, p = .776). For Southern listeners with high Pragmatic Language scores (i.e., in the fourth quartile, which means more ASC-like traits), frequency of NSR has a highly significant effect, and is correlated with a consistent (linear) decrease in ratings of perceived professionalism (F(1,70.991) = 6.399, p = .013).
Average ratings of perceived professionalism by frequency of NSR, region, and Pragmatic Language score.

The results in Figure 4 present us with two important findings. The first is that Northern listeners, on average, appear to be sensitive to differing frequency distributions of the NSR and demonstrate a gradient negative correlation between NSR frequency and percepts of speaker professionalism. That the correlation moves in this direction is to be expected given the socioideological load of morphosyntactic variability in the British Isles in general and of nonstandard agreement patterns more specifically. Our data thus confirm our prediction that increased frequency of NSR causes listeners to judge a speaker as sounding less “professional,” particularly in the overtly prestigious context of a newscast. The second finding apparent in Figure 4 is that the link between NSR frequency and perceived professionalism is mediated for Southern listeners by their Pragmatic Language abilities. In other words, it is not the case that all Southern listeners are sensitive to the frequency distribution of the NSR and consistently take it as a cue of progressively decreased levels of perceived professionalism. Rather, only those listeners with more ASC-like traits make this connection between linguistic form and perceived meaning. Southern listeners with a “neurotypical” cognitive style, on the other hand, do not appear to perceive NSR frequency as a salient correlate of (decreased) professionalism. Overall, it is not surprising that we find an effect of Pragmatic Language ability; indeed, awareness of the pragmatic meanings embedded in speech appears to be a prerequisite for individuals' ability to track socially meaningful patterns of linguistic variation (see, e.g., Wagner & Hesson, Reference Wagner and Hesson2014). Notably, however, our study appears to show the opposite pattern: sensitivity to NSR frequency is apparent only for those Southern listeners with high scores on the Pragmatic Language scale (and thus “impaired” pragmatic language skills). Next, we will discuss this initially surprising result, along with our other findings, and outline the broader implications they have.
DISCUSSION
The principal finding to emerge from these analyses is that our listeners are sensitive to the frequency distributions of both TH-fronting and the NSR. This result provides evidence against a strong formulation of the Interface Principle, or the belief that listeners are unable to evaluate abstract structural features (Labov, Reference Labov1993). Instead, the result demonstrates that, like phonetic variation, grammatical variation is also subject to social evaluation, and provides further support for the argument that our models of sociolinguistic cognition must be able to accommodate the existence of variable phenomena at different levels of linguistic organization (Campbell-Kibler, Reference Campbell-Kibler2011; Meyerhoff & Walker, Reference Meyerhoff and Walker2013).
That said, we also identify a difference in our listeners' relative sensitivity to the two types of variables examined; evaluative reactions to TH-fronting are unconstrained among the listener population in that the increased frequency of TH-fronting results in decreased ratings of perceived professionalism across the board. Evaluations of NSR, in contrast, are shown to be contingent on both a social factor (listener region) and a cognitive factor (the respondents' pragmatic language ability). In the most general sense, this difference in the evaluation patterns observed can be taken to indicate that listeners attend to the two variables differently, or, to use the definition of social salience, that TH-fronting is comparatively more salient to our listeners than the NSR is. It is possible that this difference in salience is due to some more general cognitive constraint that allows listeners to more readily evaluate phonetic variation than grammatical variation. If this were the case, the differences that we find in evaluations of TH-fronting and the NSR could support a weak version of the Interface Principle, which claimed that listeners evaluate abstract structural features in a comparatively more contingent fashion than they do more “superficial” variables, rather than that listeners did not evaluate the former at all. Though this weaker version of the Interface Principle provides an entirely plausible account of our findings, another explanation also comes to mind. The differences that we identify between TH-fronting and the NSR could be due to the age and vitality of the variables in question. As we have discussed, while TH-fronting is relatively new and still engaged in an active process of diffusion across the United Kingdom, the NSR is much more infrequent distributionally and may even be retreating in production in some areas (Childs, Reference Childs, Pérez, Carrilho and Magro2013; Cole, Reference Cole2008). It is therefore possible that the different patterns of evaluation we find do not reflect a cognitive bias for one linguistic modality over another, but instead a difference in terms of how variables are perceived at different stages of change. Further research would be needed to support either of these two interpretations. Yet despite this outstanding issue, and regardless of which of these possible interpretations is ultimately sustained, our findings provide direct evidence against a strong version of the Interface Principle by demonstrating that our listeners attend (albeit in different ways) to the social meanings of both phonetic and grammatical variation.
We would argue, moreover, that our contention that listeners might attend to variation on the morphosyntactic plane in systematically different ways can also help us to account for the social and cognitive conditioning we find in listeners' evaluations of the NSR. We begin with the first of the two constraining factors, namely the difference between Northern and Southern listeners' evaluations of the grammatical pattern. We argue that the region effect illustrated in Figure 3, that is, that Northern listeners generally attend to NSR while not all Southern listeners do, could be due to an increased amount of exposure to the NSR (and its social meaning) among Northern listeners. As we have noted, the NSR originated in Englishes spoken in the North of England and Scotland, and it is these varieties in which it is considered to be operative to this day (Buchstaller et al., Reference Buchstaller, Corrigan, Holmberg, Honeybone and Maguire2013; Pietsch, Reference Pietsch, Kortmann, Herrmann, Pietsch and Wagner2005). Indeed, research on contemporary British varieties reveals that the NSR is largely circumscribed to the linguistic North. As de Haas (Reference de Haas2011:109) suggested, “the only evidence of the NSR in the South East … was in Early Modern London English, but this was a ‘minority pattern’ and it no longer exists there today.” It is therefore perhaps not surprising that respondents from the South exhibit attenuated responses when asked to rate the acceptability of constructions containing the NSR (see Childs, Reference Childs, Pérez, Carrilho and Magro2013). Northern listeners, in contrast, live in the heartland of the phenomenon, and are statistically more prone to use the NSR themselves. They can also be expected to hear it being produced in their day-to-day interactions and to have had more consistent exposure to the socioindexical information that underpins the assignment of social meaning to the form. In addition, as part of the prescriptivist stigmatization of dialect morphosyntax (see Beal, Reference Beal and Hickey2010; Cheshire, Reference Cheshire1998; Cheshire & Milroy, Reference Cheshire, Milroy, Milroy and Milroy1993), Northerners are much more likely to have come across, or even been subjected to themselves, explicit negative attitudes regarding the NSR. This familiarity with the variable as a socially relevant feature in their local surroundings might thus result in an increased amount of consistency of evaluation of the NSR as sounding “unprofessional.” Research in perceptual dialectology and social psychology has demonstrated that all of these factors (e.g., exposure, local relevance, and consistency of evaluations) moderate the amount of attention listeners pay to particular variable patterns (e.g., Docherty & Foulkes, Reference Docherty, Foulkes, Burton-Roberts, Carr and Docherty2000; Levon & Fox, Reference Levon and Fox2014; Preston, Reference Preston2011). It is therefore straightforward to see why region may moderate the social salience of the NSR, leading Northern listeners to be more sensitive to the feature than Southern listeners are.
In addition to the social constraint of region, we also find a cognitive constraint (see Figure 4). For our Southern listeners, individual pragmatic profiles affect their reactions to the frequency distributions of the NSR. This result broadly supports Wagner and Hesson's (Reference Wagner and Hesson2014:661) contention that “pragmatic language … affect[s] individuals' impression formation [since it measures] … one's ability to generate said judgments.” Yet in the current study, we only find a relationship between pragmatic language skills and listener evaluations for Southern respondents. Moreover, the correlation that we find is in the opposite direction to what Wagner and Hesson predict, such that Southern listeners with higher scores on the Pragmatic Language scale (i.e., those with so-called pragmatic language deficits) are shown to be more sensitive to the NSR than those with lower Pragmatic Language scores are. What remains to be explained, therefore, is why Southerners with more ASC-like pragmatic language traits attend to the variable in ways similar to the Northern listeners and to a greater degree than do Southern listeners without these traits.
Though perhaps initially unexpected, we suggest that our findings on the effect of cognitive style on sociolinguistic perception dovetail with similar research in other areas. Work in cognitive science has shown that neurotypicality (i.e., the distinction between having autistic-like cognitive styles or not) can actually moderate attentional ability itself, with nonneurotypicals demonstrating an enhanced ability to perceive detail and low-level patterns (Frith, Reference Frith1989; Mottron, Burack, Iarocci, Belleville & Enns, Reference Mottron, Burack, Iarocci, Belleville and Enns2003). Moreover, work in experimental phonetics has demonstrated that this phenomenon also extends to linguistic processing, with nonneurotypicals showing an increased ability to perceive phonological distinctions and to imitate phonetic differences with a higher level of accuracy (Yu, Reference Yu2010; Yu, Abrego-Collier, & Sonderegger, Reference Yu, Abrego-Collier and Sonderegger2013). We would therefore argue for our data that those Southern listeners with high Pragmatic Language scores are drawn to attend to the distribution of NSR by virtue of the fact that they potentially have an enhanced perceptual ability for doing so. Among Northern listeners, in contrast, neurotypicality does not play a role given that listeners' attention is already drawn to the distribution of NSR because of their exposure to the variable and the consistency and relevance of their attitudes to it.Footnote 19 In other words, the social effect of region is such that it trumps any neurotypicality effects that may be present, causing all Northern listeners on average to attend to the NSR. For Southerners, in contrast, the lack of a strong region effect means that the threshold of attentional activation of the NSR is not automatically reached, thus allowing variability in individual cognitive styles to play a much larger role. In short then, we propose that cognitive factors such as ASC components also participate in the activation of perceptual attention, and we argue that the mechanism driving increased attention could be enhanced perceptual ability (or pattern recognition) rather than sensitivity to the pragmatic meanings of language itself.
Having said that, a pertinent question that this analysis raises is why the cognitive effect we identify is along the Pragmatic Language scale, and not, for example, the Rigidity scale (which is meant to measure things like attentional fixation). In their ongoing research on individual differences in perception of sociolinguistic variation, Wagner and Hesson (personal communication) encountered similarly unexpected results, which they argued could be because the statements used to test informants' social skills might in fact have grouped together different sociocognitive informant profiles that may independently affect how listeners evaluate variation in language.
We wonder whether a similar issue might be at play with the BAPQ (i.e., the instrument we are using to test for pragmatic language ability and other ASC traits). In their original presentation of the instrument, Hurley et al. (Reference Hurley, Losh, Parlier, Reznick and Piven2007) reported that principal components analyses justify the separation of the 36-item BAPQ questionnaire into distinct Aloofness, Rigidity, and Pragmatic Language subscales. In their testing, Hurley et al. found that the 12 target questions for each of these scales load onto separate factors, with high interitem reliability for each of the subscales (all α > .85). The participants in the current study, in contrast, treat the BAPQ as having a more complex multidimensional structure. When we run principal components analyses on their responses to the questionnaire, five significant factors are selected. Two of these correspond primarily to the Aloofness and Rigidity scales, respectively. The other three factors all correspond to different aspects of the Pragmatic Language scale, with our respondents distinguishing their responses to those statements that measure an individual's own speech habits (e.g., “I speak too loudly or softly”), an individual's ability to abide by pragmatic conventions (e.g., “I have been told that I talk too much about certain topics”), and an individual's ability to understand the pragmatic meanings of what others communicate (e.g., “I can tell when someone is not interested in what I'm saying”). While our analyses rely on the three-way split among Aloofness, Rigidity, and Pragmatic Language to ensure comparability with previous research on the topic (e.g., Wagner & Hesson, Reference Wagner and Hesson2014), the rather complex factor structure of our respondents' answers means that it is entirely possible that the BAPQ does not provide us with a sufficiently fine-grained instrument with which to tease apart the various components of “pragmatic language ability” that may have influenced the evaluation of sociolinguistic variation. In other words, our use of the BAPQ, and the Pragmatic Language subscale in particular, may entail a problematic conflation of multiple cognitive factors/profiles, which, in turn, might be responsible for the correlation we find between “pragmatic language deficit” and heightened evaluative sensitivity. In future research we plan to investigate differences in cognitive style with a more articulated testing instrument, such as the Autism Spectrum Quotient (Baron-Cohen, Wheelwright, Skinner, Martin, & Clubley, Reference Baron-Cohen, Wheelwright, Skinner, Martin and Clubley2001), which has separate subscales for social skills, communication, attention to detail, attention switching, and imagination. In doing so, we hope to be able to disambiguate the specific cognitive traits that may influence listeners' evaluation of socioindexical linguistic variation from those that are related to autistic-like behaviors more generally but that are not necessarily as relevant for sociolinguistic cognition. Ultimately, this would bring us one step closer to understanding the effect of cognitive style on sociolinguistic monitoring and allow for a more differentiated analysis of individual social and cognitive differences in listeners' perceptual reactions to linguistic variability.
CONCLUSIONS
Our goal in this paper has been to bring perceptual evidence to bear on the longstanding question of whether listeners show greater evaluative sensitivity to phonetic/lexical features than they do to abstract structural ones. The results of our experiment reveal that respondents evaluate variables that reside at both a more “superficial” and a “deeper” level of grammar, thus calling into question a strong formulation of the Interface Principle. Nevertheless, we do find differences in the factors that constrain listeners' perceptual judgments of TH-fronting versus the NSR. The essentially unconstrained nature of evaluations of TH-fronting as compared with the much more differentiated reactions to the NSR lead us to suggest that the social meanings of phonetic variation may in some sense be more readily available to listeners (i.e., more socially salient) than those associated with grammatical variation. While this proposal requires further testing to be confirmed, our results thus provide tentative evidence for a weak formulation of the Interface Principle that states that while listeners do evaluate abstract structural features, they do so in a comparatively more complex fashion than for phonetic ones.
The revision of the Interface Principle in this way allows us to account for claims in the literature that phonetic/lexical features show greater social and stylistic stratification than grammatical features do (e.g., Labov, Reference Labov1993). Yet, it also allows for the possibility that other factors, including a variable's social history, its contextual relevance, and other social and cognitive constraints, can render variation of abstract structural features highly socially meaningful. Ultimately then, our results provide further support for the belief that the perception of the social meanings of variation is a complex and contingent process, one that is moderated by a range of factors, including, but not limited to, the architecture of the linguistic system itself (Campbell-Kibler, Reference Campbell-Kibler2011; Levon & Fox, Reference Levon and Fox2014; Preston, Reference Preston, Zeigler, Gilles and Scharloth2010; Wagner & Hesson, Reference Wagner and Hesson2014). This point is an important one because sociolinguistic perception is (rightly) understood to underpin the actuation and progression of language variation and change. As Weinreich, Labov, and Herzog (Reference Weinreich, Labov, Herzog, Lehmann and Malkiel1968:186) noted, “the level of social awareness [of a variable] is a major property of linguistic change which must be determined directly.” We argue that direct determination of this kind requires us to go beyond context-independent generalizations about a feature's inherent salience and instead to focus our energies on modelling the diverse ways in which variables can attract evaluative meanings in specific social and interactional contexts.
APPENDIX
Newscast passage (target forms italicized)
1. The Geophysical Research Institute reports that (the) Voyager (spacecraft) is heading towards a thin layer at the outskirts of the heliosphere. The lead scientists confirms a large rise in the Voyager's plasma density readings, which indicates that the craft has reached the outer edge of the solar system.
2. The Irish Fisheries Board announced that seaweed products, which are primarily used as thickening agents and nutritional supplements, have seen a twofold rise in production rates over the past year. Seaweed products dates back to the 12th century and are an important part of the Irish export economy.
3. Scientists think that mutations of two newly discovered genes control the aging process. The protein-coding genes activates receptors that are sensitive to hormones such as insulin and human growth hormone.
4. After a string of meningitis B cases threatened to become an epidemic at the college this year, Princeton University will start offering a vaccination service to all students. Undergraduate students receives the jab for free, provided they fall under the groups that have an increased risk of meningitis.
5. A man who woke up alone in a dark plane cabin early on Thursday morning is suing British Airlines for compensation. Security experts takes the incident seriously as it is unclear how the man was able to remain on the plane after all members of the ground crew had left.
6. Cambridge Botanical Gardens will name a rare species of thistle that was previously considered to be extinct. The plants grows up to 12 inches in diameter and are primarily found on dry slopes in the Scottish Highlands.
7. The latest exhibit of a throne made of weapons is proving to be a popular attraction at the British Museum. During peak times, visitors waits for up to two hours to see the exhibit, which is rarely shown to the public.
8. Figures released today show that house prices in Britain have continued to rise throughout the past 6 months. Housing experts estimates a continuous increase during 2014.
9. And finally, freezing conditions are expected in most of the UK after thermometer readings showed temperatures of minus two degrees last night. Meteorologists predicts warmer weather for the week-end with sunny spells in the south and most of the north east.
10. The cold spell has seen an increase in flu-related illnesses—prescriptions for cold and throat infections have doubled in the past week. Clinics around the country offers free flu shots, which are recommended for the elderly and for people with a weak immune system.