1. Introduction
The demand for environmental quality – clean air, potable water, sanitation, safe food – is often presumed to be low in developing countries because of poverty and this is considered to be efficient since it reflects choices made by individuals in their own best interests. This presumption (common in the economics literature although not in public health) overlooks the fact that the poor are less likely to be aware of health risks than the rich, and low awareness may be just as important as poverty in suppressing the demand for environmental quality. Since awareness about a public good like environmental quality is itself a public good, it will be under-supplied by the market, resulting in a demand for environmental quality that is inefficiently low. In this paper, we use data from India on a specific public good, water quality, to empirically examine the importance of awareness. We exploit the fact that water quality can be, to some extent, improved by individual agents.
We use a national survey in urban India to examine the relationship between awareness proxies – education of adult household members, their exposure to mass media like newspapers, television or radio, and their occupations – and demand for environmental quality, controlling for other household characteristics including household wealth. Specifically, the hypothesis that we test is whether variables reflecting awareness of households are associated with the use of various home water purification methods. The assumption is that education and exposure to mass media improve households' knowledge about the relationships between drinking water quality and health outcomes and therefore increase their demand for better drinking water. We measure the strength of these awareness effects and compare them with the wealth effects.
Contaminated drinking water is a major health hazard in developing countries and diarrhea is the most common disease associated with it. This is particularly true for the poor and the vulnerable. The World Health Organization (WHO, 2002) estimates 1.7 million deaths and 54.2 million disability adjusted life years (DALYs) lost worldwide per year due to unsafe water, hygiene, and sanitation.Footnote 1 Almost all of these deaths are in developing countries and nine out of ten are child deaths. In India alone, there are more than a million child deaths per year resulting from waterborne diseases like diarrhea (Parikh et al., Reference Parikh, Parikh, Raghu Ram and Parikh1999).
Interventions to improve drinking water quality and minimize exposure to health risks from ingestion of contaminated water include provision of quality regulated piped water to all households. According to a WHO estimate, if universal piped and regulated water supply were to be achieved, 7.6 billion diarrhea cases could be averted annually worldwide. However, such large-scale state interventions are unlikely to be forthcoming in the short-run. This is especially true in the absence of a clearly expressed demand from the public, which in turn depends, among other things, on their awareness of the health hazards of drinking contaminated water.
A substitute short-term solution is disinfection at point of use. This includes inexpensive, low-grade technologies like straining with a cloth, using chlorine and safe storage vessels, to relatively more sophisticated and expensive technologies like electric filters that use ultraviolet radiation to remove pathogens. Private actions like these, even the inexpensive ones, can have large health impacts especially in regions of high child mortality. Straining with a cloth if folded over to form eight or more layers has been shown to be successful in removing copepods, which are a host for cholera bacteria (Colwell et al., Reference Colwell2003).
The question is: Why has the adoption of safe drinking water practices not been universal? Poverty is an important factor but it certainly cannot explain lack of use of even costless methods like straining with a cloth. According to a study in rural Bolivia (Quick et al., Reference Quick, Mintz, Sobel, Mead, Reiff and Tauxe1997), many people were unaware of the link between water contamination and diarrhea. So, undoubtedly, awareness is a determinant of the demand for safe drinking water.
Several studies in developed countries have established that schooling is associated with better health outcomes controlling for correlates like income (Grossman, Reference Grossman and Terleckyj1976; Farrell and Fuchs, Reference Farrell and Fuchs1982; Kenkel, Reference Kenkel1991). Some studies in developing countries (Cairncross et al., Reference Cairncross, Shordt, Zacharia and Govindan2005 in Kerala, India, and Borghi et al., Reference Borghi, Guinness, Ouedraogo and Curtis2002 in Burkina Faso) have found health education classes and awareness campaigns to be effective in promoting hygiene behavior known to provide protection against diarrheal disease (Curtis and Cairncross, Reference Curtis and Cairncross2003; Strina et al., Reference Strina, Cairncross, Barreto, Larrea and Prado2003), while results from others are more ambiguous (Curtis et al., Reference Curtis, Kanki, Mertens, Traoré, Diallo, Tall and Cousens1995).
In a study on households in the city of Kolkata, India, Roy et al. (Reference Roy, Chattopadhyay, Mukherjee, Kanjilal, Samajpati and Roy2004) estimate the elasticity of water purification expenditures with respect to years of schooling of the most educated member of the household to be approximately unity and that with respect to per capita expenditures to be more than one. Other studies on demand for water have also found evidence that education is an important determinant (Dasgupta, Reference Dasgupta2004; McConnell and Rosado, Reference McConnell and Rosado2000).Footnote 2, Footnote 3 Pattanayak et al. (Reference Pattanayak, Yang, Whittington and Balkumar2005) analyze household expenditures on coping strategies to combat the unreliable water supply in Kathmandu, Nepal. They find that controlling for variables such as wages, property values, and coping costs increase with education for both poor and non-poor households. Purification expenditures are an element of coping costs. Jalan and Ravallion (Reference Jalan and Ravallion2003) find that the provision of piped water in rural India reduces diarrhea significantly only among educated households, perhaps due to complementary actions taken by educated households.
In this paper, we examine the role of different potential sources of knowledge in the adoption of environmental risk-averting behavior in the form of water purification by households. We use schooling, exposure to news media, and occupational variables as our awareness indicators. We also examine the effects of the awareness indicators on averting expenditure, a lower bound for willingness to pay for safe water, controlling for wealth and a host of other socio-economic characteristics.
We summarize the main findings of our paper here. Each of the awareness indicators included in the analysis has an independent (of household wealth effects) statistically significant effect on a household's decision to adopt some home purification method. The magnitudes of these effects are by no means small and are comparable to the wealth effects. For example, a one-year increase in the schooling of the most educated adult in the household increases the probability of home purification by about 1.6 per cent if he is male, and 1.9 per cent if she is female. The former variable ranges from five to 15 years and the latter from one to 15 (these are the midpoints of the bottom and top quartiles of the years of education). Thus, these effects of schooling on the probability of purification are comparable in magnitude to the increase of 25.3 per cent that results from a move from the bottom to the top wealth quartile. The probability of purification rises by 8 per cent if a female household member reads a newspaper at least once a week.
Finally, using estimated probabilities of the different methods of purification from an econometric model, and average costs of the different methods from an informal survey of retail markets in the metropolitan city of Gurgaon, a suburb of Delhi, we calculate the expected expenditure on improving household water quality. Our estimates indicate that expected expenditure, a lower bound for willingness to pay for safe water, more than triples from Rs. 48 (5.10 USD at PPP) per household per year to Rs. 162 ($17.23) when the schooling of the most educated adult (conditional on her being female) rises from no schooling to 15 years.Footnote 4 (All other variables are held at their means when performing this computation.) By way of comparison, expected expenditure in the top wealth quartile is less than triple that in the bottom quartile, controlling for other variables. It rises by 28 per cent when a female member of the household reads a newspaper at least once a week.
Using average total household expenditure of all urban households and that of the bottom 40 per cent of the households as estimated by Sen and Himanshu (Reference Sen and Himanshu2004), expected expenditure on improving household water quality would constitute less than 0.2 per cent of average urban household expenditure and less than 0.5 per cent of the total expenditure of the bottom 40 per cent of the urban population.
The rest of the paper is organized as follows. The next section describes the data and reports summary statistics. Section 3 presents a simple theoretical model to motivate our econometric specification. Sections 4 and 5 formulate and present results from econometric models used to estimate the role of awareness in the household's decision-making process for home purification of drinking water. Section 6 estimates the effects of awareness and wealth on averting expenditure and section 7 concludes.
2. Data
We use data from the National Family Health Survey of India (NFHS) 2000, conducted by the International Institute for Population Sciences in 1998–1999. The NFHS sample covers 99 per cent of India's total population (union territories are not included) and is a household survey with an overall target sample size of approximately 90,000 ever-married women in the age group 15–49 years. The rural and urban samples in each state are drawn separately. We use the sub-sample from urban India. We include only those households with 15 or fewer members. We also exclude households for which some variables used in our analysis are missing. Our final sample size is 20,681 compared to 25,243 households in the original sample.
In urban areas, a three-stage sampling procedure was adopted. In the first stage, urban wards were selected using proportional-to-population-size sampling; in the second, one census enumeration block was randomly selected from each sample ward, and in the final stage households were randomly selected within each sample enumeration block.
The sampled households are evidently highly exposed to waterborne diseases. One of the questions asked in the survey was whether there were any cases of diarrhea among children aged 0–3 years in the two weeks preceding the survey. Of the 6,078 households that had children in this age group, 1,002 or 16 per cent reported at least one episode of diarrhea in the preceding two weeks.
We categorize households who treat their drinking water into four exclusive classes: (i) those that only strain drinking water with a cloth, (ii) those that use alum (aluminum sulphate, a flocculant) tablets and/or a candle filter or combine them with straining, (iii) those that boil their water, or strain and boil their water, and (iv) those that use some combination of the previous methods and/or use an electric filter. As discussed below, the source of drinking water varies. 11,877 households have it piped into the home, 4,404 get it from a public tap, and 4,400 get it from other sources such as wells.
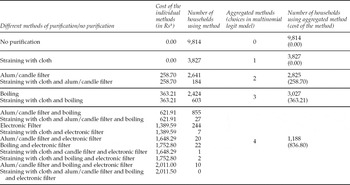
Since some households used more than one purification method, in order to cut down the number of alternatives, we have categorized together some combinations that accounted for fewer than 5 per cent of the observations (see table 1). The choices are mentioned in ascending order of their cost and effectiveness in removing pathogens. Straining is costless, while the average costs of ordinary filters, boiling, and other methods were Rs 259 ($27.55), Rs 363 ($38.62), and Rs 837 ($89.04) per household per year respectively. The prices of filters and alum were obtained from a market survey in Gurgaon, a suburb of Delhi, while the cost of boiling was derived from the price of cooking gas.Footnote 5 The costs of using the different purification methods are, therefore, only approximate since they are not gathered from all regions in India. However, this is unlikely to be important since there is little variation in the government-controlled price of gas, which drives the cost of boiling, and filters are standard consumer durables.
Different methods of purification and their cost

Note: a1 USD = Rs 9.4 at PPP.
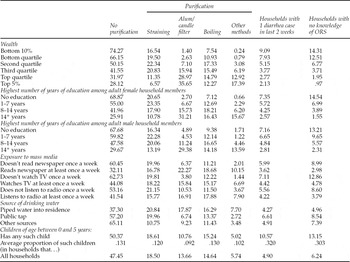
Table 2 reports purification adoption rates for households with different characteristics and the incidence of diarrhea as well as knowledge about oral rehydration salts (ORS) across various categories of households. Despite the high exposure to diarrheal disease mentioned above, a significant 47 per cent of households continue to consume water without using any water purification method. This percentage remains as high as 32 per cent even for households in the top wealth quartile and 28 per cent for the top 5 per cent of households.Footnote 6 Furthermore, only about 20 per cent of households use methods (i.e. boiling or electric filters) that reliably remove commonly found biological pathogens. As shown in Jalan and Somanathan (Reference Jalan and Somanathan2008), this may be because households are unaware of the poor quality of their drinking water and/or of the correlation between water quality and disease. It is unlikely that these percentages reflect the fact that some households actually know that their drinking water is safe.
Purification adoption rates, incidence of diarrhea and knowledge of ORS (%)

Note: The sample consists of 20,681 households from urban India in 1998–99. (The above table should be read as: ‘of the households in the category denoted by the rows in first column, what percent belongs to the categories given by the other columns’.)
There is no direct information in the NFHS about how informed a household is regarding the health risks arising from drinking contaminated water. We use schooling as a possible indicator of awareness.
Table 2 shows that the proportion of households who do not purify their water is smaller for households with more schooling. However, even among the most educated households (those with at least one adult with 14 or more years of schooling), 26–30 per cent do not use any water purification method and about 40 per cent strain their water, use alum tablets, or use a candle filter, methods that are not fully effective in removing biological pathogens from the water.
The NFHS collected data on women's exposure to mass media, another likely indicator of awareness. Among households not exposed to the print media, 60 per cent did not treat their water, whereas only 32 per cent of households with a newspaper-reading woman did not. This differential is somewhat less stark for two of the other media variables: watching TV and/or listening to the radio at least once a week.
The NFHS did not collect information on consumption or income. However, the survey collected information on household ownership of various consumer durables (cars, motorcycles, bicycles, refrigerators, telephones, color television, black and white television, radios, mattresses, clocks or watches, tables, chairs, etc.) and housing characteristics (house type, toilet type, number of rooms per capita, source of light, fuel type, utensil types, etc.). We construct a wealth index using the first principal component of these variables. The index is a linear combination of the variables that maximizes its variance in the sample subject to the constraint that the squares of the coefficients sum to one. The coefficient vector is, by definition, the eigenvector corresponding to the largest eigenvalue of the cross-products of these variables. (Appendix A provides the formal definition of the wealth index.)Footnote 7 The first principal component explains 24.36 per cent of the variation in the included asset variables. For ease of interpretation, we create and use wealth quartiles rather than the actual wealth index for most of our analysis.
There is some measurement error in the wealth index since it omits financial and human capital variables and the prices of durable goods are not available for use as weights. However, including the education variables mentioned above in the computation of the wealth index changes the ranking of households marginally: Spearman's rank correlation coefficient between the two indices is 0.988. We use a number of other variables such as occupational categories and other demographic variables as additional controls in our analysis. As will be seen later, the results suggest that measurement error in wealth is not a serious problem for our interpretation of the effects of the awareness indicators on purification behavior and averting expenditure.
Simple descriptive statistics suggest important wealth effects in the adoption of water purification methods. Households belonging to the upper wealth quartiles used costly purification methods like a candle filter or alum, boiling, or other methods. Thus while 2.6 per cent of households in the bottom quartile used alum tablets or a candle filter, this number increases to 29 per cent in the top quartile. Nearly two-thirds of households in the bottom wealth quartile used no water purification method; in the top quartile, this proportion was less than a third. Households in the top wealth quartile were the primary users of new technologies like electric filters, included in ‘other methods’ (see table 2 for further details). The proportion of households not purifying their water is lowest for those with piped water in their homes.
Other variables used in the analysis include state dummies to capture local fixed effects, demographic characteristics (household size, household head's age and age squared, marital status), socio-economic variables (religion and caste dummies), and place of treatment when ill (government hospital, private hospital, private doctor, other). Finally, we include variables to proxy for households' knowledge about symptoms when professional medical treatment of diarrhea is needed (repeated watery stools or vomiting, blood in stools) and knowledge about diarrhea care (know about ORS packets, quantity of water to be given during diarrhea).
The cross-tabulations reported in table 2 suggest strong unconditional correlations between household demand for drinking water quality and the different awareness indicators. However, many of these variables are highly correlated with each other so we use multivariate regression analysis to disentangle the independent effects. We do this in the next two sections.
3. To filter or not?
In this section we derive the household's demand function for filtration as follows. A household chooses a filtrationFootnote 8 method j from four available methods ranked in increasing order of price pj, and the level of consumption on other goods c to maximize utility

In equation (1), h represents the household's subjective belief about its health, a is its awareness that health is affected by water quality, and q is the household's belief about water quality as a function of the source s and f = (f 1, f 2, f 3, f 4), where fj is a dummy variable for filtration method j and w is household wealth.
This formulation rules out any effect of water quality on utility other than through the health channel. Since the objective is to infer something about the demand for treated, reliable tap water, this is an innocuous assumption. Even if it were the case that some households resort to home water treatment to improve water quality parameters such as turbidity for cosmetic rather than safety reasons, an improvement in the public water supply designed to assure safety would also improve these same parameters. Abrahams et al. (Reference Abrahams, Hubbell and Jordan2000) find that in Georgia, USA, water quality affects utility only through health except in the case of bottled water. Since bottled water was not in widespread use in India in 1998–99, it does not appear in our sample at all. One may also note the strong education effects that we find suggest that much of the effect of water quality on utility is through the health channel. After all, one does not need to be educated to perceive turbidity, odor, and taste, but education does help in perceiving health risks.
Let U 0 = U(h(a,q(s, f 0)), c 0) be the utility of a household if it does not filter its water and Uj = U(h(a,q(s, fj)), c 0 − pj) if it uses filtration method j. Using e to denote the expenditure function,Footnote 9 the averting expenditure on the chosen filtration method j is defined asFootnote 10

the willingness to pay for an increase in water quality from q(s, f 0) to q(s, fj), which in turn is less than or equal to the willingness to pay for an upgrade of the public water supply to a level that is reliably safe. This shows that averting expenditure is a lower bound for willingness to pay for safe water.
An increase in awareness that health is affected by water quality will cause an increase in the marginal rate of substitution between filtration and other goods, and thus lead the household to substitute towards more filtration. As long as health is a normal good, the demand for filtration will also be increasing in wealth.
4. Binary choice models
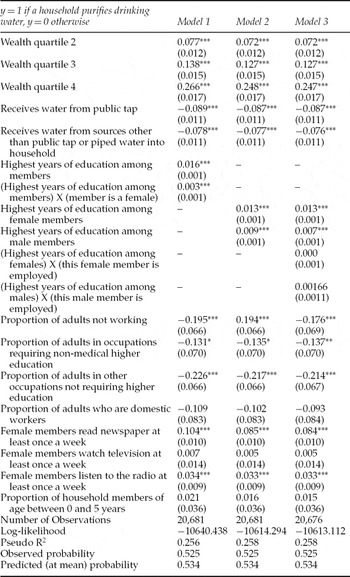
If we categorize the different filtration methods from the model in the previous section into a single group, and use a standard random utility framework, we get a binary choice model of purification. We begin by estimating a probit model of whether or not a household purifies its drinking water as a function of wealth, different measures of awareness, dummy variables for different types of water sources, and a number of control variables that may affect households' preferences or feasible sets. The marginal effects of the variables of primary interest are reported in model 1 of table 3, and those of the other variables are available from the authors on request.
Marginal effects of the bivariate model

Notes: Standard errors reported in parentheses. *indicates significance at 10% or lower, **indicates significance at 5% or lower and ***indicates significance at 1% or lower.
As expected, purification is a normal good. The probability of purification is 7.7 per cent greater for households in the second as compared to the bottom wealth quartile, and 26.6 per cent greater for those in the top as compared to the bottom wealth quartile. Education is also important in the household's decision to purify water. A single additional year of schooling for the most educated adult increases the probability of purification by 1.6 per cent if he is male, and 1.9 per cent if she is female. Since the median woman in the four education quartiles has 0, 7, 10, and 15 years of schooling respectively, this indicates that the effect of female education on the probability of purification is comparable in magnitude to that of wealth.
One concern with interpreting the strong effect of schooling on the demand for safe water as a result of awareness is that schooling increases human capital. Thus, it is possible that schooling is picking up a wealth effect on purification through the human capital channel. This is because lacking data on the prices of different assets, our measure of wealth is a noisy one. In order to test the plausibility of this alternative interpretation of the schooling effect, we estimate a model (model 2 in table 3) in which we separately control for the schooling of the most educated adult male and for the female in the household. Men tend to be in the labor force more frequently than women: the most educated man in each household has a 75 per cent chance of being employed, while the most educated woman has only a 15 per cent chance of being employed. Thus schooling translates into earnings at a greater rate for men than for women. Therefore, the human capital interpretation of the effect of schooling on purification would predict that it is stronger for men than for women.
Model 2 of table 3 shows that the marginal effect of an additional year of schooling of the most educated male is smaller than the corresponding female effect: 0.9 as compared to 1.3 per cent and this difference is significant at the 5 per cent level. Thus the data do not support the human capital interpretation of the effect of schooling.
We estimated another specification (model 3 in table 3) to check for an omitted human capital effect of wealth within each sex. This model interacts a dummy for whether the most educated man (woman) was employed with his (her) level of schooling. The coefficients on these interaction terms thus represent the additional effect on purification that a year of schooling has if the person concerned is employed. The marginal effect of the interaction was effectively zero for both men and women, again providing evidence that the effect of schooling on purification is not an omitted wealth effect operating through human capital.
Returning to model 1 in table 3, two of the media dummies, whether any female household member reads a newspaper at least once a week, and whether any female member listens to the radio at least once a week, are statistically significant (at the 1 per cent level). It should be noted that even though possession of a television or radio are components of the wealth index, they are also included independently as controls so that watching TV and listening to the radio do not proxy for ownership of these media. These results suggest that awareness about the health effects of water quality is transmitted through these media.
We now turn to the occupational variables in table 3 (model 1). We find that the marginal effect of a unit increase in the proportion of adults in occupations requiring non-medical higher education results in a 13 per cent fall in purification (significant at the 7 per cent level), where the left out variable is the proportion of adults in occupations requiring some form of medical education. An interpretation of this pattern could be that medical personnel are more aware of health risks although, less plausibly, it could also be because they have (unmeasured) higher permanent incomes. Since we do not have wage data, we cannot directly distinguish between these possibilities.
The corresponding marginal effects on purification of unit increases in the proportion of domestic workers and other less-educated workers are −11 per cent and −23 per cent respectively. It is interesting that the difference between domestic and other less-educated workers is significant at the 5 per cent level but the difference between domestic workers and workers with a non-medical higher education is not significant even though the income difference between the former two groups must be smaller than the income difference between the latter two. The most plausible explanation of this pattern is that domestic workers can learn about purification and its benefits from observing or performing this task in their (presumably wealthier and better-educated) employers' homes. This raises their purification rate to be more commensurate with that of better-educated, higher-income households rather than others in occupations not requiring a higher education but with incomes similar to their own. These interesting differences in purification rates underline the importance of awareness as compared to income in purification decisions.
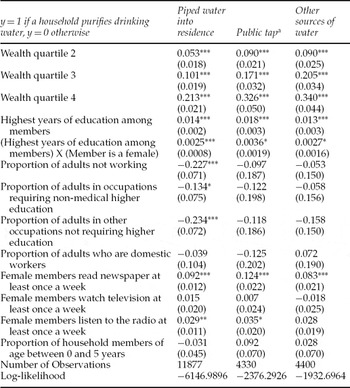
Table 3 shows that having a presumably lower quality water source (a public tap or other water source) as compared to piped water into one's home reduces the probability of purification. However in table 4, we report the marginal effects from probits for different water source sub-samples. The estimates in this table indicate that the marginal effects of wealth and education categories are higher for households that receive water from public taps and only slightly lower for households with ‘other’ water sources when compared to the marginal effects for households with piped water into the home.
Marginal effects from probit model for subsamples by water source

Notes: Standard errors reported in parentheses. *indicates significance at 10% or lower, **indicates significance at 5% or lower and ***indicates significance at 1% or lower.
aHaryana and Punjab predicted failures perfectly and hence STATA automatically dropped the 60 and 14 households respectively corresponding to these two states.
We also examined a number of alternative specifications to check the robustness of the results relating to the awareness variables: schooling, media exposure, and occupation.Footnote 11 First, a household may purify its drinking water, because its neighbor does so. If wealth and awareness variables are correlated with locality, then omitting local area dummies may confound learning from neighbors with other kinds of awareness effects and wealth. To test for this, we included ward dummies in a linear probability model. There are 1,026 wards. The marginal effects of interest have the same qualitative pattern (and statistical significance) in this ward fixed-effects regression when compared to model 1 of table 3, although the magnitudes tend to be smaller. For example, being in the top wealth quartile raises the probability of purification by 22 per cent rather than 27 per cent in this specification (relative to the bottom quartile) and the effect of an additional year of schooling is 0.8 per cent rather than 1.6 per cent. The smaller magnitudes of the effects may be due to linearity or correlation of the ward dummies with the variables concerned or both.
A different specification in which the wealth index was included directly in place of quartile dummies also yielded very similar coefficients and marginal effects for the awareness variables.
We also estimated a model that included interactions of the wealth quartiles and water sources with schooling. Only the interaction of the top wealth quartile dummy with schooling was statistically significant at the 5 per cent level. Marginal effects of other variables of interest were similar to the earlier results.
A household's perception of the health risks from drinking water and therefore its purification behavior could be affected by its past experience of water-borne disease. The past history of diarrhea may be correlated with the awareness variables of interest. Thus, controlling for this past history is desirable. While the history of diarrhea is not available, its occurrence in children aged 0–3 in the two weeks preceding the survey was recorded. We, therefore, also estimated a regression that included this variable. But since purification is likely to affect the probability of diarrhea, we instrument diarrhea by the frequency of diarrhea among other households in the same ward. The Smith and Blundell (Reference Smith and Blundell1986) test for the exogeneity of diarrhea was not rejected (p = 0.68). We also estimated the same regression without using an instrument for diarrhea. As before, the marginal effect of diarrhea is not significant, and the marginal effects of interest are robust.
While it would be interesting to know if home water purification actually does reduce the probability of diarrhea, the data do not permit us to identify such an effect. In particular, we lack information on what the households know about their water quality and on other possibly correlated risks of diarrhea that they face. Those more at risk will have a stronger incentive to purify their water so that the observed correlation between purification and diarrhea could be of either sign.
5. Expected averting expenditure from a multinomial model
5.1. Econometric methodology
We saw in the previous section that there is strong evidence that awareness affects the demand for environmental quality as expressed by home water purification. In this section, we examine the effect of awareness on averting expenditure, a lower bound on the willingness to pay for safe water. This is important from a policy perspective.
Expected averting expenditure, conditional on the vector of explanatory variables, is obtained by multiplying the cost of a purification method by its conditional probability of adoption and then summing over all methods. The probability of adopting any given method is predicted from a multinomial logit model, often used to model the demand for health inputs (Grossman, Reference Grossman and Terleckyj1976; Rosenzweig and Schultz, Reference Rosenzweig and Paul Schultz1983).
Let Y*ij be the ith household's utility from making the jth purification choice for j = 0,1,2,3,4, where j = 0 denotes not purifying, j = 1 denotes straining, j = 2 denotes the use of alum and/or candle filtration or a combination of these with straining, j = 3 denotes boiling alone or combined with straining, and j = 4 denotes combinations of these and electric filtration. The observed purification method used by the ith household is defined as

Yij* denotes the utility to household i from making the jth choice and is specified as

In the above specification, xi is the vector of observed household characteristics, and ɛij is a random error. The ɛijs are assumed to be identically and independently distributed with type I extreme-value distribution. Maximum likelihood estimates of the coefficients in the model are computed using standard numerical optimization algorithms.
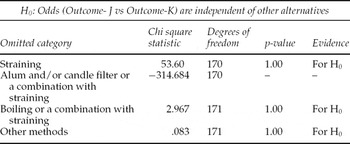
We perform Hausman and McFadden's (Reference Hausman and McFadden1984) test to check whether the assumption of independence of irrelevant alternatives (IIA) is valid in the models described by equations (2) and (3). The results are reported in table 5. For all except one alternative, the test provides strong evidence in support of the IIA assumptions. In the case of the one exception, the weighting matrix is not positive definite giving rise to a negative χ2 statistic and so the test is not valid.Footnote 12
Hausman tests of IIA assumption (N = 20681)

Notes: (1) If the chi-square statistic is negative, the estimated model does not meet the asymptotic assumptions of the test. (2) In each row, the chi-square statistic (and the corresponding p-value) is reported. The chi-square statistic is the weighted sum of squares of the differences between the coefficients of a model that includes all the alternatives and a model that excludes the alternative (choice) concerned. The weighting matrix is the inverse of the covariance matrix of the vector of differences.
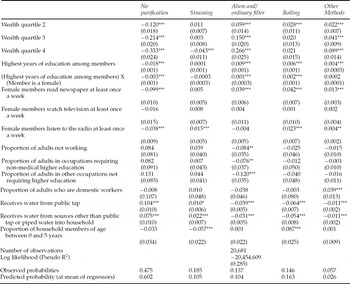
The estimated coefficients in the multinomial model are difficult to interpret. Instead, we report the marginal effect of each variable of interest on the probability of each outcome, evaluated at the means of the regressors. The analytical standard errors of the marginal effects for such a large sample (20,681 observations) and model are computationally very burdensome to calculate. Standard errors were obtained by bootstrapping the model using a sample size of 20,000 observations with 50 repetitions. The standard errors were robust to changes in the number of repetitions.
5.2. Results from the multinomial logit model
The marginal effects on the probabilities of different methods of purification are reported in table 6. The first column reports the estimated marginal effects of the different variables on the probability of no purification evaluated at the means of the explanatory variables. In congruence with the probit model, households in the top three wealth quartiles are more likely to adopt some purification method than those in the bottom quartile.
Marginal effects of the multinomial logit model

Notes: Standard errors reported in parentheses. * indicates significance at 10% or lower, ** indicates significance at 5% or lower and *** indicates significance at 1% or lower.
Use of a costless but inferior purification method like straining with a cloth is less likely in the top quartile of the wealth distribution. Wealth has a considerable effect on the household's decision to adopt a purification method that entails some cost to the household. For example, the probability of an average household in the second quartile using a candle filter and/or alum to purify its water is 6 per cent greater than that of a household in the bottom wealth quartile, and this difference is 27 per cent for the top wealth quartile. The most expensive ‘other methods’ display a similar trend with the probability of using them increasing with wealth, although the effects are smaller.
Education leads to the household adopting superior methods of purification. The marginal effects of schooling on the three costly methods of purification are all positive and significant. The magnitude of the marginal effect of schooling on the probability of not purifying is consistent with that estimated from the probit model.
Newspaper readership raises the probability of using each of the three costly purification methods significantly, while listening to the radio significantly raises the probability of straining with a cloth.Footnote 13
We also estimated the same model using observations from only those households who had a child in the age category 0–3 years. Our results were qualitatively similar to the full-sample estimates so we do not report them separately in the paper. Details are available from the authors on request.
6. Expected averting expenditure
The expected expenditure on purification conditional on the explanatory variables is

where P(Y = j|X) is the estimated probability of adoption of purification method j conditional on the vector of explanatory variables X from the multinomial model.
Per household mean averting expenditure was Rs. 137 ($14.57) with a median of Rs. 96 ($10.21) per year. For the same year, the all-India estimated average monthly expenditure of urban households was Rs. 3,762. For the poorest 40 per cent of the urban households, the average monthly household expenditure was Rs. 1,845 (Sen and Himanshu, Reference Sen and Himanshu2004).
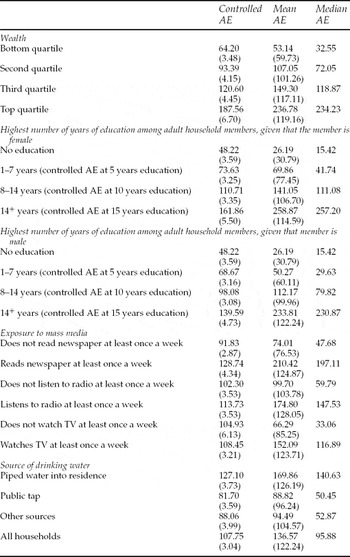
How does averting expenditure relate to household wealth, education, and media exposure variables? In column 1 of table 7, we report the ‘controlled averting expenditure (AE)’: we fix values of all variables other than the variable of interest at their mean levels and compute the expected averting expenditure. For example, it can be seen from column 1 of table 7 that the predicted expenditure for a household in the bottom wealth quartile whose other characteristics are equal to the means of the sample is Rs 64 ($6.80). This is greater than the mean expenditure of households in the bottom wealth quartile (Rs 53 ($5.64)), reported in column 2 of table 7 because those households tend to have lower education levels and other characteristics that lower their expenditure. We thus isolate the effects of the specific variable of interest from other household characteristics. In the other two columns, means and medians for various sub-samples are reported.
Descriptive statistics for expected averting expenditure (AE) (lower bound in INR)

Notes: Controlled AE is the expected AE holding all other variables at their mean values. Mean and Median AE and standard deviation (in parentheses) are respective group descriptive statistics for the expected AE.
Controlled averting expenditure nearly triples from Rs. 64 ($6.80) in the bottom wealth quartile to Rs. 188 ($20.00) in the top quartile. Median willingness to pay increases seven-fold between the bottom and top wealth quartiles from Rs. 33 ($3.51) to Rs. 234 ($24.89) reflecting the influence of covariates such as education.
Education has a comparable effect on averting expenditure. The controlled averting expenditure increases from Rs 48 ($5.11) in the lowest education class (no schooling) to Rs 162 ($17.23) in the highest (15 years of schooling).Footnote 14 It increases by nearly 50 per cent between the lowest education class and the second education class (five years of schooling).
Among measures of exposure to news media, reading a newspaper appears to have the largest effect on averting expenditure. Newspaper reading increases controlled averting expenditure by 40 per cent. The increases in controlled averting expenditure associated with exposure to the other two mass media – watching TV and listening to the radio once a week – are much smaller, and, in the case of TV, not statistically significant. In all other cases, differences in averting expenditure between the rows in any category in table 7 are statistically significant at the 5 per cent level.
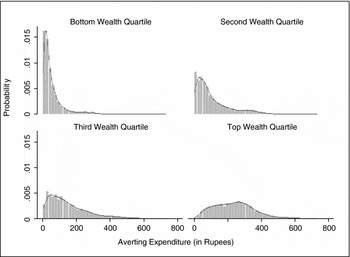
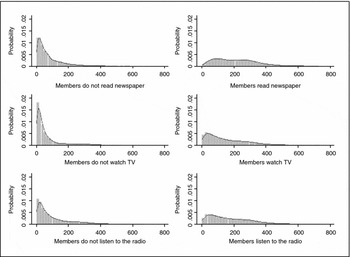
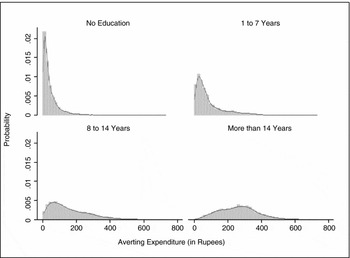
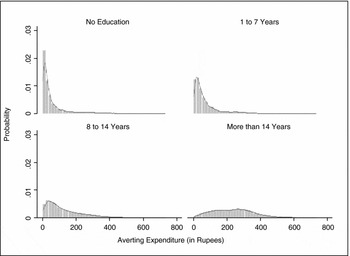
Figures 1–4 depict the kernel densities associated with estimated willingness to pay for the different wealth quartiles, for different years of education across genders and for exposure to mass media. The pictures depict very clearly that expected willingness to pay for improved quality of drinking water rises with the wealth quartiles, with more education and with greater exposure to media variables.
Averting expenditure across wealth quartiles

Averting expenditure across media exposure indicators

Averting expenditure across education levels of female adults

Averting expenditure across education levels of male adults

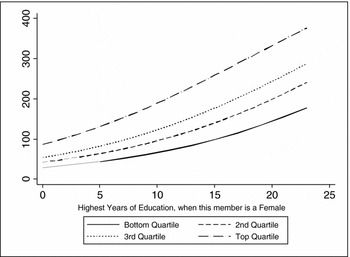
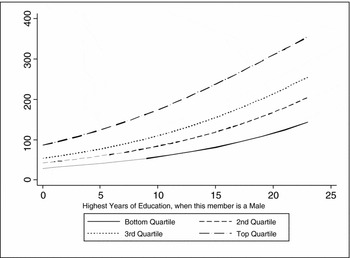
Figure 5 depicts the wealth and education effects on the controlled averting expenditure (other variables are held at their sample means). It provides visual confirmation that the effects are large and comparable to each other. Figure 6 provides similar information when education is measured as years of schooling of the most educated adult in the household, conditional on that adult being male (rather than female, as in figure 5).
Averting expenditure: highest years of education (when the member is female) across different wealth quartiles

Averting expenditure: highest years of education (when the member is male) across different wealth quartiles

7. Conclusion
Poor environmental quality increases the health risks that people face in their everyday lives. Individuals will be willing to pay for private or public measures that improve their environmental quality only if they are aware of the associated health risks and can afford to pay for prevention.
Our results show that wealth has a considerable and statistically significant effect on the demand for environmental quality as expressed by home water purification. However, we also find that there is a strong and comparable effect of educational attainment on the demand for environmental quality. Exposure to mass media, especially newspapers, also has a considerable effect on home water purification. Female education has a bigger effect on purification than male education, even though male labor force participation rates are much higher. This suggests that the human capital effect of education cannot account for the positive effect that schooling has on home water purification. A similar analysis with similar results was conducted within each gender. This provides evidence in favor of the presumption that it is through awareness, and not through the human capital component of wealth, that schooling raises the demand for environmental quality.
We find evidence of learning on the job: households with more members in medical occupations purify at greater rates than others. The estimated marginal effect of the proportion of adults working as domestic servants on purification is significantly higher than that of the proportion of adults working in other occupations not requiring higher education, while not being significantly different from the coefficient of the proportion of adults working in higher-income occupations that require higher education. This suggests that domestic servants' awareness of home water purification increases on the job so that their purification behavior comes to resemble those of their higher-income employers.
Taken together, these results suggest that omitted income effects and underlying preference variation are not behind the estimated effects of schooling, media, and occupational variables on purification. The experimental results of Jalan and Somanathan (Reference Jalan and Somanathan2008) further support the awareness interpretation of the strong correlations that we find between schooling and media exposure on the one hand and willingness to pay for water quality on the other.
The results from this paper suggest that the common presumption that awareness as compared to income has a second-order impact on the demand for environmental quality needs to be questioned more generally. Raising awareness about the health risks associated with consuming environmental goods of inferior quality via schooling, the news media, and other means is likely to be an important policy instrument in developing countries.
Appendix A: Construction of the wealth index
The wealth index for the ith household is defined as

In the above equation, aij = 1 if the ith household has asset aj, and 0 otherwise,


and fj is the ‘scoring factor’ for the jth asset, that is, (f 1,. . ., f 32) maximizes the variance of w subject to the constraint  .