Introduction
Ecological systems are often controlled by either bottom-up (nutrient ruled) or top-down (top-predator ruled) forces (Hunter & Price, Reference Hunter and Price1992; Polis & Strong, Reference Polis and Strong1996). In biological pest control sciences, the ‘top-down control’ concept (Hairston et al., Reference Hairston, Smith and Slobodkin1960; Oksanen et al., Reference Oksanen, Fretwell, Arruda and Niemela1981) is integrated to the management of agricultural communities; natural enemies (e.g. a predator) will cause a higher crop productivity by consuming herbivores (i.e. the pest), a phenomenon known as a trophic cascade. However, there are at least two factors that complicate this rather simple way of characterizing managed agricultural communities. First, agro-ecosystem communities are far from being characterized by harbouring few species linked by a linear trophic chain. Instead, they are often composed of several species that interact with each other forming complicated food webs (Polis et al., Reference Polis, Myers and Holt1989). Second, the structure of these communities may vary in time (Parker & Wiens, Reference Parker and Wiens2005) because agro-ecosystems are likely subjected to strong intra-annual biotic and abiotic fluctuations (Gratton & Denno, Reference Gratton and Denno2003; Ovadia & Schmitz, Reference Ovadia and Schmitz2004; Summerville et al., Reference Summerville, Bonte and Fox2007).
There is a growing literature of theoretical models that incorporate community modules composed of non-linear trophic interactions. Yet, because of mathematical constraints, such models incorporate few species. One of these simple community modules is the so-called intraguild predation (IGP), where two predators share a prey and one predator (the IG-predator) feeds on the other (the IG-prey) (Polis et al., Reference Polis, Myers and Holt1989; Holt & Polis, Reference Holt and Polis1997). Intraguild predation has been argued to be detrimental to biological control (Rosenheim et al., Reference Rosenheim, Kaya, Ehler, Marois and Jaffee1995) because theoretical models predict that at high productivity levels (typical of agricultural systems) the IG-predator will exclude the IG-prey, and this will result in an increase of the equilibrium density of the prey (i.e. the herbivore) (Holt & Polis, Reference Holt and Polis1997; Mylius et al., Reference Mylius, Klumpers, de Roos and Persson2001). Several experimental studies have shown the exclusion of the IG-prey by the IG-predator at high productivity levels (Lawler & Morin, Reference Lawler and Morin1993; Morin, Reference Morin1999; Diehl & Feißel, Reference Diehl and Feißel2000; Diehl & Feissel, Reference Diehl and Feissel2001), although results were not always in agreement with theoretical expectations (Diehl & Feissel, Reference Diehl and Feissel2001). More recently, it has been shown that the exclusion of either the IG-prey or the IG-predator might not be exclusively determined by the productivity level but also by the initial densities of each species (Montserrat et al., Reference Montserrat, Magalhães, Sabelis, de Roos and Janssen2008a). In addition, IGP may not disrupt biological control because IGP models do not consider factors that are likely to reduce the interaction between the IG-predator and the IG-prey in the field, such as spatial heterogeneity (Janssen et al., Reference Janssen, Montserrat, HilleRisLambers, de Roos, Pallini, Sabelis, Boivin and Brodeur2006, Reference Janssen, Sabelis, Magalhães, Montserrat and van der Hammen2007) or anti-predator behaviour of the IG-prey and the prey (Magalhães et al., Reference Magalhães, Tudorache, Montserrat, van Maanen, Sabelis and Janssen2005a).
Another community module of interest for pest control is that composed of two non-competing prey that share a predator. This module may lead to suppression of the focal prey species, because non-focal prey may sustain more predators (Holt & Lawton, Reference Holt and Lawton1994). This effect is known as ‘apparent competition’ because of the resemblance with the exclusion patterns observed when species compete for resources (Holt, Reference Holt1977). Several empirical studies showed the existence of predator-mediated apparent competition (Huang & Sih, Reference Huang and Sih1990; Karban et al., Reference Karban, Hougeneitzmann and Englishloeb1994; Muller & Godfray, Reference Muller and Godfray1997; Morris et al., Reference Morris, Lewis and Godfray2004; Liu et al., Reference Liu, Yan, Li and Wang2006; but see Birkhofer et al., Reference Birkhofer, Wise and Scheu2007, for predator mediated positive prey-prey interactions in a decomposer-herbivore system) and highlighted the significant role of shared predation in shaping community structure.
In the work presented here, we first identified the components of a relatively simple food web of an avocado agro-ecosystem of south-eastern Spain (see below). Next, we unravelled, through field observations and laboratory experiments, whether species co-occur and how they interact with each other, to ascertain the community modules present in this agricultural system. Then, we predicted the community changes that would increase biological control of a pest. Finally, we tested this prediction in a field population experiment.
Materials and methods
The system
The agro-ecosystem studied in this work is composed of avocado trees (Persea americana Mill., cv. Hass) and an exotic pest, the persea mite (Olygonychus perseae Tuttle, Baker. & Abbatiello). Avocado is a fruit tree species, which originated in Central America, which was introduced in southern Spain during the 16th century. Avocado leaves, seeds, roots (Armstrong, Reference Armstrong1964) and fruits (Platt-Aloia et al., Reference Platt-Aloia, Oross and Thompson1983) contain specialized oil cells, so-called idioblast cells, which accumulate alkaloids and terpenes (Platt & Thompson, Reference Platt and Thompson1992) with insecticidal, antifeedant and growth inhibitory activities (Rodriguez-Soana et al., Reference Rodriguez-Soana, Millar and Trumble1997, Reference Rodriguez-Soana, Millar, Maynard and Trumble1998, Reference Rodriguez-Soana and Trumble2000). This could be one of the reasons why most local putative pests have been unable to affect avocado orchards in south-eastern Spain (González-Fernández & Hermoso, Reference González-Fernández and Hermoso2005), exempting avocado trees from important pests until the arrival of the persea mite, a species originated in Central America as well, which probably coevolved with avocados. The persea mite was first detected in the avocado production areas of south-eastern Spain (provinces of Málaga and Granada) in 2004 (Vela et al., Reference Vela, González-Fernández, Wong, Montserrat, Farré and Boyero2007). This pest has been reported in most avocado growing areas worldwide, such as Mexico, the USA, Israel or Costa Rica (Vela et al., Reference Vela, González-Fernández, Wong, Montserrat, Farré and Boyero2007).
Oligonychus perseae builds circular-shaped nests on the underside of the avocado leaves, mainly along the midrib and main veins (Aponte & McMurtry, Reference Aponte and McMurtry1997). Nests are made of dense strands of silken webbing, with one or two small marginal entrances (Aponte & McMurtry, Reference Aponte and McMurtry1997). Inside the nest, females feed and oviposit and juveniles undergo development. Because of the feeding activity, the damage caused by the persea mite in avocado leaves is characterised by circular necrotic spots, which can occupy up to 90% of the leaf underside (Aponte & McMurtry, Reference Aponte and McMurtry1997), affecting the photosynthesis efficiency of the tree and, consequently, fruit yield. Among other functions, nests protect the persea mites from the attack of their natural enemies (Mori et al., Reference Mori, Saito and Sakagami1999).
Previous studies in southern Spain showed that several phytoseiid mite species are associated with the persea mite in avocado leaves (J.J. González-Fernández, personal observation). The two most common species are Euseius stipulatus Athias-Henriot and Neoseiulus californicus (McGreggor) (J.R. Boyero, J.M. Vela & E. Wong unpublished data). Euseius stipulatus is an omnivorous predator that is able to feed and reproduce on pollen of different plant species (Ferragut et al., Reference Ferragut, García-Marí, Costa-Comelles and Laborda1987). This species is not commercially available. Neoseiulus californicus is commercially obtainable as biological control agent of tetranychid mites (McMurtry & Croft, Reference McMurtry and Croft1997). Phytoseiid mites commonly engage in intraguild predation and cannibalism (Schausberger, Reference Schausberger2003; Montserrat et al., Reference Montserrat, Janssen, Magalhães and Sabelis2006), with relative size between contestants being the key factor determining the direction and the strength of predation (M. Montserrat, unpublished data), as in other IGP systems (Polis et al., Reference Polis, Myers and Holt1989; Magalhaes et al., Reference Magalhães, Janssen, Montserrat and Sabelis2005b). However, many phytoseiid species, including N. californicus and Euseius sp., reduce attacks on heterospecific or conspecific phytoseiids when other food sources are present (Hatherly et al., Reference Hatherly, Bale and Walters2005; Onzo et al., Reference Onzo, Hanna, Negloh, Toko and Sabelis2005; Zannou et al., Reference Zannou, Hanna, de MoRaes and Kreiter2005; Çakmak et al., Reference Çakmak, Janssen and Sabelis2006).
Population dynamics of the predator, the prey and the alternative food in the field
Olygonichus perseae populations were monitored in an avocado orchard, cv ‘Hass’, of ca. 70 avocado trees located at the E.E. La Mayora (Málaga) during 2006. Starting at the end of March, ten leaves at ca. 150 cm height were taken from ten randomly chosen avocado trees every 15 days. The number of occupied nests (those with mobile stages and/or eggs inside) on the upper margin of the second left vein of the underside of the leaf (UML2, hereafter) was recorded under microscope inspection. The number of occupied nests on the UML2 is a good estimate of the total number of individuals (mobiles and eggs) on the leaf (the number of occupied nests on the UML2 is highly correlated to the total number of nests on the leaf (y=11.84x+3.28, R2=0.80, P≪0.001, N=422), and the total number of nests on the leaf is highly correlated to the total number of individuals (mobiles plus eggs) on the leaf (y=2.98x, R2=0.84, P≪0.001, N=431)).
From six out of the ten previously chosen trees, 20 additional leaves per tree were collected to extract the phytoseiid mites using the method of Berlesse-Tullgren (Southwood, Reference Southwood1978; Hutchins, Reference Hutchins, Pedigo and Buntin1994). Phytoseiids were preserved and mounted as described in Gutierrez (Reference Gutierrez, Helle and Sabelis1985). Mites collected at the two dates of maximum phytoseiid densities were identified to species level. The identification was made using the keys provided by García-Marí et al. (Reference García-Marí, Ferragut, Costa-Comelles, Roca, Laborda and Marzal1987) and Ferragut & Escudero (Reference Ferragut and Escudero1997).
Because of unexpected results in the dynamics of the phytoseiid population (see ‘Results’), we obtained data of pollen concentration in the atmosphere to determine if this variable could explain the phytoseiid dynamics during the first half of the time series. Pollen data were obtained from the closest aerobiology station belonging to the Spanish Aerobiology Network, the REA (Red Española de Aerobiología). This station, located at a 10 km linear distance from the study area, uses a Hirst type volumetric pollen trap. This pollen sampler was kept operational from January 1st to December 31st 2006. Pollen types were identified following the methodology described in Domínguez et al. (Reference Domínguez, Galán, Villamandos and Infante1991) and Galán-Soldevilla et al. (Reference Galán-Soldevilla, Cariñanos González, Alcázar Teno and Domínguez Vilches2007). Data were expressed as the number of pollen grains per cubic metre of air.
Two distributed lag analyses (Judge et al., Reference Judge, Griffith, Hill, Luetkepohl and Lee1985) using the averages of data were carried out to explore whether pollen and pest abundance could explain the phytoseiid density with some lag. Specifically, we examined (i) whether pollen abundance correlated to the phytoseiid population dynamics during the first half of the time series and (ii) whether pest abundance correlated to the phytoseiid dynamics during the second half of the time series.
Interactions among the species of the food web – laboratory experiments
The study of the interactions among the species present in the avocado food web was done based on the results obtained in the field survey. Performance of the phytoseiid predators, with pollen as food source, was assessed only in E. stipulatus because this species was the most abundant when the abundance of pollen in the atmosphere was high and the population size of the persea mite was small (see ‘Results’). Laboratory experiments of predation of E. stipulatus and N. californicus on O. perseae were done in the absence of pollen because the maximum phytoseiid population size in presence of O. persea occurred when the amount of pollen in the atmosphere was low (see ‘Results’).
Stock cultures
Predatory mites were cultured in a growth chamber at 25±1°C, 65±5% RH and 16:8 L:D. Eusieius stipulatus was reared on plastic arenas placed on top of sponges in water-containing trays, with the edges of the arenas covered with tissue paper in contact with water, serving both as a barrier and water source. This species was fed with Typha sp. pollen twice per week. Individuals of N. californicus were kindly supplied by Biobest n.v. Westerloo, Belgium. Colonies were kept on detached cucumber leaves infested with spider mites that were placed on inverted pots inside water-containing trays. Pollen used for the rearing and for the experiments were obtained from male flowers, which were dried in a stove at 45°C for 24 h, and then sieved (350 μm). Females of O. perseae were obtained from detached infested avocado leaves, taken from avocado orchards located in the Experimental Station La Mayora.
Oviposition rate of E. stipulatus with pollen as food source
The goal of this experiment was to determine whether E. stipulatus is able to survive and reproduce when fed exclusively on pollen. Specifically, we were interested in assessing the suitability of olive (Olea europaea L.), avocado and maize (Zea mays L.) pollen as food source for E. stipulatus. This was because (i) Olea europaea pollen was the most abundant in the atmosphere prior and during the first phytoseiid population maximum (see ‘Results’); (ii) the flowering period of the cv. Hass avocado trees in our study area ranges from early April to mid-May (Alcaraz & Hormaza, unpublished data), the period that corresponds to the start of the increase in the phytoseiid populations (see ‘Results’); and (iii) maize plants were used as alternative food source for phytoseiid mites in other experiments (see section ‘Field population dynamics adding a source for alternative food’).
Experiments were carried out in a climate chamber (600 l) under the same conditions described above (25°C, 60% RH and 16:8 L:D). The experimental set-up consisted of plastic arenas (3.5 cm Ø) placed on a layer of water-soaked cotton wool inside plastic containers (100 ml, 6.7 cm high, lower diameter 5.1 cm, upper diameter 6.5 cm, Greiner nr 724201). The pollen of olive, avocado or maize was added ad libitum onto the arenas. Arenas without pollen were used as control. One E. stipulatus female (10–15 days old since egg stage) was placed on the arenas using a fine brush. After 24, 48 and 78 h, the number of eggs laid by female predators was counted. As predatory mites lay two to three eggs per day (van Rijn & Tanigoshi, Reference van Rijn and Tanigoshi1999) and they can carry only one egg at a time (Faraji et al., Reference Faraji, Janssen and Sabelis2002), the first egg laid by females during the first 24 h could still have been produced from food obtained prior to the experiment. Therefore, daily oviposition rates were obtained averaging the number of eggs laid by the females during the second and third day, to ensure that only the effect of the treatment was measured. The number of replicates per treatment varied between ten and 12. The number of eggs laid was analyzed with a one-factor ANOVA, with the type of pollen as the main factor. Means were separated with the Tukey Unequal N HSD test.
Predation rates on eggs and females of O. perseae
Predation rates on eggs of O. perseae were assessed on avocado leaf discs (3.5 cm Ø) that were placed upside-down on a layer of water-soaked cotton wool inside plastic containers similar to those used in the previous experiment. Ten persea mite females were added to each leaf disc and were allowed to feed, oviposit and produce nests for 48 h. Subsequently, females were disturbed by touching them with a fine brush until they reached one of the entrances and abandoned the nests. They were then removed without damaging the nests. The number of nests and of eggs laid per nest on each leaf disc was counted. Either one N. californicus or one E. stipulatus female was added to the leaf discs. After 24 h, the number of persea mite eggs remaining in the nests was recorded. There were ten replicates per treatment. Because one of the predatory species did not prey on eggs (E. stipulatus, see ‘Results’), no statistical data analysis of this experiment was performed.
The predation rate on persea mite females was assessed on leaf discs that were obtained as described above. After allowing ten persea mite females per leaf disc to feed, oviposit and produce nests for 48 h, the nests containing only eggs were removed with a brush. Since it is impossible to remove the eggs without damaging the nests and web and spider-mite eggs always co-occur, predation rate on adult females was measured in the presence of eggs. Either one N. californicus or one E. stipulatus female, or both were added to the leaf discs. After 24 h, the number of female prey eaten and the location of the predation event (i.e. either inside or outside the nest, based on where the corpse was found) were recorded. There were between ten and 13 replicates per treatment. Predation rate inside and outside the nests of the two predators were analysed using Generalized Linear Models, which allow for non-linearity and heterocedasticty in data. Analyses were done assuming a binomial error structure of data and a logit relationship between the mean of the response variable and the linear combination of the two explanatory variables (species of predator and location of the predation event) (Nelder & Wedderburn, Reference Nelder and Wedderburn1972; Breslow, Reference Breslow1996).
Field population dynamics adding a source of alternative food
The results of both field and laboratory experiments allowed us to characterize the interactions between the species present in the avocado food web and note how these interactions vary through time. Based on that, we predicted that prolonging the presence of an alternative food for predators beyond July would positively affect the density of the phytoseiid predator populations, an effect that in turn would negatively affect the density of the prey, O. perseae. To test this hypothesis, we conducted a field experiment during 2007 in a 2 ha ‘Hass’ avocado orchard located in the E.E. La Mayora. In the orchard, three lines of maize (cv. Lina, Semillas Batlle) were planted in two 80 m long×4 m wide laneways orientated north-south, separated by two laneways with no maize (fig. 1). Each row of maize was planted at different times (i.e. March 5th, March 19th and April 3th) in order to broaden the period with pollen-releasing maize plants. Maize was planted at 700×250 mm with two seeds per hole. Four trees from the plot with maize and two trees from lanes ca. 70 m far from the maize, and of each opposite direction (i.e. east and west), were selected (fig. 1). In each of the selected trees, the number of nests and of necrotic spots of the UML2, as well as the number of phytoseiid mites per leaf, were counted on ten leaves located at different branches and at ca. 150 cm height, five of them facing the east and five facing the west. The number of necrotic spots of the UHM2 is highly correlated to the total number of necrotic spots on the leaf (y=26.24x+12.84, R2=0.82, P≪0.001, N=434) and is a variable that estimates the damage produced by this pest in avocado leaves. Every 15 days, counting was performed in situ using a field magnifying glass (Ruper 8×), starting June 21st and ending the August 3rd. Trees of the plot with maize had a side facing a laneway with maize and a side facing a laneway without maize (fig. 1). To account for possible effects due to orientation, trees were chosen so that half of them had the laneway with maize orientated to the east and the other half to the west.
Experimental avocado orchard with intercropped maize plants. Thin lines represent laneways. Thick black lines are the laneways with maize. Grey circles are the trees chosen for sampling. Small black circles represent the wooden sticks for pollen deposition measures.

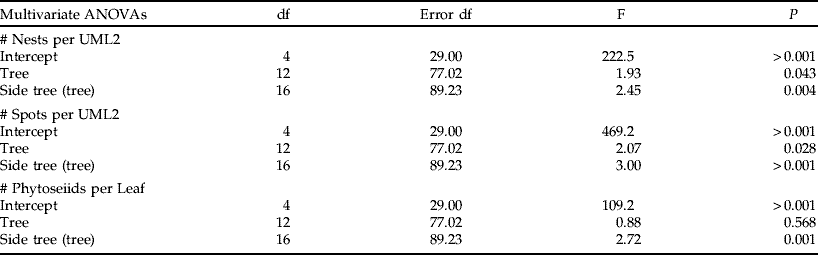
The number of nests and of necrotic spots on the UML2, and the number of phytoseiid mites per leaf were log-transformed to fit the assumptions of ANOVA. Each of the three variables were analysed separately with a repeated-measures ANOVA to assess their variation over time at the same sampling site (the avocado orchard). Huynh-Feldt adjusted probabilities were used when the sphericity condition was not met. Two types of analyses were done per variable. In the first (i.e. ‘within trees’), only trees from the plot with maize were considered. Damage and the abundance of the persea mite and phytoseiids were compared between different sides of the same tree, with laneway side (with or without maize) as an independent variable. Because of the large distance between leaves of two opposite sides of the tree (ca. 4–5 m) relative to the size of phytoseiids (ca. 1 mm), measures taken in two opposite sides of the same tree were considered as independent. Nevertheless, to account for possible dependence of data, an additional statistical analysis, i.e. two-factor Nested Manova with ‘tree’ and ‘side tree’ as factors, ‘side trees’ nested to ‘tree’ and each of the four dates used as dependent variables, is provided in the Appendix 1. In the second analysis (i.e. ‘between trees’), we compared trees from the plot next to maize plants with trees from the two plots far from maize plants.
Estimation of maize pollen deposition on avocado leaves was done by placing wooden sticks (ca. 180 cm long) in the ground (ca. 30 cm deep). The upper side of the stick had a wooden horizontal platform with a rectangle carved inside to fit a microscope slide. Two sticks were placed at each of the two sides (W or E) under four out of the eight trees chosen for the monitoring of populations, two from each treatment (with or without maize) (fig. 1). The wooden sticks were placed amid the avocado leaves of the periphery of the canopy, at ca. 150 cm height. Microscope slides were coated with a thin film of silicone and were left in the platforms for 48 h per week. In the laboratory, slides were stained with a glycerine jelly containing basic fuchsine and examined under the microscope at 400×. Each slide was longitudinally scanned once, covering the equivalent of 12 mm2, and grains of maize pollen were counted. Estimation of pollen deposition was expressed as the number of grains per cm2 and day.
Results
Predator-prey-alternative food population dynamics in the field
The population dynamics of O. persea was characterized by an exponential increase starting in July until the end of August, followed by a dramatic exponential decay-shaped decrease until the beginning of October (fig. 2). The dynamics of pollen in the atmosphere showed a similar shape, increasing exponentially at the beginning of February, reaching the highest density at the end of May and decreasing to very low levels at the end of June (fig. 2). The dynamics of the phytoseiid populations showed two maxima (fig. 2). The distributed lag analysis between pollen and phytoseiid abundances during the first half of the time series was marginally significant (R2=0.89, F 3=8.24, N=6, P=0.058) with the largest t value when the two time series had a lag of 15 days (corresponding to Lag=1, t 3=4.79, P=0.017). The distributed lag analysis between persea mite and phytoseiid abundances during the second half of the time series was statistically significant (R2=0.93, F 4=10.55, N=7, P=0.041) with the largest t value when the two time series had a lag of 30 days (corresponding to Lag=2, t 3=6.74, P=0.006). These results support the hypothesis that phytoseiid populations responded to the abundance of pollen in the atmosphere during the first half of the year and to the abundance of the persea mite during the second half of the year.
Population dynamics (mean±SE) of the persea mite Olygonichus perseae (grey triangles), the phytoseiid mites (▪) and pollen abundance (○) in an avocado orchard during 2006.

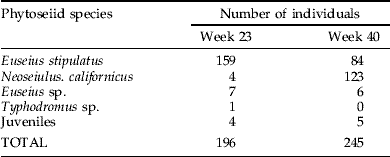
The identification of the phytoseiid species from the samples of the two population peaks (i.e. 1st half of June and 2nd half of September) revealed that 81% (corresponding to 159 individuals) of the individuals at the first peak were E. stipulatus and only 2% (four individuals) were N. californicus, whereas at the 2nd peak N. californicus was the most abundant species (50%, corresponding to 123 individuals), followed by E. stipulatus (34%, corresponding to 84 individuals) (table 1).
(a) Phytoseiid mite species and abundance in the two peaks of the dynamics of population (i.e. weeks 23 and 40). (b) Pollen species and abundances in the weeks of maximum density (weeks 20–23).
(a)
(b)
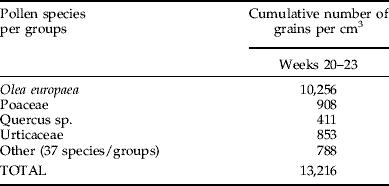
Olive was by far the most abundant pollen (77% of the total in May; table 1).
Interactions among the species of the food web
Oviposition rate of E. stipulatus with pollen as food source
Oviposition rates of E. stipulatus varied depending on the type of pollen (F 3, 39=34.11, P<0.001). The highest oviposition rate was obtained when predators fed on avocado pollen (1.91±0.09 eggs per day). Feeding on olive and maize pollen yielded an oviposition rate of 1.36±0.14 and 1.15±0.19 eggs per day, respectively. In absence of pollen, predators laid no eggs.
Predation rate on eggs and females of O. perseae
Predation rates on eggs of the persea mites differed between predators. Neoseiulus californicus ate an average of 18.00±3.44 eggs per day (fig. 3a), indicating that this species was able to go inside the nests of the persea mite. Euseius stipulatus did not feed on O. persea eggs (fig. 3a).
Predation rates (mean±SE) of E. stipulatus and N. californicus when they were offered (a) eggs of O. perseae laid by females inside the nest (□, eaten; , alive), and (b) females of the persea mite.

Both predatory mite species were able to hunt and kill persea mite females, although predation rates differed depending on the location of the females (Wald statistic=14.934, df=2, P=0.0006) (fig. 3b). Neoseiulus californicus killed approximately twice as many females of O. persea outside than inside the nests (0.69±0.21 vs. 0.23±0.17). Euseius stipulatus was only able to attack females outside the nests. When both species were together, the number of persea mite females killed was similar to that obtained by adding up the ones killed when each species was alone (2.0±0.39 vs. (1.2±0.2+0.69±0.21)). These results suggest that interference or enhancement did not occur between these two species.
Field population dynamics adding a source of an alternative food
When only trees in the plot with maize were compared (i.e. within trees analysis), fewer nests and necrotic spots of the UML2 and more phytoseids were found in the sides facing laneways with maize than in the sides facing laneways without maize (fig. 4, left panels). The same pattern was obtained when trees from the plot with maize were compared to those from the plot without maize (fig. 4, right panels). Therefore, the presence of maize pollen resulted in significant differences in species abundance and pest-induced plant damage (table 2).
Population dynamics (mean±SE) of the persea mite, phytoseiid mites, and number of necrotic spots in trees next to laneways with maize plants (○) or in laneways without maize plants (•). In the left graphs, only trees next to laneways with maize are considered and sides within the same trees are represented. Graphs on the right compare trees next to laneways with maize with trees next to laneways without maize.

Repeated measures ANOVA for each of the three variables measured (i.e. # nest per UML2, # spots per UML2 and # phytoseiid per leaf) when only trees from the plot with maize were considered (within trees analysis) and laneway side (with or without maize) was used as independent variable and when trees next to laneways with or without maize were compared (between trees analysis).

* , Huynh-Feldt adjusted probabilities and degrees of freedom when the sphericity condition was not met.
Maize pollen deposition on microscope slides placed next to laneways with maize was higher than those placed next to laneways without maize. The same pattern was observed for microscope slides placed under the same tree but in opposite sides (fig. 5).
Maize pollen deposition (number of grains/cm2/day) on microscope slides located next to laneways with maize plants (upper panels) and next to laneways without maize plants (lower panels). Different numbers in legends correspond to different trees, and W and E stands for West and East, respectively. Cm, closest to maize. Exact location of the wooden sticks can be seen in fig. 1 (□, 2W; , 2E, Cm; □, 3W, Cm; , 3E; □, 1W; , 1E; □, 4W; , 4E).

Discussion
Our field study revealed that the structure of the aboveground avocado community shifted through time. In spring, the community was mainly composed of an omnivorous predatory mite feeding on a ‘non-herbivore’ prey (pollen) (fig. 6a). No other herbivore species were present at significant levels, and only occasional observations of immature whiteflies, Tydeidae mites and Psocoptera insects were recorded. Probably because of this lack of herbivores, many of the other predatory groups commonly associated with pests, such as neuropterans, lady beetles and predatory bugs were only occasionally observed. Yet, the population of phytoseiid mites increased and reached a peak of ca. 0.6 individuals per leaf at the end of May. The phytoseiid community was dominated by the pollen-feeder E. stipulatus during the population peak. A weak positive correlation was obtained between the abundance of pollen in the atmosphere and that of phytoseiid mites on the avocado leaves. This result led us to hypothesize that phytoseiid mites were using the pollen deposited on the surface of the leaves as a food source. That pollen could be the main source of food for phytoseiid mites in the field during periods of low herbivore prey densities already has been suggested by several other authors in the 1980s (Garcia-Marí et al., Reference Garcia-Marí, Ferragut, Costa-Comelles and Marzal1984; Ferragut et al., Reference Ferragut, García-Marí, Costa-Comelles and Laborda1987) and even earlier by McMurtry & Scriven (Reference McMurtry and Scriven1965). More recently, Addison et al. (Reference Addison, Hardman and Walde2000) measured the deposition of wind-dispersed pollen on the surface of leaves on an apple agro-ecosystem in Canada, showing that phytoseiid abundance in spring were correlated with a two-weeks lag with density of birch pollen deposited on the leaves, a result similar to ours. Furthermore, in our system, olive pollen was the most abundant in the atmosphere, and lab experiments showed that the dominant phytoseiid species, E. stipulatus, can feed and reproduce on this food source. Olive is an anemophilous species, and pollen can be transported over large distances because of its small size (20–22μ). More than 20,000 ha of olive orchards are present in our area of research; and, although the density of deposited grains declines non-linearly from the source (Addison et al., Reference Addison, Hardman and Walde2000), the close presence of olive orchards and our correlation results suggest that olive pollen was a probable cause for the population increase of E. stipulatus during the first half of the year.
Natural community modules present in an avocado agro-ecosystem of south-eastern Spain during (a) spring and (b) summer, and (c) community module artificially created to control the pest O. perseae. White and grey drawings of phytoseiids correspond to E. stipulatus and N. californicus, respectively. Solid arrows indicate trophic interactions, dotted arrows indicate indirect predator-plant positive interactions (trophic cascade) and dashed arrows indicate indirect predator-predator (competition) or indirect plant-plant (apparent competition) negative interactions. The strength of the lines indicates the interaction strength. The question mark in (b) indicates that predation of E. stipulatus on N. californicus in the field, although potentially possible, it has not been measured either in this work or elsewhere.

In summer, the aboveground avocado food web was primarily composed of the omnivore E. stipulatus, the predator N. californicus and the herbivore O. perseae. Other herbivore/natural enemy species were only occasionally observed. The link between the omnivore and pollen disappeared, and potential competition or intraguild-predation between the omnivore and the predator arose (fig. 6b). The dynamics of the populations showed an exponential increase of the herbivore, followed by a two-lagged growth of the phytoseiid population. The most abundant predator at this time, N. californicus, preys mainly on spider mites. Our laboratory experiments showed that this species is able to enter inside intact nests of the persea mite and predates on both the eggs and females residing inside. Recent work described that females of N. californicus use their first pair of legs to rip the dense web of O. perseae nests and penetrate inside (Montserrat et al., Reference Montserrat, de la Peña, Hormaza and González-Fernández2008b). On the contrary, E. stipulatus, the second most abundant phytoseiid species during summer, seems not to be able to penetrate intact nests, and probably only attacks mobile stages wandering outside. The two phytoseiid mite species are potentially able to engage in intraguild-predation. Recently, however, it has been argued that habitat heterogeneity and antipredator behaviour likely reduce the strength of intraguild interactions in the field (Janssen et al., Reference Janssen, Sabelis, Magalhães, Montserrat and van der Hammen2007). We believe that this might well be the case occurring in the avocado agro-ecosystem under study and that at least two factors may dilute the strength of these interactions and their impact on the phytoseiid populations. First, competitive and predatory effects might not be so important in the field because of reduced encounters between the two species, given that one of them forages exclusively outside nests and the other also forages inside. Second, the nests of the persea mite may act as refuges for N. californicus. Indeed, in the field, eggs and juvenile phytoseiid stages have been repetitively observed inside the O. persea nest (J.J. González-Fernández & F. de la Peña, unpublished results). Furthermore, in this case, if the IG-prey enters a refuge, it does not come at a cost (Lima & Dill, Reference Lima and Dill1990; Lima, Reference Lima1998) but the opposite, because the prey itself inhabits it. Consequently, the negative effect of refuge use on population dynamics would not be expected in our system.
By manipulating the environment, we intended to artificially merge, as much as possible, two communities that naturally occur in the field, but at different times. By doing so, we pursued (i) to lessen the potential competition/intraguild predation interactions between the predator and the omnivore via addition of an alternative food source, i.e. pollen, for the omnivore (this was expected because many species only engage on intraguild predation in absence of other food sources); (b) to induce apparent competition between pollen and the herbivore, mediated by the shared omnivore (alternative food would sustain higher populations of the omnivore, which in turn would negatively affect the population of the focal prey species); and ultimately (iii) to reduce the population of the herbivore and the damage caused to the plant (fig. 6c). Our field experiments with intercropped maize plants showed that trees close to the pollen source harboured more phytoseiids and less persea mites and had less leaf damage. Such differences could even be seen within sides of the same tree. Periods of higher phytoseiid densities coincided with higher number of pollen grains deposited on the microscope slides located amid the avocado canopies. Altogether, the results indicate that the artificial addition of a source of alternative food to the system affected the abundance of the phytoseiid species positively, and pest density and damage negatively. However, this effect diluted with time because we failed at keeping constant the alternative food supply. We believe that the direct supply of stored pollen on the trees at regular intervals or increasing the time when pollen-releasing plants are at bloom will intensify the effects observed in our work and will, therefore, improve the biological control of O. perseae in avocados.
Agricultural communities are usually more complicated than those considered in community dynamics theory. Success in biological control of pests relies on the accurate predictions of community dynamics. However, predicting the resulting agricultural community after releasing a natural enemy to an agro-ecosystem, or artificially modifying its population size, is difficult. In the work presented here, we showed that integrating knowledge of community dynamics with information about species composition, co-occurrence and species interactions can substantially improve predictions in biological control of pests.
Acknowledgements
This work has been financed by Project AID06-02 (IFAPA, Junta de Andalucia), Biobest Biological Systems SL.U and the Spanish Ministry of Education (Project Grant AGL2007-60130/AGR). We thank J.M. Farré for fruitful discussions. S. Magalhães and an anonymous reviewer are thanked for improving the manuscript and the English. A. Janssen is thanked for letting us use his drawings of phytoseiids in fig. 6. Field experiments would not have been possible without logistic help from J.M. Hermoso and E. Guirado. M.M. was employed by the C.S.I.C. within the framework of a post-doctoral I3P-Fondo Europeo position. E.W. was employed by the Junta de Andalucía under the above project.
Two-factor nested MANOVAs with ‘tree’ and ‘side tree’ as factors, ‘side tree’ nested to ‘tree’, and each of the variables considered (i.e. # nests per UML2, # spots per UML2, and # phytoseiids per leaf) at each of the four dates used as dependent variables. This additional statistical analysis is provided to account for possible dependence of data in the ‘within tree’ analysis provided in the text. The analysis shows that trees differed in the number of nests and spots per UML. Yet, those variables differed depending on the side of the tree as well. The number of phytoseiid mites per leaf was also different depending on the side of trees.