1. INTRODUCTION
Fundamentally, engineering design is a human-centered process that is driven by human needs, motivated by human preferences, and conceptualized by human intelligence. Even in a society being increasingly driven by automation, design remains a science centered on capitalizing on the creativity, capabilities, and expertise of engineers. However, as global, social, environmental, and economic problems continue to challenge our world, engineers are progressively being called to apply multidisciplinary thinking to solve increasingly complex problems in elegant ways (Lewis, Reference Lewis2012). One area that is receiving considerable attention is the emergence of sociotechnical products. While the broader sociotechnical system term is used to describe a wide range of complex systems and products, in this work we focus on products that operate in an environment composed of separate but interdependent technical and social subsystems (Badham et al., Reference Badham, Clegg, Wall and Karwowski2000). Taking a high-level perspective on the design of such products, the product's engineering life cycle can be broken up into three phases: the analysis of the overall sociotechnical environment, the design of a product to meet the analyzed need, and the evaluation of the designed solution (Baxter & Sommerville, Reference Baxter and Sommerville2011). While the ultimate objective of this work is to develop more effective technical products that better support social subsystems, in this paper we focus on the evaluation of a current sociotechnical product as a means to inform next-generation products. As noted in the design principles given in Clegg (Reference Clegg2000), sociotechnical products should make problems visible. That is, the design of such products should reveal hardware or software problems and allow them to be identified and fixed quickly (Dankbaar, Reference Dankbaar1997).
In order to identify problems or, more generally, trends in product use, sociotechnical products demand new design approaches that consider the complex relationships between humans (e.g., users or designers), machines, and their dynamic use environments. For example, Baxter and Sommerville (Reference Baxter and Sommerville2011) identify an immediate need for methods to support the collection and modeling of information regarding everyday system use. More specifically, they denote the need for this capability in remote sites where interaction with the consumer through interviews or direct observation is impractical or too difficult. For example, embedded sensors are becoming more commonplace in industrial machinery to track failure diagnostics, in high-traffic areas to monitor transportation and environmental parameters, and in medical devices to monitor internal organ operation. However, sensors to capture use information are not yet pervasive in consumer products. This is partly because sensors generally measure product function in the form of visual, audio, force, and flow (signal, material, and energy) information and use preferences must then be implicitly derived based on the company's interpretation and decided cause of the observed product usage, which is a challenging task. With this capability, however, operational problems may be diagnosed, use expectations can be validated, and behavioral insights related to product function can emerge.
Analytics has been developed as an effective way to study such sociotechnical system challenges in a number of domains, finding traction in areas such as web analytics to study the interactions between people and the Internet (e.g., Goncalves & Ramasco, Reference Goncalves and Ramasco2008), business analytics to study the interfaces among human, hardware, and software capital in corporations (e.g., Saxena & Srinivasan, Reference Saxena and Srinivasan2013), and more recently design analytics to study the consumer use of engineered products (e.g., Van Horn et al., Reference Van Horn, Olewnik and Lewis2012).
Design analytics (DA) has been defined as “a broad architecture that integrates the digital capture of user data, the cyber-enabled support of concept development, and the understanding and use of product use data in driving a design process” (Van Horn & Lewis, Reference Van Horn and Lewis2013). This architecture seeks to give customers a direct role in the design and improvement of systems, products, and processes and to use cyber-enabled tools to support and enhance concept development. DA shares similar objectives to engineering informatics, which has been defined as “the study of the use of information and the design of information structures that facilitate the practice of engineering and of design artifacts that embody and embed information technology and science to achieve social, economic, and environmental goals” (Subrahmanian & Rachuri, Reference Subrahmanian and Rachuri2008). Informatics has a pronounced effect on initializing and enabling the first stages of a design process by storing, processing, and communicating information. Therefore, DA can leverage engineering informatics as an important infrastructure in the early stages of a design process where designers capture and evaluate information for defining customer needs (Grudin, Reference Grudin, Moran and Carroll1996).
In this paper, we select a home refrigerator as a representative sociotechnical product, where the refrigerator's hardware represents the technical subsystem while the users represent the social subsystem. Each subsystem can exist and operate independently from the other, but to fulfill the as-designed objective, interdependence between the two subsystems is required. In this context, we further develop the DA paradigm by demonstrating how design analytics-enabled insights can be used to redesign a refrigerator toward a next-generation concept inspired by social use data. We create an artificial simulation of a refrigerator use environment to study both user behavior and refrigerator design. As noted in Badham et al. (Reference Badham, Clegg, Wall and Karwowski2000), effective sociotechnical product design requires the joint optimization of both the technical (refrigerator) and the social (user population) subsystems. Only studying user behavior or refrigerator design would likely lead to degraded system utility. Therefore, in this work, we demonstrate a simulated approach to sociotechnical system modeling and design. The simulation is based on four distinct user types, each with 10 behavior traits. The behaviors are modeled using stochastic parameters and are described further in Section 3. This study is a simplified scenario of what could potentially be encountered by a company collecting product use data using actual deployed sensory-enabled refrigerators.
The purpose of the simulation developed in this work is to demonstrate how principles of DA applied to a product deployment design strategy can better inform the early stages of the following design process by capturing and analyzing product use data directly from a population of 1000 users to gain valuable sociotechnical insights. In Section 2, previous research related to the simulation, modeling, and design of sociotechnical systems using information technology is presented. In Section 3, the simulation program is presented along with the operating assumptions, experimental objectives, and usage profiles. In Section 4, the resulting data is analyzed and leading trends evaluated, demonstrating the potential insights gained. The conclusions, contributions, limitations, and areas of future work are presented in Section 5.
2. PREVIOUS WORK
Previous related work on sociotechnical product design using analytic techniques has focused on modeling either the social subsystem independently or the interaction of the social and technical subsystems. Sociotechnical products typically have the capability to generate large amounts of quantitative (captured via sensors, etc.) or qualitative (captured via on-line feedback, etc.) use data. This data is multidimensional in nature, and methods to represent and interpret such data are critical to optimal decision support. Recent work in these areas is discussed in the context of the design of sociotechnical systems.
2.1. Social subsystem
In the context of product design, a vast amount of information from consumer reviews and feedback forums is available and continually grows larger. For instance, Internet retailers such as Amazon capture extensive amounts of data in the form of written user reviews, and opinion mining has been used for extracting customer needs and preferences (Chen & Xie, Reference Chen and Xie2008). In related work, a text parsing algorithm and metrics are used to identify what product attributes are most commonly mentioned in product reviews to facilitate the measurement of their absolute importance (Rai, Reference Rai2012). This explicit information is then used to determine needs and preferences that are directly articulated by the customer. This knowledge becomes the centerpiece for product improvement and redesign, or identifying latent needs after a product is launched into the marketplace.
In other work, a continuous preference trend mining algorithm is developed that captures hidden trends of customer purchase patterns from large accumulated transactional data (Ma & Kim, Reference Ma and Kim2013). This algorithm also allows engineering designers in the early stages of design to determine effective product configurations that meet customer preferences and meet technological obsolescence requirements.
Because web consumer reviews can be cumbersome to aggregate, other work has focused more on information from social media sites such as Twitter® and Facebook® (Tuarob & Tucker, Reference Tuarob and Tucker2013). A correlation model is created to study the relationship between social media sentiment and the market adoption of products, developing metrics for subjectivity, polarity, and popularity of a product. Aggregating such diverse reviews creates other social-psychological challenges such as how to distinguish expert reviews from noninformed ones. In Burnap et al. (Reference Burnap, Ren, Papalambros, Gonzalez and Gerth2013), a Bayesian network model is developed to identify consumers from a large pool who have high design evaluation ability so that the opinions from these consumers can be weighted higher in the design process. While different levels of ability are not used in the simulation in Section 3, in further field studies, having the capability to discern the capabilities of different consumers would be a significant benefit.
2.2. Social and technical subsystem integration
From a design practice perspective, sensors and wireless communications are allowing companies to capture large volumes of information about their products' usage directly from their operation. For example, CarrierIQ offers digital metric tracking software for cell phones, which can deliver usage statistics of applications and hardware to the cell phone manufacturer or service provider (Roskowski et al., Reference Roskowski, Kolm, Ruf, Jaquet and Othmer2011). Coca-Cola® tracks the beverage selections on its Freestyle vending machines and measures how customers mix different drink flavors together (Culey, Reference Culey2012). Such abilities enable companies to identify both explicit and implicit customer needs.
From a design research perspective, other work is developing novel approaches to capture usage information from simulated use environments. For instance, empathic design has been formalized in the context of product design (Leonard & Rayport, Reference Leonard and Rayport1997; Bruns et al., Reference Bruns, Barrett, Evans and Johansson1999; Lin & Seepersad, Reference Lin and Seepersad2007) and has been shown to foster creativity in the development of innovative concepts to meet customer requirements (Genco et al., Reference Genco, Johnson, Hölttä-Otto and Seepersad2011). Although there is limited evidence of the scientific effectiveness of sensor-based empathic design techniques, a sensor-enabled chair to support the empathic design of future smart office chairs is conceptualized in Kujit-Evers and Steen (Reference Kuijt-Evers and Steen2008). Yannou et al. (Reference Yannou, Yvars, Hoyle and Chen2013) simulated various market usage scenarios for specific products to support the set-based development of a product that best covers the predicted usage space. Accommodating the variety of usage scenarios is met using a constraint satisfaction problem to maximize the feasibility of the design concept.
Other work has developed methods and tools to represent and analyze the type of data potentially created from the use of sociotechnical products (e.g., similar in size, and digital and real-time streaming) as discussed next.
2.3. Information visualization and utilization
With the emerging capability to extract both quantitative and qualitative information from sociotechnical systems, methods and tools to represent the information for effective next-generation product development are necessary. In addition, as simulation and product use information are received at increasingly faster rates, solution space models are constantly being adapted, refined, and expanded (Johnson et al., Reference Johnson, Moorhead, Munzner, Pfister, Rheingans and Yoo2006). Tools to handle, analyze, and visualize this information have focused on providing designers with adaptable representations that can handle the inflow of information.
One recent example of such tools is the design decision-support tool Rave, which is a platform that offers a variety of capabilities for design problems, including data visualization, optimization, and surrogate modeling (Daskilewicz & German, Reference Daskilewicz and German2012). In particular, visual analytics is emphasized in Rave as a practical approach for interactive knowledge discovery, allowing for the identification of a particular segment of a design space where new data can be generated and new analyses can be conducted.
Researchers at the Applied Research Laboratory and Penn State have developed the Applied Research Laboratory Trade Space Visualizer, which is a data visualization software used for creating a variety of multidimensional trade spaces (Stump et al., Reference Stump, Yukish, Simpson and Harris2003, Reference Stump, Yukish and Simpson2004). A trade space refers to the relationships between the design variables of a system and the resulting performance outputs. The Applied Research Laboratory Trade Space Visualizer visualization tools allow designers to “shop” and explore the rapidly evolving trade space for a competitive or desirable design solution, and then narrow on an optimal design (Stump et al., Reference Stump, Yukish, Lego, Simpson and Donndelinger2009). This is advantageous compared to exhaustive optimization schemes, which have challenges with proper objective and constraint formulations in complex systems (Balling, Reference Balling1999).
In other related work, a high dimensional model representation is developed to support the interactive improvement of a design by identifying regions of interest or enhanced performance (Cutbill et al., Reference Cutbill, Hajikolaei and Wang2013). Engineers can then improve the analytical and visual representation of the model in these regions using more simulation information.
Eventually, this information is then used to develop next-generation products. Having digital representations and models of new sources of information may also transform how design concepts are generated. For instance, accessing information from a digital product repository may increase the number of ideas available in the early steps of design (Bryant et al., Reference Bryant, Stone, McAdams, Kurtoglu and Campbell2005). Besides expanding a designer's knowledge base, the additional ideas may also increase designer creativity (Stone et al., Reference Stone, Bohm and Szykman2005).
Beyond simply supporting a designer's concept generation, intelligent tools can facilitate the generation of significantly more concepts, sometimes even orders of magnitude more. For example, the VisualizeIT project uses a graphical functional model as input and an algorithm to populate the model with components that are stored in a database (English et al., Reference English, Naim, Lewis, Schmidt, Viswanathan, Linsey, McAdams, Bishop, Campbell, Poppa, Stone and Orsborn2010). Depending on the size of the functional model, potentially millions of concepts can be generated. To reduce the solution space, clustering techniques are used to segment solutions based on their uniqueness. Although a degree of designer fixation is observed while using VizualizeIT, users often developed abstract system representations that are thought to foster creativity (Shah, Reference Shah1998).
A form-to-form model uses a chain of components as the input instead of a functional model (Bohm et al., Reference Bohm, Stone and Nagel2009; Bohm & Stone, Reference Bohm and Stone2010). This approach is based on the observation that designers tend to think in terms of components instead of functions when they mentally develop solutions. As a result, the approach queries the component chains within a design repository and returns the appropriate functions and flows. Then, the functional model is used to produce a variety of components that the designer may investigate for concept development.
In this work, we use moving average and heat map tools to visualize the simulated use data, but integration with different visualization tools is an area of expansion. In addition, anecdotal insights into next-generation refrigerator designs are made, but more formal integration with the digital concept generation tools is an area of future research.
Although it is clear that there has been some effective research in DA, the majority of the studies have leveraged information from either online consumer opinion sources or product simulations. Another rich source of information that can impact an analytics-driven design process is product use and performance information captured using sensors at sociotechnical intersections either onboard the product or positioned in a local operating environment.
Because of the current limitations in embedding sensors in thousands of consumer products, in this work we simulate the use of embedded sensors in refrigerators and demonstrate the application of various elements of DA when processing the simulated use data from a variety of user groups. In the next section, the simulation program is presented.
3. PRODUCT USE SIMULATOR
In order to demonstrate the impact of DA on a sociotechnical system, a simulator coded in MATLAB® is used to model the interactions between customers and the engineered product. A hypothetical refrigerator is studied, and an artificial data set of product use is generated and analyzed to drive the next generation design process. This study is a significant extension of the illustrative refrigerator example from Van Horn et al. (Reference Van Horn, Olewnik and Lewis2012), now incorporating consumer profiles, food placement heuristics, and the ability to produce large data sets to study emergent trends. In this paper, the simulator models different usage profiles stochastically in the profile creation, developing a data set representing what could happen in a multiuser use scenario. The key assumptions of the simulator and subsequent data study are the following:
• The simulated sensor feedback is assumed to be completely accurate and reliable (Section 3.1).
• The food placement algorithm does not model food stacking or orientation variables (Section 3.2).
• Refrigerator and food geometry are both scaled to be unitless (Section 3.2).
• The usage profiles are constructed using simple behavioral assumptions to mirror the placement strategy of actual users (Section 3.3).
• Each profile integrates an assumed but parametric degree of behavioral variation (Section 3.3).
3.1. Case study introduction
The case study considers a hypothetical refrigerator being manufactured and sold by a company that wants to leverage principles from DA to improve its next-generation concept, adapted and expanded from Van Horn and Lewis (Reference Van Horn and Lewis2013). The refrigerator is based upon contemporary market offerings, shown in Figure 1. Looking at the three brands, the number of shelves in the cooling section varies from three to five. In all examples, the bottom shelf also represents the top of a food crisper, a common compartment that reduces humidity to extend the freshness of fruits and vegetables. While the top of the crisper is used in the simulation as a shelf, the actual crisper compartment is not used. In addition, only the cooling section of the refrigerator is considered, and the door compartments are not modeled.
(Left) A layout using three shelves, (middle) a narrower cooling section with four shelves, and (right) a “French” half-split design with five shelves.

The cooling section of the hypothetical refrigerator in virtual form is shown in Figure 2. The shelves are segmented into squares of one unit length. For easy visualization, different colors are used on alternate shelves and the refrigerator sidewalls are not shown. Each shelf is eight units wide by seven units deep, similar to the common rectangular shape of shelves in the Frigidaire refrigerator from Figure 1. Five shelves are included in total with the refrigerator, and there are six slots spaced one unit space apart to give customers the ability to space shelves vertically as they please. The refrigerator characteristics and configuration options are discussed in further detail in Section 4.
(Left) A refrigerator cooling section with five shelves, and (right) shelves containing food items.
The hypothetical company's objectives include understanding elements of the diverse sociotechnical interactions, such as how customers use the refrigerator storage space and if there are more effective ways to utilize the storage space. As a result, the following objectives are developed to guide the study of the simulated product use data:
1. Determine if the number of shelves included with the refrigerator is minimally adequate for the users' preferences.
2. Determine if the upper shelves in the refrigerator (slots 5 and 6) are used most by the user population.
3. Determine if the height of food items is generally the same on each shelf present in the users' refrigerators.
4. Verify if the leading behavior of the user types (discussed in Section 3.3) can be used to accurately classify a randomized population into one of the four usage profiles.
In order to measure usage that supports these objectives, the company outfits its current generation refrigerator with sensors to create a sociotechnical product that measures the intersection between customer interaction and product function and performance. The simulated information that could be generated from the sensors is produced through the five steps outlined in Section 3.2. For this study, we simulate the use of pressure sensors placed in each slot of the refrigerator to detect the presence of a shelf and the frequency of food movement, and optical line-of-sight sensors embedded in the sidewalls of the refrigerator to indicate the basic geometry and location of food items on each shelf. While we assume accurate sensor data, any sensor in a real-world environment will be subject to a certain degree of error.
Combining the information from these sensors could enable a company to re-create the virtual refrigerator layout from Figure 2. Depending on the depth of detail sought by the company, more sensors may be added to capture other information such as the Universal Product Code (UPC) of the foods, branding of reusable containers, and detailed visual information to discern food stacking and orientation. While these avenues are beyond the core objectives of this study, capturing such details may become more relevant in a future product.
In addition to tracking usage directly from a deployed product, data may also be collected from external sources, such as the operating environment (e.g., demographic, geographic, and temporal influences). In this work, only data modeling direct customer interaction with the product is considered.
3.2. Simulator overview
The operation of the MATLAB simulator is illustrated in Figure 3. The first step is to initialize the size of the refrigerator, which includes shelf dimensions and the number of slots for shelves. In the second step, the total number of simulated refrigerators is set, along with the length of the simulation. In addition, the current profile being simulated is defined by randomly selecting one of four available usage profile types for driving refrigerator usage. The users then set up their refrigerator according to their particular preferences (the number of shelves used and where they are placed inside).
Flow diagram of the MATLAB® simulator.
Step three simulates refrigerator usage, where the users move food items around, expire (or consume) foods, and add new foods. At Step 4, it is checked whether the required number of cycles on a given day or if the number of days being simulated have been reached. If so, the simulator moves to the next consumer profile in the population and returns to Step 2. This process repeats itself until all customers have been simulated and the code terminates at Step 5.
A small food library stores geometrical data in unitless form modeling common groceries such as milk, a carton of eggs, yogurt, and plastic storage containers. A packing algorithm is used for placing foods on shelves based on simple observed heuristics. When a food item is placed, there is a 75% chance that the user places the food item toward the front of the shelf versus the back. Then, there is an equal probability that the user places the food item to the right or left limit of the shelf. Food items cannot be stacked or rotated in any way.
As foods are placed, the packing algorithm checks for object collision and ensures that two items do not occupy the same position. If an item does not fit on a preferred shelf, shelf preference is conceded and another shelf is randomly chosen. All available shelf spaces are searched when attempting to place a food item. This packing behavior is common for all four usage profiles. More advanced packing algorithms, including orientation and stacking heuristics, are the topic of further studies.
3.3. Usage profiles and behavior variables
The social system of the refrigerator is composed of four different customer usage profiles that drive refrigerator usage. These usage profiles are based on certain behavioral assumptions and are not intended to model all possible product use scenarios that occur in the real world. The goal is to study simulated product use data to identify emerging trends and underlying customer preferences. In turn, the hypothetical company could use these findings to drive the design of a future generation of products. The profiles are qualitatively characterized, and then quantitatively represented as behavior variables. In each profile it is assumed the number of shelves preferred by the user is a leading behavior variable, because the available shelving area constrains other behaviors such as the number and size of the food items that can fit inside the refrigerator. The usefulness of this assumption is validated later in Section 4.
3.3.1. Usage profile 1
This profile is light users such as single persons without roommates. This type of customer tends to use a small number of shelves, and prefers to place shelves toward the top of the refrigerator. They store only a few food items at a time that are generally tall and small in cross-sectional area. They have little preference for which shelves food goes on. In general they are light users of the refrigerator, only moving, expiring, and adding items around three times a day.
3.3.2. Usage profile 2
This profile is a light to moderate user representative of a one- or two-person family. These customers use several shelves, and prefer to place shelves at or above the midpoint of the refrigerator. They store about a half-dozen food items at a time that range from tall and small in cross-sectional area to midsize in both height and cross-sectional area. On a typical day, the refrigerator is accessed four times a day to move, expire, and add items.
3.3.3. Usage profile 3
This profile is a moderate user representative of a two- or three-person family. The majority of the available shelves are used, and the customers prefer to place shelves anywhere but the lowest slots. They store about a dozen items at a time, which are mainly medium to large items in height and cross-section. On a typical day, the refrigerator is accessed six times a day to move, expire, and add items.
3.3.4. Usage profile 4
This profile is the heaviest refrigerator user representative of a four- or five-person family. They use all available shelves, and do not have a preference toward shelf placement. About two dozen food items are stocked at a time, of all sizes and shapes. They access the refrigerator many times per day to move, expire, and add food items.
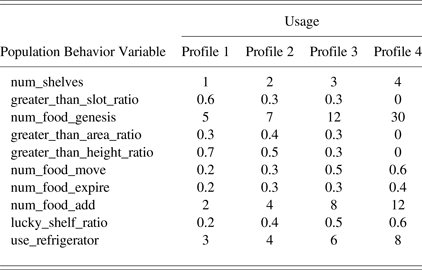
Each of the four profiles is quantified with 10 behavior variables:
1. num_shelves: the number of shelves that are used in the refrigerator
2. greater_than_slot_ratio: the preferred shelf location of each shelf inside the refrigerator
3. num_food_genesis: the number of food items initially stocked in the refrigerator
4. greater_than_area_ratio: the allowable area for a food item
5. greater_than_height_ratio: the allowable height for a food item
6. num_food_move: the number of food items moved each time the refrigerator is accessed
7. num_food_expire: the number of food items expired each time the refrigerator is accessed
8. num_food_add: the number of food items added each time the refrigerator is accessed
9. lucky_shelf_ratio: the preferred shelf that a customer prefers to put food on
10. use_refrigerator: the number of times the refrigerator is accessed per day
Because it is unrealistic for all users to fall strictly into one of the four usage profiles, a nondeterministic element is added to the simulation model so that most users may be captured. For users belonging to a particular usage profile, each of their behavior variables has a 75% chance of equaling the default value for their profile. In the 25% case, the behavior variable has equal chance of being the default value of one of the other three usage profiles. In the simulator, a uniform random probability density function is used to assign the appropriate value to a behavior variable. The behavior variables for each customer type in the social subsystem are shown in Table 1.
The four usage profiles and the values for each of the behavior variables
3.4. Metrics for data analysis
As the simulator runs, three metrics quantify product usage and are updated continuously. The first metric is the cumulative moving average of shelf placement, which is shown in Figure 4 and calculated as
Cumulative moving average of shelf placement.
 $$\hbox{Moving Average}_{i\comma j} = \displaystyle{{(\hbox{Moving Average}_{i - 1\comma j})({i - 1} )+ {X_{i\comma j}}} \over i}. $$
In Equation (1), X i,j is the current value for the existence of a shelf in the jth slot for the ith customer, which is binary (i.e., 1 signifies that a shelf exists in the jth slot and 0 signifies the lack of a shelf in the jth slot). Slots 1 and 6 represent the bottom and top options for shelf placement, respectively. Each bar in Figure 4 is segmented to indicate how many shelves are used in all by each user. For example, shelf 1 appears 100% of the time in the bottom slot, and most users who use this slot (78%) use two shelves in total inside the refrigerator.
The second and third metrics are captured using Figure 5. Each shelf is shown individually and oriented as in Figure 2. The cumulative moving average of food height is measured for each unit space on each shelf, and is calculated using Equation (1). Next, the frequency of food movement is tracked, which measures how often the food items are changed. That is, this metric tracks foods as they are moved to and from the unit spaces on each of the shelves. The coloration of the bars in Figure 5 is modeled similarly to a heat map, where areas of high-frequency movement are dark red and low-frequency movement are dark blue.
Top: For each unit space on each shelf, the moving average of height and the frequency of food movement are tracked. Bottom: Color scale for frequency of food movement.
The maximum frequency for each shelf, shown at the bottom left of each graph, is used to normalize the scale of movement activity. The normalization is calculated as
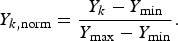 $$Y_{k\comma {\rm norm}} = \displaystyle{{{Y_k} - Y_{\rm min}} \over {Y_{\rm max} - Y_{\rm min}}} .$$
In Equation (2), the minimum frequency, Y min, is always zero (i.e., no food movement), and the maximum frequency, Y max, is a cumulative counter that grows as time progresses during a simulation and as food movement is tracked; Y k is the frequency count for the movement of the kth food to or from each unit space on the shelves; and Y k,norm is the normalized frequency of food movement for each unit space, which corresponds to the color scale in Figure 5.
As the simulator models the customer population, the types of items present on each shelf fluctuate with time and are measured. In Figure 5, it is apparent that taller food items are typically placed on shelf 6, and also that there is high food movement activity throughout. Shelf 2 and shelf 4 typically have shorter items and only see high activity toward the front edge of the shelf. These simple observations give valuable insight about particular shelf usage inside the refrigerator that a company can use in the early design stages of a next-generation concept.
In the next section, the full user population case study is executed. A randomized customer population drives data generation, and the resulting data is used to support product redesign. Then, the resulting concepts are evaluated and compared to the actual customer population a posteriori.
4. SIMULATED SOCIOTECHNICAL USE DATA
The physical characteristics of the refrigerator in the simulator are established. Each refrigerator comes with four shelves that users may use and place according to their preferences. Six slots spaced one unit apart are provided to give user vertical adjustability for shelf placement. Throughout the data analysis discussion, a slot is referred to as a possible location for a shelf, and reference to a particular shelf designates the use of a particular slot (e.g., “shelf 3” is a shelf in the third refrigerator slot). A permanent shelf is located in slot 1 (the bottom slot), which represents the top of the crisper compartment similar to the refrigerator examples in Figure 1. Finally, the top slot of the refrigerator (slot 6) has 2.5 units of vertical clearance from the ceiling of the refrigerator. This design element ensures that users are able to store tall items, such as a carton of milk or a 2-L bottle of soda (both 2.2 units tall).
The simulation includes 1000 user types from each profile interacting with a refrigerator over a 7-day period. Reviewing the generated data shows the trends of each social subsystem and confirms the usage profiles as they are described in Section 3.3. Although not the focus of this study, the individual usage profile data could give a company the opportunity to develop particular product offerings targeted at specific customer segments.
Then, a population of 1000 user types is randomly divided into the four usage profiles and simulated over the same timeframe. The randomization is performed so that the precise underlying preferences dictating refrigerator usage are unknown a priori to data analysis. The profiles are divided using the following calculation:
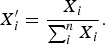 $$X_i^{\prime} = \displaystyle{{{X_i}} \over {\mathop \sum \nolimits_i^n {X_i}}}.$$
In Equation (3), n denotes the number of usage profiles, which for this study is four. Each X i is generated using a uniform random distribution for the ith usage profile. As a result, X i′ ∈ [0,1] and  $\mathop \sum \nolimits_i^n X_i^{\prime} = 1$, which corresponds to 100% of the user population. Each X i′ is then multiplied by the total number of users in a population to determine the distribution across the four usage profiles. In effect, although the experimenter has knowledge of the behaviors within each usage profile, the influence from each user type in the randomized population is unknown. This dynamic mirrors the fact that companies may have knowledge of the various preferences within their customer base but are challenged with understanding the combined impact on the usage of their product. The 10 behavior variables that represent the specific profile for each usage profile are stochastically created as explained in Section 3.3.
When the refrigerator is accessed, data is generated as users add, move, and expired food items. These actions occur three to eight times per day depending on the user profile. In total, these customer interactions generate between 128,000 and 2,028,000 data points. Each simulation took roughly 8–14 h depending on the number of interactions on a Windows 7 operating system with a 2.8-GHz Core i7 processor and 6 GB of RAM.
4.1. Generation and analysis of use data
The first set of results in Figure 6 shows four separate trials of each market segment individually using their refrigerators. The graphs depict the moving average of shelf placement, which measures the number and location of shelves used by the population. Because the permanent shelf exists in slot 1 for all refrigerators, this shelf is present 100% of the time for all the population segments. As expected, user segment 1 primarily uses two shelves, but due to the stochastic nature of the simulation, there are also customers in this profile type who use three, four, and five shelves. Slot 4 is the most popular (after the permanent bottom shelf), while slots 2 and 3 are infrequently used, likely because this user type tends to place some of their taller items on the bottom shelf. Most of the users in segment 2 use three shelves, and they use slots 5 and 6 most often. Customers in segment 3 use four shelves most often, while making equal use of slots 3–6. Customer behavior in segment 4 is marked by using five shelves most often, with similar use of slots 3–6 and a slightly smaller percentage use of shelf 2 because other behavior variables tend to drive items toward the higher shelves. The simulated behaviors in Figure 6 are consistent with the descriptions presented in Section 3.3 and show variation in refrigerator usage according to different user preferences.
Cumulative moving average of shelf placement: individual customer segments.
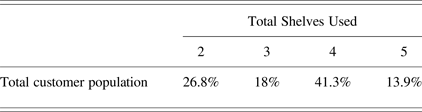
Next, an entire randomized population is simulated, and the company analyzes the product use data to test the four objectives presented in Section 3.1. The moving average results are shown in Figure 7. In general, users tend to place shelves toward the top of the refrigerator. Slots 4–6 have shelves about 60% of the time, and a shelf is present in slot 3 slightly more than 50% on average. Slot 2 rarely has a shelf in it (probability of 10%). For slot 1, 86.1% of the customers use four or fewer shelves, meaning they add three or fewer shelves to the existing permanent shelf.
Cumulative moving average of shelf placement: random population.
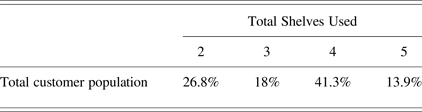
The results for slot 1 also segment the total population of users by the number of shelves that they use. The resulting segments, for a single simulation, are shown in Table 2. While the segments do not map directly to a usage profile type due to the variation present in the profiles, the company can still study whether a correlation exists and whether the number of shelves is a valuable leading indicator for studying consumer preferences, profile types, and sociotechnical interactions. This is studied and validated further in Section 4.2.
Customer population distribution by the number of shelves used
Next, the moving average of food item height on each unit space of the shelves and the shelf usage activity are shown in Figure 8. Shelf 6 is often used to store taller items (such as milk or a 2-L soda), and shelves 3–5 store shorter foods (like a carton of eggs). Shelves 5 and 6 stand out as the only shelves to see a moderate to high usage throughout the entire shelf, while the shelves below see lower usage in the back region. In general, the front area of all shelves clearly sees the most activity from the customer, while the back areas experience less activity.
Cumulative moving averages of frequency of change and height for each unit space.
The max frequency and average maximum height data from Figure 8 are used to create the plots in Figures 9 and 10, respectively. In these figures, the randomized customer population is shown, as well as the individual simulations of each usage profile shown earlier in Figure 6. The simulated impact of the behavior variables from a light user (usage profile 1) to a heavy user (usage profile 4) is consistent with the descriptions given in Section 3.3. In both illustrations, the randomized population falls within the upper and lower bounds for refrigerator usage from the four usage profiles.
Maximum frequency of food item movement for each shelf for all four usage profiles and the randomized population over a 1-week time period.
Average height of tallest item for each shelf for all four usage profiles and the randomized population study over a 1-week time period.
Figure 9 shows the maximum frequency of food movement for each shelf over the week. This is a cumulative sum that adds all actions from all users. For the randomized population, shelf 2 is accessed the least from all users, about 10% of the activity that occurs on shelf 1, which is the most-used shelf. The data indicate that shelves 1 and 6 are used the most often, and as a result, these shelves could particularly benefit from a performance or functional improvement in the next-generation design.
In Figure 10, the average maximum height of food items for each shelf is shown after 1 week of usage for all users. Tall items are commonly stored on shelf 6, medium-height items are stored on shelves 1 and 2, and short items are stored on shelves 3–5. However, shelf 2 might be argued to have little significance, as only 10% of the customers use it (see Fig. 7).
With all observations from the data in mind, the company can revisit its primary objectives.
4.1.1. Objective 1
The first objective aims to determine if the number of shelves included with the refrigerator is minimally adequate for the users' preferences. The simulation results indicate that most customers (86.1%) use three shelves or fewer, despite four shelves being included with the refrigerator. This observation could cause the company to conclude that eliminating the fourth shelf would be an effective cost-saving decision. However, throughout the redesign process, it is critical to determine the root cause of the observations made from the product use data. This ensures that the next concept reflects the customers' true needs, and not the company's perception of customer needs (Van Horn et al., Reference Van Horn, Olewnik and Lewis2012). For example, a car manufacturer monitoring passenger presence might infer that because most of the time a car has one occupant, a single-passenger car is desired. However, such a design change may prevent a purchase decision as the primary user occasionally carries passengers or aesthetically prefers a multipassenger vehicle. Therefore, although 86.1% of the refrigerator users do not use the fourth shelf, this does not necessarily indicate that they prefer not to have the fourth shelf.
In order to identify the root cause of product usage, the company should align its existing knowledge of the customer base with the product's use. Then the company may recreate product usage in a lab setting through using empathic techniques to identify the underlying customer preferences (e.g., Lin & Seepersad, Reference Lin and Seepersad2007). Finally, this kind of analysis could be coupled with consumer forum mining techniques (e.g., Rai, Reference Rai2012), to provide a powerful validation approach.
4.1.2. Objective 2
In this objective, the company wants to determine if the upper shelves of the refrigerator (slots 5 and 6) are used most often by the randomized user population. Recalling construction of the usage profiles from Section 3.3, users tend to place shelves higher in the refrigerator unless they use all available shelves, in which case they become indifferent to where they go. Furthermore, when many shelves are present, users prefer to use the upper shelves for food but become indifferent when fewer shelves are present because there are fewer choices. Based on this knowledge, it is expected that the top shelf will see most of the activity because the user types either prefer to use this shelf (i.e., usage profile 4) or need to use the top shelf out of necessity because fewer shelves exist (i.e., usage profile 1). However, the company finds that its expectation is only partially true because Figure 9 illustrates that the bottom permanent shelf (slot 1) is actually most often used. This observation is not anticipated from the usage profiles and is an emergent trend from the simulation.
This is another area where an empathic study would be useful for understanding the underlying customer preferences. For example, it may become apparent that this shelf is used out of necessity to accommodate all stored foods. The resulting discovery may lead the company to decide that having a shelf in the lowest position is critical for satisfying customer needs, or perhaps that a low shelf is not generally ergonomic for the core population of taller users, such as older children, teenagers, and adults. The latter argument could be reinforced with the observation that a shelf is placed in slot 2 only 10% of the time, which is the second lowest position in the refrigerator. The company could choose to make this shelf adjustable and place it in the middle of the refrigerator (slot 3) by default.
4.1.3. Objective 3
The company also wants to determine if the height of food items is generally the same across each shelf in the users' refrigerators. This is a reasonable assumption, because the behavior variable that governs food placement does not consider the height of each food. The results in Figure 10 show that this assumption is incorrect, because there are three distinct average heights for the randomized population. Considering the design of the refrigerator, the vertical space of 2.5 units between the top slot and the ceiling affords space for tall items. The impact of this design element is noticed as this shelf holds items with an average height of 1.4 units. The items stored on shelves 3–5 are shorter because when more shelves are present (influenced by usage profile 4), there is not enough vertical space between one shelf and the one immediately above to fit taller items. In addition, the items on shelves 1 and 2 are medium-height likely because when fewer shelves are present (influenced by usage profile 1), taller items fit on both the bottom permanent shelf and the top shelf.
These findings may guide the company to increase the vertical space from the top slot in the refrigerator from 2.5 to 3 units. This design change is partly influenced not only by data, because tall items go here regularly, but also by uncertainty: the company cannot track items that are too tall to fit in the refrigerator. Other data such as the grocery store items purchased may (or may not) support this design change, but regardless the revision could be validated after the launch of the next-generation refrigerator. In this way, companies may test uncharted design solutions for their products and then objectively and quantitatively evaluate the impact of new design elements.
4.1.4. Objective 4
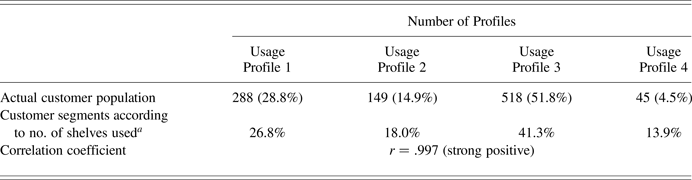
Finally, the company verifies if the assumed leading behavior, the number of shelves used by each customer, can be used to accurately classify a randomized population into one of the four usage profiles. As discussed earlier in this section, the customer user types in the simulated data cannot be directly classified by their behavior variables due to the assumed variation in their behaviors. However, the strength of the correlation using the leading behavior between the predicted customer distributions and the actual stochastic customer distributions can be measured. In Table 3, both the predicted and actual customer distributions are shown along with the resulting correlation coefficient.
Randomized customer distribution correlated to customer segments according to the number of shelves used by each customer
aFrom Table 2.
Equation (4) defines the correlation coefficient as:
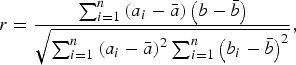 $$r = \displaystyle{{\mathop \sum \nolimits_{i = 1}^n \left({{a_i} - \bar a} \right)\left({b - \bar b} \right)} \over {\sqrt {\mathop \sum \nolimits_{i = 1}^n {{\left({{a_i} - \bar a} \right)}^2}\mathop \sum \nolimits_{i = 1}^n {{\left({{b_i} - \bar b} \right)}^2}} }}\comma $$
where n is the number of pairs of data points being compared, which is four in this study. The a terms are the values for the actual customer population, and the b terms correspond to the values for the customer segments according to the number of shelves used.
The calculated coefficient for the four pairs of probabilities is r = 0.997, which demonstrates a strong positive correlation. This implies that the number of shelves is a strong indicator for classifying a customer into one of the four profiles. This also verifies the fourth objective and shows that for this particular simulated population, the leading behavior predictor could help a company quickly determine market trends and preferences, identifying areas for further study. In the next section, we explore the relationship between this correlation and the probability of variation in the leading behavior variable.
4.2. Exploration of leading behavior
To measure the broader implications of using the number of shelves as a leading predictor, the impact of the variation in the num_shelves behavior variable on the correlation between the predicted and actual customer populations is parametrically studied. The default variation probability of 25% (from Section 3.3) is parametrically varied between 0% and 100%, a new weeklong simulation is run, and the correlation coefficient is recalculated and plotted in Figure 11 for each value. For computational efficiency, the probability is changed in 2% increments, and by 1% increments between 70% and 80% in the transitional region. Each correlation coefficient is calculated 25 times, and the average is taken.
Correlation coefficient for the num_shelves variable from 0% to 100% probability of variation.
The results indicate that the number of shelves used by a customer is a strong leading indicator of usage profile type when the probability of variation in the num_shelves variable varies between 0% and 70%. However, when it varies between 80% and 100%, the number of shelves is a very poor indicator of the usage profile type. A linear regression model is used to approximate the transition region from 70% to 80% between the positive and negative correlation regions.
At around 75% probability of variation, there is no correlation between the number of shelves variable and the usage profile type. Here, segmenting the customer population by the number of shelves used is not useful, but the other existing metrics in the original analysis (Section 3.3) may still be used effectively. As the probability of variation in num_shelves approaches 100%, user behavior would either be considered irrational or the company's expectations of the customer profiles do not reflect how the customers are actually using them. In the latter case, the real-world value of the strong negative correlation may lead to a redefinition of the usage profile types.
It is also interesting to note that the transitional region in Figure 11 is dependent on the number of customer segment types used. For example, when only two or three customer segments exist, the transitional region occurs around 50% and 67%, respectively. In these cases, less behavioral variation (compared to when four segments are used in Fig. 10) is acceptable before customers cannot be effectively classified by their num_shelves behavior. However, the transitional region shifts to larger values of the variation probability when more customer segments are introduced because despite increased behavioral variation, each customer group is characterized with finer granularity. Therefore, if each customer in a population is uniquely segmented, even when behavioral variation is 100%, the correlation coefficient would be 1 (perfect strong positive correlation) because the behavior of each customer is being captured and fully understood by the company. Achieving this scenario is unrealistic with contemporary methods, because it requires the proper segmentation of potentially millions of users for a product. However, using real-time DA, this capability could eventually become a reality.
5. CONCLUSIONS
This paper presents a simulated study of a sociotechnical product to demonstrate the potential of DA to transform how such products are designed and supported. In particular, concepts from DA are demonstrated using a simulation program to model the use of a hypothetical refrigerator. The simulator creates a randomized population of customers based on four different usage profiles. Each user has 10 behavior variables dictating refrigerator use, and behavioral variation is added to each customer to more accurately represent use possibilities in the population. With the generated product use data, DA tools are used to measure, visualize, and extract insights that can be combined with customer preference information to provide a more comprehensive and quantitative portrait of the customer requirements for a next-generation product.
This process enhances the transition into the early stage of a subsequent design process, where new or changed technical specifications for a next-generation concept are defined and directly influenced by user interaction. During the case study, the customer population is classified and segmented by one of the behavior variables, the number of shelves used. After product redesign, the randomized user types are revealed and compared against the predicted user types based on their behavior. Although insightful, this correlation must be validated for each design problem by measuring the correlation of a user type with usage behavior.
This paper also represents some first steps toward establishing more generalizable principles in DA applicable to other sociotechnical products. For example, as pointed out in Baxter and Sommerville (Reference Baxter and Sommerville2011), the performance of sociotechnical products relies on the optimization of both the technical and the social subsystems. In this paper, we focus primarily on the design of the technical subsystem, but we postulate that a better designed technical subsystem will allow for the social subsystem (the consumers) to be more effective and better satisfied in their interaction with the technical subsystem.
The simulated study also presents challenges for future work. To improve the artificially constructed usage profiles, the assumptions could be improved or potentially replaced with actual census or survey data. The redesigned concept would more closely reflect real-world usage and be comparable to existing leaders in the marketplace. To further improve simulation accuracy, the unitless refrigerator geometry and items in the food library can be assigned dimensions by measuring actual refrigerators and groceries in the marketplace. The simulator framework lays a foundation that could lead to much larger simulation data sets. Simulating many more customers over an extended time presents the challenge of effectively analyzing and segmenting more complex customer populations and product usages. The analysis could potentially be done by integrating simulation data, consumer reviews, and actual consumer observations and experimentations. This would create the need for data fusion techniques that could be applied to aggregating these diverse information sources, forms, and fidelities. Data could also be collected from external sources such as the operating environment (e.g., demographic, geographic, and temporal influences). External and environmental information may provide additional insight for why products are purchased and used certain ways, and could provide a deeper understanding of customer preferences.
DA and associated techniques and tools, at a foundational level, support the conversion of information into knowledge for making better and more efficient decisions. In the current age, this information now can include terabytes of information regarding consumer preferences, product reviews, opinion forums, component repositories, and real-time feedback from sensor-enabled products. Although not necessarily a focus of this study, the potential for DA to create and have access to truly “big data” during a design process creates a number of further challenges and opportunities. This includes methods and tools to handle issues related to the four Vs of big data: volume, variety, velocity, and veracity (Zikopoulos et al., Reference Zikopoulos, deRoos, Parasuraman, Deutsch, Corrigan and Giles2012).
For instance, although volume is the most recognizable characteristic of big data, the variety of big data refers to the challenge of capturing all data useful for making decisions in a design process. As one example, the code structure of an Amazon.com customer review may be organized, but the valuable content within the review is not readily understood by a computer (Rai, Reference Rai2012).
ACKNOWLEDGMENTS
The authors acknowledge the support of the Department of Mechanical and Aerospace Engineering and the Design of Open Engineering Systems Laboratory at the University at Buffalo–SUNY for their support of this work.
David Van Horn is a Manufacturing Engineer at Brady Corporation. He earned an MS in mechanical engineering with a concentration in design optimization from the University at Buffalo in 2012. His research interests include design analytics, automated design concept generation, complex system trade-offs, and consumer preference modeling.
Kemper Lewis is a Professor in and Chair of the Department of Mechanical and Aerospace Engineering at the University at Buffalo and a Fellow of the American Society of Mechanical Engineers. He has also served as Executive Director of the New York State Center for Engineering Design and Industrial Innovation and as the University at Buffalo site director of the National Center for e-Design. Dr. Lewis' research interests are in the areas of complex system trade-offs, modeling and optimization of decision networks, and adaptive energy systems.