



1. Introduction
Jellyfish constitute a dominant group of mesozooplankton that are blooming in oceanic waters due to their advanced hunting and escape skills (Peng & Dabiri Reference Peng and Dabiri2009; Kiørboe Reference Kiørboe2011; Kiørboe et al. Reference Kiørboe, Jiang, Goncalves, Hielsen and Wadhwa2014) based on generated feeding current, prey filtering and fluid signal. Swimming depends on rhythmic forced contraction of the flexible bell over a relatively short time (known as the power stroke) and subsequent unforced bell expansion that follows during a lengthy relaxation phase/pause (the recovery stroke). Over the past years, the fluid–structure interaction (FSI) and mostly the resultant vortical flow patterns around a swimming or cruising medusa (jellyfish) have been examined extensively (Colin & Costello Reference Colin and Costello2002; Dabiri et al. Reference Dabiri, Colin, Costello and Gharib2005; Peng & Alben Reference Peng and Alben2012; Alben, Miller & Peng Reference Alben, Miller and Peng2013; Park et al. Reference Park, Chang, Huang and Sung2014). These studies show that the fluid adjacent to the bell margin is effectively entrained into the expanding cavity as a jellyfish swims forwards in the relaxation phase, while the stopping vortex ring created in the process partly intrudes/advects into the bell or subumbrellar bell region (Hoover, Griffith & Miller Reference Hoover, Griffith and Miller2017). In the relaxed phase, a jellyfish generates favourable thrust by virtue of the inward rotating dynamics of the created three-dimensional (3-D) stopping vortex ring at the bell edge and via the manipulated surrounding pressure. As the bell contracts during a propulsive power stroke, in addition to the jet-like ejection of the inner fluid through the gradually reduced velar aperture, the fluid surrounding a medusa is consistently entrained along the bell margin via the combined interaction of the newly created starting vortex ring and the dropped off stopping vortex that evolves closely in the vicinity (Dabiri et al. Reference Dabiri, Colin, Costello and Gharib2005; Gemmell et al. Reference Gemmell, Colin, Costello and Dabiri2015; Hoover, Porras & Miller Reference Hoover, Porras and Miller2019). Accordingly, in a paddling cycle, the near-field fluid is largely efficiently pushed down/entrained towards a prey capture surface (tentacle) of a medusa via the generated swimming/feeding current (Costello & Colin Reference Costello and Colin1995; Colin, Costello & Kordula Reference Colin, Costello and Kordula2006; Peng & Dabiri Reference Peng and Dabiri2009; Kiørboe Reference Kiørboe2011). Recently, researchers have increasingly focused on exploring medusan propulsion, as it can be a dependable basis for the design of new propulsion technologies suitable for tiny underwater vehicles.
Note, however, that, from the viewpoint of practical survival or hunting by natural aquatic animals, to date, only a few experimental studies have attempted to analyse the created feeding current (Shadden, Dabiri & Marsden Reference Shadden, Dabiri and Marsden2006; Peng & Dabiri Reference Peng and Dabiri2009; Katija et al. Reference Katija, Beaulieu, Regula, Colin, Costello and Dabiri2011); and a detailed numerical exploration of prey selection and capture by a cruising medusa is virtually non-existent. This requires an advanced insight plus execution of a rather complex dynamical-system-based method to reveal how a floating/moving copepod/nutrient is entrained or captured. In addition, the varying near-field fluid transport by natural swimmers (predators) affects prey capture and feeding. Success depends inherently on the motile behaviour of the various prey that are intercepted. The encounter rate (defined as the number of prey entering a capture zone over a specific time) is largely controlled by the amount of fluid that is transported past a capture surface; although the capture of the prey depends on its size, mass, evasiveness and escape speed (Viitasalo et al. Reference Viitasalo, Kiørboe, Flinkman, Pedersen and Visser1998; Hansson & Kiørboe Reference Hansson and Kiørboe2006; Kiørboe et al. Reference Kiørboe, Andersen, Langlois and Jakobsen2010; Nielsen et al. Reference Nielsen, Asadzadeh, Dolger, Walther, Kiørboe and Andersen2017) in relation to local fluid entrainment behaviour (of a predator), flow velocities, deformation rates (Ford, Costello & Klos Reference Ford, Costello and Klos1997; Kiørboe, Saiz & Visser Reference Kiørboe, Saiz and Visser1999) and driving frequency.
The capture of food by a jellyfish is often characterized as follows: first, to detect and encounter a potential prey; and second, to capture the prey via the created suction pressure and fluid momentum. A jellyfish detects prey either visually or by the hydrodynamic signal that preys generate (Kiørboe et al. Reference Kiørboe, Saiz and Visser1999; Peng & Dabiri Reference Peng and Dabiri2009; Kiørboe Reference Kiørboe2011). For capturing motile/stationary prey, a common method adopted among medusae is to efficiently use the self-generated feeding current. A strained prey particle/copepod that enters into an appropriate feeding current is then entrained and captured as it moves inside a target zone/loop. Prey without and with an escape force are thereby differently dragged to the bell edge depending on the prey's inertia/size and brought to the beating basket-shaped jellyfish mouth, or suitably placed nearby for ingestion. However, elucidating the precise physical process that governs prey capture and estimating the success rate for diverse predator species are rather difficult to model/compute. Based on morphological and behavioural characteristics, the medusae are classified into two functional groups: (i) cruising predators, which actively create a feeding current to bring an evasive/stationary prey into contact with the tentacles or nematocyst-bearing capture organ, and (ii) ambush predators, which stretch their tentacle and wait for a prey to come into contact for capture (Hansson & Kiørboe Reference Hansson and Kiørboe2006).
Notably, in an experimental and numerical initiative, Peng & Dabiri (Reference Peng and Dabiri2009) analysed the prey capture performance of the moon jellyfish Aurelia aurita, for encountered inertial and strategically evasive prey, by employing an erroneously approximated Maxey–Riley equation (Maxey & Riley Reference Maxey and Riley1983) and a dynamical system method. Accordingly the forward-time finite-time Lyapunov exponent (FTLE) fields and particle Lagrangian coherent structures (pLCS) were obtained by Peng & Dabiri (Reference Peng and Dabiri2009) for early swimming cycles, which the authors used to define a projected prey capture area and analyse its relative change for inertial and evasive prey types with respect to ideal infinitesimal prey. However, the current study displays the practical limitations of such a small-time analysis that often predicts an opposite capture performance for alert/escaping prey. In addition, the important backward-time FTLE fields or pLCS are left unexplored. These, in fact, have been demonstrated here to effectively identify the actual prey capture region, and provide a dependable insight for the physical prey capture activity. Accordingly, a thorough understanding of prey-specific selectivity, effective prey encounter loops, a physically realistic capture area and the quantification of the success rate of a cruising medusa clearly demands further focused research that the existing literature is lacking. Therefore, while aiming for an improved insight, the present simulation of medusa motion coupled with correct dynamical-system-based modelling of transport processes for various motile/evasive prey over sufficiently long swimming cycles, plus a clear quantitative analysis of the success rate of prey capture, are expected to significantly enrich the existing knowledge on hunting/survival of such zooplankton.
The following should be noted at this point. (i) The starting equation (2.1) of Peng & Dabiri (Reference Peng and Dabiri2009) that forms the basis for the adopted dynamical-system-based analysis has a missing term involving prey inertia (R) and local prey escape acceleration  $({\boldsymbol{a}_E})$. To aid comparison, herein the same notation is utilized (in our equation (3.5) below). (ii) The approximate forward-time pLCS are considered as hypothetical prey capture regions in Peng & Dabiri (Reference Peng and Dabiri2009) for inspected inertial, opposite, normally and fluid signal-based escaping prey; whereas the computed backward-time pLCS could essentially/meaningfully determine those. (iii) All prey capture (interception) loops in their figures 1–3, for opposite/strategically evasive prey, are obtained for about two swimming cycles, i.e. for a much shorter time well before the feeding current adequately spreads, the real escape effect or response is activated and the additional larger loops develop, which practically show the opposite capture behaviour, as displayed herein. These make the quantitative analysis of proposed prey capture areas in tables 1 and 2 in Peng & Dabiri (Reference Peng and Dabiri2009) unsustainable (for varied inertia/escape force). Note further that, to date, apparently no work exists that quantifies the success rate (clearance rate, CR) of prey capture, and the cost of preying (COP). In addition, what impact the resonant driving makes on prey capture remains unknown. The above elucidated facts motivated the current research, with incorporated essential improvements. The objective here is to thoroughly examine these stated issues for A. aurita, by taking into account various motile and evasive prey behaviours, and to offer an improved insight and significant contribution.
Fluid mass conservation requires that forward advection of fluid in the vicinity of a migrating jellyfish must be compensated by a rearward mass flux (Darwin Reference Darwin1953). While the Eulerian velocity and vorticity fields (Colin & Costello Reference Colin and Costello2002; Park et al. Reference Park, Chang, Huang and Sung2014; Hoover et al. Reference Hoover, Griffith and Miller2017) reveal instantaneous flow features, the dynamical-system-based approach that is adopted herein pertinently demarcates the surroundings from a Lagrangian perspective (Haller Reference Haller2001, Reference Haller2015; Shadden et al. Reference Shadden, Dabiri and Marsden2006; Franco et al. Reference Franco, Pekarek, Peng and Dabiri2007; Katija & Dabiri Reference Katija and Dabiri2009; Peng & Dabiri Reference Peng and Dabiri2009) and is shown to be able to isolate physically distinct transport behaviours in a finite time. Accordingly, the implemented procedure displays its direct implication for the capture of motile prey and explains the animal's feeding mechanisms. To the authors’ knowledge, the current work presents a unique numerical model and deeper analysis/insight that effectively reveals the detailed coupling of prey selection and momentum exchange for a paddling medusa, by taking into account both the finite size and evasiveness of various prey, plus the diverse driving patterns (of the predator). The aim is to fill the existing gaps and substantially improve current understanding on the feeding behaviour of these long survived natural predators.
The paper has been organized as follows. In § 2 the physical problem, boundary conditions and adopted multi-relaxation-time lattice Boltzmann immersed boundary method are described. Section 3 first presents the validation of two test cases and elaborates 3-D FSI for the paddling A. aurita (fineness ratio 0.3). This is followed by presentation of the prey interception loops, capture surface and CR for inertial and evasive prey, and the effect of resonant swimming. The morphological sensitivity of prey capture is then revealed using varied bell fineness ratio. Finally, § 4 offers some concluding remarks.
2. Modelling the medusa motion
To analyse swimming motion plus prey capture, a 3-D multi-relaxation-time (MRT) lattice Boltzmann (LB) model that is flexible for morphological exploration is developed herein using the immersed boundary (IB) method. A hemiellipsoidal (Colin & Costello Reference Colin and Costello2002; McHenry & Jed Reference Mchenry and Jed2003; Dabiri et al. Reference Dabiri, Colin, Costello and Gharib2005; Sahin, Mohseni & Colin Reference Sahin, Mohseni and Colin2009; Hoover et al. Reference Hoover, Griffith and Miller2017) jellyfish body (see (2.1) and figure 1) of bell diameter d 0 and bell height h 0 that is created by an elastic membrane without thickness is considered for the present mathematical and numerical implementation, and the model is symmetrically placed in a computational domain of size  $6{d_0} \times 12{d_0} \times 6{d_0}$. The paddled locomotion of the jellyfish is produced by applying an inward-directed periodic body force
 ${\boldsymbol{F}_b}$ near the bell edge, over a small width
 $h^{\prime}$, and using the reference parameters in table 1 unless otherwise specified. The initial jellyfish shape is accordingly expressed using (2.1), where
 $h^{\prime} = {h_0}/3$, and (xc, yc, zc) denotes the bell centre:
 \begin{equation}1 =\,\frac{{{{(x - {x_c})}^2}+ {{(z - {z_c})}^2}}}{{\left(\dfrac{d_0}{2}\right)}^2} + \frac{{{{(y - {y_c})}^2}}}{{{h_0}^2}}\quad \textrm{for}\,y \ge {y_c} - h^{\prime}.\end{equation}
The essential details of the current MRT-LB-IB method and the elastic membrane model are elaborated in appendices A and B, respectively.
(a) Schematic diagram of a jellyfish in quiescent fluid in a rectangular computational domain. (b) Distribution of applied body force  ${\boldsymbol{F}_b}$ to the bell. Point 1 denotes the bell edge. Point 2 is the forcing point that satisfies the condition of the body force range (i.e. (A2)). (c) The time history of the body force
 ${\boldsymbol{F}_b}$.

The adopted non-dimensional reference parameters for the elastic bell model.

3. Results and discussion
3.1. Validation
To start with, using the MRT-LB-IB method, the paddled kinetics of a flexible jellyfish is now computed in a quiescent fluid domain (figure 1a) of size  $6 \times 12 \times 6$ in spanwise (x), streamwise (y) and transverse (z) directions, respectively, with applied periodic boundary conditions along x and z, and gradient-free end conditions along y. The domain is scaled by the bell diameter. The paddling motion is initiated by applying a periodic force
 ${\boldsymbol{F}_b}$ (see (B9)) near the bell margin. Standard uniform Eulerian lattices of size
 $246 \times 492 \times 246$ and step lengths
 $\delta x = \delta y = \delta z = {d_0}/41$ are placed along x, y and z axes, and 12 452 Lagrangian nodes are used to compute the swimming plus prey capture behaviours. Accordingly, the Lagrangian node spacing remained less than half a lattice spacing (Wu et al. Reference Wu, Cheng, Zhang and Wei2015). To validate the simulation method, first, figures 2(a)–2(c) present a comparison of time-evolved body shape and centroid velocity (v) of A. aurita (of fineness ratio h 0/d 0 = 0.4) with the results experimentally reported by McHenry & Jed (Reference Mchenry and Jed2003). Using feasible body elasticity (cst = 18.5, cbe = 0.03) and time-varying forcing (see (B9); appendix B), which allow a realistic bell contraction rate as in the above experiment, the motion of the jellyfish starting from rest is created via self-propulsion.
Comparison of simulated bell shape and centroid velocity with measured experimental data for A. aurita (h 0/d 0 = 0.4). (a) The transient bell shape during a power stroke. (b) The transient bell shape in a recovery stroke. (c) The time history of the centroid velocity (v). Here tc = 0.4, T = 1.1, cst = 18.5, cbe = 0.03 and Fb = 200. (d) Comparison of the apex velocity (Vtop) of a jellyfish (h 0/d 0 = 0.3), for adopted tc/T = 0.075,  ${c_{st}}$ = 21,
 ${c_{be}}$ = 0.035, Re = 480 and
 ${\boldsymbol{F}_{\boldsymbol{b}}}$ = 32. (e) The time history of forward swimming velocity of the bell centroid of a jellyfish (h 0/d 0 = 0.3) for different domain sizes. Here cst = 18.5, cbe = 0.03,
 ${\boldsymbol{F}_{\boldsymbol{b}}}$ = 12 and Re = 100.

Figures 2(a) and 2(b) show that, for adopted bell fineness-ratio (0.4), contraction (tc = 0.4) and expansion stroke (texp = 0.7) durations (period T = 1.1) and Reynolds number  $Re = 700\,( = d_0^2/\nu {t_c})$ that are chosen identical to a reference configuration of McHenry & Jed (Reference Mchenry and Jed2003), our simulated jellyfish shape, i.e. its bell diameter and height at different times during contraction (figure 2a) and recovery (figure 2b) phases, exhibits quite similar changes to the reported findings. Here results take a dimensional form for comparison. In the contraction phase (figure 2a) A. aurita's bell diameter and bell margin rapidly reduced, but height increased; while the body motion (v) became faster. Figure 2(c) shows a comparison for its centroid velocity variation v. It reveals that, during the recovery phase, the forward body motion is slowed, whereas the bell diameter and bell margin increased (figure 2b); but the bell height reduced. Figure 2(a–c) thus reveals that, for chosen material properties and propulsion period consistent with the experimental conditions in McHenry & Jed (Reference Mchenry and Jed2003), the present model predicts quite similar trends (e.g. Park et al. Reference Park, Chang, Huang and Sung2014) for A. aurita's body kinematics. It is to be noted that the considered elastic stiffness parameter cst = 18.5 of the bell membrane falls within the dimensional range of feasible material properties experimentally measured by Demont & Gosline (Reference Demont and Gosline1988) and Megill, Gosline & Blake (Reference Megill, Gosline and Blake2005). The bending modulus (cbe = 0.03) and nodal forcing magnitude (Fb = 200) are suitably selected so as to match the measured contraction and expansion timings or kinematics of jellyfish species of fineness ratio h 0/d 0 = 0.4, as reported in McHenry & Jed (Reference Mchenry and Jed2003).
Finally, figure 2(d) shows a comparison for the apex velocity Vtop of a jellyfish (h 0/d 0 ≈ 0.3) model studied by Hoover et al. (Reference Hoover, Porras and Miller2019), who used a finite body membrane thickness. As figure 2(d) reveals, for the implemented thin bell membrane model, the present simulation predicts quite a similar apex velocity variation. Furthermore, figure 2(e) shows that, for two different adopted computational domain sizes  $6 \times 12 \times 6$ and
 ${9 \times 12 \times 9}$, the forward velocities of the bell centroid of the presently considered jellyfish model (of fineness ratio h 0/d 0 = 0.3) in four pulsing cycles virtually coincide. This assures that the implemented domain size
 $6 \times 12 \times 6$ is sufficiently large to capture the dynamics of a freely swimming jellyfish.
3.2. Mechanistic motion and FSI for A. aurita (h 0/d 0 = 0.3)
3.2.1. The paddling dynamics
Here we examine the detailed swimming behaviour of A. aurita (h 0/d 0 = 0.3). For this, the active contraction of the subumbrellar jellyfish bell is initiated by applying a transient nodal force  ${\boldsymbol{F}_b}$ (see (B9) and figure 1b) at the bell margin for non-dimensional time 0 < t ≤ tc; while the subsequent passive expansion phase continues (see supplementary movie 2 available at https://doi.org/10.1017/jfm.2020.1069) following withdrawal of
 ${\boldsymbol{F}_b}$ during T − tc and in which the stored elastic strain energy drives the bell expansion. A propulsion cycle herein is fixed at T = 2.0, and the chosen material elastic parameters are cst = 18.5 and cbe = 0.03. The bell is thus driven forward for five cycles (t = 5T) using 50 ≤ Re ≤ 150 and
 $3 \le {\boldsymbol{F}_b} \le 27$. Moreover, the prey capture by a free swimming jellyfish is known to be better predictable for lower Re. While presenting the computed results, for non-dimensionalization, the fluid density
 ${\rho _0}$ is used as the characteristic density, bell diameter d 0 as the characteristic length, and
 ${t_c}$ as the characteristic time. The other parameters are determined using following characteristic scales:
 $U = {d_0}/{t_c}$ for velocity,
 ${\rho _0}U/{d_0}$ for Eulerian momentum,
 ${\rho _0}{U^2}$ for Lagrangian momentum,
 ${\rho _0}{U^2}{d_0}$ for elastic stiffness coefficient and
 ${\rho _0}{U^2}d_0^3$ for bending coefficient (Park et al. Reference Park, Chang, Huang and Sung2014). The non-dimensional power Pm that is derived from the force
 ${\boldsymbol{F}_b}$ applied to the bell margin is therefore expressed as
 \begin{equation}{P_m} = \frac{{{F_b}(d - {d_{min}})/{t_c}}}{{\rho {d^5}/{T^3}}}.\end{equation}
Figure 3(a) shows the time history of distance ( $y/{d_0}$) that is travelled by the jellyfish in five swimming cycles (0 ≤ t ≤ 10 = 5T) for the indicated three different magnitudes of the paddling body force
 ${\boldsymbol{F}_b}$. Moreover, figure 3(b–d) displays the periodic change of the subumbrellar bell volume
 $(V/{V_0})$, the non-dimensional power (Pm) and forward velocity
 $(v/U)$ of the bell centroid during the third to fifth cycles. The noted initial rapid decrease of the bell volume
 $(V/{V_0})$ in figure 3(b) in a cycle corresponds to fast forward swimming speed (figure 3d) that is generated during the contraction phase; while for higher
 ${\boldsymbol{F}_b}$ the bell volume is reduced at a faster rate that strengthens the forward body motion (figure 3a). Figure 3(c) reveals that power Pm increases quickly as active force
 ${\boldsymbol{F}_b}$ (see (B9)) is applied (for t ≤ tc) to the bell. The subsequent rapid decrease of Pm is noteworthy, while
 ${\boldsymbol{F}_b}$ withdraws during relaxation. The power becomes briefly negative at the beginning of a recovery phase (figure 3c), as a jellyfish bell starts to expand freely by spending stored elastic energy in a contracted state (Tytell et al. Reference Tytell, Hsu, Williams, Cohen and Fauci2010). Additionally, power displays rapid/increased variation for higher
 ${\boldsymbol{F}_b}$.
Plotted for applied different body-force magnitudes (Fb) are: (a) the displacement (y/d 0) of the bell during five cycles, (b) the periodic change of the bell volume (V/V 0) during the third to fifth propulsive cycles, (c) dimensionless power (Pm) associated with the body force (Fb) at the bell edge, and (d) forward swimming velocity (v/U) during the third and fifth swimming cycles. Here Re = 100 and h 0/d 0 = 0.3.

Figure 4(a) shows that the periodic contraction and expansion of the jellyfish bell in power  $({\boldsymbol{F}_b} \gt 0)$ and recovery
 $({\boldsymbol{F}_b} = 0)$ strokes generate distinct 3-D vortex rings of opposite rotational sense at the bell margin. These vortex rings act to entrain upstream fluid from above the bell into the subumbrellar cavity. The results are shown here for the fifth propulsive cycle (8 < t ≤ 10). A near-edge 3-D vortex ring 5*St.V. that is created by the forced power stroke (8 < t ≤ 9; figure 4a1–a8) is conventionally termed as the starting vortex (where 5* denotes the cycle number and St.V. is the abbreviation for starting vortex). Figure 4(a5–a8) shows that, as the bell expands freely in recovery stroke (9 < t ≤ 10), the stopping vortex ring 5*Sp.V. (figure 4a5–a8) is produced, which spins in the reverse direction. During growth, the stopping vortex partly intrudes into the bell cavity along with the sucked fluid at the bell margin. Note that the diameter of the starting vortex ring (5*St.V.) steadily decreases in a power stroke and that of a stopping vortex (5*Sp.V.) increases through a relaxation phase, while physical processes are controlled by
 ${\boldsymbol{F}_b}$ and material elasticity. Importantly, these vortex-rings-induced fluid motion keep supporting the forward motion (figure 3a) in a propulsive cycle. The appended velocity field (figure 4a1–a8) on the symmetry (xy) plane clearly exhibits dominance of the upward flow at the bell edge, in both power and recovery strokes. The dropped off starting (4*St.V.) and stopping (4*Sp.V.) vortex rings that temporarily dominate in the wake are created during the fourth propulsive cycle.
(a) Three-dimensional evolution of starting (5*St.V) and stopping (5*Sp.V) vortex rings at different times during the fifth propulsive cycle, for applied body force Fb = 12. Also shown here are the resulting velocity field on the streamwise symmetry plane, and temporarily dominating stopping (4*Sp.V) and starting (4*St.V) vortex rings in the near wake that are generated in the previous cycle. (b) The transient evolution of starting (5*St.V) and stopping (5*Sp.V) vortex rings in the fifth cycle, for the reduced body force Fb = 7. (c) Plots of out-of-plane vorticity ( ${\omega _z}$) contours at various times during the first, second, third and fifth swimming cycles (Fb = 7). In these vorticity (
 ${\omega _z}$) plots, in the wake region of forward swimming jellyfish one can see progression of shedding of starting and stopping vortices. Here Re = 100 and h 0/d 0 = 0.3.

Figure 4(b) shows that, for a lower magnitude  ${\boldsymbol{F}_b} = 7$ of the applied paddling force, the resultant weaker starting/stopping vortex rings evolve considerably closer to the bell edge, while the swimming speed (figure 3d) is greatly reduced. Notably, figures 4(b1) and 4(b5) display how exactly side-by-side evolving opposite-natured vortex ring pairs 4*Sp.V. and 4*St.V. or 5*Sp.V. and 5*St.V. actively entrain the outer fluid towards the bell edge. Figure 4(c) shows the out-of-plane vorticity
 $({\omega _z})$ at various times during the first, second, third and fifth cycles, exhibiting the near-field dominance of the respective starting and stopping vortices. The pressure contours presented in figure 5 show that lateral body motion helps the growth of significant low-pressure areas in the fluid surrounding the paddling bell. The animal uses this dominant low pressure to pull itself up through the surrounding water via suction-based propulsion, and it technically helps to drag floating nearby prey or copepods (see supplementary movie 1) to the bell margin via the stroke-by-stroke generated feeding current (see supplementary movie 2). The regions of high pressure, however, do form (Hoover et al. Reference Hoover, Griffith and Miller2017), especially in opposition to motion at the apex area (figure 5a1,a2) and during transient periods of lateral body motion, but these are clearly compensated (figure 3a) by virtue of suction-based upward momentum (figure 4a) that is produced by neighbouring fluid (Gemmell et al. Reference Gemmell, Colin, Costello and Dabiri2015).
(a1–a8) Isocontours of non-dimensional pressure at different instants during the fifth propulsive cycle. Near-surface transient pressure variations: during power stroke at (a1) t = 8.16, (a2) t = 8.4, (a3) t = 8.64 and (a4) t = 9; and during the recovery stroke at (a5) t = 9.28, (a6) t = 9.6, (a7) t = 8.88 and (a8) t = 10 ( = 5T). (b1) The marked horizontal lines are below the contracted bell, at the end of the fifth power stroke (t = 9). At these locations the variations of non-dimensional (b2) pressure, (b3) vertical velocity (v/U) and (b4) transverse velocity (u/U) are presented with respect to the (x) distance from the vertical axis. (c1) The marked horizontal lines below the expanded bell at the end of the fifth recovery stroke (t = 10), where variations of non-dimensional (b2) pressure, (b3) vertical velocity (v/U) and (b4) transverse velocity (u/U) are revealed with respect to the distance from the vertical axis. Here Re = 100 and h 0/d 0 = 0.3.

Variations of the non-dimensional pressure and vertical and transverse velocity along several horizontal slices that spread through the bell region as well as the near wake are revealed in figure 5(b1–c4) at the end of the fifth power and recovery strokes. Figure 5(b2) shows the formation of negative pressure in the bell, at the end of the contraction stroke. In contrast, at the end of the expansion stroke (figure 5c2), an elevated positive pressure develops at the cavity centre and relatively low-pressure areas are formed at the sides, suggesting the development of a pressure minimum at the core of vortex rings that dominate near the bell edge (figure 4). Moreover, the distribution of the vertical velocity (v/U) in figure 5(b3) reveals the existence of strong downward flow at different vertical locations, at the end of the power stroke; while positive velocity mostly persists near the bell boundary. These are in fact facilitated due to the ejection of the core fluid (like a jet) through the central part, and the entrainment of the surrounding fluid (see figure 4a3,a4) from the apex to the bell edge. At the end of the expansion phase, as evident from figure 5(c3), a strong positive vertical flow develops in the centre region owing to continued fluid entrainment (figure 4a5–a8) by the stopping vortex ring. Such velocity (v/U) gradually reduces at the edges and its direction is reversed at downstream locations. Figures 5(b4) and 5(c4) show that the transverse velocity (u/U) at each y station is reduced following pulsating motion as the vertical axis of symmetry is approached, while clear changes of sign occur at the two sides.
Figure 6(a1–a4) shows isocontours of non-dimensional vertical velocity (v/U) around the jellyfish during the fifth propulsive cycle, at t = 8.16, 9.0, 9.6 and 10.0; and figure 6(b1–b4) exhibits the corresponding radial velocity (u/U) contours. In the contraction phase, as a jellyfish moves forwards with larger speed, the stronger positive vertical and radial velocities (figures 6a1,a2 and 6b1,b2) develop at the top and around the bell (see figure 4a1–a4). The formation of negative and positive radial velocity regions (figure 6b1) at the bell edge or near wake are the results of mutual interaction of starting (5*St.V.) and stopping (4*Sp.V.) vortices in the propulsive power stroke, as evident from figure 4(a1). In the expansion phase, the presence of similar vertical and radial velocities (figure 6a3,a4,6b3,b4) in the vicinity of the bell are due to continued upward bell motion plus fluid entrainment into the bell cavity via the dynamics of the stopping vortex ring 5*Sp.V., as noted in figure 4(a6–a8). The observed negative vertical velocity areas in figure 6(a1–a4) around the bell margin are formed because of transfer plus rotation (figure 4a3,a4,a6–a8) of the surrounding outer fluid towards the bell edge; whereas the ejection of the inner fluid in the form of a jet and the interaction of the starting and stopping vortices continue to yield continuous columns of vertical flows away from the bell. The presence of positive/negative radial velocity regions at the bell edge or near wake, in figure 6(b3,b4), during the recovery phase are contributed by the interaction of 5*Sp.V. with the bell boundary (figure 4a6–a8).
Isocontour plots of non-dimensional (a1–a4) vertical velocity (v/U) and (b1–b4) radial velocity (u/U) around the paddling bell, at different instants during the fifth propulsive cycle. Here Re = 100 and h 0/d 0 = 0.3.

3.2.2. Variation of cost of transport (COT) and Strouhal frequency (St)
The COT is a convenient measure for determining energetic swimming performance. For a jellyfish the COT is defined as
 \begin{equation}COT = {E_i}/{d^{apex}},\end{equation}
where  ${E_i} = \int_{{t_0}}^{{t_o} + T} {({F_b}(\textrm{d}r/\textrm{d}t))\,\textrm{d}t}$ is the required energy,
 ${d^{apex}}$ is the non-dimensional displacement of the bell apex in one propulsive cycle,
 $\textrm{d}r/\textrm{d}t$ is the rate of change in bell diameter and
 ${\boldsymbol{F}_b}$ is the applied paddling body force. The non-dimensional Strouhal number St is expressed as
 \begin{equation}St = d_{max}^{rad}/(Tv_{avg}^{apex}),\end{equation}
where  $d_{max}^{rad}$ is the maximum radial displacement, T is the pulsating period and
 $v_{avg}^{apex}$ is the average apex velocity in a cycle.
Figures 7(a) and 7(b) show variations of COT and St −1 for two different bell fineness ratios 0.3 and 0.5, as functions of maximum paddling force  ${\boldsymbol{F}_b}$, which helps to better comprehend morphological dependence. Moreover, the impact of resonant swimming on the variation of COT is revealed therein (its effect on prey capture is elaborated later). Figure 7(a) shows that COT increases rapidly for small
 ${\boldsymbol{F}_b}\,( \lt 4)$ that resemble cases of very low (see figure 3a,b) swimming speed (Gemmell et al. Reference Gemmell, Costello, Colin, Stewart, Dabiri, Tafti and Priya2013). Notably, for h 0/d 0 = 0.5 the optimum (minimum) COT occurs at a threshold
 ${\boldsymbol{F}_b} = 4$, and for h 0/d 0 = 0.3 such an optimum is reached at
 ${\boldsymbol{F}_b} = 7$; then COT slowly increases as
 ${\boldsymbol{F}_b}$ is increased. However, for applied higher
 ${\boldsymbol{F}_b}$ the increased drag (as drag is ~ v 2) due to the enhanced steady swimming speed plays a key role in increasing COT. The COT is found to be higher for the higher fineness ratio 0.5 (for
 ${\boldsymbol{F}_b} \ge 6$), signifying that an oblate-type body can be more economical. The larger stopping vortex that an oblate jellyfish creates (in a relaxation phase) and efficiently places under the enlarged bell plays an important role in reducing its COT, by virtue of passive energy recapture (Gemmell et al. Reference Gemmell, Costello, Colin, Stewart, Dabiri, Tafti and Priya2013). Additionally, figure 7(a) shows that COT is lowered via resonant swimming. Figure 7(b) shows that, despite fineness-ratio-dependent variation, St −1 increases rapidly at lower
 ${\boldsymbol{F}_b}\,( \le 12)$ and then slowly approaches the respective asymptotic limit for
 ${\boldsymbol{F}_b} \ge 25$, as peak propulsive efficiency is attained (Taylor, Nudds & Thomas Reference Taylor, Nudds and Thomas2003; Floryan, Buren & Smits Reference Floryan, Buren and Smits2018). Since the flapping frequency (1/T) of the bell is kept fixed here, St (equation (3.3)) varies as the ratio of flapping amplitude
 $(d_{max}^{rad})$ to forward distance that is travelled in a pulsing period. For higher
 ${\boldsymbol{F}_b}\,( \ge 25)$, St −1 approaches asymptotic limits, as noted in figure 7(b), which seems to imply that at this stage the distance that is travelled by a jellyfish varies nearly at the same rate as the flapping amplitude.
Plotted here are: (a) normalized cost of transport (COT/COTref) for non-resonant plus resonant swimming, and (b) the inverse Strouhal number (St −1), as functions of the magnitude of the applied paddling force (Fb). To reveal the morphological dependence of COT, the data for another fineness ratio (h 0/d 0 = 0.5) but with fixed body elasticity (i.e. cst = 18.5 and cbe = 0.03) are added in panel (a), and the same reference COTref (i.e. for Fb = 12 and h 0/d 0 = 0.3) is used for normalization. Here Re = 100.

3.2.3 Circulation analysis
The circulation is an important issue (Colin et al. Reference Colin, Costello, Dabiri, Villanueva, Blottman, Gemmell and Priya2012) that plays a key role in medusan locomotion. Here we analyse the non-dimensional circulation  $\varGamma$ , which is defined as the integral of vorticity over the area of a vortex ring on the symmetry plane, as follows:
 \begin{equation}\varGamma = \frac{T}{{d_0^2}}\int {{\omega _z}(x,y,0,t)\,\textrm{d}\kern0.7pt x\,\textrm{d}y} .\end{equation}
Figure 8 presents the computed variation of  $\varGamma$ over five swimming cycles of A. aurita (h 0/d 0 = 0.3), for different magnitudes of the applied paddling force
 $7 \le {F_{\boldsymbol{b}}} \le 12$. It is noted that the circulations of starting (figure 8a) and stopping (figure 8b) vortex rings increase with the passing of time, as vortices gradually grow under time-varying
 ${\boldsymbol{F}_b}$ (figure 1c). Remarkably, despite a jellyfish producing (figure 3) greater acceleration during the power stroke, the resultant peak circulation by stopping vortex is about twofold higher than the peak circulation of the starting vortex, illustrating the important role of the stopping vortex in pulsating locomotion. Physically, during the relaxation phase, the outer fluid is continuously sucked into the expanding cavity (figure 4), whereas fluid from the top is being pushed down to the bell margin. This leads to increased circulation by the developed stopping vortex via passive energy recapture (Gemmell et al. Reference Gemmell, Costello, Colin, Stewart, Dabiri, Tafti and Priya2013). Moreover, as figure 8(a,b) shows, for increased paddling force
 ${\boldsymbol{F}_b}$, larger circulations are generated.
The non-dimensional circulation ( $\varGamma$) of: (a) starting vortex ring, and (b) stopping vortex ring, in five swimming cycles, for the adopted different magnitude of the paddling force (Fb). Here Re = 100 and h 0/d 0 = 0.3.

3.3. The Lagrangian analysis
To computationally explore prey capture, an initially flat material layer representing multiple Lagrangian prey or copepods is supposed to float or move around and the paddling jellyfish approaches it normally. As the medusa intrudes forwards, the material layer gets deformed and neighbouring prey particles are dragged closer (see supplementary movies 1 and 2) to the body via cycles of propulsive swimming. In the process, while some prey are captured by a jellyfish, some escape, depending on their inertia/evasive skill. Here the motile prey are assumed to be spherical-shaped bodies that are uniformly spread upstream of a jellyfish. Upon neglecting the Basset–Boussinesq memory force and diffusion terms that can be active in Stokes flow but are unimportant in advection-dominated swimming, the simplified Maxey–Riley equation (Maxey & Riley Reference Maxey and Riley1983; Michaelides Reference Michaelides1997; Peng & Dabiri Reference Peng and Dabiri2009; Kiørboe et al. Reference Kiørboe, Andersen, Langlois and Jakobsen2010) that governs the prey motion in incompressible flows is expressed as
 \begin{equation}\frac{{\textrm{d}\boldsymbol{v}}}{{\textrm{d}t}} - \frac{{3R}}{2}\frac{{\textrm{D}\boldsymbol{u}}}{{\textrm{D}t}} = - A(\boldsymbol{v} - \boldsymbol{u}) + \left( {1 - \frac{{3R}}{2}} \right)g + \left( {1 - \frac{R}{2}} \right){\boldsymbol{a}_E},\end{equation}
where
 \begin{equation}R = \frac{{2{\rho _f}}}{{{\rho _{f}} + 2{\rho _p}}},\quad A = \frac{R}{{St}},\quad St = \frac{2}{9} {\left( {\frac{a}{{{d_0}}}} \right)^2}Re.\end{equation}
For non-dimensionalizing (3.5), the jellyfish bell diameter  ${d_0}$ is used as the characteristic length, the power stroke duration
 ${t_c}$ as the characteristic time, and the average speed of bell contraction
 $U = {d_0}/{t_c}$ as the characteristic velocity. The variable v denotes the velocity of a Lagrangian (spherical) prey particle, u that of the Eulerian fluid,
 ${\rho _p}$ the density of a prey particle,
 ${\rho _f}$ the density of the fluid, a the prey-particle radius, g the gravity,
 ${\boldsymbol{a}_E} = {\boldsymbol{F}_e}/m$ the acceleration of a prey due to the self-generated escape force Fe, and m the mass of a prey. The derivative Du/Dt is taken along the path of the Eulerian fluid, while dv/dt is taken along the trajectory of a swept prey particle. For simplicity, the prey escape acceleration
 ${\boldsymbol{a}_E}$ is considered to have two different Eulerian flow or u-dependent forms, i.e.
 ${\boldsymbol{a}_E} = - {a_E}\boldsymbol{u}/|\boldsymbol{u}|$ and
 ${\boldsymbol{a}_E} = - {a_E}\boldsymbol{n} \times \boldsymbol{u}/|\boldsymbol{u}|$, with n being the unit normal vector to the plane of motion. Notably, the prey motion depends on mass-ratio parameter R, particle Stokes number St and Reynolds number
 $Re\,( = d_0^2/\nu {t_c})$. Unless otherwise mentioned, the said parameter values in (3.5) are taken as A = 11.5 and St = 0.06, and Re is varied over 50 ≤ Re ≤ 150, considering the fact that medusa and tiny prey are slow-moving bodies. As elaborated here, the trajectories and CR of inertial and motile prey animals differ significantly from that of an ideal tracer particle (Babiano et al. Reference Babiano, Cartwright, Piro and Provenzale2000).
The essential FTLE fields are widely computed herein to identify the geometric separatrices from trajectories of the distributed Lagrangian particles. The pLCS computed via (3.5) are found to clearly separate surrounding fluid regions that exhibit detectably distinct dynamics over several propulsive cycles and provide a considerable new insight into the capture of live or evasive natural prey (copepods) in a marine predator–prey system.
As follows, the detected pLCS for surrounding inertial prey denote the high ridges of respective particle FTLE fields, while 3-D Eulerian flows are simulated using the MRT-LB-IB method. For flow field  $\boldsymbol{u}(t,\boldsymbol{x})$ that is created by a paddling jellyfish, the induced velocities
 $\boldsymbol{v}(t;{t_0},{\boldsymbol{x}_0})$ of the inertial prey are computed via the modified Maxey–Riley equation (3.5) together with (3.7) and (3.8) below, where subscript zero refers to the starting state. The starting velocity of a prey is assumed to coincide with the local fluid velocity. The trajectory
 $\boldsymbol{x}(t;{t_0},{\boldsymbol{x}_0})$ of an inertial particle is therefore solved via
 \begin{equation}\boldsymbol{\dot{x}}(t;{t_0},{\boldsymbol{x}_0}) = \boldsymbol{v}(t;{t_0},{\boldsymbol{x}_0}),\end{equation}
subject to initial conditions
 \begin{equation}\boldsymbol{x}({t_0};{t_0},{\boldsymbol{x}_0}) = {\boldsymbol{x}_0},\quad \boldsymbol{\dot{x}}({t_0};{t_0},{\boldsymbol{x}_0}) = {\boldsymbol{v}_0}.\end{equation}
Let  $\phi _{{t_0}}^{{t_0} + T^{\prime}}:\boldsymbol{x}({t_0}) \to \boldsymbol{X}({t_0} + T^{\prime})$ denote the flow map of inertial prey particles from their location at
 ${t_0}$ to their location at time
 $T^{\prime}$. The Lyapunov exponent that is defined below in (3.10) reveals the rate of extension of a particle's trajectory that is advected by a jellyfish's swimming motion. The Jacobian of
 $\phi $ is computed with respect to the prey particle locations at
 ${t_0}$ (Franco et al. Reference Franco, Pekarek, Peng and Dabiri2007; Wilson et al. Reference Wilson, Peng, Dabiri and Eldredge2009). The resulting finite-time Cauchy–Green deformation tensor
 $\boldsymbol{C}(x)$ is defined as
 \begin{equation}\boldsymbol{C}(\boldsymbol{x}) = {\left( {\frac{{\textrm{d}\phi_{{t_0}}^{{t_0} + T^{\prime}}}}{{\textrm{d}\kern0.7pt x}}(\boldsymbol{x})} \right)^\ast }\left( {\frac{{\textrm{d}\phi_{{t_0}}^{{t_0} + T^{\prime}}}}{{\textrm{d}\kern0.7pt x}}(\boldsymbol{x})} \right),\end{equation}
where  ${(\,)^\ast }$ denotes the transpose operator. The maximum eigenvalue
 ${\lambda _{max}}$ of
 $\boldsymbol{C}(x)$ represents the maximum stretching that occurs at
 $\boldsymbol{x}(t;{t_0},{\boldsymbol{x}_0})$ over a time interval
 $T^{\prime}$, while a material line remains aligned with the corresponding eigenvector. The FTLE that represents the maximum stretching rate is defined as
 \begin{equation}\sigma _{{t_0}}^{T^{\prime}} = \frac{1}{{|T^{\prime}|}}\ln \sqrt {{\lambda _{max}}(\boldsymbol{C})} .\end{equation}
To compute the FTLE (via (3.5)–(3.10)), the densely distributed Lagrangian prey particles over a wide region on the streamwise symmetry plane of a swimmer are assumed to have initial particle–particle distance of one-tenth of a lattice unit. The FTLE computation is thus continued for five swimming cycles to ensure time invariance of the pLCS. The resulting pLCS defines a ridge line of the function  $\sigma $, normal to which the topography has a local maximum. Here the prey capture phenomena are first revealed on the streamwise symmetry plane, as exploring 3-D analysis often becomes costly and requires large CPU time and RAM.
3.3.1. The influence of prey inertia on predator–prey interaction
We now thoroughly examine prey interception and capture mechanisms based on the computed paddled swimming current, as a large taxonomy of zooplankton survives in this mode of hunting, and feeding-current-based nourishing is most effective (Humphries Reference Humphries2009) for various prey species. To start with, first the ideal case of infinitesimal prey is considered. The motion of plankton (of tiny mass) in this case coincides with that of ideal Lagrangian tracer particles. To demonstrate the prey interception mechanism, the essential forward-time and backward-time FTLE fields (Shadden et al. Reference Shadden, Dabiri and Marsden2006; Franco et al. Reference Franco, Pekarek, Peng and Dabiri2007; Green, Rowley & Haller Reference Green, Rowley and Haller2007) for a suspended layer of 4.9 × 10⁶ infinitesimal Lagrangian prey particles are computed using (3.7)–(3.10) and the flow field that is created (see figure 4a and supplementary movie 2) by paddling A. aurita (h 0/d 0 = 0.3,  ${\boldsymbol{F}_b} = 12$).
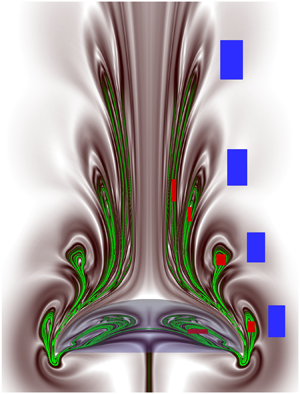
Figures 9(a) and 9(b) show contours of the forward-time and backward-time FTLE fields (at Re = 100) that are generated over a duration of five cycles (t = 5T). The related Eulerian velocity, vorticity and pressure fields are revealed in figures 4–6. Note in figure 9(a) the presence of four pairs of symmetrical FTLE lobes that are clearly detectable, as each pulsing cycle creates one such pair, while lobes formed in the fifth cycle appear weaker in this case. The corresponding high ridges (figure 9a), i.e. repelling pLCS are denoted by green contour lines. In figure 9(b), the ridges of the backward-time FTLE field (black contours) represent a sequence of attracting pLCS, and their outer boundary, which surrounds the developed five cavity-shaped multi-deck belly region (formed in five pulsing cycles) plus the area inside the bell, is defined here as the ‘capture boundary’. At a glance, figure 9 displays significantly distinct and physically/mathematically sound structures of prey interception loops and capture boundary (pLCS) compared with those reported earlier (Peng & Dabiri Reference Peng and Dabiri2009). These pLCS complement each other to transport floating prey from the frontal region into a jellyfish bell or suitable place in the near wake, or, alternatively, to preserve the recirculating prey that are already inside the capture surface (see supplementary movie 3).
Plotted here are the contours of FTLE fields and infinitesimal Lagrangian particles displaced by the paddling jellyfish (h 0/d 0 = 0.3). (a) The forward-time FTLE field, wherein the green-coloured high ridges reveal the Lagrangian coherent structures (LCS). Red and blue particles are placed inside and outside the upstream LCS lobes so as to track the fluid transport phenomenon and particle positions swept by the jellyfish motion. A greyscale colour map is also added for the reader's convenience. (b) The backward-time FTLE field and appended position of the displaced infinitesimal particles at t = 5T; the high ridges (LCS boundary), defined as the capture boundary, are denoted in dark black colour (as well as dashed green line, for clarity). Here Re = 100 and h 0/d 0 = 0.3.

To characterize which portions of the ambient fluid and locally present prey are targeted by a medusa/predator and which portion pass by without interacting, the red coloured Lagrangian tracer particles are placed inside pLCS lobes in figure 9(a) and blue-coloured particles outside. With such spatially distributed tracer particles, the simulation is re-run, as the paddling jellyfish swims across for five cycles (t = 5T), and the transient dynamics and positions of differently dragged particles are tracked. For clear distinction, in figure 9(b) we have appended the simulated final positions (at t = 5T) of coloured prey particles along with backward-time pLCS curves, confirming that the backward-time pLCS indeed form a capture boundary or capture surface. Figure 9(b) clearly shows that, through the paddled motion, all red particles are entrained within the pLCS boundary whereas clustered blue particles pass by without interacting. This shows that an infinitesimal plankton/copepod that is spotted inside mapped pLCS loops (figure 9a) can be captured for feeding, and those that remain outside have a good chance to escape. The supplementary movie 3 reveals the detailed stroke-by-stroke prey entrainment behaviour. However, although pLCS form a 3-D surface, the results are presented here on the streamwise symmetry plane, as conducting 3-D analysis often becomes costly and requires quite large CPU time plus RAM to track an enormous number of prey. However, the presented pLCS for ideal infinitesimal prey serves as a baseline to further examine the effects of prey inertia or escape force on a jellyfish's feeding performance, which are elaborated below.
We now study the effect of prey inertia, while momentarily ignoring the effect of escape force  $({\boldsymbol{a}_E} = 0)$ in the modified Maxey–Riley equation (3.5). Notably, the term
 $- (R/2){\boldsymbol{a}_E}$ that appears in our (3.5) is missing in (2.1) of Peng & Dabiri (Reference Peng and Dabiri2009), where R (equation (3.6)) represents the combined influence of the mass of a prey and that of the displaced fluid, and the term can be obtained via a correct non-dimensionalization of the Maxey–Riley equation. To reveal a jellyfish's feeding on inertial copepods, first, using the flow field that is generated by paddled body motion and the dynamical system of equations (3.5)–(3.10), we compute the precise displacement pattern for the considered inertial prey particles with R = 2/3.
Figure 10 shows the resultant forward-time and backward-time FTLE fields, pLCS (dark coloured ridges) and positions of entrained (inner and outer) inertial prey particles of R = 2/3 (i.e.  ${\rho _p} = {\rho _f}$; density of buoyant prey particles taken equal to the fluid density) due to the created feeding current by A. aurita (h 0/d 0 = 0.3) over five cycles. Note that the forward-time FTLE in figure 10(a) identifies four consistently formed (as in figure 9a) symmetrical pairs of fluid lobes or regions upstream; while lobes for the fifth cycle appear relatively weaker. To show that the extracted pLCS represent a realistic separation boundary for R = 2/3, the suspended red inertial particles are placed inside and blue particles outside the fluid lobes, as shown in figure 10(a), and then the simulation is re-run for five cycles, as the predator jellyfish swims across. Accordingly, the motion of differently dragged inertial prey particles is tracked, and for clarity their final positions (at t = 5T) are superimposed in figure 10(b) along with the backward-time pLCS. It reveals that the prey particles that stayed inside the FTLE lobes (in figure 10a) are mostly entrained within the multi-deck pLCS (figure 10b) boundary that surrounds five belly-shaped cavities formed in five pulsing cycles plus a part of the bell area; whereas those prey particles originated outside clearly escape. This demonstrates that the backward pLCS in figure 10(b) constitute the capture (or separation) boundary for inertial prey. Note that, for considered inertial preys (R = 2/3), the high ridges of backward FTLE (i.e. pLCS in figure 10b) appear relatively compressed at the top. Moreover, the positions of the dragged red particles in figure 10(b) suggest that some prey may have a small chance to escape by virtue of their inertia, particularly those stationed near the boundary of a forward-time FTLE/interception loop or the pLCS (figure 10a). Nevertheless, as figure 10(b) shows, the majority clearly fall inside the capture boundary.
Plotted for suspended inertial (R = 2/3) Lagrangian particles, the contours of FTLE fields and Lagrangian prey particles displaced by the paddling jellyfish at the end of the fifth pulsing cycle (t = 5T). (a) The forward-time FTLE field, wherein the green-coloured high ridges reveal the corresponding pLCS. Red and blue inertial particles are placed inside and outside the upstream pLCS lobes so as to track their swept positions by jellyfish motion. (b) The backward-time FTLE field plus appended position of the displaced inertial particles at t = 5T; the high ridges (pLCS) are denoted in dark black colour. Here Re = 100 and h 0/d 0 = 0.3.

To verify that the escape behaviour of some of the near-boundary inertial (figure 10b) prey is real or physical, we performed several simulations with varied prey density in a lattice (and escape force), and they exhibit the same repeat phenomenon. Note also that, for the infinitesimal case, each and every targeted red prey is dragged (figure 9a,b) inside the capture surface. This implies that capturing an infinitesimal prey can be easier for a medusa than capturing a finite-size prey (figure 10), i.e. that its inertia can help a prey to escape (Kiørboe Reference Kiørboe2011). The relative variations of the encounter loop, the capture surface and the success in prey capture for different cases are subsequently analysed. Prey capture for  ${\rho _p} \gt {\rho _f}$ is not considered here, as that involves complex situations wherein prey swim along a deeper fluid layer than the predator.
3.3.2. Influence of prey escape force
The success in prey capture also depends on the evasive nature of a prey/copepod, as prey species often instantly accelerate to escape predation. The available experimental results (Kiørboe Reference Kiørboe2011) reveal that prey usually swim along a well-defined rather than a convoluted path, and the impulse of flow generated by a predator can be a warning signal for prey. We assume that the prey escape force  ${\boldsymbol{a}_E}$ (3.5) has one of the following two different natures: (i)
 ${\boldsymbol{a}_E} = - {a_E}\boldsymbol{u}/|\boldsymbol{u}|$ or (ii)
 ${\boldsymbol{a}_E} = - {a_E}\boldsymbol{n} \times \boldsymbol{u}/|\boldsymbol{u}|$, where n is the unit normal vector to the plane of motion (Peng & Dabiri Reference Peng and Dabiri2009). In case (i), the escape force acts in the direction opposite to the local flow; while for case (ii), the escape force has direction normal to the local velocity and is directed away from a predator. Herein two different non-dimensional
 ${a_E} = 0.5$ and 0.25 are explored for the above two escape models, which fall within the reported (Strickler Reference Strickler1975) momentary escape acceleration limit up to 12 m s−2 of a tiny prey.
For evasive prey (R = 2/3,  ${a_E} = 0.5$) that attempt to escape opposite to local flow (i.e. case (i) above), figure 11 shows the forward-time (figure 11a1) and backward-time (figure 11a2) FTLE fields and their high ridges (pLCS), computed over five cycles. Among the five detected pairs of upstream prey interception zones (i.e. dark green FTLE lobes) in figure 11(a1), note in this case that, for opposite escaping prey, the lobes that are formed in the third and fourth cycles are decisively larger/longer than those for non-escaping inertial prey (figure 10a). The noted development of larger loops in figure 11(a1) at later cycles particularly reverses several reported conclusions in Peng & Dabiri (Reference Peng and Dabiri2009) based on the results in their figures 1 and 2 and table 1, which are obtained for nearly two swimming cycles, when the effects of swimming current and the considered opposite escape acceleration/response of prey are yet to become effective. Accordingly, the initial lobe sizes became smaller. Note also the natural open shape of forward-time pLCS in figure 11(a1), at the front side of a predator. Figure 11(a2) shows that the topmost boundary of the backward-time pLCS or capture boundary in this case has moved considerably inside the jellyfish bell with respect to infinitesimal (figure 9b) and non-escaping inertial (figure 10b) prey, signifying its local shrinkage for opposite escaping prey. The precise variation of the prey capture region for the investigated cases is summarized later.
Plotted for oppositely escaping prey with two different escape accelerations,  ${a_E}$ = 0.5 and
 ${a_E}$ = 0.25, the contours of FTLE fields (pLCS) and displaced prey particles via the paddling jellyfish motion. (a1) The forward-time FTLE field, where green-coloured high ridges reveal pLCS computed at t = 5T, for
 ${a_E}$ = 0.5. The red and blue coloured opposite escaping prey particles are initially located inside and outside the upstream pLCS lobes, and their swept positions are tracked as the jellyfish paddles forwards. (a2) The backward-time FTLE field plus appended position of displaced opposite escaping (
 ${a_E}$ = 0.5) prey at t = 5T; the pLCS boundaries are denoted in dark black colour. (b1, b2) Displayed results that are computed for a reduced prey escape acceleration,
 ${a_E}$ = 0.25. Here Re = 100 and h 0/d 0 = 0.3.

To demonstrate the capture of such evasive prey in a consistent manner, the red prey particles are placed inside pLCS lobes in figure 11(a1) and blue prey particles outside; all prey try to escape oppositely. With such spatial prey positions, the simulation is re-run, as the paddling jellyfish moves forwards for five cycles (t = 5T), and the swept/transient prey (via feeding current) locations are tracked. For clarity, the final position of swept prey particles (due to created feeding current) are superimposed in figure 11(a2) along with backward-time pLCS. This displays that the majority of the targeted red prey that originated within forward-time FTLE loops (in figure 11a1) are in fact contained within the capture area (high ridges of backward-time pLCS), while some apparently escape using the executed instantaneous acceleration. Figure 11(a2) also shows that all blue-coloured prey (which originated outside the loops) effectively move out of the capture boundary. Additionally, at a reduced prey escape acceleration  ${a_E} = 0.25$, the presented Lagrangian analysis in figure 11(b1,b2) shows a consistent capture behaviour for the oppositely escaping preys (i.e. for case (i)).
For prey that attempts to escape normal to the local flow ( ${\boldsymbol{a}_E} = - {a_E}\boldsymbol{n} \times \boldsymbol{u}/|\boldsymbol{u}|$, i.e. case (ii) above), figures 12(a1) and 12(a2) show forward-time and backward-time FTLE fields plus pLCS at
 ${a_E} = 0.5$, along with the appended swept prey position (at t = 5T). Figures 12(b1) and 12(b2) exhibit the corresponding results at a lower
 ${a_E} = 0.25$. Note that, at a fixed
 ${a_E} = 0.5$, for normally escaping prey, the interception zones shift significantly closer to the predator body and loop sizes became relatively larger in the first two cycles but decisively smaller in the third and fourth cycles, compared to oppositely escaping preys. The clear distinction of such results with Peng & Dabiri (Reference Peng and Dabiri2009) is noteworthy, as those are obtained using data from small-time swimming (when the surrounding flow has not adequately developed). Moreover, a close look at figures 12(a1,b1) and 13(a3) reveals, for the reduced normal escape acceleration
 ${a_E} = 0.25$, that the resultant loop sizes become larger. The shrinking of the loop sizes at a higher normal escape force is in fact expected in a natural predator–prey environment.
For normally escaping prey with two different escape accelerations,  ${a_E}$ = 0.5 and
 ${a_E}$ = 0.25, shown here are contours of FTLE fields (pLCS) and (escaping) prey particles displaced by the paddled jellyfish motion. (a1) The forward-time FTLE field, where green-coloured high ridges reveal corresponding pLCS computed at t = 5T;
 ${a_E}$ = 0.5. The red and blue coloured normally escaping preys are initially located inside and outside the upstream pLCS lobes, and their swept positions are tracked as the jellyfish swims forwards. (a2) Backward-time FTLE field plus appended position of normally escaping (
 ${a_E}$ = 0.5) prey at t = 5T; the pLCS boundaries are denoted in dark black colour. (b1, b2) Displayed results that are computed for a reduced normal escape acceleration,
 ${a_E}$ = 0.25. Here Re = 100 and h 0/d 0 = 0.3.

The variation of forward-time pLCS (encounter loops) for different types of prey. (a1) Curves are: solid red lines with circles, ideal infinitesimal (Inf.) prey; solid black lines, inertial prey with no escape force (R = 2/3, NESCF,  ${a_E}$ = 0); dashed blue lines, inertial prey with opposite escape force (OESCF,
 ${a_E}$ = 0.25); dotted green lines, inertial preys with normal escape force (NRESCF,
 ${a_E}$ = 0.25). Panel (a2) shows the influence of increased opposite escape force. Curves are: solid black lines, inertial prey with no escape force (R = 2/3, NESCF,
 ${a_E}$ = 0); dashed blue lines, inertial prey with opposite escape force
 ${a_E}$ = 0.25 (OESCF,
 ${a_E}$ = 0.25); dotted green lines, inertial prey with a higher opposite escape force
 ${a_E}$ = 0.5 (OESCF,
 ${a_E}$ = 0.5). Panel (a3) shows the influence of increased normal escape force (NRESCF). The notation is the same as above. Here Re = 100 and Fb = 12. Panel (a4) shows the influences of increased paddling force (Fb) and Reynolds number (Re). Panels (b1–b4) show the 3-D structure of prey encounter loops (forward-time pLCS) for: (b1) ideal infinitesimal prey; (b2) inertial prey with no escape force (R = 2/3, NESCF,
 ${a_E}$ = 0); (b3) inertial prey with opposite escape force (R = 2/3, OESCF,
 ${a_E}$ = 0.5); and (b4) inertial prey with normal escape force (R = 2/3, NRESCF,
 ${a_E}$ = 0.5). Here h 0/d 0 = 0.3.

Figures 13(a1)–13(a4) present a detailed comparison of prey interception loops on the streamwise swimming plane for the above examined different cases of varied prey inertia and escape acceleration, whereas their 3-D structures are revealed in figures 13(b1)–13(b4). Supplementary movie 4 displays transient transformation of the forward-time pLCS into backward-time pLCS as the direction of time integration is reversed, while supplementary movie 3 clearly exhibits that prey that originates within forward-time pLCS lobes is basically captured by a jellyfish (either brought to the bell cavity or preserved within the multi-deck capture boundary that is demarcated by the backward-time pLCS). Importantly, the capture boundary that is defined in this study using the backward-time pLCS remains consistent all along, and the supplied movies provide a realistic view for stroke-by-stroke prey capture. On the other hand, the previously postulated capture area (Peng & Dabiri Reference Peng and Dabiri2009) was defined without computing the required backward-time pLCS. Moreover, it is clear from figure 13(a1–a3) that the FTLE loops that formed in later cycles predict decisively opposite (enhanced/weakened) capture performance (as the feeding current of a predator amply spreads) with respect to loops that formed in the first or second cycles. This suggests that any analysis based on short-time data can lead to factually erroneous estimation of inertia/escape-force-dependent prey capture performance. Notably, from the physical point of view, the forward-time FTLE loops (prey interception loops) for the initial two swimming cycles are formed mostly along the (left/right) sides of a predator, where local flow remains downward-directed. Accordingly, the loop sizes (in two cycles) exhibit a decreasing trend for inertial (non-escaping) and escaping prey with respect to an ideal infinitesimal prey. As figure 13(a1–a3) displays, this is in contrast to the FTLE loops (pLCS) for subsequent cycles formed at an adjacent frontal/downstream region of a forward-swimming jellyfish where local velocity is reversed/upward-directed. Therefore, opposite escaping prey  $({\boldsymbol{a}_E} = - {a_E}\boldsymbol{u}/|\boldsymbol{u}|)$ that swim at the frontal region of the bell apex mistakenly move close to the predator/jellyfish instead of actually evading. This, in fact, helps predation plus capture. Consequently, for opposite escaping prey, the interception/target loops/fingers that are formed in the third and fourth cycles (and stretch along the front side) become longer/larger (see figure 13a1–a3) compared to those for stationary (non-escaping) prey; whereas the loops created by the first and second cycles often reveal the opposite trend. The decisively important longer loops for the third and fourth cycles are absent in Peng & Dabiri (Reference Peng and Dabiri2009), which, when taken into account, actually reverses the analysis in their tables 1 and 2, as evidenced below herein (figures 20 and 21, and table 3). In addition, figure 13(a4) shows that increased Re results in growth of larger-sized FTLE loops or prey encounter loops.
Note that for intercepted normally escaping prey at a higher aE = 0.5, as figure 13(a3) presents, in the fourth and third swimming cycles the smaller-sized FTLE loops are generated compared to those at aE = 0.25, while loops that formed in the first cycle reveal the visibly reverse trend. Figure 13(a4) shows that the interception loop areas significantly increase at a higher Fb. This signifies that, for self-propelled zooplankton, the magnitude of the propulsive force can have a profound effect on the feeding performance (Kiørboe et al. Reference Kiørboe, Jiang, Goncalves, Hielsen and Wadhwa2014).
3.3.3. Fluid-signal-based escape strategy and performance
For above considered cases, the prey escape response is initiated as soon as the disturbance that is created by a predator reaches a prey. However, in reality, the startle response for a copepod/prey attempting to escape predation is often initiated once an appreciable fluid signal/deformation that is generated by the predator becomes a threat. Motile prey often distinguish such fluid disturbances (Kiørboe et al. Reference Kiørboe, Saiz and Visser1999) and intend to escape a feeding current. In general, the escape signal can be a disturbance in velocity or acceleration, but the most recognized signal is the local shear rate. Accordingly, we assume here that a prey starts escaping as the local shear rate reaches a threshold value, which is then continued even if the shear rate drops later.
Figure 14(a) shows the threshold  $({\tau _{th}} = 1)$ shear-dependent variations of prey interception loops (pLCS) for opposite escaping
 $({\boldsymbol{a}_E} = - {a_E}\boldsymbol{u}/|\boldsymbol{u}|)$ prey, relative to those that escape naturally
 $({\tau _{th}} = 0)$. The pLCS are computed over five swimming cycles of the predator. Note that, for the initial two cycles, the loop sizes decrease as the threshold value for perception decreases, a trend that is consistent with the measurements reported by Peng & Dabiri (Reference Peng and Dabiri2009) in their figure 3. In contrast, as figure 14(a) displays, the loops that are created in the third and fourth cycles appear significantly larger than the loops formed in the first and second cycles, and these later loops in fact play a decisively important role in interception/capture of the oppositely escaping prey. Furthermore, the characteristic variation of loops that formed in the third and fourth cycles is very much reversed for prey that escape naturally
 $({\tau _{th}} = 0)$, with respect to those escape at threshold shear
 $({\tau _{th}} = 1)$. This is because an oppositely escaping prey that stayed in the adjacent frontal region mistakenly moves towards the predator jellyfish (due to prevailing locally upward flow) instead of actually evading. The previously reported results (table 2 in Peng & Dabiri Reference Peng and Dabiri2009) lack contributions from such decisively larger loops (formed in the third and fourth cycles), plus the influence of the missing term
 $- (R/2){\boldsymbol{a}_E}$. However, the interception loops in the fifth cycle appear relatively unclear (due to weaker local flow) as they formed far from the swimming body, and those loops are thus omitted. Figure 14(b) shows the threshold shear-dependent variations of FTLE loops for normally escaping
 $({\boldsymbol{a}_E} = - {a_E}\boldsymbol{n} \times \boldsymbol{u}/|\boldsymbol{u}|)$ prey. In this case, except for the first cycle, the loop sizes increase as the threshold value for perception is increased. Furthermore, as figure 14(b) shows, despite a consistent open shape at the front side, for normally escaping prey, the FTLE loops or pLCS converge noticeably close to the vertical symmetry line, and their sizes decrease with respect to opposite escaping preys (figure 14a).
Threshold shear-dependent variation of pLCS for oppositely and normally escaping prey in five swimming cycles. Forward-time pLCS/FTLE loop areas and their locations reveal the relative variation of the prey interception regions with respect to the jellyfish. The dotted lines are  ${\tau _{th}} = 0$ (constant escape response); and the dashed lines are
 ${\tau _{th}} = 1$ (escape response applied at a threshold shear). (a) Opposite escaping prey; and (b) normally escaping prey. Abbreviations used here are: OESCF, opposite escape force; OESCF-Th, opposite escape force applied at threshold
 ${\tau _{th}} = 1$; NRESCF, normal escape force; NRESCF-Th, normal escape force applied at threshold
 ${\tau _{th}} = 1$. Here Re = 100 and h 0/d 0 = 0.3.

3.3.4. Influence of paddling force
We now examine the paddled force-dependent,  ${\boldsymbol{F}_b}$, variations (Nielsen et al. Reference Nielsen, Asadzadeh, Dolger, Walther, Kiørboe and Andersen2017) of prey interception and capture, and infinitesimal prey are considered for the analysis. Figures 15(a1) and 15(a2) show forward-time and backward-time FTLE fields, pLCS and appended final prey positions, for
 ${\boldsymbol{F}_b} = 7$; and figure 15(b1,b2) reveals such results for
 ${\boldsymbol{F}_b} = 17$. First, the appended final positions (at t = 5T) of the displaced prey particles in figures 15(a2) and 15(b2) that originated both within the forward-time FTLE lobes (denoted in red in figure 15a1,b1) and outside (marked in blue) following five cycles of the created feeding current (by A. aurita, h 0/d 0 = 0.3) exhibit that the red prey are contained in a capture zone (pLCS boundary) whereas blue particles stay out/escape. Second, a comparison of figure 9(a,b) with figures 15(a1,a2) and 15(b1,b2) clearly reveals that the target loops and prey capture zones become bigger/more elongated as the magnitude of the paddling force (
 ${\boldsymbol{F}_b}$, (B9)) is increased, signifying the prospect of an improved feeding efficiency (figure 20). Notably, despite
 ${\boldsymbol{F}_b}$-sensitive variations, all infinitesimal red prey that originated within forward-time FLTE loops (e.g. figures 15a1,b1 and 9a) are entrained into the respective capture boundary (backward-time pLCS; figures 15a2,b2 and 9b) while those that stayed outside clearly escape. Therefore, the observations from figure 10(b) strongly suggest that their inertia can help some prey to escape.
The impact of varied paddling force (Fb) on prey capture. Plotted for infinitesimal prey and applied to two different paddling forces, Fb = 7 and Fb = 17, the contours of FTLE fields (pLCS) and displacement of prey particles due to the paddling jellyfish motion. (a1) The forward-time FTLE field, where green-coloured high ridges reveal Lagrangian coherent structures (pLCS) computed at t = 5T, for Fb = 7. The red- and blue-coloured prey are initially located inside and outside the upstream pLCS lobes, and their swept positions are tracked, as the jellyfish moves forwards. (a2) The corresponding backward-time FTLE field plus appended position of prey at t = 5T; the pLCS boundaries are denoted in dark black colour. (b1, b2) Displayed results that are computed for increased paddling force Fb = 17. Here Re = 100 and h 0/d 0 = 0.3.

3.3.5. Effect of Reynolds number
Figure 16 presents the Lagrangian analyses for varied Re. For Re = 50, figure 16(a1) shows the forward-time FTLE plus pLCS (dark green high ridges), and figure 16(a2) reveals the backward-time FTLE/pLCS (black high ridges) that are computed for five swimming cycles. Figures 16(b1) and 16(b2) display such simulated results at Re = 150. Figures 16(a1) and 16(b1) show that the sizes of FTLE lobes (target zones) increase for increased Re, signifying the possibility of improved prey encounter and capture (e.g. figures 13a4, 17 and 20). For essential details, the pink-coloured individual infinitesimal prey particles are placed within the forward-time FTLE lobes (figure 16a1,b1) and blue prey particles are placed nearby/outside. Computations are thus performed for five cycles, as the predator/jellyfish swims forwards. In figures 16(a2) and 16(b2) the appended swept positions of the prey particles (at t = 5T) confirm that prey that originated inside the forward-time FTLE lobe (figure 16a1,b1) are entrained within the respective pLCS boundary (figure 16a2,b2), while those stayed outside visibly escape. It is noteworthy that the prey that stayed inside FTLE loops (figure 16a1,b1) created in the third and fourth cycles are also effectively entrained within the bell region (see figure 16a2,b2), and the capture area is clearly increased at a higher Re.
The impact of increased Reynolds number (Re). Plotted for infinitesimal prey and for two different Reynolds numbers, Re = 50 and Re = 150, the contours of FTLE fields (pLCS) and displaced prey particles due to the jellyfish motion. (a1) The forward-time FTLE field, where green-coloured high ridges reveal Lagrangian coherent structures (pLCS) computed for t = 5T, using Re = 50. The pink- and blue-coloured prey particles are initially located inside and outside the upstream pLCS lobes, and their swept positions are tracked as the jellyfish paddles forwards. (a2) The corresponding backward-time FTLE field plus appended position of prey at t = 5T; the pLCS boundaries are denoted in dark black colour. (b1, b2) Displayed results that are computed for the increased Re = 150. Here h 0/d 0 = 0.3.

Plotted here are the prey capture areas (defined by outer high ridges of backward-time pLCS) on the streamwise (z = 0) swimming plane, for floating: (a1) infinitesimal prey, Re = 100 and Fb = 12; (a2) infinitesimal prey, at Re = 50, Fb = 12; (a3) infinitesimal prey, at Fb = 17, Re = 100; (a4) infinitesimal prey, at Fb = 7, Re = 100; (a5) inertial prey with no escape force (R = 2/3, NESCF,  ${a_E}$ = 0), Re = 100 and Fb = 12; (a6) inertial prey with opposite escape force (R = 2/3, OESCF,
 ${a_E}$ = 0.5), Re = 100 and Fb = 12; and (a7) inertial prey with normal escape force (R = 2/3, NRESCF,
 ${a_E}$ = 0.5), Re = 100 and Fb = 12. (b1–b7) The exhibited 3-D structures of corresponding prey capture surfaces. Here h 0/d 0 = 0.3.

To exhibit the relative variation of capture area/volume for infinitesimal, inertial, opposite and normally escaping prey, and for varied paddled force (Fb) and Re, these results are first summarized in figure 17(a1–a7) for the streamwise swimming plane. Figures 17(a1), 17(a5) and 17(a6) show that the capture area is reduced for inertial and oppositely escaping prey, with respect to infinitesimal prey, whereas the capture area (see figure 17a1–a4) increases as paddled body force (Fb) or Reynolds number (Re) increases. Moreover, for improved clarity, in figure 17(b1–b7), the multi-decked 3-D structures of the prey capture surfaces for the various cases examined are presented for five paddled cycles.
3.3.6. Prey capture at resonant frequency
Past findings (Alexander & Bennet-Clark Reference Alexander and Bennet-Clark1977; Tytell et al. Reference Tytell, Hsu, Williams, Cohen and Fauci2010) suggest that, for faster motion, an aquatic swimmer often tunes muscle contraction appropriately with respect to surrounding fluid forces, which results in optimized body dynamics and maximization of peak acceleration. Accordingly, the resonant driving of the elastic bell is detected (Hoover et al. Reference Hoover, Porras and Miller2019) to maximize the forward swimming speed of a jellyfish relative to lower frequencies. To the authors’ knowledge, there exists virtually no study that examines or quantifies the impact of resonant swimming by a jellyfish on its prey capturing capability. To address this point, the present 3-D MRT-LB-IB model is utilized to explore the effect of resonant driving on prey encounter and capture.
To detect the natural frequency, for a selected paddling force (Fb), the bell diameter (d/d 0) is initially allowed to contract to 90 % of its original length and then Fb is released indefinitely. This allows the body to oscillate freely in the fluid. As figure 18(a) shows, the periods of free vibration for the two different bells (of diameter d/d 0) examined are  $T_o^\ast = 3.07{t_c}$ at h 0/d 0 = 0.3 and
 $T_p^\ast = 3.79{t_c}$ at h 0/d 0 = 0.5, which correspond to the period of time beginning from the point after a bell has freely expanded from the starting contracted state to its next subsequent expansion state. The computed displacement of the apex of a jellyfish (h 0/d 0 = 0.3) bell as a function of
 $t/T_o^\ast $ is presented in figure 18(b) for three different normalized periods
 $T^{\prime} = T/T_o^\ast $, and it reveals that a bell with a shorter
 $T^{\prime}$ accelerates more quickly than one with a longer
 $T^{\prime}$. Note that, among all (smaller/larger) swimming periods
 $T^{\prime}$, the bell moves farthest (even after 15 cycles have elapsed) when it is driven at resonance
 $(T^{\prime} = 1)$. On the other hand, figure 7(a) shows that, when a jellyfish (h 0/d 0 = 0.3) swims at resonant frequency, its COT is clearly reduced over a range of applied paddling force (Fb). Now we focus on the issue of prey capture or hunting, as a jellyfish drives at resonant frequency.
(a) The oscillations of two bell diameters (d/d 0) with h 0/d 0 = 0.3 and h 0/d 0 = 0.5 during free vibration study as functions of time (t/tc). The paddling force Fb is applied until the bell diameter is reduced to 90 % and then released, allowing the bell to oscillate at its natural frequency of free vibration. Here Re = 100. (b) The plot reveals the displacement of a bell apex (h 0/d 0 = 0.3) as a function of time  $t^{\prime}$ ( =
 $t/T_o^\ast $, where
 $T_o^\ast $ is the period of free vibration of the oblate-shaped bell) for three different normalized periods
 $T^{\prime}$ ( = T/
 $T_o^\ast $) = 0.65, 1.0 and 1.5.

Accordingly, figure 19 presents simulated prey interception loops (forward-time pLCS in five cycles) for three different selected driving periods of a jellyfish bell (h 0/d 0 = 0.3), which are: below the resonant driving  $(T^{\prime} = 0.65)$, coincident with the resonant driving
 $(T^{\prime} = 1)$, and exceeding the resonant driving
 $(T^{\prime} = 1.5)$. As figure 19 shows, for all
 $T^{\prime}$, the distance of developed pLCS lobes from a bell increases in successive cycles, while the impact of the resonant driving (dotted loops) is clearly effective beyond the first swimming cycle. Notably, figure 19 also shows that, for increased period
 $(T^{\prime})$ of propulsive driving, the sizes of the interception loops increase with each passing cycle. Similarly, the size of the backward-time pLCS also become longer and larger with increased driving period
 $(T^{\prime} \gt 1)$ beyond the resonant driving; however, those results are omitted here for the sake of brevity. The issue of resonant-driving-affected prey clearance is analysed next.
This shows the effect of the resonant swimming on the formation of prey encounter loops (forward-time pLCS), for an oblate jellyfish (h 0/d 0 = 0.3) that intercepts floating infinitesimal prey. The three different selected driving periods are subresonant driving ( $T^{\prime}$ = 0.65), resonant driving (
 $T^{\prime}$ = 1) and above-resonant driving (
 $T^{\prime}$ = 1.5). Here Re = 100 and Fb = 12.

3.3.7. Encounter rate
As elaborated above, medusae inhabiting the oceanic environment create a sequence of vortex rings via their repeatedly pulsed bell (Kiørboe et al. Reference Kiørboe, Saiz and Visser1999; Dabiri et al. Reference Dabiri, Colin, Costello and Gharib2005; Gemmell et al. Reference Gemmell, Colin, Costello and Dabiri2015), which in turn generates the necessary feeding current that transports/entrains (supplementary movies 1 and 5) nearby tiny copepods/prey into the belly or suitably pushes prey through the tentacles for filtering/ingestion. Many metazoans use filter feeding to catch bacteria-sized prey (Acuna, Lopez-Urrutia & Colin Reference Acuna, Lopez-Urrutia and Colin2011; Nielsen et al. Reference Nielsen, Asadzadeh, Dolger, Walther, Kiørboe and Andersen2017). However, the body shapes of prey and predator, the feeding current velocity and the ability of prey to escape can significantly impact prey filtering and capture (Kiørboe et al. Reference Kiørboe, Saiz and Visser1999). While computation of the prey encounter rate (E = Av, with A the area of filter and v the plankton velocity) is quite difficult due to the dynamic nature of the trailing tentacles plus the complexity of fluid/plankton velocity in the near wake, nevertheless, here we estimate the clearance rate CR (Nielsen et al. Reference Nielsen, Asadzadeh, Dolger, Walther, Kiørboe and Andersen2017) as the net volume flow of plankton/prey per swimming cycle per unit downstream distance d 0 that extends below the bell margin, i.e.
 \begin{equation}CR = \tfrac{1}{3}\int_{3{d_0}} {\boldsymbol{v}\boldsymbol{\cdot}\boldsymbol{n}\,\textrm{d}l} .\end{equation}
Figure 20(a) shows the variation of the normalized clearance rate, CR/CRref, as a function of Fb, for ideal infinitesimal prey in the fifth cycle, which is examined for two jellyfish bell shapes of fineness ratio 0.3 and 0.5 and for resonant swimming. These relate to thrust production by jellyfish that drives the feeding current. It should be noted that, for an infinitesimal plankton, its velocity v is the same as the local fluid velocity (e.g. Nielsen et al. Reference Nielsen, Asadzadeh, Dolger, Walther, Kiørboe and Andersen2017), whereas v varies for inertial/escaping plankton. Figure 20(a) shows that, at a fixed Re = 100, the clearance rates CR/CRref for the said two jellyfish species increase significantly faster over 1 < Fb ≤ 11 and then gradually approach respective saturating states. However, for Fb ≥ 6, the CR/CRref value for the oblate species (h 0/d 0 = 0.3) far exceeds that of a prolate-type (h 0/d 0 = 0.5) predator, revealing a higher prey clearance capability for the former. This justifies why an oblate medusa is called a filter feeder, whereas a prolate one is a typical ambush predator (Kiørboe Reference Kiørboe2011). Significantly, for the created symmetric flow (figures 4 and 5) that surrounds a jellyfish, the presented normalized CR/CRref helps quantification of the required optimal propulsive force.
Plotted here are normalized: (a) clearance rate (CR/CRref), and (b) cost of preying (COP/COPref; (3.12)) in the fifth cycle, as a function of the magnitude of the applied paddling force (Fb). To reveal morphological dependence, data for another fineness ratio (h 0/d 0 = 0.5) are added to these two plots, and the same reference conditions (Fb = 12 and h 0/d 0 = 0.3) are used for normalization. The results for resonant (Res.) driving are also supplied that reveal the effects of the resonant swimming. For A. aurita (h 0/d 0 = 0.3) computed variations of: (c) clearance rate (CR/CRref) and (d) cost of preying (COP/COPref) in the fifth cycle while encountering the ideal infinitesimal (Inf.), inertial (R = 2/3, NESCF,  ${a_E}$ = 0), opposite escaping (R = 2/3, OESCF,
 ${a_E}$ = 0.5), opposite escaping at threshold shear (R = 2/3, OESCF-Th,
 ${a_E}$ = 0.5), normally escaping (R = 2/3, NRESCF,
 ${a_E}$ = 0.5), and normally escaping prey at threshold shear (R = 2/3, NRESCF-Th,
 ${a_E}$ = 0.5). Here Re = 100.

Moreover, the results presented in figure 20(a) imply that the resonant swimming by a jellyfish/predator is inappropriate for the purpose of feeding, as CR/CRref is clearly reduced for both fineness ratios 0.3 and 0.5. However, the increased Re effectively increases CR/CRref for A. aurita (h 0/d 0 = 0.3). For an explicit quantitative measure, table 2 shows that for A. aurita (h 0/d 0 = 0.3) the average clearance rate  $\overline {CR/C{R_{ref}}} $ over a range of applied paddling force 2 ≤ Fb ≤ 24 is reduced to 59 % when the jellyfish drives at natural frequency, whereas increased Re from 100 to 150 improved
 $\overline {CR/C{R_{ref}}} $ to 123 % of the corresponding non-resonant driving. On the other hand, as the fineness ratio is increased to 0.5 (i.e. for a prolate-type species, and at fixed Re = 100), the
 $\overline {CR/C{R_{ref}}} $ value reduced to 49 % of that at h 0/d 0 = 0.3. Additionally, when the prolate-type body drives at resonance, its clearance rate is further reduced to 86 % of the corresponding non-resonant case.
In the fifth swimming cycle, the average clearance rate  $\overline {CR/C{R_{ref}}} $ of ideal infinitesimal (Inf.) prey, over a range of applied paddling forces, 2 ≤ Fb ≤ 24. Here Res. denotes respective cases of resonant driving.

To determine an optimal feeding strategy, depending on the required input energy  ${E_i}$ (equation (3.2)), the cost of preying for a feeding-current-generating predator is defined herein as
 \begin{equation}COP = \frac{{{E_i}}}{{CR}}.\end{equation}
Figure 20(b) shows the variation of the normalized COP/COPref for two different jellyfish shapes, over a range of applied paddling force (Fb). It reveals that the CR-scaled input energy requirement for A. aurita (h 0/d 0 = 0.3) attains an optimum value at Fb = 7, whereas such an optimum for a prolate-type jellyfish (h 0/d 0 = 0.5) occurs at Fb = 4, and for that the bell volumes shrink merely by 15 %. Moreover, as evident from figure 20(b), resonant swimming increases COP/COPref for both examined bell shapes. Conversely, the increased Re for A. aurita is observed to lower its cost of preying (COP/COPref).
To understand prey-specific capture behaviour, first, figure 20(c) shows the Fb-dependent variation of the clearance rate (by A. aurita; h 0/d 0 = 0.3) in the fifth cycle, for intercepted infinitesimal (Inf.), inertial (NESCF), constantly opposite escaping (OESCF), opposite escaping at the threshold shear (OESCF-Th), constantly normally escaping (NRESCF) and normally escaping at the threshold shear (NRESCF-Th) prey. It shows that CR/CRref is largest for opposite escaping prey, and it increases as Fb is increased, signifying the inappropriateness of the constantly opposite escape behaviour. Note that, as figures 13(a1) and 13(a2) show, for constantly opposite escaping prey, the interception loops that formed in the third and fourth cycles (and stretch along the front side) are the largest among the various inertial and evasive prey, which in turn helps to increase the clearance rate (figure 20c). This happens despite loops that are created in the first and second cycles often revealing a slightly reverse/shrinking trend (Peng & Dabiri Reference Peng and Dabiri2009). However, the attempt to opposite escape when made at threshold shear is clearly useful, as it reduces CR/CRref relative to that for constantly opposite escaping prey. This is supported by our observation made from figure 14(a) that exhibits relative decrease of prey interception loops particularly at later cycles, as prey escapes at threshold shear  $({\tau _{th}} = 1)$.
The results presented above for OESCF and OESCF-Th prey, which display contradictory feeding performances with an existing measurement (e.g. tables 1 and 2; Peng & Dabiri Reference Peng and Dabiri2009), suggest the clear shortcoming of any prey capture analysis that is derived from short-time swimming data. Interestingly as figure 20(c) reveals, for evasive prey the normal escape attempt is the most practical way to escape predation, which drastically lowers the clearance rate of a predator. Note also that, for normally escaping prey (figure 20c) a waiting strategy until the growth of threshold shear (NRESCF-Th) is clearly counterproductive; it simply enhances predation (CR/CRref). Figure 20(d) shows that COP/COPref is lowest for opposite escaping prey (as the prey themselves approach or fall into a trap/loop) and largest for normal escaping prey (NRESCF); nevertheless, they reveal an increasing trend at a higher Fb.
For an in-depth exploration/understanding, the cycle-to-cycle variation of the prey clearance rate is shown in figure 21 over a range of applied paddling force (Fb). Such results include various examined cases of infinitesimal (figure 21a), inertial (figure 21b), constantly opposite escaping (figure 21c), oppositely escaping prey at threshold shear (figure 21e), constantly normal escaping (figure 21d) and normally escaping prey at threshold shear (figure 21f). It should be noted that, for all classes of evasive prey considered, the CR/CRref in the first and second cycles remain significantly low compared to that in fifth cycle. However, as figure 21 exhibits, the computed CR/CRref differences are drastically reduced between the fourth and fifth cycles, and these differences appeared negligible beyond the fifth cycle.
Plotted here are variations of normalized clearance rate (CR/CRref) in the first, second, fourth and fifth swimming cycles of A. aurita (h 0/d 0 = 0.3), as a function of the magnitude of the applied paddling force (Fb). Here Re = 100. The encountered cases: (a) ideal infinitesimal (Inf.) prey, (b) inertial prey (R = 2/3, NESCF,  ${a_E}$ = 0), (c) constantly opposite escaping prey (R = 2/3, OESCF,
 ${a_E}$ = 0.5), (d) constantly normally escaping prey (R = 2/3, NRESCF,
 ${a_E}$ = 0.5), (e) opposite escaping prey at threshold shear
 ${\tau _{th}} = 1$ (R = 2/3, OESCF-Th,
 ${a_E}$ = 0.5), and (f) normally escaping prey at threshold shear
 ${\tau _{th}} = 1$ (R = 2/3, NRESCF-Th,
 ${a_E}$ = 0.5).

For additional clarity, table 3 displays the prey-specific cycle-to-cycle variation of average clearance rate  $\overline {CR/C{R_{ref}}} $ over a range of applied propulsive force 2 ≤ Fb ≤ 24, and such results are presented for two different jellyfish morphologies. Note that the
 $\overline {CR/C{R_{ref}}} $ in the fifth cycle is reduced by about 49 %, for both infinitesimal (Inf.) as well as inertial (NESCF) prey, as the fineness ratio is increased from 0.3 to 0.5. Table 3 also shows that for the opposite escaping prey (OESCF) the quantitative clearance rate (
 $\overline {CR/C{R_{ref}}} $) in the fifth cycle (for A. aurita; h 0/d 0 = 0.3) is increased to 132 % compared to that of inertial (NESCF) prey, whereas it is reduced to 50 % and 60 %, respectively, in the first and second cycles, highlighting the need for such computations over sufficiently long swimming cycles (and using the correct dynamical system). Note that, in the fifth cycle the
 $\overline {CR/C{R_{ref}}} $ for the normally escaping prey at threshold shear (NRESCF-Th) is also increased with respect to inertial (NESCF) prey (i.e. 103 % of NESCF).
Prey-specific cycle-to-cycle variation of the average clearance rate  $\overline {CR/C{R_{ref}}} $ over a range of applied paddling force, 2 ≤ Fb ≤ 24; ideal infinitesimal (Inf.), inertial (NESCF; with no escape force), opposite escape force (OESCF), opposite escape force at threshold shear (OESCF-Th), normal escape force (NRESCF), and normal escape force at threshold shear (NRESCF-Th). Here Re = 100 and
 ${a_E} = 0.5$.

3.4. Prey capture at fineness ratio 0.5
To explore the morphological variation of prey capture behaviour, here we extend the examination to a higher fineness ratio 0.5. Accordingly, first, the flow field (see supplementary movie 5) for the paddling medusa (of fixed material properties cst = 18.5 and cbe = 0.03) is simulated, and then the detailed entrainment pattern/dynamics (see supplementary movie 6) of floating infinitesimal prey particles is obtained. Figure 22 shows contours of forward-time (figure 22a1) and backward-time (figure 22a1) FTLE fields and pLCS that are computed (using (3.7)–(3.10)) for five propulsive cycles (t = 5T), so as to deliver a clear picture for predator–prey encounter. Note that, for a higher fineness ratio 0.5 of the bell, the sizes of the forward-time FTLE loops (figure 22a1), i.e. target zones, shrink significantly (compared to figure 9a; h 0/d 0 = 0.3). This implies that an oblate-type medusa (of low fineness ratio) is a better feeding-current-generating hunter compared to a prolate one. Second, instead of focusing on a cluster of prey particles, in this case the entrainment (see supplementary movie 7) of individual prey that originate inside or outside (figure 22a1) FTLE loops is revealed, which provides clearer information on their placement within the capture boundary (i.e. pLCS in figure 22a2) or near wake. The appended positions (at t = 5T) of pink- and blue-coloured prey particles in figure 22(a2), which were initially stationed as in figure 22(a1), clearly shows that the pink prey that originated inside the forward-time FTLE loops are entrained within the pLCS/capture boundary demarcated by the dark colour high ridges of the backward-time FTLE field (figure 22a2), whereas the blue-coloured particles escape to the adjacent outer area (see also supplementary movie 7).
The effect of inertia on prey encounter and capture by a prolate-type jellyfish (h 0/d 0 = 0.5). (a1,a2) For infinitesimal prey, plotted are contours of FTLE fields (pLCS) and displaced prey position due to the paddling jellyfish motion. Here Re = 100 and Fb = 5.4. (a1) The forward-time FTLE field, where green-coloured high ridges reveal Lagrangian coherent structures (pLCS) computed at t = 5T. The pink- and blue-coloured prey are initially located inside and outside the upstream pLCS lobes, and their swept positions are tracked as the jellyfish paddles forwards. (a2) The corresponding backward-time FTLE field plus appended position of swept prey at t = 5T; pLCS boundaries are denoted in dark black colour. (b1,b2) For suspended inertial prey with no escape force (R = 2/3,  ${a_E}$ = 0), plotted are contours of FTLE fields (pLCS) and displacement of prey positions due to the paddling jellyfish motion. Here Re = 100 and Fb = 5.4.

Now we examine the impact of prey inertia (using  ${\boldsymbol{a}_E}$ in (3.5)) at h 0/d 0 = 0.5. For the considered inertial prey with R = 2/3
 ${\rho _p} = {\rho _f}$, figures 22(b1) and 22(b2) show the forward-time and backward-time FTLE fields, pLCS and swept prey position at t = 5T due to the created paddled feeding current in five cycles. The noted five pairs of forward-time FTLE loops in figure 22(b1) identify the precise places in the upstream fluid region from which a prey can be captured. To confirm that the backward-time pLCS presented in figure 22(b2) indeed forms the physical capture surface, first, the inertial (R = 2/3) pink particles are placed inside the forward-time FTLE loops (figure 22b1) and adjacent blue particles outside, and the simulation is re-run for t = 5T. Figure 22(b2) shows the dispersed final position of the inertial prey with respect to the pLCS boundary (dark-coloured outer ridges). It reveals that prey stationed inside FTLE lobes (figure 22b1) are practically contained within the multi-deck capture area (figure 22b2) that surrounds the five paddling-created belly-shaped regions in the five cycles, plus a part of the bell area. Note that such a capture region is quite significantly different plus physically appropriate compared to what was postulated earlier (Peng & Dabiri Reference Peng and Dabiri2009). Nevertheless, the observed capture area for this prolate-like swimmer is clearly smaller than that of an oblate (figure 10b) one. A detailed quantitative analysis for the prey clearance rate is presented in table 3.
Figure 23 reveals the inertia-dependent structural variation of forward-time FTLE loops for this prolate-type medusa, displaying that the target loops shrink for encountered inertial prey (R = 2/3) with respect to ideal infinitesimal prey, and such results are along the line that is expected in a natural predator–prey system.
The effect of prey inertia on the variation of forward-time FTLE loops/fingers for a prolate-like (h 0/d 0 = 0.5) jellyfish/predator. Here Re = 100 and Fb = 5.4.

It may be noted that, regardless of evolutionary and morphological constraints, the tentacles of a jellyfish armed with stinging cells (cnidocytes/nematocysts) play important roles both in feeding (Miles & Battista Reference Miles and Battista2019) and in defence (Fields & Yen Reference Fields and Yen1997; Hamlet, Strychalski & Miller Reference Hamlet, Strychalski and Miller2020). For varying length (of multiple bell diameter), number and placement, the fringing tentacles mostly reduce a jellyfish's forward swimming speed (Miles & Battista Reference Miles and Battista2019) and thereby increase the cost of transport COT. Moreover, the shape or density of tentacles can affect prey entrainment and filtering, and therefore impact the prey clearance rate CR. The above studies suggest that tentacles inhibit the forward swimming speed by suppressing the growth of near-wake vortices that otherwise generate favourable thrust via passive energy recapture (Gemmell et al. Reference Gemmell, Costello, Colin, Stewart, Dabiri, Tafti and Priya2013). In addition, the foraging performance of a jellyfish varies depending on active swimming potential (that enhances CR) and opportunistic passive use of the tentacles. For instance, a box jellyfish actively hunts for food, whereas an opportunist lion's mane jellyfish extends its nematocyst-bearing lengthy tentacles and waits for prey to come into contact for predation/feeding (Miles & Battista Reference Miles and Battista2019). Alternatively, Sarsia tubulosa displays a combination of active and passive hunting behaviour. Furthermore, the ability to capture an inertial/evasive prey (e.g. small fish, or crustacean zooplankton such as copepods and barnacle larvae), or to defend against a potential threat, depends on the ease with which the nematocyst is released (Hamlet et al. Reference Hamlet, Strychalski and Miller2020) by a jellyfish, how efficiently prey is retained by nematocysts, and to what degree a prey is affected by nematocyst toxins. In a recent two-dimensional analysis, Miles & Battista (Reference Miles and Battista2019) elaborated the swimming performance of a jellyfish based on the number and length of its tentacles. The A. aurita species (see figure 24) that is considered in the current study has relatively small tentacles (of length less than a quarter of the bell diameter) that spread around the subumbrellar bell, and accordingly the species mostly consume tiny phytoplankton, released fish eggs (infinitesimal), young larvae and small fish (inertial). However, the role of the tentacles in swimming and/or LCS formation is not investigated here owing to excessive modelling complexity in three dimensions. Furthermore, in reality, motile prey exhibit complex escape reactions and different escape timings that make one species of prey more vulnerable to predation than another, and such issues are yet to be covered.
An image of a real A. aurita (moon jellyfish) that has relatively small tentacles that are used for prey capture/filtering. Source: https://commons.wikimedia.org/wiki/File:Jellyfish_(22155766231).jpg.

4. Conclusions
In this numerical study, first, the mechanistic swimming by a paddled jellyfish is revealed in three dimensions via the created starting and stopping vortex rings, the circulation contribution, near-surface pressure variation, fluid entrainment, thrust production and required cost of transport COT. Second, the prey capture practices for the two different jellyfish morphologies considered are displayed and analysed both quantitatively and via several movies. During the active contraction phase, the power derived from the applied transient body force (Fb) at the bell margin and the elastic strain energy acts to produce high acceleration. The stored elastic energy in the contracted phase is then used by a swimmer for later bell expansion in the relaxed phase and to produce a stopping vortex ring that in turn generates significant favourable thrust by virtue of the entrained surrounding fluid. In the process, the manipulated near-surface low-pressure areas empower a jellyfish, for the larger part of a swimming cycle, to move forwards in the water by using the positive thrust-generating inward flow at the bell edge; although, a region of high pressure persists near the apex area, especially in transient periods. Moreover, the developed high-pressure region just below the bell (below the stopping vortex) helps to generate supportive thrust in the form of passive energy recapture. For varied morphology (h 0/d 0 = 0.3 and 0.5), our study shows that the COT increases rapidly as propulsive force Fb falls below a threshold magnitude (Fb,th), when medusae swim rather slowly. However, for Fb > Fb,th the growth rate of COT is gradually slowed. The COT is found to be higher for a prolate-type jellyfish compared to an oblate one, showing that an oblate-type body is more economical. The resonant swimming by a medusa reduced the COT over a wide range of applied Fb. In addition, the generated circulation  $\varGamma$ by a stopping vortex ring in the relaxed phase is about twofold higher than that of a starting vortex ring, indicating the intelligent swimming pattern that metazoans follow.
In a significant step forwards, for the first time, the present numerical study efficiently analyses the prey interception process and quantifies the success rate of capturing various inertial and evasive prey for a paddled swimmer, via an adopted appropriate dynamical system and modified Maxey–Riley equation. The work follows the recent paper of Peng & Dabiri (Reference Peng and Dabiri2009) on the same topic. However, our results and analysis differ significantly from theirs, in addition to the incorporated correction of a missing term  $- (R/2){\boldsymbol{a}_E}$ in the governing equation. Notably, a physically realistic ‘capture boundary’ that is appropriate for diverse inertial and evasive prey is defined/obtained herein using the backward-time pLCS, instead of the hypothetical previous one (Peng & Dabiri Reference Peng and Dabiri2009) that is constituted by the approximated forward-time pLCS. Moreover, our computed FTLE loops plus prey capture activity over five swimming cycles of a predator help to broaden and correct much of the previously reported quantitative analysis and conclusions for intercepted inertial and evasive prey, as those were obtained for much shorter time, before the generated feeding current adequately spreads. In addition, for two different jellyfish morphologies, the relevant forward-time and backward-time FTLE and pLCS, are presented in greater detail for intercepted infinitesimal, inertial, opposite and normally escaping prey, which unambiguously display effective prey interception loops and well-defined capture surfaces; and for the first time the resultant prey clearance rate CR is obtained in this study.
Furthermore, issues related to the threshold shear-dependent escape strategy for conscious prey and the resultant effects of varied propulsive force (1 ≤ Fb ≤ 27), Reynolds number (50 ≤ Re ≤ 150) and resonant driving are broadly elaborated. Our results reveal that, for a higher bell fineness ratio h 0/d 0 = 0.5, the interception loop sizes and capture areas decrease rapidly compared to h 0/d 0 = 0.3, whereas the clearance rate is reduced by about 49 % for both infinitesimal (Inf.) as well as inertial (NESCF) prey. This shows that an oblate-type jellyfish is a more successful feeding-current-based hunter than a prolate one. Although resonant driving helps faster swimming, it is found to be inappropriate for feeding, as the corresponding clearance rate by a jellyfish decreased for both h 0/d 0 = 0.3 and 0.5. In addition, resonant swimming increased the cost of preying (COP/COPref) for both bell shapes. The increased Re for A. aurita (h 0/d 0 = 0.3) is detected to lower its cost of preying over a range of applied Fb. Since clearance rate is an important measure for efficient feeding, the enhanced CR with increased Fb (1 ≤ Fb ≤ 27) detected herein displays how propulsive force can help to improve the feeding ability of a predator/medusa. Moreover, the offered thorough analysis involving ideal infinitesimal, inertial, opposite and normally escaping prey, and threshold shear (signal) based prey escape strategy, shows, for A. aurita, that the clearance rate for encountered opposite escaping preys (OESCF) increases to 132 % of that for inertial (NESCF) prey; whereas for normal escaping prey at threshold shear (NRESCF-Th) it is increased to 103 % of that for inertial (NESCF) prey. Additionally, our computed cycle-to-cycle prey clearance rate CR for two jellyfish bell shapes and diverse evasive prey illustrate that in the first and second cycles CR remains significantly low compared to that in the fifth cycle, implying clear limitations of any such small-time estimate. The presented results and movies provide an advanced insight into widely used feeding-current-based prey capture practices by a natural predator in a free habitat/environment.
Supplementary movies
Supplementary movies are available at https://doi.org/10.1017/jfm.2020.1069.
Funding
The work is supported by NRF grant no. 2017R1D1A1A09000952, South Korea.
Declaration of interests
The authors report no conflict of interest.
Appendix A. The MRT-LB-IB model
The adopted collision operator (D'Humieres et al. Reference D’humieres, Ginzburg, Krefczyk, Lallemand and Luo2002; Premnath & Abraham Reference Premnath and Abraham2007; Wu et al. Reference Wu, Cheng, Zhang and Wei2015) for the multi-relaxation-time lattice Boltzmann and immersed boundary (MRT-LB-IB) model is expressed as
 \begin{gather}{f_\alpha }(\boldsymbol{x} + {\boldsymbol{e}_\alpha }\delta t,\, t + \delta t) - {\,f_\alpha }(\boldsymbol{x},t) = - {\boldsymbol{\mathsf{S}}_{\alpha i}}({\,f_i}(\boldsymbol{x},t) - \,f_i^{eq}(\boldsymbol{x},t)) + \left( {\boldsymbol{\mathsf{I}} - \frac{\boldsymbol{\mathsf{S}}}{2}} \right){F_\alpha }\delta t,\end{gather}
 \begin{gather}{F_\alpha } = {w_\alpha }\left( {\frac{{{\boldsymbol{e}_\alpha } - \boldsymbol{u}}}{{c_s^2}} + \frac{{{\boldsymbol{e}_\alpha } \boldsymbol{\cdot} \boldsymbol{u}}}{{c_s^4}}{\boldsymbol{e}_\alpha }} \right) \boldsymbol{\cdot} \boldsymbol{f},\end{gather}
where  ${f_\alpha }$ and
 $f_\alpha ^{eq}$ are distribution functions and their equilibrium states (in
 $\alpha $ direction;
 $\alpha = 0,1,2 \ldots ,N$),
 $\boldsymbol{x}$ the Eulerian coordinate,
 $\boldsymbol{\mathsf{S}}$ the collision matrix,
 ${w_\alpha }$ (equation (A3) below) the weighing factor,
 ${\boldsymbol{e}_\alpha }$ (equation (A4) below) the particle velocity, u the fluid velocity,
 ${c_s} = c/\sqrt 3 $ the speed of sound related to the D3Q15 model (Kuzmin, Guo & Mohamad Reference Kuzmin, Guo and Mohamad2011; Kruger et al. Reference Kruger, Kusumaatmaja, Kuzmin, Shardt, Silva and Viggen2016), c the Cartesian component of particle velocity, D3 an abbreviation of 3-D space, Q15 refers to discrete velocity vectors, and f the external (Eulerian) force density. The
 ${w_\alpha }$ in (A3) below depends on the underlying lattice structure, and its choice (Zhu et al. Reference Zhu, He, Wang, Miller, Zhang, You and Fang2011) ensures isotropy of the fluid. The lattice Boltzmann equation (LBE) derivable from the Boltzmann equation is used to solve the incompressible flow structure interaction. The
 ${w_\alpha }$ are accordingly chosen (Premnath & Abraham Reference Premnath and Abraham2007; Kruger et al. Reference Kruger, Kusumaatmaja, Kuzmin, Shardt, Silva and Viggen2016) as
 \begin{equation}{w_\alpha } = \left\{ {\begin{array}{@{}ll} {{\textstyle{2 \over 9}},}&{\alpha = 1,}\\ {{\textstyle{1 \over 9}},}&{\alpha = 2, \ldots ,7,}\\ {{\textstyle{1 \over {72}}},}&{\alpha = 8,\, \ldots ,\, 15.} \end{array}} \right.\end{equation}
For the applied D3Q15 model the computational domain is discretized using square lattices and  ${\boldsymbol{e}_\alpha }$ set as
 \begin{equation}{\boldsymbol{e}_{\boldsymbol{\alpha}} } = \left\{ {\begin{array}{@{}ll} {(0,0,0),}&{\alpha = 1,}\\ {( \pm 1,0,0),(0, \pm 1,0),(0,0, \pm 1),}&{\alpha = 2, \ldots ,7,}\\ {( \pm 1, \pm 1, \pm 1),}&{\alpha = 8, \ldots ,15.} \end{array}} \right.\end{equation}
Equation (A1) is subsequently mapped to moment space (Kuzmin et al. Reference Kuzmin, Guo and Mohamad2011; Wu et al. Reference Wu, Cheng, Zhang and Wei2015) by multiplying with a transformation matrix M (D'Humieres et al. Reference D’humieres, Ginzburg, Krefczyk, Lallemand and Luo2002), and resulting MRT-LBE becomes
 \begin{align}& {f_\alpha }(\boldsymbol{x} + {\boldsymbol{e}_\alpha }\delta t,\, t + \delta t) - {\,f_\alpha }(\boldsymbol{x},t)\nonumber\\ &\quad = - {\boldsymbol{\mathsf{M}}^{ - 1}}\hat{\boldsymbol{\mathsf{S}}}({\boldsymbol{m}_\alpha }(\boldsymbol{x},t) - \boldsymbol{m}_\alpha ^{eq}(\boldsymbol{x},t)) + {\boldsymbol{\mathsf{M}}^{ - 1}}\left( {\boldsymbol{\mathsf{I}} - \frac{{\hat{\boldsymbol{\mathsf{S}}}}}{2}} \right)\boldsymbol{\mathsf{M}}{F_\alpha }\delta t,\end{align}
where  $\boldsymbol{m} = \boldsymbol{\mathsf{M}}f$, i.e.
 $f = {\boldsymbol{\mathsf{M}}^{ - 1}}\boldsymbol{m}$. The collision matrix
 $\hat{\boldsymbol{\mathsf{S}}}\,(\hat{\boldsymbol{\mathsf{S}}} = \boldsymbol{\mathsf{MS}}{\boldsymbol{\mathsf{M}}^{ - 1}})$ in moment space is a diagonal matrix with non-negative entities, i.e.
 $\hat{\boldsymbol{\mathsf{S}}} = \textrm{diag}[{s_1},{s_2},{s_3},{s_4},{s_5},{s_6},{s_7},{s_8},{s_9}, {s_{10}},{s_{11}},{s_{12}},{s_{13}},{s_{14}},{s_{15}}]$, and parameters
 ${s_i}$ denote inverse of relaxation time of various moments of
 $\boldsymbol{m}$ in reaching equilibrium. For the MRT-LB-IB model (A5) with external forcing, we use
 ${s_1} = {s_4} = {s_6} = {s_8} = 1$,
 ${s_2} = 1.19$,
 ${s_3} = 1.41$,
 ${s_5} = 1.6$,
 ${s_7} = 1.6$,
 ${s_9} = 1.6$,
 ${s_{15}} = 1.98$,
 ${s_{10}} = {s_{11}} = {s_{12}} = {s_{13}} = {s_{14}} = 1/\tau $ and
 $\tau = 0.54$, which provide better stability (Premnath & Abraham Reference Premnath and Abraham2007). The relaxation time τ and kinematic viscosity ν are related by
 \begin{equation}\nu = (\tau - {\textstyle{1 \over 2}})c_s^2\delta t.\end{equation}
Using Gram–Schmidt orthogonalization, the matrix  $\boldsymbol{\mathsf{M}}$ (D'Humieres et al. Reference D’humieres, Ginzburg, Krefczyk, Lallemand and Luo2002) becomes
 \begin{equation}\boldsymbol{\mathsf{M}} = {[{v_1},{v_2},{v_3},{v_4},{v_5},{v_6},{v_7},{v_8},{v_9},{v_{10}},{v_{12}},{v_{13}},{v_{14}},{v_{15}}]^\textrm{T}},\end{equation}
where ‘T’ denotes transpose operator, and components of the column vectors of M are expressed as
 \begin{equation}\begin{array}{l} {v_{1\alpha }} = \parallel {e_\alpha }{\parallel ^0},\quad {v_{2\alpha }} = \parallel {e_\alpha }{\parallel ^2} - 2,\quad {v_{3\alpha }} = {\textstyle{1 \over 2}}(15\parallel {e_\alpha }{\parallel ^4} - 55\parallel {e_\alpha }{\parallel ^2} + 32),\quad \, {v_{4\alpha }} = {e_{\alpha x}},\\ {v_{5\alpha }} = {\textstyle{1 \over 2}}(5\parallel {e_\alpha }{\parallel ^2} - 13){e_{\alpha x}},\quad {v_{6\alpha }} = {e_{\alpha y}},\quad {v_{7\alpha }} = {\textstyle{1 \over 2}}(5\parallel {e_\alpha }{\parallel ^2} - 13){e_{\alpha y}},\quad {v_{8\alpha }} = {e_{\alpha z}},\\ {v_{9\alpha }} = {\textstyle{1 \over 2}}(5\parallel {e_\alpha }{\parallel ^2} - 13){e_{\alpha z}},\quad {v_{10\alpha }} = 3e_{\alpha x}^2 - \parallel {e_\alpha }{\parallel ^2},\quad {v_{11\alpha }} = e_{\alpha y}^2 - e_{\alpha z}^2,\quad {v_{12\alpha }} = {e_{\alpha x}}{e_{\alpha y}},\\ {v_{13\alpha }} = {e_{\alpha y}}{e_{\alpha z}},\quad {v_{14\alpha }} = {e_{\alpha x}}{e_{\alpha z}},\quad {v_{15\alpha }} = {e_{\alpha x}}{e_{\alpha y}}\, {e_{\alpha z}}. \end{array}\end{equation}
The velocity moment vector m and its elements at equilibrium are accordingly described as
 \begin{equation}\boldsymbol{m} = {[\rho ,e,{e^2},{j_x},{q_x},{j_y},{q_y},{j_z},{q_z},3{p_{xx}},{p_{ww}},{p_{xy}},{p_{yz}},{p_{zx}},{m_{xyz}}]^\textrm{T}},\end{equation}
with
 \begin{equation}\begin{array}{l} e = - \rho + \dfrac{{j_x^2 + j_y^2 + j_z^2}}{{{\rho _0}}},\quad {e^2} = \rho - 5\left( {\dfrac{{j_x^2 + j_y^2 + j_z^2}}{{{\rho_0}}}} \right),\quad {q_x} = - \dfrac{7}{3}{j_x},\\ {q_y} = - \dfrac{7}{3}{j_y},\quad {q_z} = - \dfrac{7}{3}{j_z}, \end{array}\end{equation}
and
 \begin{equation}\begin{array}{l} \, {p_{xx}} = \dfrac{1}{3}\left[ {\dfrac{{2j_x^2 - (\,j_y^2 + j_z^2)}}{{{\rho_0}}}} \right],\quad {p_{ww}} = \left[ {\dfrac{{(\,j_y^2 - j_z^2)}}{{{\rho_0}}}} \right],\quad {p_{xy}} = \dfrac{{{j_x}{\,j_y}}}{{{\rho _0}}},\\ {p_{yz}} = \dfrac{{{j_y}{j_z}}}{{{\rho _0}}},\quad {p_{zx}} = \dfrac{{{j_y}{\,j_z}}}{{{\rho _0}}},\quad {m_{xyz}} = 0, \end{array}\end{equation}
where e and  ${e^2}$ denote kinetic energy independent of density and square of energy, respectively, (
 ${j_x}$,
 ${j_y}$,
 ${j_z}$) =
 $\rho ({u_x},{u_y},\, {u_z}) \equiv \rho \boldsymbol{u}$ are components of momentum or mass flux, (
 ${q_x}$,
 ${q_y}$,
 ${q_z}$) the energy fluxes,
 ${p_{xx}}$,
 ${p_{xy}}$,
 ${p_{yz}}$,
 ${p_{zx}}$ the components of symmetric viscous stress tensor, and
 ${m_{xyz}}$ an antisymmetric third-order moment.
Upon calculating  ${f_\alpha }$, the macroscopic density, velocity and pressure are obtained as follows:
 \begin{gather}\rho = \sum\limits_\alpha {{\,f_\alpha }} ,\end{gather}
 \begin{gather}\rho \boldsymbol{u} = \left( {\sum\limits_\alpha {{\boldsymbol{e}_{\boldsymbol{\alpha}} }{\,f_\alpha } + \tfrac{1}{2}\boldsymbol{f}\delta t} } \right),\end{gather}
 \begin{gather}p = c_s^2\rho .\end{gather}
Appendix B. Implementation of the immersed elastic jellyfish body
Here the Eulerian description is used for surrounding fluid motion whereas the physical deformation of a pulsating jellyfish (figure 1) under applied periodic force is expressed using a moving curvilinear coordinate  $({\gamma _1},{\gamma _2})$ system. A combination of Eulerian–Lagrangian variables is thus used to reveal the swimming motion (Zhao, Freund & Moser Reference Zhao, Freund and Moser2008; Park et al. Reference Park, Chang, Huang and Sung2014). Accordingly the effect of the pulsating jellyfish membrane boundary is incorporated via discrete Lagrangian points
 $\boldsymbol{X}({\gamma _1},{\gamma _2},t)$ that exert forces to attached Eulerian fluid. Based on direct momentum forcing (equation (A1)) on Eulerian grids, the formulation (equation (B2) below) ensures satisfaction of the no-slip condition (Kruger et al. Reference Kruger, Kusumaatmaja, Kuzmin, Shardt, Silva and Viggen2016) along an immersed body. The interaction of Lagrangian body particles and Eulerian flow variables is facilitated via a Dirac delta function (see (B3)). Forces on the immersed boundary (IB) are thereby first computed at Lagrangian points and then spread to Eulerian grids.
The schematic in figure 1(a) shows the elastic fibre that forms the jellyfish body in three dimensions. To derive the Lagrangian forces arising from stored elastic fibre energy (Huang & Sung Reference Huang and Sung2009), we simulate the motion and deflection of material points  $\boldsymbol{X}({\gamma _1},{\gamma _2},t)$ of the jellyfish body using the Lagrangian description. The paddling body boundary effect on the surrounding fluid is taken into account by (equation (B1) below) spreading the elastic surface force into the bulk fluid and treating as a body force. As boundary forces spread from Lagrangian points to nearby fluid lattices, the affected velocity field is interpolated as below. The associated physical interaction (Mittal & Iaccarino Reference Mittal and Iaccarino2005; Zhao et al. Reference Zhao, Freund and Moser2008; Huang & Sung Reference Huang and Sung2009) is modelled as
 \begin{gather}\boldsymbol{f}(\boldsymbol{x},\, t) = \int_{{{\Omega }_s}} {\boldsymbol{F}({\gamma _1},{\gamma _2},t)\delta (\boldsymbol{x} - \boldsymbol{X}({\gamma _1},{\gamma _2},t))\,\textrm{d}{\gamma _1}\,\textrm{d}{\gamma _2}} ,\end{gather}
 \begin{gather}\boldsymbol{U}({\gamma _1},{\gamma _2},\, t) = \boldsymbol{u}(\boldsymbol{X}({\gamma _1},{\gamma _2},t),t) = \int_{{\boldsymbol{\Omega }_{\boldsymbol{f}}}} {\boldsymbol{u}(\boldsymbol{x},t) \delta (\boldsymbol{x} - \boldsymbol{X}({\gamma _1},{\gamma _2},t))\,\textrm{d}\kern0.7pt \boldsymbol{x}} ,\end{gather}
where  ${{\Omega }_s}$ denotes structure region,
 ${{\Omega }_f}$ the fluid region influenced by the immersed body,
 $\textrm{d}{\gamma _1}\,\textrm{d}{\gamma _2}$ an area segment,
 $\boldsymbol{F}({\gamma _1},{\gamma _2},t)$ the Lagrangian force density,
 $\delta (\boldsymbol{x} - \boldsymbol{X}({\gamma _1},{\gamma _2},t))$ the Dirac delta function, and
 $\boldsymbol{U}({\gamma _1},{\gamma _2},\, t)$ the local velocity of the IB. Equation (B2) through IBM effectively imposes the no-slip condition on the IB surface while the elastic body (figure 1a) moves with the same velocity as the attached fluid. The Dirac delta function
 $\delta (\boldsymbol{x})$ in the work is chosen (Shin, Huang & Sung Reference Shin, Huang and Sung2008; Huang & Sung Reference Huang and Sung2009; Yang et al. Reference Yang, Zhang, Li and He2009; Kruger, Varnik & Raabe Reference Kruger, Varnik and Raabe2011) as
 $\delta (\boldsymbol{x}) = \delta (x)\delta (y)\delta (z)$, where the explicit form of
 $\delta (x)$, for example, is given by
 \begin{equation}\delta (x) = \left\{ {\begin{array}{@{}ll} {{\textstyle{1 \over 8}}(3 - 2|x|+ \sqrt {1 + 4|x|- 4{x^2}} ),}&{0 \le |x|\le 1,}\\ {{\textstyle{1 \over 8}}(5 - 2|x|+ \sqrt { - 7 + 12|x|- 4{x^2}} ),}&{1 \le |x|\le 2,}\\ {0,}&{2 \le |x|.} \end{array}} \right.\end{equation}
The implemented four-point Dirac delta function in (B3) reduces the non-physical flow oscillation (Yang et al. Reference Yang, Zhang, Li and He2009) and facilitates improved realization of the no-slip condition (Kruger et al. Reference Kruger, Varnik and Raabe2011, Reference Kruger, Kusumaatmaja, Kuzmin, Shardt, Silva and Viggen2016). Moreover, the stability regime of this four-point delta function is reported much wider (Shin et al. Reference Shin, Huang and Sung2008), among the two-point, three-point and four-point regularized delta functions. Herein the elastic force  $\boldsymbol{F}$ is derived using the variational derivative (Huang & Sung Reference Huang and Sung2009) of the energy functional E(X), that is,
 \begin{equation}\boldsymbol{F} = - \frac{{\partial E(\boldsymbol{X})}}{{\partial \boldsymbol{X}}}.\end{equation}
The elastic energy E in general is a combination of torsion, shear, bending and stretching energy. However, in the present study only stretching and bending forces are taken into account (Park et al. Reference Park, Chang, Huang and Sung2014). The mathematical details that explain the implementation of the fluid elastic forces are as follows.
The elastic spring model (Tsubota, Wada & Yamaguchi Reference Tsubota, Wada and Yamaguchi2006) is applied here to describe the membrane deformation. The flexible jellyfish body is accordingly viewed (figure 1a) as a sequence of tissues interconnected via springs. The stored elastic energy in springs allows changes of spring length plus the angle between two adjacent springs. The total elastic energy E is therefore equal to the sum of concentrated energy (Huang & Sung Reference Huang and Sung2009) due to stretching/compression, i.e. energy  ${E_{st}}$ that depends on material stiffness
 ${c_{st}},$ plus energy
 ${E_{be}}$ that is stored via bending, based on bending coefficient
 ${c_{be}}$. Therefore,
 $E = {E_{st}} + {E_{be}}$ (say), where
 \begin{equation}E[\boldsymbol{X}] = \frac{1}{2}{c_{st}}\int_{{\boldsymbol{\Omega }_{\boldsymbol{s}}}} {\sum\limits_{i,j = 1}^2 {\left[ {{{\left( {\left|{\frac{{\partial \boldsymbol{X}}}{{\partial {\gamma_i}}}\frac{{\partial \boldsymbol{X}}}{{\partial {\gamma_j}}}} \right|- 1} \right)}^2} + \frac{1}{2}{c_{be}}{{\left|{\frac{{{\partial^2}\boldsymbol{X}}}{{\partial {\gamma_i}\, \partial {\gamma_j}}}} \right|}^2}} \right]} } \,\textrm{d}{\gamma _1}\,\textrm{d}{\gamma _2}.\end{equation}
The elastic stiffness  $({c_{st}})$ and bending
 $({c_{be}})$ coefficients are, however, kept fixed, once chosen. Using (B5) and (B4), the stretching (Fst) and bending (Fbe) forces can be expressed as
 \begin{equation}{\boldsymbol{F}_{st}} = \mathop \sum \limits_{i,j = 1}^2 \frac{\partial }{{\partial {\gamma _i}}}({\sigma _{ij}}{\eta _j})\quad \textrm{and}\quad {\boldsymbol{F}_{be}} = - \mathop \sum \limits_{i,j = 1}^2 \frac{{{\partial ^2}}}{{\partial {\gamma _i}\, \partial {\gamma _j}}}\left( {{c_{be}}\frac{{{\partial^2}\boldsymbol{X}}}{{\partial {\gamma_i}\, \partial {\gamma_j}}}} \right).\end{equation}
In (B6a), the tension force  ${\sigma_{ij}}$ and unit tangent
 ${\eta _j}$ to the boundary are defined as follows:
 \begin{gather}{\sigma _{ij}} = \left\{ {\begin{array}{@{}ll} {{c_{st}}\left( {\left|{\dfrac{{\partial \boldsymbol{X}}}{{\partial {\gamma_i}}}\dfrac{{\partial \boldsymbol{X}}}{{\partial {\gamma_j}}}} \right|- 1} \right),}&{\textrm{for}\,\left|{\dfrac{{\partial \boldsymbol{X}}}{{\partial {\gamma_i}}}\dfrac{{\partial \boldsymbol{X}}}{{\partial {\gamma_j}}}} \right|\ge 1,}\\ {0,}&{\textrm{otherwise,}} \end{array}} \right.\end{gather}
 \begin{gather}{\eta _j} = {{\frac{{\partial X}}{{\partial {\gamma _j}}}} / {\left|{\frac{{\partial X}}{{\partial {\gamma_j}}}} \right|}}.\end{gather}
The flexible jellyfish body moves by alternately squeezing and freely relaxing its muscle. The applied contracting nodal force  ${\boldsymbol{F}_b}$ below is modelled using an inward-directed periodic force function (in lattice measure; Kruger et al. Reference Kruger, Kusumaatmaja, Kuzmin, Shardt, Silva and Viggen2016) that acts through 0 < t < tc over a small width
 $h^{\prime}$ (figure 1a) at the bell edge. Hence,
 ${\boldsymbol{F}_b}$ that is active over a contraction period tc is modelled (Zhao et al. Reference Zhao, Freund and Moser2008; Huang & Sung Reference Huang and Sung2009) as
 \begin{gather}{\boldsymbol{F}_b} = {F_{b,x}}\boldsymbol{\hat{i}} + {F_{b,y}}\boldsymbol{\hat{j}} + {F_{b,z}}\boldsymbol{\hat{k}},\end{gather}
 \begin{gather}{F_{b,x}} = \left\{ {\begin{array}{@{}ll} {\varLambda (2 - r)\min (t,{t_c} - t)\dfrac{{{\boldsymbol{x}_{11}}}}{{|{\boldsymbol{x}_1}|}},}&{r \lt 2,\,t \lt {t_c},}\\ {0,}&{\textrm{otherwise,}} \end{array}} \right.\end{gather}
 \begin{gather}{F_{b,z}} = \left\{ {\begin{array}{@{}ll} {\varLambda (2 - r)\min (t,{t_c} - t)\dfrac{{{\boldsymbol{x}_{13}}}}{{|{\boldsymbol{x}_1}|}},}&{r \lt 2,\,t \lt {t_c},}\\ {0,}&{\textrm{otherwise,}} \end{array}} \right.\quad \textrm{and}\quad {F_{b,y}} = 0,\end{gather}
where r is the distance between force point and left tip, and x1 = (x 11,0, x 13) denotes a vector pointed from the force point to its symmetric counterpart. The force coefficient  $\varLambda $ is chosen here as 250 (e.g. Park et al. Reference Park, Chang, Huang and Sung2014). Equation (B10–B11) shows, at close vicinity of the bell edge and at beginning time steps (through a power stroke for
 $t \le {t_c}$) the transient body force
 ${\boldsymbol{F}_b}$ is active, and then suddenly withdrawn
 $({\boldsymbol{F}_b} = 0)$ for tc < t ≤ T.
A major effort/time in the 3-D computation of FSI is spent for tracing the time-varying IB points  $\boldsymbol{X}({\gamma _1},{\gamma _2},t)$ and obtaining transmitted forces. Equation (B3) shows the computation of
 $\delta (x)$,
 $\delta (y)$ and
 $\delta (z)$ and thereby the FSI ((B1) and (B2)) for the IB involves Eulerian points that span over five lattice units around the body. Accordingly the size of a time-varying moving subdomain that surrounds the jellyfish and helps to effectively compute the FSI is optimized in each time step by examining the changed dimensions of the jellyfish and its position, which considerably reduced the computational cost.
The boundary conditions that are used for simulating the paddled jellyfish motion (FSI) consist of: (i) satisfaction of the no-slip condition (B2) at the moving body boundary (IB) that is carefully computed using five neighbouring cells (Kruger et al. Reference Kruger, Kusumaatmaja, Kuzmin, Shardt, Silva and Viggen2016); (ii) periodic boundary condition at spanwise ends of the flow domain; and (iii) zero streamwise velocity gradient conditions at inlet/outlet. Accordingly, a jellyfish deforms or moves following the kinematic condition
 \begin{equation}\frac{{\partial \boldsymbol{X}}}{{\partial t}} = \boldsymbol{U}({\gamma _1},{\gamma _2},\, t).\end{equation}
For numerical implementation, we use an explicit Euler scheme to trace the moving IB points, and a realistic nodal force distribution  ${\boldsymbol{F}_{\boldsymbol{b}}}$ (B9) is applied at the bell edge to enable the near-natural kinematics.




