1. Introduction
The rise of corporate social responsibility (CSR) in recent years is part of a growing trend by firms to reaffirm their responsibility toward the communities they serve. At the same time, the rising threat of climate change has shifted the public focus to the contributing role of firms to climate change, excess waste, and other environmental impacts of provision. Consequently, environmental, social, and governance (ESG) investing has become a major principle for global investment strategies. Investors seek environmentally responsible firms that pledge to reduce harmful practices, regulate their energy consumption, and neutralize the negative environmental externalities of their business. While CSR increases the profit opportunities of firms, it dictates a balanced approach to providing socio-economic and environmental benefits, sustainability, and profit. Firms discovered CSR as an opportunity to boost their reputation and brand image and encourage investment and customer retention. Some firms, however, have abandoned a balanced approach and use it to maximize profits by making false claims about the social responsibility of their practices. Within the context of environmental responsibility, such actions have been termed greenwashing (or green sheen).
Empirical evidence is concerning: greenwashing activities carried out by firms are increasingly common. RepRisk database (https://www.reprisk.com) reports, apart from a recent mild decrease, a constant increase in the frequency of greenwashing linking one in four climate-related ESG risk incidents globally related to the former. In addition, greenwashing is linked to its social counterpart, social washing. RepRisk’s data shows that nearly one in three public companies linked to greenwashing also engage in social washing. The data shows a significant increase in greenwashing over the past years since the signing of the Paris Agreement in 2015, especially in the US, Canada, and Europe (see Figure 1) and, in particular, in the banking and financial services sectors (RepRisk Report, Reference RepRisk Report2022). With greater public attention to greenwashing and, eventually, broader criticism in Europe and America, firms have developed more sophisticated means of greenwashing. In addition to directly misleading consumers, firms are now using pledges, certifications, and future commitments that do not require immediate actions and render greenwashing less visible (Fürer, Reference Fürer2023).
Left: unique entities with at least one ESG incident linked to both environmental footprint and misleading communication in a given year (Fürer, Reference Fürer2023). Right: breakdown of sectors linked to climate greenwashing (RepRisk Report, Reference RepRisk Report2022).

With the growing empirical evidence of greenwashing and the rising sophistication of measures taken by firms to deceive investors and customers, this paper supports and extends the existing, predominantly empirical, and sector-specific literature by providing a dynamic model that considers the limited strategic and path-dependent aspects of greenwashing. Our model captures coevolutionary factors that influence the adoption of green and greenwashing firm behavior that are not captured by existing static models. In a first step, we develop an evolutionary game-theoretic model in which firms are confronted with the choice between three strategies: using a green or brown production technology or greenwashing. In this model, we capture several interesting strategic characteristics of greenwashing: To minimize discovery, greenwashing firms greenscam consumers and, in doing so, engage in the form of aggressive mimicry. The latter describes an evolutionary strategy in which predators convince their prey of their harmlessness by superficially resembling an innocuous third party. Similarly, greenwashing firms attempt to pose as sustainable firms to attract customers and investors. The success of greenwashing critically depends on the cost of mimicry, the risk of discovery, and the costs attributed to such a case in relation to the benefits of successful greenwashing. Greenwashing is further subject to peer dynamics and externalities. On the one hand, frequent exposure to firms’ greenwashing practices erodes the public’s trust in these industries, increasing scrutiny and the risk of discovery.Footnote 1 On the other hand, strong competition encourages firms to adopt practices that maximize profit. Since greenwashing allows firms to cut costs, a higher prevalence of successfully greenwashing firms encourages other firms to follow the same strategy. This creates a strategic coupling between firms, where a higher pervasiveness of greenwashing in an industry increases the likelihood of detection but also makes firms more inclined to utilize this strategy. Thus, greenwashing is both a strategic substitute and a strategic complement.
We study the dynamics for two different regimes, depending on whether the profit premium attributed to green production exceeds the cost of green production, and for each, provide the explicit condition which determines the type of the evolutionarily stable equilibria. In a second step, we incorporate more realistic dynamics, such as localized firm interactions and peer effects, as well as history-dependent costs of green investment, profits, and mimicry efficiency. To manage the increased complexity of this extended model, we simulate the interactions using an agent-based model. Comparing the results between both models reveals that the closed-form conditions obtained in the simpler version offer a good approximation for the dynamics of the extended model. However, market segmentation and history dependencies of both costs and mimicry efficiency encourage green production and discourage greenwashing beyond the initially predicted levels. In addition, using the flexibility of the agent-based approach, we further examine how different random network topologies influence the strategy distribution of the firm population in this context. Although the network structure affects the rate of convergence towards an equilibrium, the long-term strategy distributions are robust across these various network types.
Based on these results, we argue in favor of sets of trio-targeted policies that simultaneously reduce the (initial) costs of green investment/production, curtail opportunities to mimic green behavior, and support segmentation. At the end of this paper, we provide policy suggestions and support for existing policies that encourage these three dimensions.
The remainder of the paper proceeds as follows. After a short literature review in the following Section 2, we develop the simple evolutionary model and determine the attractors of the system in Section 3. Section 4 extends the model to an agent-based model, and we present the simulation results. Section 5 discusses the results and their implications for policymaking, and Section 6 concludes.
2. Literature review
While the investment in green technology entails costs (Eyraud et al., Reference Eyraud, Clements and Wane2013), investors and other stakeholders look favorably on firms which disclose green investments leading to significant gains in firm value (Martin and Moser, Reference Martin and Moser2016; Yadav et al., Reference Yadav, Han and Rho2016). Greenwashing then arises as an element of concern when firms fail to internalize the costs of brown productions and climate change, and perceive green investments as a vehicle to promote their products and attract investors.Footnote 2
Greenwashing further implies less effective climate policies and is likely to influence attitudes not only in the financial sector but also those of consumers.Footnote 3 False or misleading information about a firm’s environmental claims is difficult to spot for consumers (Juliana Fernandes and Leopold, Reference Juliana Fernandes and Leopold2020). However, if discovered, the practice damages corporate reputation and stock performance, while negatively impacting consumer purchases, creating a “lemon market” problem (Ioannou et al., Reference Ioannou, Kassinis and Papagiannakis2023). Current research on the management of corporate greenwashing as a critical environmental policy issue has attracted substantial academic attention. Two broad streams of literature are relevant for our study:
-
• Ecological behavior games: This literature studies topics related to the management of green supply chains, examining how chains can provide green products that meet environmental and sustainability needs (Cai et al., Reference Cai, Sun, Shang and Hegde2023). In this context, game theoretic models are increasingly used to simulate collaborative evolutionary stability trends in emissions reductions (Liu et al., Reference Liu, Huang, Shang, Zhao, Yang and Zhao2022, Reference Liu, Song, Wang and Shi2023), and explore emerging green corporate behaviors (Chen et al., Reference Chen, Wei, Wei, Huang and Su2021). Some scholars have studied green supply chain issues under a dynamic framework using differential game models (Liu et al., Reference Liu, Huang, Shang, Zhao, Yang and Zhao2022).
-
• The motivation for greenwashing: Assuming that companies are self-interested profit seekers who minimize costs, greenwashing is a rational corporate strategy influenced by competitive pressures and opportunities (He et al., Reference He, Wang, Wang, Xie and Chen2022). Environmental policy requirements (Zhang, Reference Zhang2022b) and consumer demand (Wang and Hou, Reference Wang and Hou2020) have become important drivers of greenwashing. Limited consumer knowledge of the green market causes information asymmetry which firms exploit (Hameed et al., Reference Hameed, Hyder, Imran and Shafiq2021) and imperfect regulations enable greenwashing through loopholes in certification (Demirel et al., Reference Demirel, Iatridis and Kesidou2018). Factors influencing the decision to greenwash can be external market factors (consumers, policies, etc.) and internal non-market factors (Delmas and Burbano, Reference Delmas and Burbano2011a; Lyon and Maxwell, Reference Lyon and Maxwell2011; Zhang, Reference Zhang2022a).
Those aforementioned studies, along with the literature on climate sentiments (Besley and Persson, Reference Besley and Persson2023; Dunz et al., Reference Dunz, Naqvi and Monasterolo2021) provide the basis for our analysis. However, by providing a dynamic model that accounts for the limited strategic as well as path-dependent aspects of greenwashing, our approach both supports and extends the predominantly empirical and sector-specific literature in the field of greenwashing (Huang et al., Reference Huang, Shi and Jia2025; Gupta and Singh, Reference Gupta and Singh2024; Bernini et al., Reference Bernini, Giuliani and La Rosa2024, see also Delmas and Burbano, Reference Delmas and Burbano2011; Laufer, Reference Laufer2003; Parguel et al., Reference Parguel, Benoît-Moreau and Larceneux2011; Wu and Shen, Reference Wu and Shen2013; Marquis et al., Reference Marquis, Toffel and Zhou2016; Xu et al., Reference Xu, Li and Xu2023 for examples). Our evolutionary analysis has advantages over static models (e.g., Agi et al., Reference Agi, Faramarzi-Oghani and Hazır2021; Leng and Parlar, Reference Leng and Parlar2005; Huang et al., Reference Huang, Shi and Jia2025 and for a good example, see Lyon and Maxwell, Reference Lyon and Maxwell2011) since we capture coevolutionary factors of greenwashing that include elements of strategic complements (the engagement in greenwashing of one firm incentivizes other firms) and strategic substitutes (a higher frequency of greenwashing increases public awareness). The extended model includes factors that have been shown to affect green production and greenwashing, such as path-dependent profits (Gaio and Raposo, Reference Gaio and Raposo2011; Al Ani and Chavali, Reference Al Ani and Chavali2023; Hirsch et al., Reference Hirsch, Lanter and Finger2021 and costs (Kesidou and Demirel, Reference Kesidou and Demirel2012; Zhou and Gu, Reference Zhou and Gu2019; Faber et al., Reference Faber, Ruttinger, Strunge, Langhorst, Zimmermann, van der Hulst, Bensebaa, Moni and Tao2022), and relates the ability to mimic green production to the previous history of successful and unsuccessful mimicry. It also adds localized peer effects (see, e.g., the literature on strategic groups, Fiegenbaum and Thomas, Reference Fiegenbaum and Thomas1995, three-dimensional institutional equivalence, Gao et al., Reference Gao, Gu and Yang2024, and strategic change, Massini et al., Reference Massini, Lewin and Greve2005; Ma et al., Reference Ma, Cui and Xu2024) that influence a firm’s decision based on the historical prevalence of greenwashing in its neighborhood. In doing so, our paper goes beyond more classical approaches to modeling deceptive signaling.Footnote 4
3. The dynamical model with random matching
Each firm
 $i$
has to choose between three strategies
 $s_i=\{G,B,W\}$
, where
 $G$
indicates an investment in green technology,
 $B$
in brown technology, and
 $W$
denotes the decision to deceive investors and customers by greenwashing their production and products. For simplicity, we do not describe a production process nor a production function in this simplified model.
We assume that each firm receives a baseline profit of
 $\phi _{i}$
and each strategy is connected to additional revenues and costs independent of the quantity of output. If playing
 $s_i=G$
, firm
 $i$
is able to attract additional revenues given by a profit premium
 $\sigma _i$
and an additional individual cost
 $c_i$
as a share of the baseline profit. The latter is caused by additional investments in green technology and the production of green output. A brown firm, on the other hand, does neither accrue a profit premium nor does it bear the additional cost of investment. A greenwashing firm
 $i$
is able to attract the profit premium
 $\sigma _i$
but only bears a cost of mimicry
 $\mu _i$
less than
 $c_i$
and
 $\sigma _i$
as a share of the baseline profit, which is paid for pretending being green (i.e., the cost of mimicry). If, however, a firm is identified as a greenwasher, it does not receive a profit premium, but to the contrary, bears a reduction of its profit
 $\rho$
as a share of the baseline profit. Since the premium and costs are fractions of the baseline profit
 $\phi _{i}$
, we further have
 $\{\sigma _i,c_i,\mu _i,\rho _i\}\in (0,1)$
. Further assume that each firm
 $i$
is subject to profit variations in each period
 $t$
defined by
 $\epsilon _{i}\in ({-\varepsilon ,\varepsilon })$
with an expected value of
 $0$
. We then obtain the four payoff functions:Footnote
5
 \begin{align} \pi _i(G)&=\left (1+\sigma _i-c_i+ \epsilon _{i}\right ) \phi _{i} \end{align}
 \begin{align} \pi _i(B)&= (1+ \epsilon _{i})\phi _{i} \end{align}
 \begin{align} \pi _i^{nd}(W)&=\left (1+\sigma _i-\mu _i+ \epsilon _{i}\right ) \phi _{i} &\text{ if not detected} \end{align}
 \begin{align} \pi _i^d(W)&=\left (1-\rho _i+ \epsilon _{i}\right ) \phi _{i} &\text{ if detected} \end{align}
The expected profit of a greenwashing firm then depends on the probability
 $\theta _i$
of being detected by the public. Probability
 $\theta _i$
is partially defined by the public awareness of greenwashing in the form of a level of suspicion
 $\alpha$
and the (individual) effectiveness of mimicry
 $\nu _i$
, which for the moment we consider to be constant but less than the level of suspicion. Let the share of
 $G$
-players be
 $x$
, the share of
 $W$
-players be
 $y$
, and thus, the share of
 $B$
-players be
 $z$
. We assume the simple relation:
 \begin{align} \alpha &=\frac {y^\beta }{x^\beta +y^\beta } \end{align}
 \begin{align} \theta _i&=\max \{\alpha -\nu _i ,0\} \end{align}
Parameter
 $\beta \geq 0$
defines the public inertia.Footnote
6
The larger
 $\beta$
is, the more the public will need to be exposed to greenwashing firms before investors and consumers become suspicious. In turn, they react more strongly once suspicious. The expected payoff of a greenwashing firm is then a convex combination of (1c) and (1d) with weight (2b) given by:
 \begin{align} \pi _i(W)=\phi _i \left (1-\rho _i+\epsilon _i+\frac {\left (\sigma _i-\mu _i+\rho _i\right ) \left (\nu _i \left (x^{\beta }+y^{\beta }\right )+x^{\beta }\right )}{x^{\beta }+y^{\beta }}\right ) \end{align}
Firms are expected to regularly update their strategy based on a payoff comparison with firms with which they interact. Assuming random matching, we can represent the system’s dynamics using the following replicator dynamics,
 \begin{align} \dot {x}=x \left (\pi _i(G)-\Delta \right ) \end{align}
 \begin{align} \dot {y}=y \left (\pi _i(W)-\Delta \right ) \end{align}
where
 $\dot {x}=\partial x / \partial t$
and
 $\dot {y}=\partial y / \partial t$
define the corresponding time derivatives and
 $\Delta =\pi _i(B) z+\pi _i(G) x+\pi _i(W) y$
defines the average payoff of the population. It is sufficient to define the replicator for frequencies
 $x$
and
 $y$
, since
 $z=1-x-y$
and the structure of the replicator dynamics ensures that the strategy frequencies remain within the unit interval. A strategy then increases whenever firms following such a strategy outperform the market average and decreases whenever such firms perform less well than the market average (Ille, Reference Ille2022).
For
 $\beta =1$
, we can solve the system analytically. In addition, we drop the indices since the replicator dynamics operate on population averages. Further note that a fixed point is obtained whenever the strategy distribution does not change. Solving for
 $\dot {x}=0$
and
 $\dot {y}=0$
simultaneously and noting thatFootnote
7
 \begin{align} \lim _{y\to 0,x\to 0} (\dot {x},\dot {y})=(0,0) \end{align}
we obtain the following proposition by identifying the fixed points.
Proposition 1. The dynamical system ( 4a )-(4b) is characterized by the following stationary states and their corresponding eigenvalues:
 \begin{align} (x=0,y=0)\ : \ \lambda _{001}&=\phi \left (\sigma -c\right ),\ \lambda _{002}=\phi \left (\nu \left (\sigma -\mu +\rho \right )-\rho \right ) \end{align}
 \begin{align} \begin{split} (x=0,y=1)\ : \ \lambda _{011}&=\phi \left (\rho -\nu \left (\sigma -\mu +\rho \right )\right ),\\ \lambda _{012}&=\phi \left (\sigma -c+\rho -\nu \left (\sigma -\mu +\rho \right )\right ) \end{split} \end{align}
 \begin{align} (x=1,y=0)\ : \ \lambda _{101}&=-\phi \left (\sigma -c\right ),\ \lambda _{102}=\phi \left (\nu \left (\sigma -\mu +\rho \right )+c-\mu \right ) \end{align}
 \begin{align} \begin{split} (x=x_0,y=y_0)\ : \ \lambda _{xy1}&=-\phi \left (\sigma -c\right ),\\ \ \lambda _{xy2}&=\frac {\phi \left (-\sigma +c-\rho +\nu \left (\sigma -\mu +\rho \right )\right ) \left (c-\mu +\nu \left (\sigma -\mu +\rho \right )\right )}{\sigma -\mu +\rho } \end{split} \end{align}
where
 \begin{align} x_0&=-\nu +\frac {\sigma -c+\rho }{\sigma -\mu +\rho } \end{align}
 \begin{align} y_0&=1-x_0 \end{align}
define the interior fixed point if
 $x_0,y_0\in (0,1)$
.
We can see that the interior equilibrium is in fact a corner solution at which
 $z=0$
. Further, we obtain the sensible result that the equilibrium share of greenwashing firms increases with a higher effectiveness of mimicry, while the share of green firms decreases at
 $(x_0,y_0)$
. Since
 $\mu \lt c,\sigma$
, fixed point
 $(1,0)$
is unstable. Assuming,
 $\sigma \gt c$
, fixed point
 $(0,1)$
requires that the effectiveness of mimicry is sufficiently high, that is,
 \begin{align} \nu \gt \frac {\sigma -c+\rho }{\sigma -\mu +\rho } \end{align}
while fixed point
 $(x_0,y_0)$
requires the opposite to be stable, which also ensures that the interior equilibrium is situated within the unit interval, that is,
 \begin{align} \nu \lt \frac {\sigma -c+\rho }{\sigma -\mu +\rho } \end{align}
Assuming
 $\sigma \lt c$
, fixed point
 $(0,1)$
requires the slightly modified condition
 \begin{align} \nu &\gt \frac {\rho }{\sigma -\mu +\rho } \end{align}
and the stability of
 $(0,0)$
requires the inverse condition
 \begin{align} \nu &\lt \frac {\rho }{\sigma -\mu +\rho } \end{align}
leading to the following qualitative result of the dynamical system with random matching (4a)-(4b).
Corollary 1. The dynamical system defined by payoffs (1a) , (1b) , and (3) and the underlying replicator dynamics (4a), (4b) is subject to two regimes, depending on whether the premium from green investment exceeds its cost. In each regime, the firm population converges to a globally stable equilibrium determined by the efficiency of mimicry.
-
• In regime 1:
 $\sigma \gt c$
, the system can sustain an equilibrium in which all firms engage in greenwashing or an equilibrium in which some firms greenwash while the remaining share of firms legitimately invests in green technologies. The stability of the former equilibrium requires that the effectiveness of mimicry exceeds the net benefit of green investment over being a detected greenwasher relative to the net benefit of undetected greenwashing over being a detected greenwasher. Otherwise, we observe the latter equilibrium.
-
• In regime 2:
$\sigma \lt c$
, the same system can sustain a pure population composed entirely of greenwashing firms or a pure population with only brown firms. The former occurs if the effectiveness of mimicry exceeds the cost of detection relative to the net benefit of undetected greenwashing over being a detected greenwasher (condition
(10)
). The latter equilibrium occurs in the opposite case
(11)
.


Notice that the largest share of green firms occurs for
 $\lim _{\mu \to c} x_0=1-\nu$
leading to the intuitive result that only if the cost-benefit of greenwashing converges to zero and mimicry is ineffective, all firms will invest in green technology.Footnote
8
The following simplexes (Figure 2) represent a projection of the strategy space indicating the system’s dynamics.
 $\beta =1, c_i=0.6,\mu _i=0.4,\rho _i=0.1,\phi _i=100$
.

This simple dynamical model with random matching cannot explain the persistence of a completely mixed equilibrium in which a positive share of firms chooses each strategy, nor a stable equilibrium with only green firms. It ignores a number of critical factors. Random matching does not reflect how firms interact since any firm
 $i$
has an equal probability of receiving profit information from any other firm
 $j\neq i$
. Not only are some details relevant to a firm’s profit (e.g., off-balance sheet items) not publicly available. In addition, firms may not compete under the same market conditions but are segmented across markets. An interaction with a fixed structure, in which any firm
 $i$
has only partial access to information and, thus, interactions are constrained to a subset of firms, is a more realistic setting.
To obtain a closed-form solution, we made some further simplifying assumptions. The cost of investment is considered constant. However, while the initial costs of investment in green technology can be very high, leading to
 $\sigma _i\lt c_i$
, these costs diminish over time (ignoring straight-line amortization, see also Karásek and Pavlica, Reference Karásek and Pavlica2016). Thus, even at initially high investment costs, firms may support green technology as long as the costs diminish sufficiently quickly.Footnote
9
Similarly, if found to be greenwashing, firms find it difficult to raise investment or to sell their goods and are unable to establish a green image convincingly. Yet, these perpetrating firms can switch to a green strategy once redeemed at the end of their punishment period. On the other hand, greenwashing firms that remain undetected for longer periods improve their mimicry and can better avoid detection. Thus, both green and greenwashing firms exhibit path dependencies. Similarly, investors look at a firm’s performance history before an investment decision. The same can be assumed for firms when adopting the strategy of another firm. In addition, strategic change will not occur if profits are expected to increase only insignificantly. Thus, firms are likely to switch strategies if another firm’s average profit over the past periods exceeds its own average profit by a certain margin.
4. Extended model: an agent-based approach with local interactions
To account for these simplifying assumptions, we extend the simple model using an agent-based model to test the robustness of the previous results.Footnote 10 This allows us not only to generate a more realistic model but to study the evolution of the strategy distribution and patterns over time.
4.1 Assumptions and definitions
The simulations are initialized with a particular spatial structure which will be discussed further below. Firms are represented by agents, are initialized with a random strategy and seeded with an initial profit history equal to
 $m$
time periods. The profit history is then given by
 $\pi _i^h=\{\pi _i(-m),\pi _i(-m+1),\ldots ,\pi _i(0)$
. Each
 $\pi _i(t)\in (\phi -\varepsilon ,\phi +\varepsilon )$
for
 $t\leq 0$
. Each agent interacts only with the set of neighbors to which they are connected. Each interaction period
 $t$
is composed of a sequence of the following four stages: Profit generation
 $\rightarrow$
Strategy update
 $\rightarrow$
Detection and punishment
 $\rightarrow$
Update memory and costs.
Profit generation.
Consistent with Gaio and Raposo (Reference Gaio and Raposo2011), Al Ani and Chavali (Reference Al Ani and Chavali2023), Hirsch et al. (Reference Hirsch, Lanter and Finger2021), we assume that external investments and profits are correlated with past profits. The profit of each firm
 $i$
is based on its average profit of the previous
 $m$
periods relative to the lowest and highest of the average profits in the population of firms of size
 $n$
. Let
 $\bar {\pi }_i(t)=\sum _{r=1}^{m} \pi _i(t-r)/m$
be a firm
 $i$
’s average profit over the last
 $m$
periods and
 $\hat {\pi }_i^\ast (t)=\max _{i\in n} \{\bar {\pi }_1(t),\bar {\pi }_2(t),\ldots ,\bar {\pi }_n(t)\}$
be the maximum average profit in this period in the firm population. Equivalently, let
 $\check {\pi }_i^\ast (t)=\min _{i\in n} \{\bar {\pi }_1(t),\bar {\pi }_2(t),\ldots ,\bar {\pi }_n(t)\}$
be the minimum average profit across all firms in
 $t$
. We define the individual gross profit of firm
 $i$
as
 \begin{align} \phi _{i,t}=\varphi \frac {\bar {\pi }_i(t)}{\frac {\hat {\pi }_i^\ast (t)+\check {\pi }_i^\ast (t)} {2}} \end{align}
Furthermore, we assume that the cost of green investment
 $c_i$
depends on the earlier strategy of a firm, since the initial costs of green investment can decrease over time (Kesidou and Demirel, Reference Kesidou and Demirel2012; Zhou and Gu, Reference Zhou and Gu2019; Faber et al., Reference Faber, Ruttinger, Strunge, Langhorst, Zimmermann, van der Hulst, Bensebaa, Moni and Tao2022). Let the initial cost premium be constant
 $\hat {c}$
and let
 $l_i$
be the number of periods that firm
 $i$
engaged in investment in green technology, and
 $k_i$
the number of periods that the firm used brown technology. We then define the cost of green investment as
 \begin{align} c_{i,t}=\sup \left\{\inf \left\{\hat {c}-\delta \left (l_i-k_i\right ),\hat {c}\right\},\frac {\hat {c}}{2}\right\} \end{align}
where
 $\delta$
defines the impact of each period which we set to
 $10^{-2}$
in the simulations. In other words, the cost decreases with each period firm
 $i$
invests in green technology and increases in each period it invests in brown technology, but the individual cost does not exceed
 $\hat {c}$
or is less than
 $\hat {c}/2$
. We then redefine the profit equations (1) to the following:
 \begin{align} \pi _{i}(G,t)&=\left (1+\sigma -c_{i,t}+ \epsilon _{i,t}\right ) \phi _{i,t} \end{align}
 \begin{align} \pi _{i}(B,t)&= (1+ \epsilon _{i,t})\phi _{i,t} \end{align}
 \begin{align} \pi _{i}^{nd}(W,t)&=\left (1+\sigma -\mu + \epsilon _{it}\right ) \phi _{i,t} &\text{ if not detected} \end{align}
 \begin{align} \pi _{i}^d(W,t)&=\left (1-\rho + \epsilon _{i,t}\right ) \phi _{i,t} &\text{ if detected} \end{align}
Any parameter without a subscript is a constant and does not change over time. The profit variation given by
 $\epsilon _{it}$
with mean equal to zero is randomly assigned to each firm in each period. Note that the population averages of the payoffs defined in (14) are equal to those defined in (1).
Strategy update.
We assume that instead of being randomly matched with any other firm in the population, firms interact with a strict subset of other firms (Fiegenbaum and Thomas, Reference Fiegenbaum and Thomas1995; Gao et al., Reference Gao, Gu and Yang2024; Massini et al., Reference Massini, Lewin and Greve2005; Ma et al., Reference Ma, Cui and Xu2024). Let
 $N$
be the set of all firms, and firm
 $j$
be a neighbor of firm
 $i$
, denoted by
 $i\sim j$
, if they are situated at adjacent cells in a regular two-dimensional lattice
 $g_l$
wrapped around a torus or are connected via a link in a network
 $g_n$
and let the set of neighbors of firm
 $i$
be defined by
 $\mathfrak{N}_i=\{j\in N\;:\;j\sim i\}$
.Footnote
11
Furthermore, let
 $\mathfrak{N}^+_i=\{j\in N\;:\;j\sim i, s_j=G,\}$
and
 $\mathfrak{N}^-_i=\{j\in N\;:\;j\sim i,s_j=W\}$
be the set of neighbors of
 $i$
that are green or greenwashing, respectively. The number of neighbors who are greenwashing or are green, respectively, given by
 $|\mathfrak{N}^-_i|$
and
 $|\mathfrak{N}^+_i|$
. The highest payoff in firm
 $i$
’s neighborhood is then given by
 $\bar {\pi }_i^\ast (t)=\max _{j\in \mathfrak{N}_i\cup \{i\}}\{\bar {\pi }_j(t)\}$
and the associated strategy is
 $s_{\mathfrak{N}}^\ast (t)=\left \{s_j|j\in \mathfrak{N}\cup \{i\},\pi _{j}(s_j,t)=\bar {\pi }_i^\ast (t) \right \}$
.Footnote
12
Similarly, the average payoff of greenwashing neighbors is
 $\bar {\pi }_i^-(t)=\sum _{j\in \mathfrak{N}_i^-}\pi _j(t)/ |\mathfrak{N}^-_i|$
and of green neighbors is
 $\bar {\pi }_i^+(t)=\sum _{j\in \mathfrak{N}_i^+}\pi _j(t)/ |\mathfrak{N}^+_i|$
. We then assume that each firm recalls the composition and average payoffs in its neighborhood in the past
 $k$
periods, given by memory
 $\kappa _i=\{\xi _i(t), \xi _i(t-1),\ldots , \xi _i(t-k)\}$
. For
 $s\leq 0$
, we assume that the period’s neighborhood corruption value is
 $\xi _i(s)=0$
, and for all other periods,
 \begin{align} \xi _i(t)=\frac {|\mathfrak{N}^-_i|}{|\mathfrak{N}^+_i|} \frac {\bar {\pi }_i^-(t)}{\bar {\pi }_i^+(t)} \end{align}
The corruption value is then the relative number of green to greenwashing neighbors weighted by their respective average payoff.Footnote
13
In each period, firm
 $i$
calculates an average neighborhood corruption value across the
 $k$
last memories, giving
 $\bar {\kappa }_{i,t}=\sum _{l=0}^k \xi _i(t-l)/k$
. Furthermore, let
 $\omega _{i,t}=1-\bar {\pi }_i(t)/\bar {\pi }_i^\ast (t)$
be the baseline probability. We have the following imitation rules:
If firm
 $i$
has been playing
 $s_{i}(t)=G$
in the current period:
 \begin{equation} s_{i}(t+1)=\begin{cases} W,& \text{ if }s_{\mathfrak{N}}^\ast (t)=\left \{W\right \} \text{ and } \omega _{i,t}+\bar {\kappa }_{i,t}-\zeta \gt \eta _{i,t}\\ B,& \text{ if }s_{\mathfrak{N}}^\ast (t)=\left \{B\right \} \text{ and } \omega _{i,t}-\zeta \gt \eta _{i,t} \\ G,& \text{ otherwise } \end{cases} \end{equation}
The parameter
 $\zeta$
defines an inertia to ensure that a strategy switch only occurs if payoff differences are sufficiently large. The random variable
 $\eta _{i,t}\in (0,1)$
is calculated for each firm in each period. In other words, a green firm switches to greenwashing with a probability equal to the baseline probability, which depends on its payoffs relative to the highest greenwashing payoff, and the average neighborhood corruption value minus the inertia. Thus, firms are more likely to greenwash if their neighborhood has a history of greenwashing.
If firm
 $i$
has been playing
 $s_{i}(t)=W$
in the current period:
 \begin{equation} s_{i}(t+1)=\begin{cases} G,& \text{ if }s_{\mathfrak{N}}^\ast (t)=\left \{G\right \} \text{ and } \omega _{i,t}-\zeta \gt \eta _{i,t}\\ B,& \text{ if }s_{\mathfrak{N}}^\ast (t)=\left \{B\right \} \text{ and } \omega _{i,t}-\zeta \gt \eta _{i,t} \\ W,& \text{ otherwise } \end{cases} \end{equation}
and lastly, if firm
 $i$
has been playing
 $s_{i}(t)=B$
in the current period:
 \begin{equation} s_{i}(t+1)=\begin{cases} G,& \text{ if }s_{\mathfrak{N}}^\ast (t)=\left \{G\right \} \text{ and } \omega _{i,t}-\zeta \gt \eta _{i,t}\\ W,& \text{ if }s_{\mathfrak{N}}^\ast (t)=\left \{W\right \} \text{ and } \omega _{i,t}-\zeta \gt \eta _{i,t} \\ B,& \text{ otherwise } \end{cases} \end{equation}
Detection and punishment.
While greenwashing implies reduced costs compared to firms investing in green technology, the former firms run a risk of their deceptive strategy being detected by investors and consumers. The likelihood of detection depends on public awareness. We may assume that awareness is affected by exogenous factors, such as labels or improved transparency rules. For simplicity and consistency, however, we assume that the probability of detection depends on the strategy composition of the entire firm population as well as the individual history of the firm.Footnote 14 The likelihood of detection and hence the expected profit of a greenwashing firm thus depend both on a public and private signal. As before, let
 \begin{align} \hat {\alpha }_t&=\frac {y(t)^\beta }{x(t)^\beta +y(t)^\beta } \end{align}
In addition, we assume that firms, which have previously been reported as greenwashing, are more likely to be detected again since they will be under tighter scrutiny. Let
 \begin{align} \tilde {\alpha }_{it}&=\gamma \ \frac {r_i}{t} \end{align}
where parameter
 $\gamma$
is a report impact multiplier and
 $r_i$
defines the number of previous reports on the firm, that is, the times the firms has been identified as a greenwasher in the past history of interactions. In contrast, the ability to mimic a green firm increases with the time the firm remains undetected. We choose the following simple relation
 \begin{align} \nu _{it}= \inf \{t-t_{id},100\} / 100 \end{align}
where
 $t_{id}$
denotes the last period that firm
 $i$
was detected. Mimicry efficiency increases linearly in each period up to
 $100$
interaction periods at which point,
 $\nu _{it}=1$
. With each detection, the mimicry efficiency is reset. Let
 $\alpha _{it}=\hat {\alpha }_t+\tilde {\alpha }_{it}$
and the probability of detection
 \begin{align} \theta _{it}&=\sup \{\inf \{\alpha _{it}-\nu _{it},1\},0\} \end{align}
Update memory and costs.
Each individual firm’s profit is then calculated based on the strategy chosen according to (16)-(18) and given (22), while the firm’s payoff is given by (14). Each firm records the strategy distribution and payoffs in its neighborhood. If a firm
 $i$
has been detected as a greenwashing firm, it will receive payoff
 $\pi _{i,t}^d(W)$
for
 $l^p$
periods.
4.2 Simulation results
To better understand how the segmented interaction on a lattice and the other assumptions affect previous results, we assume for the moment that firms do not benefit from history-dependent efficiencies and both cost
 $c_{i,t}$
and
 $v_{it}$
are constant. We further set
 $l^p=1$
.Footnote
15
Equilibrium distributions for different profit premia and effectiveness of mimicry
 $\nu \in [30,80;1]$
. initialization with
 $\varphi =100$
,
 $z(0)=0.93$
,
 $x(0)=0.04$
,
 $y(0)=0.03$
,
 $c=0.60$
,
 $\mu =0.4$
,
 $\rho =0.1$
,
 $\varepsilon =0.05$
.

Constant costs and mimicry efficiency.
Figure 3 presents the simulation results after
 $10,000$
interaction periods between 2690 firms to ensure that the firm population settled into a quasi-stable distribution. In all graphs, brown indicates the brown strategy, red the greenwashing strategy, and green defines the green strategy. The system is initialized with a majority of brown firms and only
 $4\%$
green firms and
 $3\%$
greenwashing firms.Footnote
16
The reason is to start with a baseline scenario in which firms predominantly had no environmental concerns. Firms interact with their Moore neighborhood, are positioned on a lattice wrapped around a torus, and therefore each firm has eight adjacent cells. To introduce additional randomness in the number of neighbors, only
 $70\%$
of all cells are occupied. Since population averages of the payoff functions in (14) are equal to (1), the main differences between the closed-form conditions (8)-(11) and the simulation results in Figure 3 are caused by the differences in the updating algorithm. The system behaves as predicted by the closed-form solution for
 $\sigma \leq 60$
and the points of transition between regimes are as defined (10)-(11), respectively. While the transition points are still correctly predicted by (8)-(9) for larger values of the baseline profit, we can see that the share of green (greenwashing) firms exceeds (falls behind) the predicted value in (7). The reason is presented by the sample run in Figure 4(a)–(b).
Strategy distribution for
 $\sigma =75$
and
 $\nu =0.50$
.

Initially, firms quickly adopt a greenwashing strategy and the level of public suspicion
 $\hat {\alpha }$
spikes at
 $0.84$
in period
 $130$
limiting profits for greenwashing firms (not shown). During this time, small clusters of green firms can sustain themselves and benefit from the high levels of public suspicion. They increase in size, boosting the number of green firms from
 $15\%$
to roughly
 $33\%$
(the predicted share is
 $5.5\%$
) reducing public suspicion levels to approximately
 $66\%$
. At this point, the firm population enters only a quasi-stable state. While the strategy distributions remain roughly constant, the spatial distribution slowly but gradually shifts as the clusters of green firms move across the lattice on the torus. We can see that segmentation supports the evolution of green investment by slowing down the adoption of other strategies and allowing for the evolution of successful green firms.
History-dependent costs and mimicry efficiency.
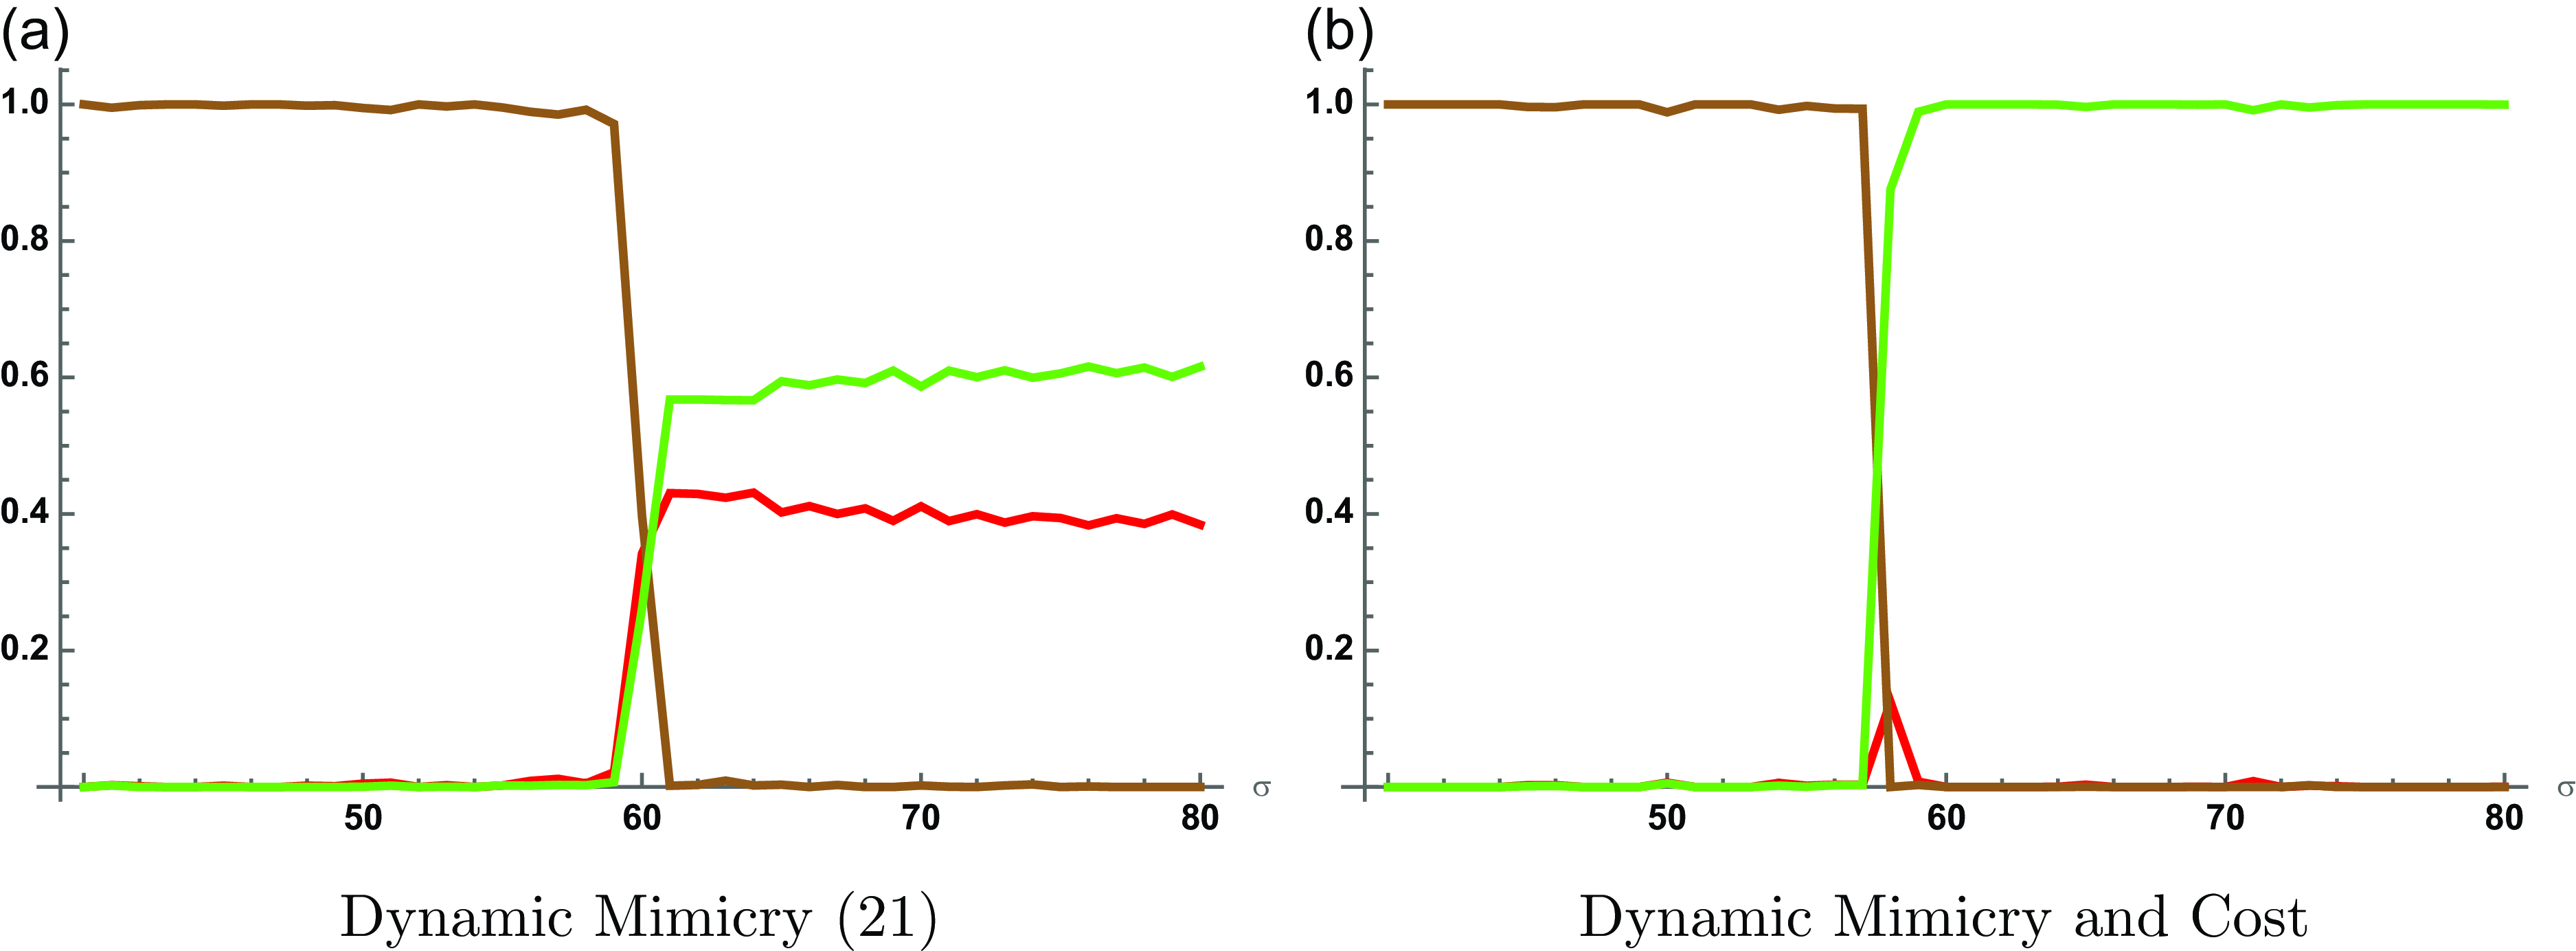
Figure 5 shows the results if we relax the assumption that costs are constant but instead, are defined by (13). Results are unaffected for
 $\sigma \lt 60=\hat {c}$
but higher payoff premia change both the transition points and the strategy distributions. Since costs are history-dependent, green firms experience higher profits in later periods which significantly boosts the share of green firms given a fixed effectiveness of mimicry. Figure 4(c) shows the convergence to one of the mixed equilibria in which green firms benefit from dynamic costs and exceed the number of greenwashing firms. The figure shows that the clustering effect can create intermittent shifts during which brown firms rapidly adopt green technology followed by a gradual but slower rise of greenwashing firms. Figure 6 then studies the effect of dynamic mimicry as well as the joint impact of both dynamic mimicry and dynamic costs. Since mimicry is endogenously defined by (21), results only vary based on differences in the payoff premia. A regime transition occurs at around
 $\sigma =0.60$
as before.Footnote
17
Dynamic mimicry fails to adequately boost the share of greenwashing firms, since the latter only has an incrementally increasing impact on firm payoff. During the initial periods, green firms have sufficient time to consolidate their profit while segmentation and the history of lower profits make it harder for greenwashing firms to catch up. The combined effect of dynamic mimicry and dynamic cost creates two simple regimes. For
 $\sigma \lt \hat {c}$
, all firms are brown while for
 $\sigma \geq \hat {c}$
, all firms eventually invest in green technology.

Population frequencies based on different payoff premia using the same parameter values as before.

Public inertia and longer punishment.
To obtain the results in the closed-form solution, we assumed that
 $\beta =1$
. Since results are independent of
 $\sigma \in [30,80]$
, Figure 7(a) and (b) show the impact of higher public inertiae for a single value
 $\sigma =0.60$
. We can see that the impact of inertia is insignificant for
 $\beta \geq 2$
and slightly increases the share of greenwashers and decreases the share of brown companies when moving from
 $\beta =1$
to
 $\beta \geq 2$
. At low payoff premia, a longer punishment period
 $l^p$
reduces the share of greenwashing firms, but only leads to an increase in brown firms and therefore fails to encourage green investment (see Figure 7(c) and (d)). However, longer punishment periods become ineffective at larger payoff premia. At
 $\sigma \geq 0.65$
, increasing the punishment period has only a negligible impact on the strategy distribution in the firm population (not shown).
(a) and (b) show the impact of changes to inertia
 $\beta$
, given profit premium
 $\sigma =0.60$
showing only small initial effect at
 $\beta =2$
. (c) and (d) show the impact of changes to punishment duration, given profit premium
 $\sigma =0.45$
.

4.3 Network effects under dynamic mimicry and dynamic costs
While an in-depth analysis goes beyond the scope of this paper, we tested the robustness of our results for different random networks. These random networks exhibit properties, which can be found in firm alliance networks and in internationalizing firms.Footnote 18
These networks are generated using the dynamics similar to those in social networks and therefore, provide a more realistic representation than the lattice topology. The networks are created as follows:
-
• Type 1: Each firm is asked to create a link with a randomly chosen other firm returning a regular network of size
$1$
. -
• Type 2: A randomly chosen firm is asked to create a link with another randomly chosen firm. The process is repeated
$n=500$
times where
$n$
equals the the population size. -
• Type 3: Similar to Type 2, but the process is repeated a fixed amount of times. In the simulations, this number was set to
$m=2400$
. This process creates a classic Erdős-Rényi random network. -
• Type 4: Firms are ordered in a line and each firm randomly connects to each of the firms further to its right each with a random probability of 5%.
-
• Type 5: In each period, a new firm is added to the network and connects to an incumbent firm with a probability proportional to its degree (number of links) creating a network of preferential attachment (see Yule, Reference Yule1925; Barabási and Albert, Reference Barabási and Albert1999 and Ille, Reference Ille2022, Ch. 6).Footnote 19


We only studied the impact of the different types of random networks under dynamic mimicry and under both dynamic mimicry and dynamic costs and compared the results to those in Figure 6. Simulations ran for
 $500,000$
periods to allow for enough time to settle on an equilibrium. In case of dynamic mimicry but fixed costs, all firms remain brown for profit premia of
 $\sigma \lt 60$
. The only minor exception are Type 5 networks (preferential attachment) where we observe a more gradual regime transition. Instead of the sudden transition at around
 $\sigma =60$
, the share of brown firms starts declining at
 $\sigma =50$
and reaches a value close to zero at
 $\sigma =65$
. After the regime transition, results are identical to 6(a) for Type 2 and 3 networks. In case of a Type 1, 4, or 5 network, the strategy distribution does not entirely settle on an equilibrium but fluctuates close to
 $(x=0.5,y=0.5)$
. In the case in which firms benefit both from increasing efficiencies in mimicry and decreasing costs, we obtain the same results as in Figure 6(b) with the only difference that regime transition occurs at around
 $\sigma \approx 48$
instead of
 $\sigma = 58$
as in the other scenarios. Consequently, different network topologies seem to have a very limited impact on the long-term strategy distribution, supporting our results in 6. However, these networks encourage green production for profit premia below the cost of green production (i.e., in the vicinity close to the critical value of the regime transition) if firms benefit from dynamic costs and dynamic mimicry and further, slow down the rates of convergence to an equilibrium.
5. Interpretation and implication of the results
Both the evolutionary game theoretic model as well as the extended model generate a number of insightful results. The conditions of the closed-form solution show the critical role of investment costs, which must be lower than the payoff premium linked to green investment (Regime 1:
 $\sigma \gt c$
).Footnote
20
When interpreting this result, two important points need to be acknowledged: in our simple model, agents are not forward-looking. Investor support depends only on the history of past profits. In addition, we deliberately kept the meaning of the payoff premium
 $\sigma$
vague. While the latter can be interpreted as immediate gains in profits, it is more realistic to understand these as the present value of future profit premia. In addition, premia should not be seen strictly as pecuniary in nature, but should also include reputation benefits that facilitate future investment and sales. However, condition (9) shows that the ability to mimic green production must be simultaneously curtailed and that at low cost of green production, increasing the obstacles, or cost of mimicry can encourage the adoption of green production more strongly than increasing the profit premium of green production or the penalty after greenwashing is discovered.Footnote
21
In addition, conditions (10)-(11) indicate that if the cost of green production is high (Regime 2:
 $\sigma \lt c$
), increasing the profit premium may only encourage greenwashing.Footnote
22
The simulations of the extended agent-based model provide more nuanced results. Segmented interactions tend to support green investment, especially in conjunction with path-dependent cost efficiencies (see Figures 4(a)–(b) and 5(e)–(i) compared to Figure 3(e)–(i)). The segmentation shields sectors of green firms during the initial phase of production, which enables the former to benefit from lower costs over time. We can see that combining measures to increase cost efficiency and delay the effectiveness of mimicry has the strongest effect (Figure 6). This result holds across various network topologies and is thus independent of the degree and type of segmentation of the market in which firms interact (see discussion in Section 4.3). Consequently, measures that affect the barriers to greenwashing at an early stage can be effective, even if firms are eventually able to evade these hurdles and become more effective in mimicking green behavior. The simulations also demonstrate that longer penalties have a limited effect on the firm’s decision (Figure 7(c)–(d)). Consequently, curtailing the effectiveness of mimicry (i.e., improving transparency) can prove more impactful than longer or stronger penalties, since the latter may fail to encourage green investment in the first place.
Based on these results, we suggest several recommendations and demonstrate which sets of policies are especially effective in (a) curtailing greenwashing, (b) encouraging green investment and production by reducing costs, and (c) supporting segmentation and peer effects that encourage green production and discourage greenwashing. It is straightforward to see that only focusing on increasing the profit premium of green production can inadvertently incentivize greenwashing if mimicry is not curtailed. We further observed that while heavier penalties can deter greenwashing, in contrast to peer effects and market segmentation, they may fail to encourage green investment. These results suggest a trio-targeted policy approach that implements financial opportunities for green firms to reduce the cost of green production and investment, in addition to imposing measures that increase the cost and curtail opportunities to mimic green behavior, and strategies supporting segmentation and peer effects.
Measures to reduce the overall costs are tax incentives and subsidies, especially if the latter are applied during the early-adoption stage, which helps alleviate the burden of high upfront costs. R&D tax credits help reward firms for incremental improvements in green technology efficiency and reduce production costs over time, strongly supporting a green economy. These measures counteract the initially high costs and help reinforce green production through path dependency. In addition, they can be adjusted as green technology matures (e.g., policymakers can phase out subsidies gradually to avoid dependency while maintaining anti-mimicry measures) in the form of tiered subsidies that are linked to specific green targets.
Since our model has shown that improving transparency and exposure in conjunction with cost-reducing measures can prove highly efficient in reducing greenwashing viability (see also Nieto and Papathanassiou, Reference Nieto and Papathanassiou2025 for a similar result), policies at the larger institutional level, such as the UK’s Green Claims Code (CMA, 2021) or the EU’s recent changes to consumer law, transparency and verification requirements (EP, 2024a, b) are steps in the right direction. At the firm level, policymakers should emphasize transparency measures that require firms to disclose audited data on their environmental impact (such as the EU’s "Green claims" directiveFootnote 23 ) along with replacing self-certified labels with government-audited certificates based on standardized guidelines over penalties (see again EP, 2024a). On the consumer side, educating stakeholders via prebunking and ESG campaigns will increase public scrutiny and pressure. Detection of greenwashing can be further improved by using machine learning tools that uncover inconsistencies in ESG claims, help predict greenwashing behavior (e.g., see Zeng et al., Reference Zeng, Wang and Zeng2025) and generate more effective ESG rating systems (for an overview, see Huang et al., Reference Huang, Chung, Huang and Zhan2024).
In our model, the segmented interaction between firms supports green production via two channels: first, it localizes competition and thereby reduces competitive pressure on a firm by diminishing the number of firms with which it compares profits. Second, a firm’s decision is also affected by the prevalence of greenwashing among its neighbors. Consequently, green investment and production can benefit from sector-specific initiatives that promote industry coalitions of green companies (e.g., green supply chain partnerships) which will strengthen peer-pressure against greenwashing (e.g., Walmart’s Project Gigatron, Unilever’s Sustainable Sourcing Policy, Redwood Hyperion, Snowkap’s ESG Hub). These initiatives can be supported by geographically concentrated initiatives, which help leverage network effects and thus, simultaneously help reduce the cost of green production while increasing peer scrutiny (e.g., RegioGreenTex Hubs, STRING Megaregion, Greater Copenhagen’s green initiatives).
While the results of the dynamic models do not advocate for a new set of policies, we show the need for a more holistic approach to curtail greenwashing. Policies are efficient in reducing the incentives for greenwashing and mitigating the barriers to a green economy if they improve the benefit-to-cost ratio of green production over time while simultaneously curtailing the ability to mimic green investment. They can be additionally supported by measures that strengthen peer-pressure and market segmentation. Therefore, similar to Jaumotte et al. (Reference Jaumotte, Kim, Pienknagura and Schwerhoff2024), we advocate for an approach that combines early temporary subsidies with better regulatory and screening frameworks that focus on transparency, coupled with measures that promote industry coalitions and network effects.
6. Conclusion
In our simple dynamic model, firms choose between investing in green technology, continuing brown production, or only mimicking investment in green technology and production. We derived the equilibrium conditions for the model with random matching and showed which conditions can completely stifle green production either by discouraging any such production in the first place (i.e., most firms remain brown) or by encouraging spurious green investment in the form of greenwashing. We then extended the simpler model to fit a more realistic interaction environment with dynamic costs and efficiencies in mimicry. While localized interactions encourage the evolution of green firms, indicating that market segmentation can support green investment, we show that the simpler model with random matching offers good approximations of the equilibrium conditions in more complex setups. In addition, we show that increasing cost efficiencies can outperform increasing efficiencies in mimicry and create path dependencies that support green production.
Our study has some limitations. Firms are not forward-looking and base their strategies on a payoff comparison with other firms. Similarly, consumers are only aware of greenwashing based on the relative prevalence of green firms. In the future, a more comprehensive agent-based model can allow for less myopic firm interactions and explicitly model the reaction of consumers. In addition, we only briefly analyze the impact of networks and limit our study to a set of random networks. Future research can model the interaction using a broader range of networks based on empirical data across different sectors. We also ignore problems related to firms fearing being mislabeled as greenwashers and therefore, do not include the strategy of greenhushing, which can be added to the model in future iterations.
Acknowledgements
We thank the editor and the anonymous reviewers for their constructive comments, which helped us improve the manuscript. This paper benefited from discussions and comments from seminar participants at the: NED 2025—Nonlinear Economic Dynamics Workshop held in University of Napoli ”Federico II,” Italy, 3–5 June, 2025; Renaissance in Economics, 2nd International Conference, Manifesto for New Economy, held in the Department of Economics and Management—University of Florence (Italy) 5–6 June 2025; The Research Seminars at DISEI University of Florence. This paper benefited from the PRIN 2022 under the Italian Ministry of University and Research (MUR) Prot. 2022YMLS4T—“TEC—Tax Evasion and Corruption: theoretical models and empirical studies. A quantitative based approach for the Italian case.”
Funding statement
The authors did not receive support from any organization for the submitted work. The authors have no relevant financial or non-financial interests to disclose.
Competing interests
The authors have no conflicts of interest to declare that are relevant to the content of this article.