


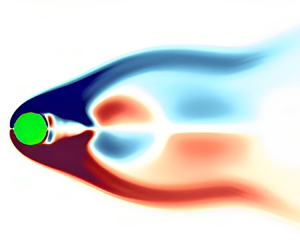



1. Introduction
The flow past a cylinder is a widely studied problem in fluid mechanics, both from the pragmatic and fundamental points of view. This benchmark problem provides essential information on several aspects of flow past a bluff body, such as boundary layer separation and vortex shedding, hydrodynamic drag and lift forces, transition among several flow states, etc (Zdravkovich & Bearman Reference Zdravkovich and Bearman1997). Above a critical Reynolds number (the ratio of the inertial to that of viscous forces), vortex-shedding from the cylinder results in the oscillatory variations of the fluid forces acting on it. The frequency of these fluctuations is related to the natural shedding frequency of the vortices, also called the Strouhal frequency ( $\,f_{st}$) (Gabbai & Benaroya Reference Gabbai and Benaroya2005). From an engineering perspective, understanding this phenomenon is essential as it is the underlying cause of the vortex-induced vibrations (VIVs) in many structures (Zhu, Zhang & Liu Reference Zhu, Zhang and Liu2019). The VIVs occur in both flexibly mounted and deformable bodies when the vortex shedding frequency lies in the close-by range of their natural frequency (Triantafyllou et al. Reference Triantafyllou, Bourguet, Dahl and Modarres-Sadeghi2016). These are characterized by synchronizing the wake with the body's motion, commonly called the ‘lock-in’ condition. The importance of studying the ‘lock-in’ phenomenon cannot be overstated due to its many applications in structural, offshore and thermal power engineering (Sarpkaya Reference Sarpkaya2004; Williamson & Govardhan Reference Williamson and Govardhan2004).
To gain insights into the fundamental mechanism underlying VIVs, researchers commonly employ a simplified model involving an elastically mounted rigid cylinder that is forced to oscillate either in the spanwise (cross-flow) or streamwise (in-line) direction of the incoming flow (Dahl et al. Reference Dahl, Hover, Triantafyllou, Dong and Karniadakis2007; Bearman Reference Bearman2011; Wang, Fan & Triantafyllou Reference Wang, Fan and Triantafyllou2021). This model allows for a controlled investigation of the relationship between various parameters, such as streaming velocity, oscillation amplitude and frequency. Previous studies have extensively focused on vertically forced oscillating cylinders (Bourguet, Karniadakis & Triantafyllou Reference Bourguet, Karniadakis and Triantafyllou2011; Wang et al. Reference Wang, Fan and Triantafyllou2021), and a comprehensive collection of these works can be found in Bourguet & Jacono (Reference Bourguet and Jacono2015). It should be noted that in this configuration, the formation of the wake and the phenomenon of vortex shedding differ significantly from those observed with a stationary cylinder (Griffin & Ramberg Reference Griffin and Ramberg1974; Anagnostopoulos Reference Anagnostopoulos2000b), consequently affecting the lift and drag forces acting on the cylinder (Bishop & Hassan Reference Bishop and Hassan1964b; Kumar et al. Reference Kumar, Lopez, Probst, Francisco, Askari and Yang2013).
The advent of the lock-in condition depends on the amplitude and frequency of the oscillations and leads to distinct changes in the wake topology. Numerous experimental (Bishop & Hassan Reference Bishop and Hassan1964a; Koopmann Reference Koopmann1967; Carberry, Sheridan & Rockwell Reference Carberry, Sheridan and Rockwell2001, Reference Carberry, Sheridan and Rockwell2005; Morse & Williamson Reference Morse and Williamson2009; Dahl et al. Reference Dahl, Hover, Triantafyllou and Oakley2010) and numerical (Karniadakis & Triantafyllou Reference Karniadakis and Triantafyllou1989; Blackburn & Henderson Reference Blackburn and Henderson1999; Anagnostopoulos Reference Anagnostopoulos2000a; Al-Jamal & Dalton Reference Al-Jamal and Dalton2004; Alam et al. Reference Alam, Raj, Khan, Kumar and Roy2021) investigations have been performed to understand and characterize the lock-in phenomenon for a wide range of Reynolds numbers (Jones Reference Jones1968), cylinder oscillation amplitude and frequency (Koopmann Reference Koopmann1967). Sufficient information is now available on various flow aspects such as different wake structures (e.g. ‘2S’-two single vortices, ‘2P’-two pairs of vortices and ’P+S’-a pair of vortices and a single vortex shed in one oscillation cycle) (Williamson & Roshko Reference Williamson and Roshko1988; Leontini et al. Reference Leontini, Stewart, Thompson and Hourigan2006), mechanisms of vorticity production (Blackburn & Henderson Reference Blackburn and Henderson1999) and hydrodynamic forces (Konstantinidis et al. Reference Konstantinidis, Zhao, Leontini, Lo Jacono and Sheridan2019) acting on the cylinder. Several works also aimed to map the boundary between the lock-in and no lock-in conditions on the cylinder oscillation amplitude and frequency space (Meneghini & Bearman Reference Meneghini and Bearman1995; Anagnostopoulos Reference Anagnostopoulos2000a; Nobari & Naderan Reference Nobari and Naderan2006).
However, to date, almost all of these studies have dealt with simple Newtonian fluids like water. On the other hand, most of the fluids encountered from our daily lives to several industrial settings exhibit various non-Newtonian behaviours, such as shear-thinning, shear-thickening, viscoplasticity, viscoelasticity, etc (Chhabra & Richardson Reference Chhabra and Richardson2011). Despite this, almost no study is available on how the complex rheological behaviour of a fluid could influence the flow dynamics past a forced oscillating cylinder, particularly the lock-in and no lock-in boundary and the associated vortex dynamics and hydrodynamic forces. Only very recently, Alam et al. (Reference Alam, Raj, Khan, Kumar and Roy2021) investigated the effect of the shear-thinning rheological behaviour and found a significant difference in the vortex structures depending upon the values of the cylinder oscillation amplitude and frequency. Viscoelasticity is another non-Newtonian behaviour often seen in many complex fluids (Bird, Armstrong & Hassager Reference Bird, Armstrong and Hassager1987). Adding a minute amount of solid polymers, even in parts per million (ppm) quantity, into a Newtonian solvent like water dramatically changes the flow behaviour compared with that seen in water alone due to the fluid viscoelasticity (Bird et al. Reference Bird, Armstrong and Hassager1987; Phan-Thien & Mai-Duy Reference Phan-Thien and Mai-Duy2013; Malkin & Isayev Reference Malkin and Isayev2022). This is because polymer molecules change their shape and undergo stretching and relaxation under flow deformation, which causes nonlinear elastic stresses in these fluids and, consequently, varying resistance to the flow. In the creeping flow regime and/or vanishingly small Reynolds number regime where the inertial forces are less dominant, the presence of these elastic stresses often results in the generation of purely elastic instability (McKinley, Pakdel & Öztekin Reference McKinley, Pakdel and Öztekin1996; Pakdel & McKinley Reference Pakdel and McKinley1996), which can transit to a more chaotic and fluctuating flow state on further increasing the fluid viscoelasticity, known as the elastic turbulence (Groisman & Steinberg Reference Groisman and Steinberg2000; Steinberg Reference Steinberg2021).
On the other hand, many experimental and numerical investigations have also attempted to explore the effect of this fluid viscoelasticity on the flow dynamics at finite Reynolds number regime, particularly for the problem of flow past a cylinder. It has been observed that adding polymer molecules into a Newtonian fluid causes suppression of wake instability for a wide range of Reynolds numbers. Cadot's (Reference Cadot2001) experimental observations of the cylinder wake for a dilute polymeric liquid revealed that the vortex shedding frequency is attenuated, the vortex formation length increases, and clear separation of vorticity is inhibited due to viscoelasticity. These findings were later confirmed by the two-dimensional simulations carried out by Oliveira (Reference Oliveira2001) and Sahin & Atalik (Reference Sahin and Atalik2019) for several viscoelastic fluid models and at various Reynolds numbers. Richter, Iaccarino & Shaqfeh (Reference Richter, Iaccarino and Shaqfeh2010) also got similar results to those of Oliveira (Reference Oliveira2001) at  $Re = 100$ using three-dimensional numerical simulations based on the FENE-P (finitely extensible nonlinear elastic-Peterlin) viscoelastic fluid model at low extensibility parameter. Furthermore, they observed the stabilizing effect of fluid viscoelasticity on the wake structures as the Reynolds number increases to 300.
In recent experiments conducted by Dey, Modarres-Sadeghi & Rothstein (Reference Dey, Modarres-Sadeghi and Rothstein2017), the inertialess flow of viscoelastic fluid past a flexible sheet at various inclination angles was investigated. Their findings revealed that the presence of viscoelastic stresses in the fluid induces periodic oscillations in the structure, without the occurrence of vortex shedding. Similar observations were made for a flexible cylinder immersed in the low Reynolds number flow of viscoelastic worm-like micellar solutions (Dey, Modarres-Sadeghi & Rothstein Reference Dey, Modarres-Sadeghi and Rothstein2018). Furthermore, in the subcritical Reynolds number regime (at  $Re = 19$), vortex shedding was observed for a flexibly mounted cylinder, leading to the lock-in phenomenon (Boersma et al. Reference Boersma, Zhao, Rothstein and Modarres-Sadeghi2021). Subsequently, Xiong et al. (Reference Xiong, Peng, Zhang and Yang2019) conducted numerical simulations of VIVs of a cylinder in viscoelastic fluids across a Reynolds number range of 30–500. Their simulations revealed significant modifications to the vortex pattern in the wake, with stratified and elongated vortices aligned in the flow direction. These changes were attributed to the elongation of polymer molecules in the fluid, resulting in an elongated recirculation region behind the cylinder. Moreover, they observed a suppression of vibration amplitudes and the dissipation of flow fluctuations due to the influence of fluid viscoelasticity.
However, there has been a notable absence of research exploring the impact of fluid viscoelasticity on the flow dynamics of a periodically forced oscillating cylinder in comparison with that available for simple Newtonian fluids. This study aims to address this knowledge gap in the literature. Specifically, we numerically investigate how introducing elasticity in a viscous fluid can modify the boundary between the lock-in and no lock-in regimes and the associated vortex dynamics in flows past a forced oscillating cylinder. These findings hold significance for various practical applications involving oscillating structures and viscous fluids. To achieve this, we utilize the Oldroyd-B constitutive model, which accurately represents the rheological behaviour of the viscoelastic fluid in our study. The choice of this model is justified by its simplicity, depending on a single conformation tensor and two parameters related to polymer concentration and relaxation time. Additionally, the Oldroyd-B model is derived from the simplest kinetic theory of polymers, assuming a dumbbell-like polymer molecule connected by a stretchable elastic spring (Shaqfeh & Khomami Reference Shaqfeh and Khomami2021; Sánchez et al. Reference Sánchez, Jovanović, Kumar, Morozov, Shankar, Subramanian and Wilson2022). It successfully mimics the rheological behaviour of constant shear viscosity viscoelastic fluids, such as the Boger fluid (James Reference James2009).
Furthermore, we employ dynamic mode decomposition (DMD), a widely used reduced-order modelling technique, to gain a visual and comprehensive understanding of the differences in flow dynamics between viscoelastic and Newtonian fluids, particularly within the lock-in and no lock-in regimes. By combining DMD with other analysis techniques, such as vorticity transport rate,  $Q$-criterion and polymer stretching analysis, we aim to enhance our understanding and visualization of the distinct flow behaviour exhibited by these two types of fluids in the present study.
2. Problem statement and governing equations
We investigate a two-dimensional, laminar and unbounded flow of viscoelastic fluid past a periodically forced oscillating cylinder of diameter  $d$, as shown schematically in figure 1(a). The cylinder is placed at the centre of a fictitious circular domain of viscoelastic fluid of diameter
 $100d$, wherein the fluid enters the domain with a uniform velocity of
 $U_{\infty }$. The cylinder is considered to be infinitely long in the
 $z$-direction so that no gradient exists in this direction, i.e.
 ${\partial {()}}/{\partial {z^{*}}}=0$ and also there is no flow in this direction, i.e.
 $u_{z}^{*}=0$. Furthermore, the cylinder is forcefully oscillated by applying a harmonic oscillation with an amplitude of
 $A^*$ (normalized) and a frequency of
 $f_{y}^{*}$ such that the normalized displacement
 $(Y)$ of the cylinder with respect to time
 $(t^{*})$ is given by
 $Y=A^*\,{\sin }(2{\rm \pi} f_{y}^{*}t^{*})$. Here, the cylinder oscillation amplitude and frequency are normalized with the cylinder diameter (
 $A^{*}={A}/{d}$) and the Strouhal frequency
 $(\,f_{st})$ of the stationary cylinder (
 $f^{*}={f_{y}^{*}}/{f_{st}}$), respectively. The incompressible flow of the viscoelastic fluid, whose rheological behaviour is mimicked with the Oldroyd-B constitutive equation (Oldroyd Reference Oldroyd1950), is governed by the following dimensionless equations:
(a) Flow schematic of the present problem, (b) a typical grid used in the present study (inset shows the zoomed view of the Mesh).

the continuity equation,
 \begin{equation} \boldsymbol{\nabla}\boldsymbol{\cdot}\boldsymbol{u}=0; \end{equation}
the Cauchy momentum equation,
 \begin{equation} \dfrac{\partial{\boldsymbol{u}}}{\partial{t}}+ \boldsymbol{u}\boldsymbol{\cdot}\boldsymbol{\nabla}{\boldsymbol{u}} =-\boldsymbol{\nabla} p + \frac{\beta}{Re}\boldsymbol{\nabla}\boldsymbol{\cdot}\boldsymbol{\tau_{s}}+\frac{(1-\beta)}{Wi}\frac{1}{Re}\boldsymbol{\nabla} \boldsymbol{\cdot}\boldsymbol{\tau}_{\boldsymbol{p}}; \end{equation}
the Oldroyd-B constitutive equation,
 \begin{equation} Wi \left( \frac{\partial \boldsymbol{\tau}_{\boldsymbol{p}}}{\partial t} + \boldsymbol{u} \boldsymbol{\cdot} \boldsymbol{\nabla} \boldsymbol{\tau}_{\boldsymbol{p}} - \boldsymbol{\tau}_{\boldsymbol{p}} \boldsymbol{\cdot} \boldsymbol{\nabla} \boldsymbol{u} - ( \boldsymbol{\nabla} \boldsymbol{u} )^{T} \boldsymbol{\cdot} \boldsymbol{\tau}_{\boldsymbol{p}} \right) + \boldsymbol{\tau}_{\boldsymbol{p}} = (1 - \beta) ( \boldsymbol{\nabla} \boldsymbol{u} + \boldsymbol{\nabla} \boldsymbol{u}^{T}). \end{equation}
The above equations have been non-dimensionalized using parameters  $d$,
 ${d}/U_{\infty }$,
 $U_{\infty }$,
 $\rho U_{\infty }^2$,
 ${\eta _{0}U_{\infty }}/{d}$ for length (
 $\boldsymbol {x}^{*}$), time (
 $t^{*}$), velocity (
 $\boldsymbol {u}^*$), pressure (
 $p^*$) and stress tensor (
 $\boldsymbol {\tau }^*$), respectively. Here,
 $\rho$ is the fluid density,
 $\eta _{0}$ is the zero-shear rate viscosity of the polymer solution given by the sum of the solvent viscosity, and the contribution of the polymer, i.e.
 $\eta _{0} = \eta _{s} +\eta _{p}$. The total deviatoric stress tensor in the fluid is a linear combination of the viscous term
 $\boldsymbol {\tau }_{\boldsymbol {s}}^{\boldsymbol {*}}$ (the solvent contribution) and the viscoelastic extra-stress term
 $\boldsymbol {\tau }_{\boldsymbol {p}}^{\boldsymbol {*}}$ (the polymer contribution). The Newtonian solvent contribution to the stress tensor is given by
 $\boldsymbol {\tau _{s}}^* = 2\eta _{s}\boldsymbol {D}^*$, where
 $\boldsymbol {D}^*$ is the rate of deformation tensor given by
 $\frac {1}{2} [ (\nabla ^*\boldsymbol {u}^*) + (\nabla ^*\boldsymbol {u}^* )^{{\rm T}}]$ and
 $\eta _{s}$ is the viscosity of the Newtonian solvent. It can be seen that the present flow is governed by three dimensionless numbers, namely,
 $(Re={\rho U_{\infty }d}/{\eta _{0}})$, Weissenberg number
 $(Wi={\lambda U_{\infty }}/{d})$ and polymer viscosity ratio
 $( \beta = {\eta _{s}}/{(\eta _{s}+\eta _{p})})$. Here,
 $\lambda$ is the characteristic relaxation time of polymer molecules. Apart from these, normalized cylinder oscillation amplitude
 $(A^{*})$ and frequency
 $(\,f^*)$ are two additional dimensionless numbers that will govern the present flow. The present investigation is carried out at a fixed value of
 $Re = 100$ and for a range of values of the cylinder oscillation amplitude and frequency as
 $0.4\leq A^{*} \leq 1.2$ and
 $0.6\leq f^{*} \leq 1.2$, respectively. The extent of fluid viscoelasticity in the present simulations is controlled by varying the Weissenberg number and polymer viscosity ratio in the ranges of
 $0\leq Wi \leq 2$ and
 $1\leq \beta \leq 0.5$, respectively. These ranges of parameters also include the limiting case of Newtonian fluids
 $(Wi = 0,\,\,\beta = 1)$ in order to directly compare the flow dynamics with viscoelastic fluids under identical conditions.
The hydrodynamic drag ( $C_{D}$) and lift coefficients (
 $C_{L}$) per unit length of the cylinder are calculated from the following relations:
 $$\begin{gather} C_{D} = \frac{2}{\rho U_{\infty}^{2} d} \int_{s}[(-p^*\boldsymbol{\delta}+\boldsymbol{\tau}_{\boldsymbol{s}}^{\boldsymbol{*}} +\boldsymbol{\tau}_{\boldsymbol{p}}^{\boldsymbol{*}})\boldsymbol{\cdot}\boldsymbol{n}_{\boldsymbol{s}}]_{x}\,{\rm d}S, \end{gather}$$
 $$\begin{gather}C_{L} = \frac{2}{\rho U_{\infty}^{2}d} \int_{s}[(-p^*\boldsymbol{\delta}+\boldsymbol{\tau}_{\boldsymbol{s}}^{\boldsymbol{*}} +\boldsymbol{\tau}_{\boldsymbol{p}}^{\boldsymbol{*}})\boldsymbol{\cdot}\boldsymbol{n}_{\boldsymbol{s}}]_{y}\,{\rm d}S. \end{gather}$$
Where  $\boldsymbol {n}_{\boldsymbol {s}}$ is the outward unit normal vector drawn on the cylinder surface and S is the cylinder surface area.
3. Numerical method and validation
A detailed description of the numerical method employed in the present study is available elsewhere (Khan, Sasmal & Chhabra Reference Khan, Sasmal and Chhabra2020; Hamid, Sasmal & Chhabra Reference Hamid, Sasmal and Chhabra2022). However, a summary of the essential techniques utilized in this study to discretize different terms of the governing equations is presented here. Broadly, we have used the finite volume method based open-source code OpenFOAM (Weller et al. Reference Weller, Tabor, Jasak and Fureby1998) coupled with RheoTool (Pimenta & Alves Reference Pimenta and Alves2016) to solve the governing mass, momentum and Oldroyd-B viscoelastic constitutive equations. To discretize the advective terms in the momentum equation, the CUBISTA (convergent and universally bounded interpolation scheme for treatment of advection) scheme (Alves, Oliveira & Pinho Reference Alves, Oliveira and Pinho2003) has been employed. The Gauss linear orthogonal interpolation scheme was used to discretize all the diffusion terms of the governing equations. The discretization of the time derivatives was carried out using the Euler scheme. The linear systems of the pressure and velocity fields were solved using the preconditioned conjugate solver with diagonal-based incomplete Cholesky preconditioner and the stress fields using the preconditioned biconjugate gradient solver with diagonal-based incomplete LU precondition. The SIMPLE (semi-implicit method for pressure linked equations) algorithm was used to attain the pressure-velocity coupling. The present study used an automatic mesh motion scheme (dynamicFvMesh) to treat the fluid–structure interaction. In this scheme, the mesh at the outer boundary was fixed, but the mesh near the cylinder was deformed due to the motion of the cylinder. Furthermore, the log-conformation tensor formulation was used to ensure the positive definiteness of the polymeric conformation tensor (Afonso et al. Reference Afonso, Oliveira, Pinho and Alves2009). The relative tolerance level was set to  $10^{-10}$ for all the fields. To maintain the stability and accuracy of the present numerical solution, the Courant number (ratio of the time step size to the characteristic convective time scale) was kept at
 $Co<0.5$ in all our simulations.
An optimum grid density is always imperative in any computational fluid dynamics study, which on the one hand, will not warrant excessive computational resources and, on the other hand, will provide results with sufficient accuracy. Therefore, in the present study, the standard grid independence study procedure was followed by making three different grids consisting of regular hexahedral elements, namely, G1, G2 and G3. Table 1 presents the details of these grids used to carry out this test. Figure 2 shows the temporal variations of the drag ( $C_{D}$) and lift (
 $C_{L}$) coefficients at extreme values of cylinder oscillation parameters for two oscillation cycles. After carefully inspecting the results obtained with different grid densities, G2 (see figure 1b) was chosen for the present study as the results for G2 and G3 show a nearly perfect match with each other. The deviations in the average drag coefficient (
 $C_{D,avg}$) and the root-mean-square values of the lift coefficient (
 $C_{L,rms}$) were 2.74 % and 1.41 %, respectively, between these two grid densities. Furthermore, a time step size of
 $\Delta t=0.0001({d}/{U_{\infty }})$ was selected to carry out all the present simulations after performing a rigorous time independence study, likewise, the grid independence study.
Details of different grids used in the grid independence study. Here,  $N_{r}$ and
 $N_{c}$ are the number of grid points in the radial and circumferential directions, respectively. Here,
 $N$ is the total number of hexahedral cells in the whole computational domain, and
 $\Delta S$= is the minimum cell area.

(a) Temporal variations of the drag ( $C_{D}$) and (b) lift (
 $C_{L}$) coefficients for three different grid densities. The following values of the parameters are chosen to carry out the grid independence study:
 $Re = 100$;
 $Wi = 2$;
 $\beta = 0.5$;
 $A^{*}=1.2$;
 $f^{*} = 1.2$.

Extensive validation studies have also been carried out to establish the accuracy and reliability of the present numerical set-up. Our earlier study (Hamid et al. Reference Hamid, Sasmal and Chhabra2022) already presented an extensive validation for the steady flow past a stationary cylinder up to  $Re = 40$. For an unsteady flow of viscoelastic Oldroyd-B fluid, the results obtained with the present numerical set-up have further been validated with the study of Peng et al. (Reference Peng, Li, Xiong, Xu and Yu2021) for a stationary cylinder. Table 2 compares the time-averaged drag coefficient and Strouhal number variations with the Weissenberg number between the two studies. A good correspondence can be seen between the two results with a maximum deviation well below 5 %. Furthermore, we have also extensively validated the present numerical settings for the case of an oscillating cylinder in simple Newtonian fluids. While figure 3 compares the temporal variation of the drag coefficient with the results of Alam et al. (Reference Alam, Raj, Khan, Kumar and Roy2021), table 3 compares its time-averaged values over each cycle. Once again, a very good agreement can be seen between the two results with a maximum deviation of 3.96 % in comparing the time-averaged values.
Comparison of the time-averaged drag coefficient ( $\overline {C_{D}}$) and Strouhal frequency (
 $St$) in the case of a stationary cylinder with Peng et al. (Reference Peng, Li, Xiong, Xu and Yu2021) at
 $Re = 100$ and
 $\beta = 0.1$.

Comparison of the temporal variation of the drag coefficient ( $C_{D}$) between the present results and that of Alam et al. (Reference Alam, Raj, Khan, Kumar and Roy2021) for an oscillating cylinder in Newtonian fluids.

Comparison of the time-averaged drag coefficient  $C_{D,avg}$ between the present results and that of Alam et al. (Reference Alam, Raj, Khan, Kumar and Roy2021) at different combinations of cylinder oscillation amplitude and frequency.

Finally, the following boundary conditions were employed to facilitate the present simulations. At the inlet,  $u_{x}=1$ and
 $u_{y}=0$ are used. Furthermore, the pressure gradient and the extra stresses due to the polymeric contribution are set to zero at this boundary. At the outlet, the pressure is set to zero, and the Neumann boundary condition is used for the rest of the variables. At the cylinder surface, the standard no-slip boundary condition and a zero gradient for the pressure are applied. The polymeric stresses are extrapolated linearly onto this surface. The initial values of velocity, pressure and stress fields in the whole computational domain are set to zero.
The DMD analysis has been carried out using the algorithm proposed by Schmid (Reference Schmid2011), which is also detailed in our recent study (Hamid et al. Reference Hamid, Sasmal and Chhabra2022). Briefly, temporally equispaced (with 0.1 s interval) snapshots (a total of  $N = 501$) of the vorticity field in the unsteady periodic regime (
 $t\geq 500$) are vectorized and assembled to form a matrix
 $S_{1}^{N}=\{s_{j}\}_{j=1}^N$. The DMD assumes a linear map
 $\boldsymbol {M}$ that connects the consecutive vorticity fields as
 $s_{j+1}=\boldsymbol {M}s_{j}$. Therefore, the system can be arranged as
 $S_{2}^{N}=\boldsymbol {M}S_{1}^{N-1}= \boldsymbol {C}S_{1}^{N-1}+ \boldsymbol {r}$. Here,
 $\boldsymbol {r}$ is the residual, which is minimized to compute the eigenvalues (Ritz values denoted by
 $\lambda _{j}$) and eigenvectors (DMD modes denoted by
 $\phi _{j}$) of
 $\boldsymbol {C}$ by the singular value decomposition. The DMD modes capture the coherent spatial features of the flow field, whereas the Ritz values (
 $\lambda _{j}$) provide information about the growth rate (
 $\sigma _{j} = {\rm Re} (\log (\lambda _{j}/t))$) and frequency (
 $St_{j} = {\rm Im} (\log (\lambda _{j})/2{\rm \pi} t)$) of these modes. The energy contribution of each mode is quantified using the mode amplitude
 $b_{j}$, which is obtained by
 $\boldsymbol {b}=\varPhi ^{{\dagger} }s_{1}$. Here,
 $\boldsymbol {b}$ is the matrix of amplitude vectors,
 $\varPhi ^{{\dagger} }$ denotes the Moore–Penrose pseudoinverse of mode matrix, and
 $s_{1}$ is the initial snapshot vector.
4. Results and discussion
We initiate the discussion by comparing the lock-in and no lock-in states between viscoelastic and Newtonian fluids, focusing on specific combinations of  $A^{*}$ and
 $f^{*}$. We provide a detailed illustration of how the associated vortex dynamics differ in viscoelastic and Newtonian fluids for these selected combinations. We analyse vorticity transport,
 $Q$-criterion and polymeric stretching to investigate the underlying reasons for the discrepancies in vortex dynamics between the two fluids. Furthermore, we employ the DMD analysis in two scenarios: (i) when both the Newtonian and viscoelastic fluids exhibit the lock-in condition (
 $A^{*}=0.4$ and
 $f^{*}=0.8$); and (ii) when the viscoelastic fluid deviates from the Newtonian fluid (no lock-in) and subsequently exhibits the lock-in condition (
 $A^{*}=0.4$ and
 $f^{*}=0.6$). In this study, we have selected seven sets of
 $A^{*}$ and
 $f^{*}$ based on the work of Alam et al. (Reference Alam, Raj, Khan, Kumar and Roy2021) to investigate the influence of fluid viscoelasticity on the lock-in and no lock-in behaviours.
4.1. Determination of lock-in and no lock-in states
The determination of the lock-in and no lock-in states in the current flow system is based on the criterion proposed by Kumar, Navrose & Mittal (Reference Kumar, Navrose and Mittal2016), which was also utilized by Alam et al. (Reference Alam, Raj, Khan, Kumar and Roy2021) in their study. These authors compiled and examined various criteria put forth by previous researchers, thoroughly discussing the discrepancies. In this study, we adopt the subsequent criterion for the lock-in state in the current flow system: (i) the dominant peak in the power spectrum of the lift coefficient corresponds to the cylinder oscillation frequency ( $f^{*}_{y}$); (ii) if any additional peaks are present in the power spectrum, they must be integer multiples of
 $f^{*}_{y}$. This criterion was further validated by determining the lock-in region for both forced and free vibrating cylinders, as documented in the literature (Kumar et al. Reference Kumar, Navrose and Mittal2016).
First, the non-dimensional frequency–amplitude map exhibiting the lock-in and no lock-in behaviours of Newtonian and viscoelastic fluids is presented in figure 4. From this plot, one can clearly observe that at a combination of  $A^{*}=0.4$ and
 $f^{*} = 0.6$, viscoelastic fluid (
 $Wi = 2$ and
 $\beta = 0.5$) exhibits the lock-in state, whereas Newtonian fluid is in the no lock-in state. However, as the value of
 $f^{*}$ increases to 0.8 or 1 at the same value of
 $A^{*}=0.4$, both fluids display the lock-in behaviour. On further increasing
 $f^{*}$ to 1.2, both fluids move to the no lock-in zone. This suggests a stark difference in the synchronization behaviour of the wake structures for the value of
 $f^{*} < 0.8$ between viscoelastic and Newtonian fluids. This is clear from the power spectral density (PSD) plot of the temporal variation of the lift coefficient presented in figure 5(a–d). As can be seen, for
 $f^{*}< 1$ (figure 5a,b, which correspond to points 1 and 2 in the map presented in figure 4), the viscoelastic fluid in both cases has a dominant peak at the cylinder oscillation frequency and another peak at its integer multiple, thereby fulfilling the criteria of the lock-in condition. Contrary to this, at a low frequency of
 $f^{*}=0.6$, the power spectrum of the lift coefficient of Newtonian fluids has several peaks at non-integer multiples of the cylinder oscillation frequency, indicating a no lock-in behaviour of the wake. For
 $f^{*}> 1$ (figure 4d), the PSD plots of both fluids are much similar.
A map illustrating the presence of lock-in and no lock-in states for viscoelastic and Newtonian fluids at selected points in the non-dimensional cylinder oscillation amplitude ( $A^{*}$) and frequency (
 $f^*$) plane. The map focuses on the extreme case of the viscoelastic fluid with
 $Wi = 2$ and
 $\beta = 0.5$.

Power spectral density plots of the lift coefficient at a fixed value of the cylinder oscillation amplitude of  $A^{*}=0.4$ and different values of the cylinder oscillation frequency, namely, (a)
 $f^{*}=0.6$, (b)
 $f^{*}=0.8$, (c)
 $f^{*}=1$, (d)
 $f^{*}=1.2$, both for Newtonian and viscoelastic fluids with
 $Wi = 2$ and
 $\beta = 0.5$.

On the other hand, at a fixed frequency of  $f^{*}=1$, as the oscillation amplitude increases from
 $A^{*}=0.4$ to
 $A^{*}=1.2$, both Newtonian and viscoelastic fluids stay in the lock-in state. Figure 6(a–d) shows the PSD plots corresponding to these points, where all of them have major peaks at the cylinder oscillation frequency, and the other minor peaks are its superharmonics.
Power spectral density plots of the lift coefficient at a fixed value of the cylinder oscillation frequency of  $f^{*}=1$ and different values of the cylinder oscillation amplitude, namely, (a)
 $A^{*}=0.4$, (b)
 $A^{*}=0.6$, (c)
 $A^{*}=1$, (d)
 $A^{*}=1.2$, both for Newtonian and viscoelastic fluids with
 $Wi = 2$ and
 $\beta = 0.5$.

To thoroughly investigate the effect of viscoelasticity on the lock-in state, we particularly focus on point 1 ( $f^{*}= 0.6$ and
 $A^{*}= 0.4$) as shown in figure 4. At this point, the viscoelastic fluid with
 $Wi = 2$ and
 $\beta = 0.5$ exhibits a significant deviation from the Newtonian fluid. To analyse the impact of fluid viscoelasticity on the lock-in state, we introduce viscoelastic behaviour gradually into the Newtonian fluid while keeping the oscillation parameters at fixed values. The PSD plots in figure 7(a) demonstrate that as the Weissenberg number is increased at a fixed value of
 $\beta = 0.5$, the dominant peak in the PSD spectrum shifts towards the cylinder oscillation frequency. Meanwhile, the less prominent peaks either diminish or appear as integer multiples of the dominant frequency, indicating the establishment of the lock-in state. This behaviour can be attributed to the increase in the relaxation time of the polymer molecules. This is because the Weissenberg number is increased here by increasing the polymer relaxation time. As a result, they remain stretched for a longer time within the flow, and the elastic stresses transmitted through these polymer chains sustain the inertial effects generated by the cylinder motion, which will be explained in detail later with the help of other postprocessing techniques such as the
 $Q$-criterion and polymer stretching. The consequence is the synchronization of the wake with the cylinder motion in the viscoelastic fluid, whereas, in the Newtonian fluid, the wake is dominated by the stationary shedding frequency. A similar trend is also observed in figure 7(b), where the extent of fluid viscoelasticity is gradually increased by varying the polymer contribution from 0 % (Newtonian) to 50 % (
 $\beta = 0.5$) while maintaining a fixed Weissenberg number of 2.
Power spectral density plots of the lift coefficient at  $A^{*}=0.4$ and
 $f^{*}=0.6$ both for Newtonian and viscoelastic fluids. (a) Effect of the Weissenberg number at a fixed value of
 $\beta = 0.5$. (b) Effect of the polymer viscosity ratio at a fixed value of
 $Wi = 2$.

4.2. Effect of fluid viscoelasticity on wake structures
We now analyse the effect of fluid viscoelasticity on the wake generated past the oscillating cylinder. To do so, we first vary the value of  $Wi$ at a constant
 $\beta$ of
 $0.5$. Later, we vary
 $\beta$, keeping the
 $Wi$ number fixed at 2. Figure 8 represents the changes in the wake as we vary
 $f^*$ and
 $Wi$ at fixed values of
 $A^{*} = 0.4$ and
 $\beta = 0.5$. For the Newtonian fluid at
 $f^* =0.6$, it is obvious that the wake is in the non-synchronized state, with a pair of vortices (‘2P’) being shed in one oscillation cycle. On moving towards the viscoelastic fluids, at a low value of
 $Wi$ number of 0.1, the wake is not much different from that seen in the Newtonian fluid due to a low effect of fluid viscoelasticity. However, as we increase the Weissenberg number (i.e. increase in the polymer relaxation time) to 1, a remarkable change in the wake structure can be seen. The two same-signed vortices coalesce (which will also be seen from the
 $Q$-criterion discussed in the later section), resulting in a Kármán-type wake street with a ‘2S’ configuration. The shed vortices align along the wake centreline and move in a synchronized fashion. Increasing the
 $Wi$ number further to 2 does not affect the synchronization state of the wake, and it continues to be in the lock-in state. This effect is similar to that seen in the Newtonian fluid when
 $f^*$ increases from 0.6 to 0.8. Williamson & Roshko (Reference Williamson and Roshko1988) showed that four vorticity regions are formed in a given cycle for an oscillating cylinder. Below the critical lock-in frequency, same-sign vortices move away from each other and then pair with an opposite-sign vortex to form a ‘2P’ vortex street. As the frequency increases to 0.8, the same-sign vortices amalgamate to form a ‘2S’ wake structure. On further moving to higher oscillation frequencies, i.e.
 $f^{*}=1$, both fluids exhibit the lock-in behaviour (see figure 5 for the corresponding PSD plots) with a ‘2S’ mode of vortex shedding. However, the vortex alignment is still notably different between the two fluids. While for a Newtonian fluid, the wake at
 $f^{*}=0.8$ resembles the von Kármán vortex street, the vortices in the far wake organize into rows for an Oldroyd-B viscoelastic fluid. Moreover, this trend of a viscoelastic fluid is replicated by the Newtonian fluid at
 $f^{*}=1$, although with a higher rate of vortex dissipation. At this point (
 $f^{*}=1$), with the increase in the
 $Wi$ number, the row formation point moves closer to the cylinder. Finally, at
 $Wi = 2$, the vortices are shed into two rows from the near wake of the cylinder itself. Here, the vortices display substantial stretching in the downstream direction before being shed with higher lateral spacing. A similar trend is observed at
 $f^{*}=1.2$ where the non-synchronized vortices advect behind the cylinder with a ‘2P’ configuration regardless of the fluid type. However, the Oldroyd-B vortices are noticeably stronger than the Newtonian ones, and the narrow stretches interconnecting them also become more prominent.
Vortex structures in Newtonian and viscoelastic fluids at a fixed value of  $A^* = 0.4$ and varying values of
 $f^{*}$ corresponding to the points 1, 2, 3 and 4 in the map as shown in figure 4. Here, the polymer viscosity ratio is fixed at
 $\beta = 0.5$, while the Weissenberg number is varied from 0 (Newtonian) to 2.

The effect of increasing cylinder oscillation amplitude at a fixed frequency is illustrated in figure 9. The wake remains in the ‘2S’ mode for Newtonian fluids as we increase the value of  $A^*$ from 0.4 to 1. Finally, it shifts into a synchronized ‘P+S’ wake state, as reported by many earlier studies as well (Williamson & Roshko Reference Williamson and Roshko1988; Leontini et al. Reference Leontini, Stewart, Thompson and Hourigan2006). However, a notable difference is again seen in the vortex dynamics for an Oldroyd-B fluid. At
 $A^* = 0.4$ and 0.6, the vortices are shed with a ‘2S’ mode but in parallel rows from the near wake itself, whereas this partition occurs at some distance for a Newtonian fluid. With the further increment in the amplitude to
 $A^{*}=1$, a marked difference appears in the wake topology. While for a Newtonian fluid, the wake still remains in the ‘2S’ mode, it shifts to a ‘2P’ mode for a viscoelastic fluid, for instance, see the results for
 $Wi = 2$ and
 $A^* = 1$ or
 $1.2$. This is a significant deviation from the Newtonian behaviour where only ‘2S’ or ‘P+S’ modes have been observed in the primary synchronization region at multiple Reynolds numbers in earlier studies (Leontini et al. Reference Leontini, Stewart, Thompson and Hourigan2006). A possible explanation for this, as also provided by Govardhan & Williamson (Reference Govardhan and Williamson2000), is that the single vortices in the near wake split due to excess strain, forming a pair of vortices. At
 $Wi = 1$ and
 $A^* = 1$ or
 $1.2$, this splitting effect is more obvious for viscoelastic fluids, where it can be seen that the single vortices start to divide into two regions. This results in a ‘2P’ wake as we increase the Weissenberg number to 2 at the same oscillation parameters. Since polymer molecules undergo considerable stretching in the cylinder vicinity in a viscoelastic fluid, the excess straining effect enhances the breaking of the vortices at lower cylinder oscillation amplitude and frequency values than the Newtonian fluid.
Vortex structures in Newtonian and viscoelastic fluids at a fixed value of  $f^* = 1$ and varying values of
 $A^{*}$ corresponding to the points 3, 5, 6 and 7 in the map as shown in figure 4. Here, the polymer viscosity ratio is fixed at
 $\beta = 0.5$, while the Weissenberg number is varied from 0 (Newtonian) to 2.

Moving further, figures 10 and 11 show the effect of changing the polymer viscosity ratio on the wake at a constant  $Wi$ number. From figure 10, it can be seen that a decreasing
 $\beta$, i.e. increasing polymer concentration in the fluid, has a similar impact as that of increasing the
 $Wi$ number in the wake irrespective of the cylinder oscillation frequency. Similarly, as we increase
 $A^*$ and decrease
 $\beta$ (figure 11), the same trend is again observed as earlier seen in figure 9. Therefore, inducing viscoelasticity in the fluid either by increasing the Weissenberg number (or increasing the polymer relaxation time) or decreasing the polymer viscosity ratio (or increasing the polymer concentration) has the same impact on the wake topology.
Vortex structures in Newtonian and viscoelastic fluids at a fixed value of  $A^* = 0.4$ and varying values of
 $f^{*}$ corresponding to the points 3, 5, 6 and 7 in the map as shown in figure 4. Here, the Weissenberg number is fixed at
 $Wi = 2$, while the polymer viscosity ratio is varied from 1 (Newtonian) to 0.5.

Vortex structures in Newtonian and viscoelastic fluids at a fixed value of  $f^* = 1$ and varying values of
 $A^{*}$ corresponding to the points 3, 5, 6 and 7 in the map as shown in figure 4. Here, the Weissenberg number is fixed at
 $Wi = 2$, while the polymer viscosity ratio is varied from 1 (Newtonian) to 0.5.

4.3. Dynamic mode decomposition analysis
Fluid flows, including the one under investigation in this study, are characterized by their inherent flow complexity. However, despite this complexity, the transport processes in these flows are still majorly governed by organized motions of fluid elements possessing spatial and temporal coherence (Kutz et al. Reference Kutz, Brunton, Brunton and Proctor2016). Recognizing and extracting these features, also known as coherent structures, from the trivial background flow is crucial for better understanding the flow system and developing effective flow models. Like stability analyses, data-driven approaches, such as proper orthogonal decomposition and DMD, offer valuable tools for approximating these coherent structures in terms of spatial and temporal modes. By applying these analyses, we can gain valuable insights into the evolution and interactions of the underlying flow features, enhancing our understanding of the flow dynamics.
With this aim, we now utilize the DMD technique to analyse the differences in the coherent flow structures of both fluids at  $f^{*}=0.6$, where they exhibit different synchronization behaviour. We also perform the DMD analysis at
 $f^{*}=0.8$, where both fluids are in the lock-in state. The DMD extracts the underlying structures of dynamic relevance from the global flow field data and their associated frequencies prevalent in the domain. This will aid in visualizing the competition between the cylinder oscillation and the natural vortex shedding frequencies in the wake. First, the Ritz values of all the cases under consideration are plotted in figure 12(a). Irrespective of the fluid type and oscillation parameters, most of these neutrally stable values are clustered around the unit circle
 $|\lambda _j|=1$ (zoomed view shown using a dashed line) with a few strongly damped values lying inside it. It denotes the convergence towards a linear representation of the nonlinear flow. Also, these values are symmetrical with respect to the real axis due to real flow field data. In our analysis, the sorting of dominant modes is done based on the amplitude (
 $b_j$), which is determined by projecting the modes back to the original data sequence. The modes with larger projections are more significant and are depicted by larger sizes in figure 12(a). The largest circle shows the mode with zero imaginary Ritz value for all fluids and captures the mean vorticity field. For other modes, the normalized magnitudes are plotted against the associated frequencies (
 $St_{j}$) in figure 12(b). This plot shows that only a few modes capture the maximum flow energy in all four scenarios, which is expected as the flow is periodic. For the lock-in case (i.e.
 $f^{*}=0.8$), both Oldroyd-B and Newtonian fluids have a pronounced peak at the cylinder oscillation frequency. The rest of the frequencies are higher harmonics of this frequency and contribute negligibly to the data sequence as reflected from their amplitudes. Moreover, the natural vortex shedding frequency (
 $\,f_{st}$) of both fluids does not appear in this spectrum. It further confirms that the vortex shedding synchronizes with the cylinder oscillation in the lock-in condition. Therefore, the cylinder oscillation dominates while the natural shedding frequency perishes in the flow field.
(a) The Ritz values ( $\lambda _{j}$) both for Newtonian and viscoelastic fluids at
 $A^{*}=0.4$ and different values of
 $f^{*}$, (the dashed line represents the unit circle
 $|\lambda _{j}| = 1$). (b) The normalized magnitudes corresponding to the most dominant modes (excluding the mean mode) are plotted against the non-dimensional frequency of each mode. Fundamental frequencies in the fluid flow are denoted by the dashed lines. The rest of the frequencies are higher harmonics of these fundamental frequencies in the flow.

Figure 13 shows the real parts of the DMD modes corresponding to the mean flow and the cylinder oscillation frequency both for Newtonian and viscoelastic fluids. In both fluids, the mean mode ( $St_{j}=0$) comprises two shear layer-type structures arising behind the cylinder and extending symmetrically into the wake. However, these structures are more prominent for a viscoelastic fluid and extend farther into the wake. Moreover, compared with the stationary cylinder case, these structures are again larger in the streamwise extent for both fluids; see the results of Hamid et al. (Reference Hamid, Sasmal and Chhabra2022). This is because the added acceleration effect in the oscillating cylinder case results in higher vorticity flux from the cylinder wall than in the stationary cylinder case. Mode 1 provides typical structures to capture the vortex-shedding phenomenon and its associated frequency. For both fluids, the bubble-like structures convect in an antisymmetric fashion (with respect to the vertical axis) away from the cylinder with its oscillation frequency. However, the two fluids have a marked difference in the far wake structures of the two fluids.
Visualization of the DMD modes of the vorticity fields both for Newtonian and viscoelastic fluids ( $Wi = 2, \beta = 0.5$) at the lock-in state in the non-dimensional amplitude–frequency plane (
 $A^{*}=0.4$ and
 $f^{*}=0.8$): (a,c) mean mode; (b,d) mode 1.

Contrary to the flow of viscoelastic fluids past a stationary cylinder (Hamid et al. Reference Hamid, Sasmal and Chhabra2022) where the strength of these structures is higher than Newtonian fluids, the opposite trend is observed here. This is because, in a Newtonian fluid, single vortices (‘S’) sustain to a greater distance in the wake than in a viscoelastic fluid. In this fluid, the vortex street is partitioned into two rows in the far wake (figure 8), which is successfully captured by the DMD structures. Furthermore, in both cases, the distance between the consecutive bubble-like structures remains constant after moving away in the downstream direction. However, this gap is a little bit less for viscoelastic fluids. Figure 14 depicts the modes for Newtonian no lock-in and viscoelastic lock-in cases at  $A^{*}=0.4$ and
 $f^{*}=0.6$. As seen before, in the lock-in condition, the DMD extracts only one dominant frequency in viscoelastic flows, i.e. the cylinder oscillation frequency (figure 12b), and the other low magnitude frequencies are its higher harmonics. However, for the Newtonian no lock-in case, two fundamental frequencies are visible due to the non-synchronization in the vortex formation. Hence, from the flow field data, it is obvious that these two frequencies, i.e. the cylinder oscillation frequency and the vortex shedding frequency, compete in the flow domain. The associated flow structures at these frequencies are visualized in figure 14, where the mean mode for both fluids has similar structures as explained in the earlier case, with the extent of viscoelastic DMD structures being more in the downstream direction. Moving to mode 1 in a viscoelastic fluid, again, the same vortex-shedding structures appear; however, these resemble the DMD structures of the Newtonian lock-in case (figure 13b), albeit more concentrated due to the viscoelastic effect. This observation of similarity in the DMD structures is also reinforced by the vortex topology at two points in figure 8, see the results at
 $A^{*}=0.4$ and
 $f^{*}=0.6$, and
 $A^{*}=0.4$ and
 $f^{*}=0.8$. It also suggests that inducing viscoelasticity in a Newtonian fluid expedites the transition to the lock-in region for a transversely oscillating cylinder. Now looking at the DMD mode 1 for a Newtonian fluid, which corresponds to the cylinder oscillation frequency, the concentrated structures in the cylinder vicinity signify the dominance of forced oscillations in the near wake zone. These structures fade as we move downstream of the cylinder. Competing with this frequency, the antisymmetric structures in mode 2 move with the natural shedding frequency and are more stretched in the spanwise direction than the lock-in vortex shedding structures, figure 14(c).
Visualization of the DMD modes of the vorticity field both for Newtonian (no lock-in) and viscoelastic ( $Wi = 2$,
 $\beta = 0.5$, lock-in) fluids at the deviation point in the non-dimensional amplitude–frequency plane (
 $A^{*}=0.4$ and
 $f^{*}=0.6$): (a,d) mean mode; (b,e) mode 1; (c) mode 2.

4.4. Vorticity transport, polymer stretching and  $Q$-criterion

The vorticity in the present flow field is generated only due to the interaction between the fluid and the cylinder surface, as the flow is incompressible in nature. Therefore, the vorticity evolves locally near the cylinder and propagates into the flow field by advection and diffusion. The governing equation for the vorticity transport (VT) obtained after taking the curl of the momentum equation is given as (Kundu, Cohen & Dowling Reference Kundu, Cohen and Dowling2015)
 \begin{equation} \dfrac{\partial{\boldsymbol{\omega}^{*}}}{\partial{t}^{*}}+ \nabla^{*} \times (\boldsymbol{u}^{*}\boldsymbol{\cdot}\nabla^{*}{\boldsymbol{u}^{*}}) = \nabla^{*} \times \left(\frac{{\nabla^{*}}\boldsymbol{\cdot}\boldsymbol{\tau}^{*}}{\rho}\right). \end{equation}
For Newtonian fluids, the stress is only due to  $\boldsymbol {\tau }_{s}^{*}$, and hence, the VT equation becomes as follows:
 \begin{equation} \dfrac{\partial\boldsymbol{\omega}^{*}}{\partial t^{*}}+ \boldsymbol{u}^{*}\boldsymbol{\cdot}\nabla^{*} \boldsymbol{\omega}^{*} = \nu {\nabla^{2}}^{*} \boldsymbol{\omega}^{*}, \end{equation}
where  $\nu (= {\eta _{s}}/{\rho })$ is the kinematic viscosity of the fluid and
 ${{\rm D}{\boldsymbol {\omega }^{*}}}/{{\rm D}{t}^{*}}={\partial {\boldsymbol {\omega }^{*}}}/{\partial {t}^{*}}+ \boldsymbol {u}^{*}\boldsymbol {\cdot }\nabla ^{*}{\boldsymbol {\omega }^{*}}$ is the vorticity transport rate (VTR). On the contrary, the polymer molecules suspended in the Newtonian solvent in viscoelastic fluids also contribute to the overall stress field. Hence, the VT equation for an Oldroyd-B viscoelastic fluid becomes as follows (Comminal et al. Reference Comminal, Hattel, Alves and Spangenberg2016):
 \begin{equation} \dfrac{\partial{\boldsymbol{\omega}^{*}}}{\partial{t}^{*}}+ \boldsymbol{u}^{*}\boldsymbol{\cdot}\nabla^{*}{\boldsymbol{\omega}^{*}} = \nu {\nabla^{2}}^{*}{\boldsymbol{\omega}^{*}} + \nabla^{*} \times \left(\frac{{\nabla^{*}}\boldsymbol{\cdot}\boldsymbol{\tau}^{*}_{p}}{\rho}\right). \end{equation}
The existence of this extra term on the right-hand side of the VT equation for the viscoelastic fluids leads to an enhancement in the vorticity generation and its subsequent transport through the domain. This can be clearly observed from figure 15, which illustrates the contours of the VTR both for Newtonian and viscoelastic fluids at different combinations of cylinder oscillation parameters. As already stated above, the vorticity in both fluids is generated at the solid boundary; therefore, the VTR contours are only present near the cylinder vicinity. Overall, the contours are more prominent for viscoelastic fluids, which extend to larger distances in the streamwise direction at lower non-dimensional frequencies; for instance, see the results at  $f^* = 0.6$ (figure 15a) and
 $f^* = 0.8$ (figure 15b). At higher frequencies, for instance, at
 $f^{*} = 1.2$, although the VTR is higher for viscoelastic fluids, it does not extend to that much in the streamwise direction, as seen at lower values of
 $f^*$. This behaviour can be explained based on the competition between the fluid deformation (due to cylinder oscillation) and polymer relaxation time scales. For a given polymer relaxation time (or at a fixed Weissenberg number), at a lower cylinder oscillation frequency, the fluid deformation time scale is large and sufficient enough for the polymer molecules to stretch and relax the stresses in the fluid. In contrast, at higher cylinder oscillation frequencies, the fluid deformation time scale becomes small, and as a result, the polymer molecules are not getting enough time to relax, and smaller polymer chains are formed. This is why the lock-in phenomenon of viscoelastic fluids deviates substantially from the Newtonian one at frequencies
 $f^* < 1$, whereas not much difference is seen above
 $f^* = 1$.
Comparison of the VTR  $({D{\boldsymbol {\omega }^{*}}}/{D{t}^{*}})$ for Newtonian and viscoelastic fluids having
 $Wi = 2$ and
 $\beta = 0.5$. Here, the cylinder oscillation parameters are (a)
 $A^* =0.4$ and
 $f^* = 0.6$, (b)
 $A^* =0.4$ and
 $f^* = 0.8$, (c)
 $A^* =0.4$ and
 $f^* = 1.2$, (d)
 $A^* =1.2$ and
 $f^* = 1$. The top and bottom of each panel represent the results for Newtonian and viscoelastic fluids, respectively.

To quantify and visualize this stretching phenomenon and its consequences on wake structure, we present the plots of the polymer stretching superimposed over the  $Q$-criterion of the flow field, figure 16. The
 $Q$-criterion is calculated as per the equation,
 $Q = ({(\|\varOmega ^{*}\|^{2}-\|S^{*}\|^{2})}/{2})$, where
 $\varOmega ^{*}$ is the rotation rate in the fluid given by
 $({(\nabla ^{*} u^{*} -\nabla ^{*} {u^{*}}^{T})}/{2})$ and
 $S^{*}$ is the strain rate given by
 $({(\nabla ^{*} u^{*} +\nabla ^{*} {u^{*}}^{T})}/{2})$. This criterion is a standard technique to identify the vortical structures in a flow field. Consequently, regions with
 $Q > 0$ are characterized as rotation-dominated regions, whereas
 $Q < 0$ indicates that the straining is in excess compared with the rotation. The stretching of polymer molecules is quantified by calculating the trace (
 ${\rm tr}(\boldsymbol {C})$) of the polymeric conformation tensor
 $\boldsymbol {C}$, which is obtained from the polymeric stress fields by the equation,
 $\boldsymbol {C} = (({\lambda }/{\eta _{p}}) \boldsymbol {\tau }_{p}^{*}) + \boldsymbol {\delta }$. For superimposition with polymer stretching, the opacity of the
 $Q$-criterion fields is reduced in viscoelastic fluids. At cylinder oscillation frequencies of 0.6 and 0.8 (figure 16a,b, respectively), it can be seen that highly stretched strands of polymer molecules are formed in the cylinder vicinity, which further extend to larger distances into the downstream wake. Moreover, the positive
 $Q$-criterion structures are aligned along the tips of these strands. The corresponding
 $Q$-criterion for Newtonian fluids is also shown in the same figure for comparison. In contrast, at
 $f^* = 1.2$, as already stated above, the chains are shorter, less prominent and roll up very close to the downstream cylinder face. The presence of these smaller chains between the shed vortices makes these vortices more interconnected resulting in the elongation of the vortices and a distinct wake structure, as already seen in the earlier vorticity plots (figure 10). On increasing the amplitude at a given frequency (figure 15d), a different trend is observed where the high VTR zones are spread more in the spanwise direction. The corresponding polymer stretching and
 $Q$-criterion structures can be seen in figure 16(d). Here, long chains are oriented in a semivertical fashion, resulting in the deviation of wake structure in viscoelastic fluids from the Newtonian one. Two pairs of
 $Q$-criterion structures can be seen in viscoelastic fluids as compared with a single and a pair of structures for the Newtonian fluid.
The  $Q$-criterion for Newtonian and viscoelastic fluids at
 $Wi = 2$,
 $\beta = 0.5$. The plots are superimposed over the polymer stretching (tr(
 $\boldsymbol {C}$)) for viscoelastic fluids by reducing the opacity. Here, the cylinder oscillation parameters are (a)
 $A^* =0.4$ and
 $f^* = 0.6$, (b)
 $A^* =0.4$ and
 $f^* = 0.8$, (c)
 $A^* =0.4$ and
 $f^* = 1.2$, (d)
 $A^* =1.2$ and
 $f^* = 1$. The top and bottom plots in each panel represent the results for Newtonian and viscoelastic fluids, respectively.

Therefore, the existence of polymer molecules in a viscoelastic fluid significantly affects the vortex dynamics. Furthermore, the elastic stresses generated are stronger at lower oscillation frequencies where the lock-in phenomenon is also altered. The formation of polymer strands suppresses the vortex shedding as the polymer molecules sustain the stresses for a longer duration of time. As a result, the inertial effects generated by the cylinder are not dissipated but sustained in the fluid. Therefore, the cylinder oscillation dominates the flow field in viscoelastic fluids, leading to an early transition into the lock-in condition on a non-dimensional amplitude–frequency plane.
5. Conclusions
In this study, we conducted numerical simulations to investigate the flow characteristics of Newtonian and viscoelastic fluids around a circular cylinder undergoing transverse oscillations in a streaming fluid with a fixed Reynolds number of  $Re = 100$. Specifically, we focused on examining the influence of fluid viscoelasticity on the transition between the lock-in and no lock-in regions and the corresponding vortex structures. Our findings indicate that the lock-in region in viscoelastic fluids occurs at a lower non-dimensional cylinder oscillation frequency compared with the no lock-in condition observed in Newtonian fluids. To gain further insights into the interplay between the cylinder oscillation frequency and the natural shedding frequency of vortices in the wake structure, we employed a data-driven technique called DMD analysis. For Newtonian fluids in the no lock-in regime, DMD revealed two coherent flow structures associated with each of these frequencies in the amplitude–frequency plane. In contrast, for viscoelastic fluids at the same point, only the cylinder oscillation frequency and its corresponding structure were extracted, indicating the presence of the lock-in state. Additionally, we observed significant differences in the wake structures between Newtonian and viscoelastic fluids. In the lock-in zone, a distinct ‘2P’ vortex shedding mode, characterized by the presence of two pairs of vortices within one oscillation cycle, was observed exclusively in viscoelastic fluids and not in Newtonian fluids. This deviation can be attributed to the additional elastic stresses generated by the stretching of polymer molecules present in viscoelastic fluids. Our results are consistent with the findings obtained from
 $Q$-criterion and VT analyses, further supporting our observations.
Declaration of interests
The authors report no conflict of interest.



