


1. Introduction
Based on existing estimates, over 1.8 billion people worldwide live in areas at severe risk of natural disasters (Institute for Economics and Peace, 2023). This situation is likely to worsen in the face of climate change and its impacts on the frequency and intensity of disasters (Acevedo & Novta, Reference Acevedo and Novta2017; IPCC, 2018). Natural disasters have wide-ranging consequences for individuals and societies, causing economic damage (Boustan et al., Reference Boustan, Kahn, Rhode and Lucia Yanguas2020; Felbermayr & Gröschl, Reference Felbermayr and Gröschl2014; Joseph, Reference Joseph2022; Otrachshenko & Nunes, Reference Otrachshenko and Nunes2022), poverty (Carter et al., Reference Carter, Little, Mogues and Negatu2007; Sakai et al., Reference Sakai, Estudillo, Fuwa, Higuchi and Sawada2017), inequality (Bui et al., Reference Bui, Dungey, Nguyen and Pham2014; Cappelli et al., Reference Cappelli, Costantini and Consoli2021; Otrachshenko & Popova, Reference Otrachshenko and Popova2022), mortality (Deschenes & Moretti, Reference Deschenes and Moretti2009; Otrachshenko et al., Reference Otrachshenko, Popova and Solomin2017, Otrachshenko et al., Reference Otrachshenko, Popova and Solomin2018), food insecurity (De Haen & Hemrich, Reference De Haen and Hemrich2007; Escalante & Maisonnave, Reference Escalante and Maisonnave2022; Nelson et al., Reference Nelson, Ingram, Dugmore, Streeter, Peeples, McGovern, Hegmon, Arneborg, Kintigh, Brewington, Spielmann, Simpson, Strawhacker, Comeau, Torvinen, Madsen, Hambrecht and Smiarowski2016; Sassi & Cardaci, Reference Sassi and Cardaci2013), poor institutions (Khurana et al., Reference Khurana, Mugabe and Etienne2022; Leeson & Sobel, Reference Leeson and Sobel2008; Nguyen, Reference Nguyen2017; Rahman et al., Reference Rahman, Anbarci and Ulubaşoğlu2022; Wenzel, Reference Wenzel2021; Yamamura, Reference Yamamura2014), political discontent (Cerqua et al., Reference Cerqua, Ferrante and Letta2023; Mackay et al., Reference Mackay, Mavisakalyan and Tarverdi2023), and conflict (Eastin, Reference Eastin2016; Schleussner et al., Reference Schleussner, Donges, Donner and Joachim Schellnhuber2016). The impact of natural disasters extends beyond short-term changes in outcomes. Existing evidence highlights the role of such disasters in shaping the social norms that guide interactions (Gelfand et al., Reference Gelfand, Raver, Nishii, Leslie, Lun, Lim, Duan, Almaliach, Ang, Arnadottir, Aycan, Boehnke, Boski, Cabecinhas, Chan, Chhokar, D’Amato, Subirats Ferrer, Fischlmayr, Fischer, Fülöp, Georgas, Kashima, Kashima, Kim, Lempereur, Marquez, Othman, Overlaet, Panagiotopoulou, Peltzer, Perez-Florizno, Ponomarenko, Realo, Schei, Schmitt, Smith, Soomro, Szabo, Taveesin, Toyama, Van de Vliert, Vohra, Ward and Yamaguchi2011, Reference Gelfand, Gavrilets and Nunn2024; Giuliano & Nunn, Reference Giuliano and Nunn2021). An emerging body of work links exposure to natural disasters with specific cultural traits, such as religiosity (Bentzen, Reference Bentzen2019; Bentzen & Force, Reference Bentzen, Force and Sauer2023) and trust (De Juan & Hänze, Reference De Juan and Hänze2021; Fleming et al., Reference Fleming, Chong and Bejarano2014; Mackay et al., Reference Mackay, Mavisakalyan and Tarverdi2024; Rahman et al., Reference Rahman, Lee, Shabnam and Jayasinghe2020; Toya & Skidmore, Reference Toya and Skidmore2014). This suggests that natural disasters may have a lasting impact on social norms across societies. However, the evidence on the impacts of natural disasters on various behavioral norms remains relatively limited.
This paper contributes to the literature by examining whether and how exposure to natural disasters shapes family norms of behavior, focusing on a specific norm: the acceptance of physical violence. The use of physical violence within a family, particularly intimate partner violence (IPV), is widespread globally, with 1 in 3 women of reproductive age estimated to have experienced physical and/or sexual violence by their intimate partner in their lifetime (World Health Organization, 2021). Experiences of domestic violence have devastating impacts on the health and well-being of survivors (Beleche, Reference Beleche2019; Campbell, Reference Campbell2002; Devries et al., Reference Devries, Mak, Bacchus, Child, Falder, Petzold, Astbury and Watts2013) and their children (Aizer, Reference Aizer2011; Bharati et al., Reference Bharati, Mavisakalyan and Vu2024; Bhuller et al., Reference Bhuller, Dahl, Løken and Mogstad2024; Currie et al., Reference Currie, Mueller-Smith and Rossin-Slater2022; Hillis et al., Reference Hillis, Mercy, Amobi and Kress2016; Jofre-Bonet et al., Reference Jofre-Bonet, Rossello-Roig and Serra-Sastre2024) and lead to high economic costs due to associated medical, legal, police, and counseling costs, property damage, and lost earnings (UN Women, 2016). Based on existing work, IPV is driven by norms that justify such violence (Heise & Kotsadam, Reference Heise and Kotsadam2015). Yet the evidence on the causes of violence against women and the associated norms remains scant (for reviews, see Hsu & Henke, Reference Hsu, Henke and Zimmerman2022; Kiani et al., Reference Kiani, Simbar, Fakari, Kazemi, Ghasemi, Azimi, Mokhtariyan and Bazzazian2021), and, as a result, policies that address such violence are often piecemeal and reactive.
We put forward and test the hypothesis that natural disasters, through inducing emotional distress and economic insecurity, and imposing constraints on women’s independence and autonomy, contribute to an environment where IPV becomes more acceptable. Our empirical analysis is based on a global sample of individuals drawn from the World Values Surveys (WVS) and historical geo-referenced records of natural disasters spanning several decades taken from the Geocoded Disasters Dataset (GDIS) – an extension to the Emergency Events Database (EM-DAT) that allows us to make use of subnational data on major natural disasters (Rosvold & Buhaug, Reference Rosvold and Buhaug2021a, Reference Rosvold and Buhaug2021b). We match individuals’ attitudes toward the justifiability of beating one’s wife with information on their lifetime exposure to natural disasters at the subnational geographic region level, and document important dynamics with respect to the time elapsed since exposure. Acceptance of IPV goes up in the short- (0–4) and medium- (10–14) run following exposure to a disaster, and goes down only 20 years after exposure to a disaster. These findings are robust across a wide range of sensitivity checks. In addition, heterogeneity analyses reveal that lower-educated individuals are more affected than higher-educated individuals, men are more affected than women, and older cohorts are more affected than younger cohorts. However, there are no differences in the effects of disasters on IPV attitudes between individuals with high and low incomes. Moreover, drawing on theories of IPV, discussed in the next section, we engage, within the limits of our dataset, with a range of mechanisms that may link disasters to acceptance of IPV.
Our study adds to the emerging body of work on the impacts of exogenous shocks on IPV and the associated norms. The earlier work has shown that IPV goes up in response to political unrest and conflicts (Bargain et al., Reference Bargain, Boutin and Champeaux2019; Ekhator-Mobayode et al., Reference Ekhator-Mobayode, Hanmer, Rubiano-Matulevich and Jimena Arango2022; La Mattina, Reference La Mattina2017; La Mattina & Shemyakina, Reference La Mattina and Shemyakina2024; Torrisi, Reference Torrisi2023), labor market shocks and structural changes in the economy (Anderberg et al., Reference Anderberg, Rainer, Wadsworth and Wilson2016; Bhalotra et al., Reference Bhalotra, Kambhampati, Rawlings and Siddique2021, Reference Bhalotra, Britto, Pinotti and Sampaio2025; Erten & Keskin, Reference Erten and Keskin2021, Reference Erten and Keskin2024; Kotsadam et al., Reference Kotsadam, Østby and Aas Rustad2017; Schneider et al., Reference Schneider, Harknett and McLanahan2016) and health emergencies, such as the COVID-19 pandemic (Arenas-Arroyo et al., Reference Arenas-Arroyo, Fernandez-Kranz and Nollenberger2021; Berniell & Facchini, Reference Berniell and Facchini2021; Bhalotra et al., Reference Bhalotra, Brito, Clarke, Larroulet and Pino2026; Gibbons et al., Reference Gibbons, Murphy and Rossi2021; Hsu & Henke, Reference Hsu and Henke2021a, Reference Hsu and Henke2021b; Rocha et al., Reference Rocha, Diaz, Pereda, Árabe, Cavalcanti, Lordemus, Kreif and Moreno-Serra2024; Roman et al., Reference Roman, Aguiar-Palma and Machado2023). Closely related to our work are the studies on the link between weather shocks and IPV, which offer mixed findings.Footnote 1 In Sub-Saharan Africa, some studies show a positive association between extreme rainfall (droughts or floods) and IPV (Abiona & Foureaux Koppensteiner, Reference Abiona and Foureaux Koppensteiner2018; Epstein et al., Reference Epstein, Bendavid, Nash, Charlebois and Weiser2020), whereas others find little or no association (Cools et al., Reference Cools, Flatø and Kotsadam2020; Cooper et al., Reference Cooper, Sandler, Vitellozzi, Lee, Seymour, Haile and Azzari2021). A study by Díaz and Saldarriaga (Reference Díaz and Saldarriaga2023) on Peru finds that the probability of experiencing IPV increases with exposure to a dry, but not a wet, shock. They attribute their findings to two mechanisms: increased economic insecurity and stress that deteriorate men’s mental health, and reduced female empowerment that affects their ability to negotiate within the relationship. Using data from Peru, Barros and Xu (Reference Barros and Xu2025) document a positive association between earthquake exposure and IPV incidence and show that increases in male intra-household bargaining power and alcohol consumption drive this association. Additionally, in the context of the 2015 Nepal earthquake, Khanna and Fujii (Reference Khanna and Fujii2022) demonstrate that exposure to the earthquake increased the incidence of IPV, driven by heightened stress among affected individuals. The relationship between extreme weather events and IPV is not limited to developing country contexts. Henke and Hsu (Reference Henke and Hsu2020) and Heilmann et al. (Reference Heilmann, Kahn and Keat Tang2021) establish a relationship between hot temperatures and IPV in the US. Finally, extreme weather events, through causing shocks in income, also affect other forms of violence against women, including religiously motivated murders of elderly women (witch killing) in Tanzania (Miguel, Reference Miguel2005), dowry deaths in India (Sekhri & Storeygard, Reference Sekhri and Storeygard2014), child marriages in Sub-Saharan African countries and India (Corno et al., Reference Corno, Hildebrandt and Voena2020) and female genital cutting in Sub-Saharan Africa (McGavock & Novak, Reference McGavock and Novak2023).Footnote 2
We add to this literature in several important ways. First, our study is based on a global survey of individuals and examines their acceptance of IPV across a full set of natural disasters to which they may have been exposed. In doing so, it is positioned to throw light on the mixed findings in the literature that stem from specific, mostly developing-country contexts or disaster types. Second, it goes beyond the focus on contemporaneous or short-term impacts of disasters in the existing studies on the link between disasters and violence against women, by studying and documenting important long-term dynamics in the relationship. Third, it contributes to the analyses of the mechanisms underlying the relationship between disaster exposure and IPV by Díaz and Saldarriaga (Reference Díaz and Saldarriaga2023) and Barros and Xu (Reference Barros and Xu2025) and extends them further to shed light on likely mechanisms from a global, long-term perspective. Fourth, unlike most studies in the literature, which focus on women’s reports or attitudes (largely due to data constraints), we also examine men’s attitudes toward natural disasters. This is an important addition to knowledge, given the dominant role men play in perpetuating IPV.
More broadly, we contribute to the evidence base on women’s vulnerability to climate change and its manifestations through extreme weather events (see Hailemariam et al., Reference Hailemariam, Kalsi, Mavisakalyan, Baikady, Sajid, Przeperski, Nadesan, Islam and Gao2023 for a review). In this line of work, our results suggest that climate change is likely to cause long-lasting changes in the social norms justifying IPV in addition to affecting a range of other outcomes relevant to women’s well-being, including their health (Bahru et al., Reference Bahru, Bosch, Birner and Zeller2019; Stone et al., Reference Stone, Blinn and Spencer2022), employment and economic security (Flatø et al., Reference Flatø, Muttarak and Pelser2017; Hickson & Marshan, Reference Hickson and Marshan2022; Otrachshenko et al., Reference Otrachshenko, Popova and Alimukhamedova2024b), and intra-household position (Barros & Xu, Reference Barros and Xu2025; Eastin, Reference Eastin2018).
2. Conceptual background and hypotheses
Theories of IPV (see Angelucci & Heath, Reference Angelucci and Heath2020; Hsu & Henke, Reference Hsu, Henke and Zimmerman2022) offer several predictions about how exposure to natural disasters may affect IPV and the associated norms.
Based on theories of expressive violence, IPV may provide utility to the perpetrator and is used to relieve frustration (e.g., Anderberg & Rainer, Reference Anderberg and Rainer2013; Dobash & Dobash, Reference Dobash and Dobash1979; Tauchen et al., Reference Tauchen, Witte and Long1991). Consistent with theories of expressive violence, Card and Dahl (Reference Card and Dahl2011) show that professional football losses lead to increases in IPV, reflecting the role of emotional cues in the precipitation of violence. Cardazzi et al. (Reference Cardazzi, McCannon, Humphreys and Rodriguez2024) arrive at a similar result in a case study of basketball game losses. Ivandic et al. (Reference Ivandic, Kirchmaier, Saeidi and Torres Blas2024) study the role of alcohol and emotions in explaining domestic abuse following football games and show that the relationship is driven by alcohol consumption. In addition, Lindo et al. (Reference Lindo, Siminski and Swensen2018) find that football game days, through intensifying partying, lead to an increase in reports of rape victimization among college students.
Natural disasters, through their negative impact on the exposed individuals’ mental health (Crandon et al., Reference Crandon, Dey, Scott, Thomas, Ali and Charlson2022; Obradovich et al., Reference Obradovich, Migliorini, Paulus and Rahwan2018) and economic well-being (Gignoux & Menéndez, Reference Gignoux and Menéndez2016; Johar et al., Reference Johar, Johnston, Shields, Siminski and Stavrunova2022; Mackay et al., Reference Mackay, Mavisakalyan and Tarverdi2023), may induce marital conflict and frustration, resulting in an expressive form of IPV.Footnote 3 Such frustration may affect violent behavior directly or mediated through alcohol consumption (Angelucci, Reference Angelucci2008; Averett & Wang, Reference Averett and Wang2016; Jewkes, Reference Jewkes2002; Markowitz, Reference Markowitz2000; Nguyen, Reference Nguyen2024; Otrachshenko et al., Reference Otrachshenko, Popova and Tavares2021), for example, due to its inhibiting effect on self-control (Schilbach, Reference Schilbach2019). From the survivors’ perspective, the tolerance for violence may go up as their outside options are likely to deteriorate under the conditions of stress and resource scarcity after a disaster. For example, Tsaneva et al. (Reference Tsaneva, Rockmore and Albohmood2019) show that women’s intrahousehold bargaining power is lower in violent areas where it may be harder to leave a bad relationship.
IPV may also be an instrument to control women’s resources, according to the theories of instrumental violence (e.g., Bloch & Rao, Reference Bloch and Rao2002; Eswaran & Malhotra, Reference Eswaran and Malhotra2011; Tauchen et al., Reference Tauchen, Witte and Long1991). In line with these theories, Hsu (Reference Hsu2017) suggests that male partners use IPV to control the allocation of household resources by showing that IPV increases shortly after the receipt of welfare payments. A similar conclusion results from the study by Bobonis et al. (Reference Bobonis, González-Brenes and Castro2013), who find evidence of the use of verbal abuse to gain control over the public transfers to women. Heath (Reference Heath2014) shows that women with low bargaining power face an increased risk of IPV when joining the labor force and attributes this finding to the males’ desire to counteract their partners’ increased bargaining power due to employment.
Men may also use violence to reassert their dominance in response to a status threat. Such male backlash can be seen as the “emotional counterpart” of the theory of instrumental violence (Hsu & Henke, Reference Hsu, Henke and Zimmerman2022, p. 6). In line with this theory, Bueno & Henderson (Reference Bueno and Henderson2017) find that women who earn more than their husbands are at a higher risk of experiencing sexual IPV. Similarly, Gage (Reference Gage2005) and Zhang and Breunig (Reference Zhang and Breunig2023) find that female breadwinning is associated with a higher risk of physical violence and emotional abuse by a male partner. Dhanaraj and Mahambare (Reference Dhanaraj and Mahambare2022) show that women in employment are exposed to higher levels of IPV due to male backlash but also find IPV more justifiable due to “female guilt,” which in turn further raises the IPV exposure.
The theories of instrumental violence and male backlash, although differing in their underlying motivations, are likely to generate similar predictions regarding employment arrangements and relative bargaining power within the household (Hsu & Henke, Reference Hsu, Henke and Zimmerman2022; Jewkes, Reference Jewkes2002). In the context of natural disasters, a female’s low expected earnings make them less inclined to leave their partner, even if they may be the violent type. Whereas males under such circumstances, as Anderberg et al. (Reference Anderberg, Rainer, Wadsworth and Wilson2016) suggest, have lower incentives to conceal their nature if they are the violent type. Hence, as they show, female unemployment increases IPV. Welfare provisioning in response to natural disasters may also prompt instrumental violence as a way of controlling household resources (Bobonis et al., Reference Bobonis, González-Brenes and Castro2013; Hsu, Reference Hsu2017). Moreover, to the extent that shock situations contribute to the revival of traditional norms (Goli et al., Reference Goli, Mavisakalyan, Rammohan and Vu2022; Mavisakalyan & Minasyan, Reference Mavisakalyan and Minasyan2023; Otrachshenko et al., Reference Otrachshenko, Iliyas and Alimukhamedova2024a), natural disasters may create an environment conducive to the acceptance and use of violence to reassert male dominance.
Based on exposure reduction theories, IPV may also increase in response to the greater time a couple spends together (Dugan et al., Reference Dugan, Nagin and Rosenfeld1999, Reference Dugan, Nagin and Rosenfeld2003). Chin (Reference Chin2012) finds a negative association between women’s employment and the incidence of IPV in India and shows that the exposure reduction effect mainly drives it. More recently, increases in the time couples spend together due to COVID-19 have been linked to increases in the incidence of IPV. For example, consistent with exposure reduction theory, Hsu and Henke (Reference Hsu and Henke2021a) find that staying at home due to COVID-19 led to an increase in domestic violence in the US (see also Hsu & Henke, Reference Hsu and Henke2021b). Similarly, a multi-country study by Berniell and Facchini (Reference Berniell and Facchini2021) documents an increase in the Google search intensity index for domestic violence-related topics as more people stayed home, as captured by Google Mobility Data. Natural disasters, through their impacts on the labor-market status of men and women, may also affect the time couples spend together. If natural disasters lead to a decrease in hours worked by at least one partner, the time a couple spends together is likely to increase, which in turn increases the likelihood of justifying and perpetrating an IPV incident due to increased exposure.
In practice, there are complementarities between the different theories of violence (Angelucci & Heath, Reference Angelucci and Heath2020), but all point towards a positive association between natural disaster exposure and acceptance of IPV. It should be noted that most of the discussion (and empirical evidence thereof) at the first instance is relevant to the shorter-term impacts of natural disasters. For example, an emotional response to a natural disaster is likely to manifest in expressive violence and in the violence-associated norms in its aftermath. However, it’s possible that such an emotional response to a natural disaster, once normalized, may persist over time. This argument aligns with studies that document the long-term persistence of cultural features triggered by exposure to shocks (e.g., Grosjean & Khattar, Reference Grosjean and Khattar2019; Miho et al., Reference Miho, Jarotschkin and Zhuravskaya2024; Nikolova et al., Reference Nikolova, Popova and Otrachshenko2022; Nunn & Wantchekon, Reference Nunn and Wantchekon2011). Hence, evolving norms may reflect the sustained impact of natural disasters on the acceptance of IPV over time until a new steady state is achieved.
Based on this discussion, our main hypothesis is as follows:
H1 (main effect): Natural disasters increase IPV acceptance over time.
Identification of the theory likely to be at play is reliant on very detailed data, which is rarely available in secondary-data-based applications. However, the theories in combination point towards several mechanisms potentially underlying the relationship between natural disasters and IPV acceptance, presented through the following hypotheses:
H2a (psychological distress mechanism): Natural disasters increase IPV acceptance through increasing psychological stress, alcohol consumption, and the likelihood of marital conflicts.
H2b (economic insecurity mechanism): Natural disasters increase IPV acceptance through (the fear of) the household’s income and employment losses.
H2c (gender roles mechanism): Natural disasters increase acceptance of IPV by altering gender-related attitudes toward more traditional roles.
3. Methodology
We estimate the following econometric model:
 $$IPV\_acceptanc{e_{irct}} = \mathop \sum \limits_{j \in \left\{ {0, \ldots, m} \right\}} {\beta _j}Disaste{r_{rc,t - j}} + {{\bf X}_{irct}}' {\bf\gamma} + {{\bf \theta} _r} + {{\bf \delta} _c} + {\alpha _t} + {\varepsilon _{irct}}$$
where the dependent variable is the IPV acceptance, IPV_acceptance, by an individual i living in region r of country c at survey year t. As described in the next section, the dependent variable ranges from 1 (never justifiable) to 10 (always justifiable).
Disaster is a set of explanatory variables that account for the occurrence of natural disasters in region r of country c. These variables take three values: 0 if no natural disasters of any type occurred j periods before the survey time, 1 if at least one natural disaster of any type occurred j periods before the survey time, and 2 if a respondent was not yet born in the j
th period before the survey time.Footnote
4
We account for
 $j \in \left\{ {0, \ldots, m} \right\}$
in 5-year time frames: 0–4 years, 5–9 years, 10–14 years, 15–19 years, 20–24 years, and 25 years or more before the survey took place. In our case, as described in the next section, disaster data range from 1960 to 2018, while the individual-level survey comparable across countries was conducted in 2017 and 2018. For each respondent in our survey, we create variables indicating whether they experienced a disaster during specific periods in the past and analyze how those disasters affect their current attitudes toward IPV.
X is a vector of individual sociodemographic characteristics, including age and its square, and a dummy for biological sex. As discussed by Dell et al. (Reference Dell, Jones and Olken2014), including additional socioeconomic controls in regressions analyzing the effects of extreme weather events may create an overcontrolling problem, as many socioeconomic variables, such as income, education, and employment status, are themselves affected by extreme weather events. Angrist and Pischke (Reference Angrist and Pischke2009) refer to such controls as “bad controls”. We thus limit the set of controls to exogenous individual characteristics only.
 $\bf\theta$
is a vector of the latitude and longitude of the respondent’s residence location, potentially accounting for the unobservable cultural or geographic characteristics of specific places.
δ
are country fixed effects, while α is a dummy for the survey year that equals 1 for 2018 and 0 for 2017.
 ${\beta _j}$
and
γ
are the model parameters, and ϵ is a stochastic disturbance term. For simplicity of interpreting the coefficient estimates, we estimate Equation (1) by ordinary least squares (OLS).Footnote
5
Standard errors are robust to heteroskedasticity and clustered at the region’s level.
In addition, we analyze the heterogeneity of our results by respondents’ socioeconomic characteristics, including age, gender, income status, and education. As detailed in the results section, we also provide a battery of robustness checks.
4. Data
4.1. Key variables
Data on IPV acceptance and respondents’ socioeconomic characteristics come from the World Values Survey, wave 7 (WVS 2017–2022) (Haerpfer et al., Reference Haerpfer, Inglehart, Moreno, Welzel, Kizilova, J., Lagos, Norris, Ponarin and Puranen2022). It is an individual-level survey of people’s attitudes and values with a unified questionnaire across countries.Footnote 6 We limit the WVS data to countries surveyed in 2017 and 2018. There are two reasons for this. The first is the need to disentangle the effects of natural disasters and the effects of COVID-19 on IPV attitudes since numerous studies document that the pandemic fostered IPV (see Arenas-Arroyo et al., Reference Arenas-Arroyo, Fernandez-Kranz and Nollenberger2021; Berniell & Facchini, Reference Berniell and Facchini2021; Bhalotra et al., Reference Bhalotra, Brito, Clarke, Larroulet and Pino2026; Boserup et al., Reference Boserup, McKenney and Elkbuli2020; Chandan et al., Reference Chandan, Taylor, Bradbury-Jones, Nirantharakumar, Kane and Bandyopadhyay2020; Mahase, Reference Mahase2020; Moore et al., Reference Moore, Buckley, Howarth, Burn, Copeland, Evans and Ware2022; Rocha et al., Reference Rocha, Diaz, Pereda, Árabe, Cavalcanti, Lordemus, Kreif and Moreno-Serra2024; Roman et al., Reference Roman, Aguiar-Palma and Machado2023; Sharma & Borah, Reference Sharma and Bikash Borah2022). The second reason, as described in the next section, is the availability of geocoded data on natural disasters.
We use the two survey questions on the acceptance of IPV. In both questions, a respondent is asked, “Please tell me for each of the following actions whether you think it can always be justified, never be justified, or something in between,” with possible answers ranging from 1 (never justifiable) to 10 (always justifiable). The first action asked in this question is related to the attitudes toward IPV (“For a man to beat his wife”), while the second is related to the approval of domestic abuse of children (“Parents beating children”).
In all model specifications, we also include the respondents’ age and its square, a dummy for biological sex, and the latitude and longitude of the respondent’s residence location. These data also come from the WVS. In addition, several variables are used as proxies to test the mechanisms underlying the relationship between disaster-IPV attitudes within the limits of our data, following the hypotheses formulated above. Descriptive statistics and the specific definitions of all variables used in the analysis are presented in Table A1 in the online Appendix A.
4.2. Natural disasters
We use the Geocoded Disasters (GDIS) dataset available from Rosvold and Buhaug (Reference Rosvold and Buhaug2021a, Reference Rosvold and Buhaug2021b). It includes geocoded information on the regional locations of droughts, earthquakes, extreme temperatures, floods, landslides, dry and wet mass movements, storms, and volcanic activity that occurred globally from January 1, 1960 to December 31, 2018.Footnote 7 Events are considered disasters and are included in the database if they meet a certain magnitude threshold. Specifically, there is either a certain number of deaths (10 or more people killed), a certain number of affected people (100 or more affected), a declared state of emergency, or international assistance required due to those disasters (Rosvold & Buhaug, Reference Rosvold and Buhaug2021b).
We merge the GDIS database with WVS wave 7 (WVS 2017–2022) at the subnational regional level. As explained above, we limit the sample to only those countries from WVS wave 7 that were surveyed in 2017 and 2018. The details of merging the two datasets are provided in online Appendix B. For each respondent, we create a set of variables corresponding to the time when each disaster happened in the respondent’s region of residence. Specifically, we include a set of variables Disaster for any disaster 0 to 4 years ago, 5 to 9 years ago, 10 to 14 years ago, 15 to 19 years ago, 20 to 24 years ago, and over 25 years ago. To create those variables, we use the GDIS data on the year when each disaster happened in each region. To prevent sample dropout, we also control for cases in which respondents were not yet born during the studied disaster period.
When merging the datasets, we account for several situations. First, the same disaster may occur simultaneously in several WVS regions. In this case, this disaster is accounted for in several WVS regions. Second, several disasters may occur in the same WVS region, either simultaneously or at different times. If these disasters occurred in the same time frame, we set them equal to one in the corresponding time frame in our model. If disasters occurred at different times, we account for them in each time frame within the region. In the robustness checks, we also account for the frequency of disasters.
A combined dataset comprises over 21,000 cases of various disaster types, matched with more than 49,000 respondents residing in 32 countries worldwide.Footnote 8
5. Results
5.1. Main results
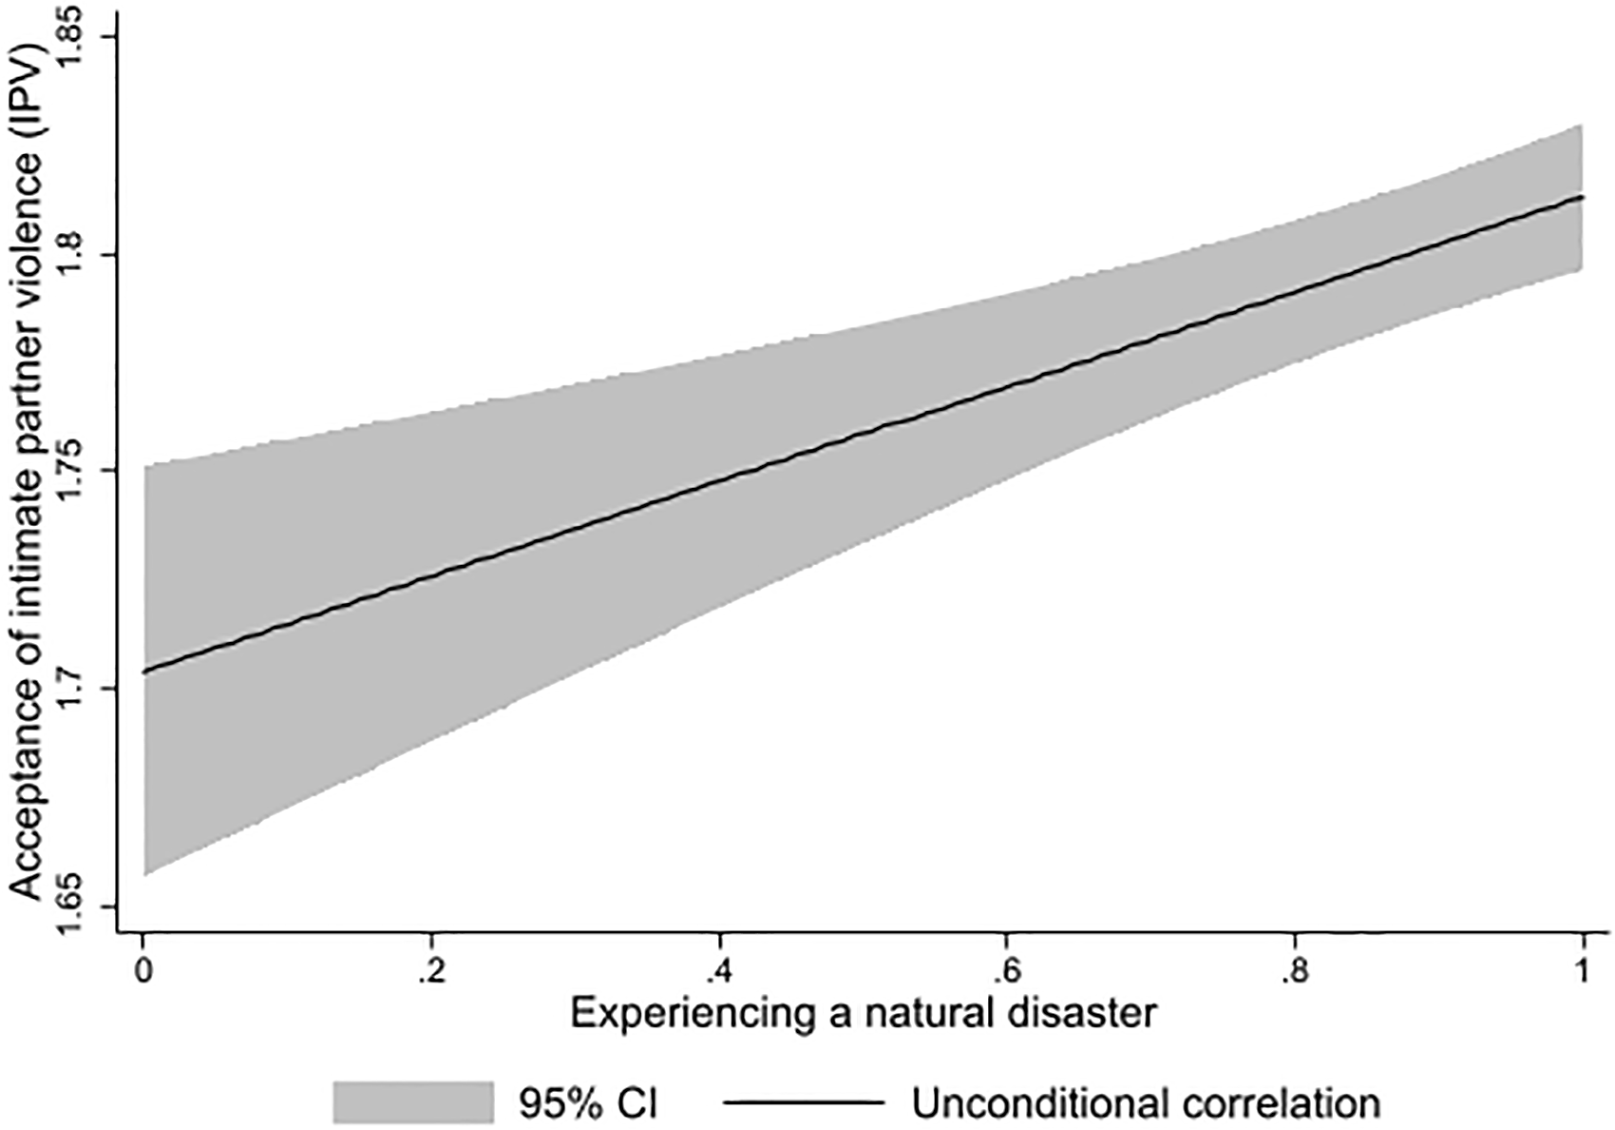
We begin by presenting descriptive evidence on the relationship between exposure to natural disasters and attitudes toward IPV. Figure 1 shows a strong positive unconditional correlation between a dummy variable for experiencing any type of disaster and IPV acceptance. The correlation is statistically significant at the 5% level, and its confidence interval narrows as mean disaster exposure increases.
Exposure to natural disasters and IPV acceptance.
Notes: The figure presents an unconditional correlation between IPV acceptance (justifying beating one’s wife) and exposure to a disaster with a 95% confidence interval. Exposure to a natural disaster is based on a dummy variable that equals 1 if respondents experienced any type of natural disaster in their lives and 0 otherwise.
Source: Authors’ construction.

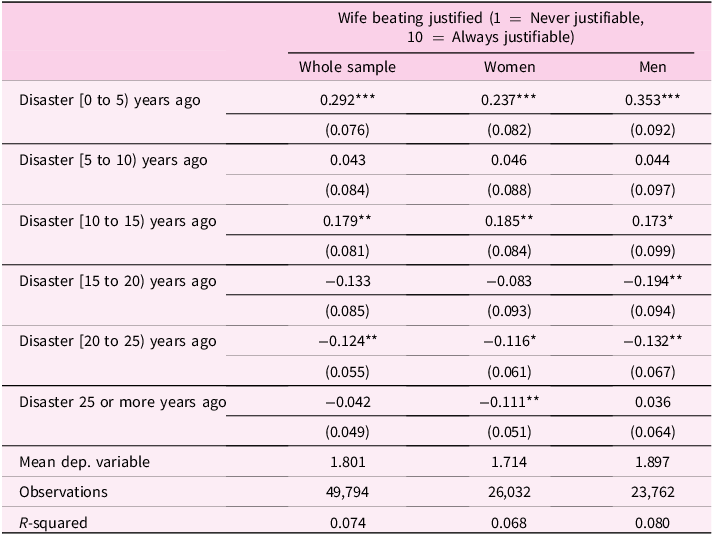
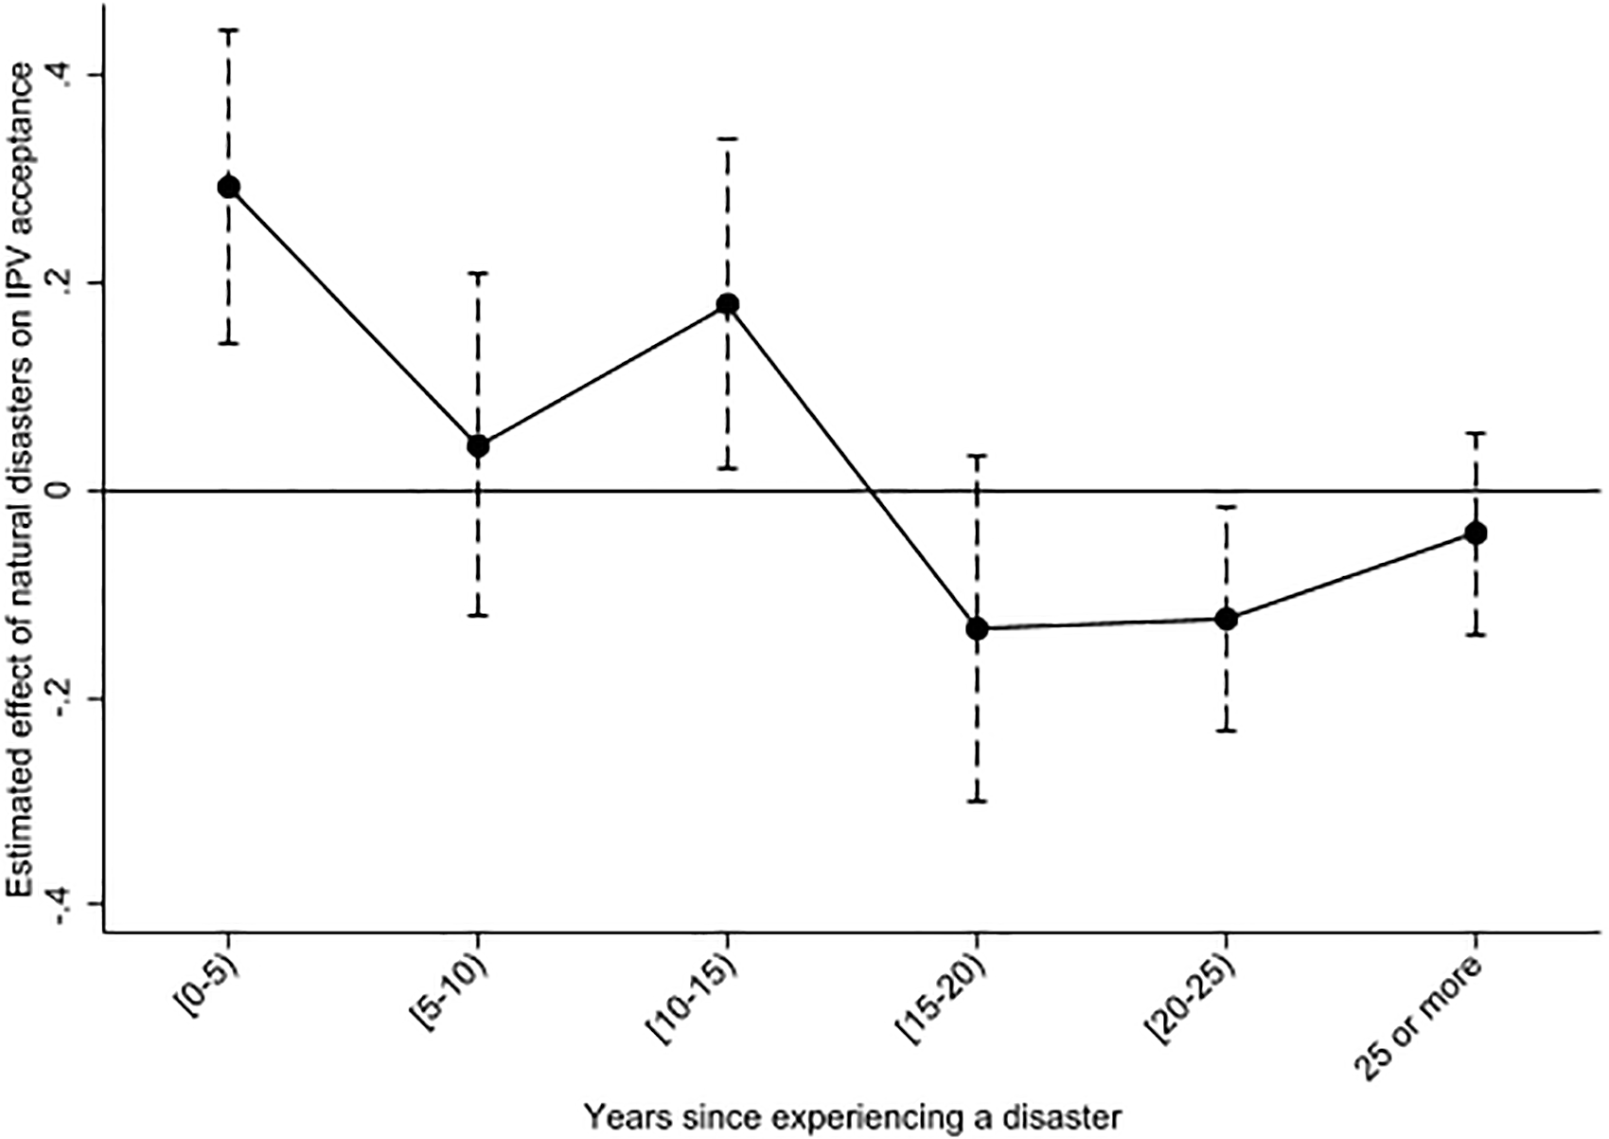
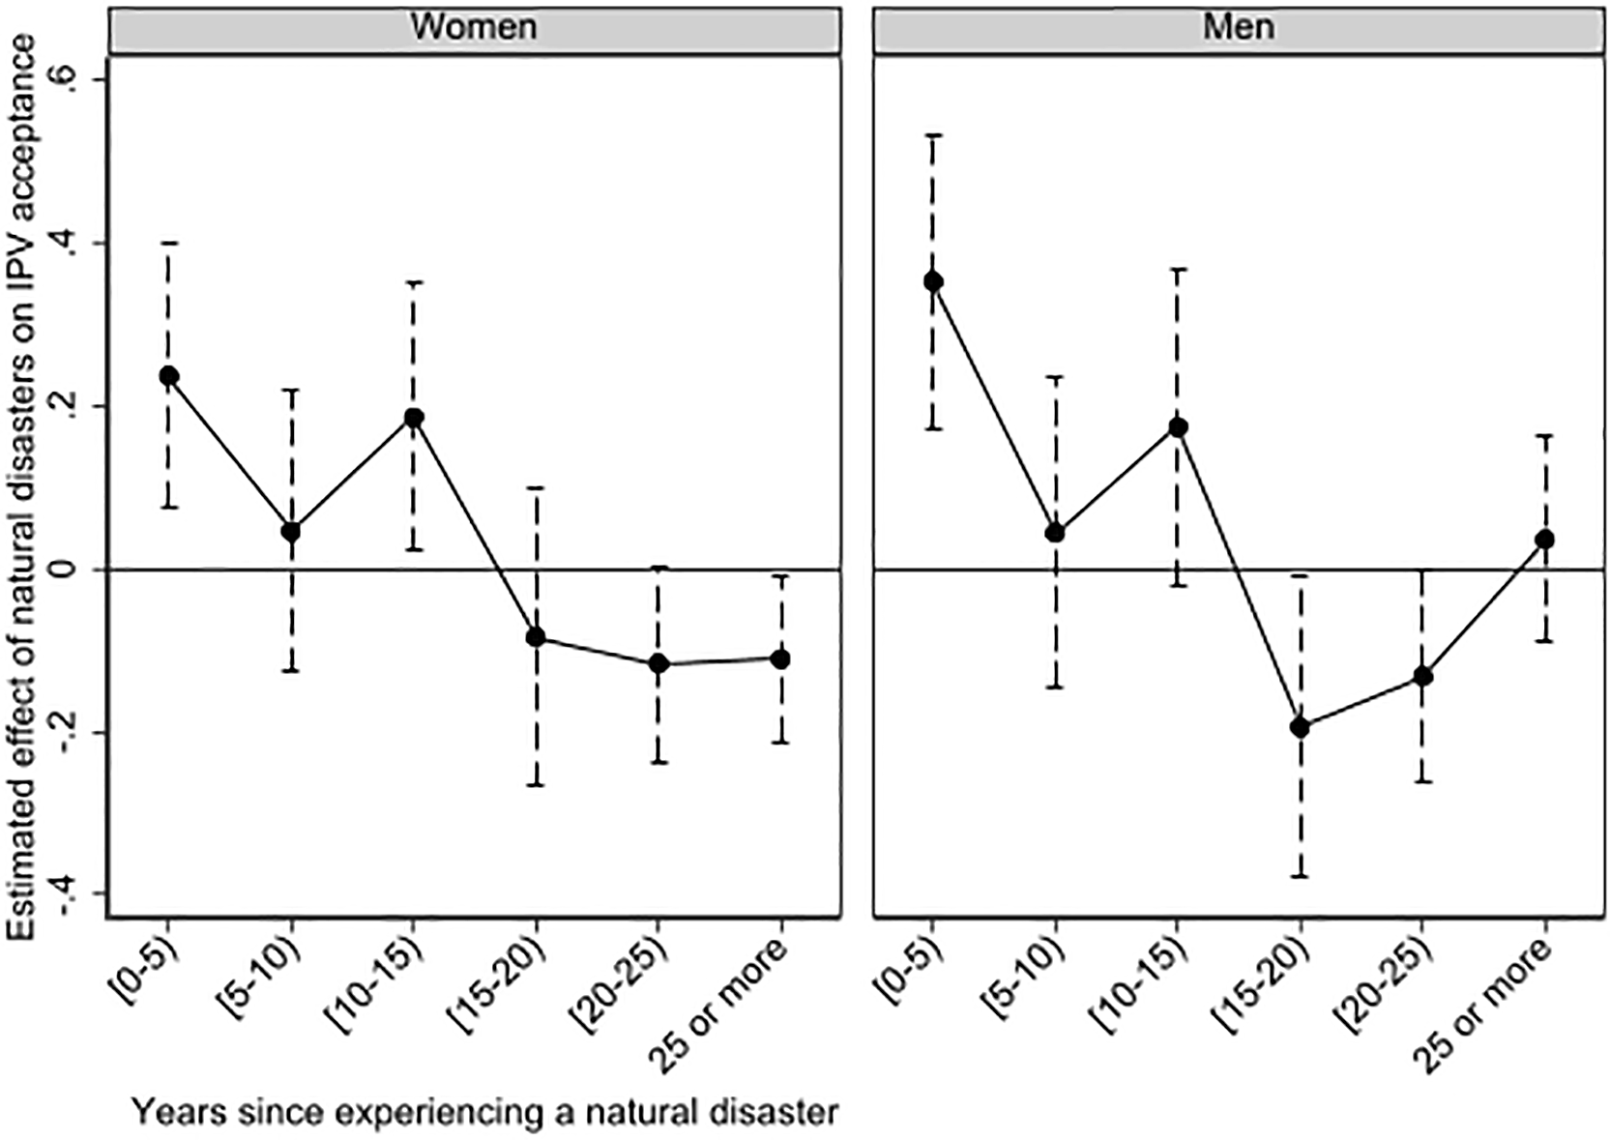
Table 1 and the corresponding Figures 2 and 3 present the main results. As shown, experiencing a natural disaster of any type in the past 5 years increases the respondent’s justification of beating one’s wife by 0.292 points on a scale from 1 (never justifiable) to 10 (always justifiable).Footnote 9 To facilitate interpretation of this effect, we include the sample mean IPV acceptance in Table 1, which is 1.801. That is, experiencing a natural disaster increases the sample mean for IPV acceptance by 16.2%.Footnote 10 This effect is long-lasting and remains observable, with a notable impact, even up to 15 years after the disaster, although its magnitude decreases slightly over time: the estimated coefficient of 0.179 implies a 9.9% increase in the IPV sample mean. Only in the period of 20 to 24 years after a disaster does the effect on the acceptance of IPV reverse, and those who experienced a disaster in the long run report lower acceptance of IPV. Interestingly, when we disentangle these results by gender, we find that the effect is larger for men than for women (see columns 2 and 3 in Table 1 and Figure 3). Thus, we find empirical support for our Hypothesis H1.
Natural disasters and IPV acceptance

Table 1. Long description
The table presents data on the justification of wife beating after experiencing natural disasters, categorized by the time elapsed since the disaster. It includes columns for the whole sample, women, and men, with rows indicating different time periods post-disaster. The table shows coefficients and standard errors for each category. For instance, a disaster occurring 0 to 5 years ago has a coefficient of 0.292 for the whole sample, 0.237 for women, and 0.353 for men. The table also includes the mean dependent variable, number of observations, and R-squared value for each category. Notable trends include higher coefficients for men compared to women in the 0 to 5 years and 10 to 15 years post-disaster periods, and negative coefficients for disasters occurring 15 to 20 years and 20 to 25 years ago.
Notes: The table shows the results for any natural disaster (extreme temperature, drought, earthquake, flood, landslide, (dry) mass movement, storm, and volcanic eruption). OLS results are reported. ***p < 0.01, **p < 0.05, *p < 0.1. Robust standard errors clustered at the region level are in parentheses. Each regression includes controls for age and its square, biological sex, latitude, longitude, a dummy for 2018, a dummy for not being born during the studied disaster period, and country fixed effects.
Natural disasters and IPV acceptance.
Notes: The figure shows the estimated effects of natural disasters on IPV acceptance based on Table 1. Dashed lines correspond to the 95% confidence interval. The results are for experiencing any natural disaster (extreme temperature, drought, earthquake, flood, landslide, (dry) mass movement, storm, and volcanic eruption). Each regression includes controls for age and its square, biological sex, latitude, longitude, a dummy for 2018, a dummy for not being born during the studied disaster period, and country fixed effects.
Source: Authors’ construction.

Natural disasters and IPV acceptance by gender.
Notes: The figure shows the estimated effects of natural disasters on IPV acceptance by gender based on Table 1. Dashed lines correspond to the 95% confidence interval. The results are for experiencing any natural disaster (extreme temperature, drought, earthquake, flood, landslide, (dry) mass movement, storm, and volcanic eruption). Each regression includes controls for age and its square, latitude, longitude, a dummy for 2018, a dummy for not being born during the studied disaster period, and country fixed effects.
Source: Authors’ construction.

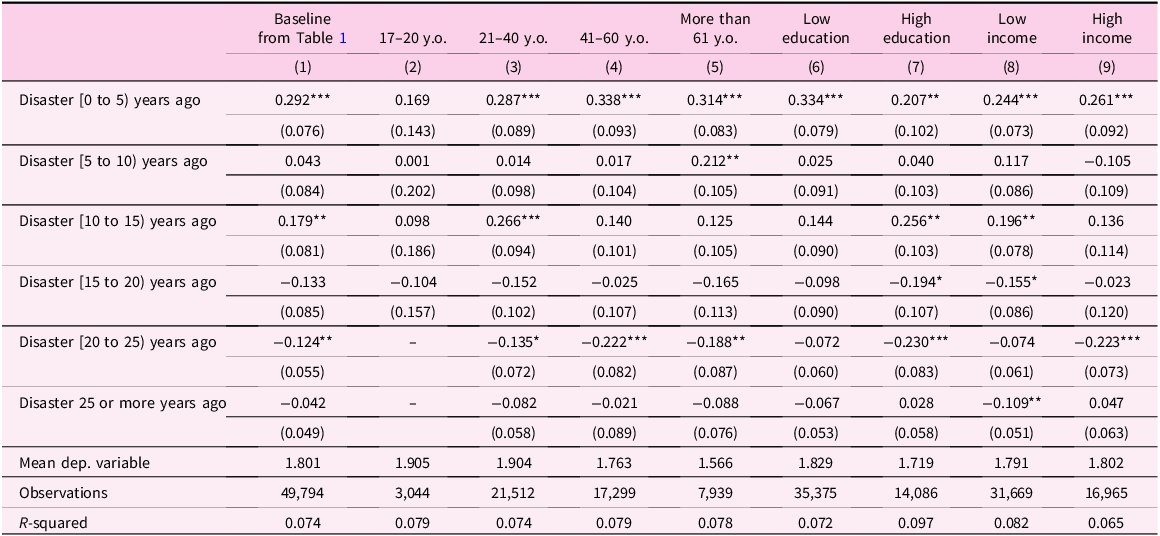
Next, we analyze the heterogeneity of our results by respondents’ socioeconomic characteristics. Table 2 presents the results. Compared to the baseline specification in Table 1, we find no effects for young individuals (ages 17 to 20) and stronger effects for older individuals (ages 41 to 60 and 61 years and older). Additionally, the effects are larger in magnitude for less-educated individuals than for more educated ones. The effects are similar in magnitude to the baseline specification for middle-aged individuals (ages 21 to 40) and for high- and low-income individuals. For these groups, the confidence intervals overlap with those in the baseline specification, indicating no statistically significant differences relative to the baseline specification.
Heterogeneity by socioeconomic characteristics
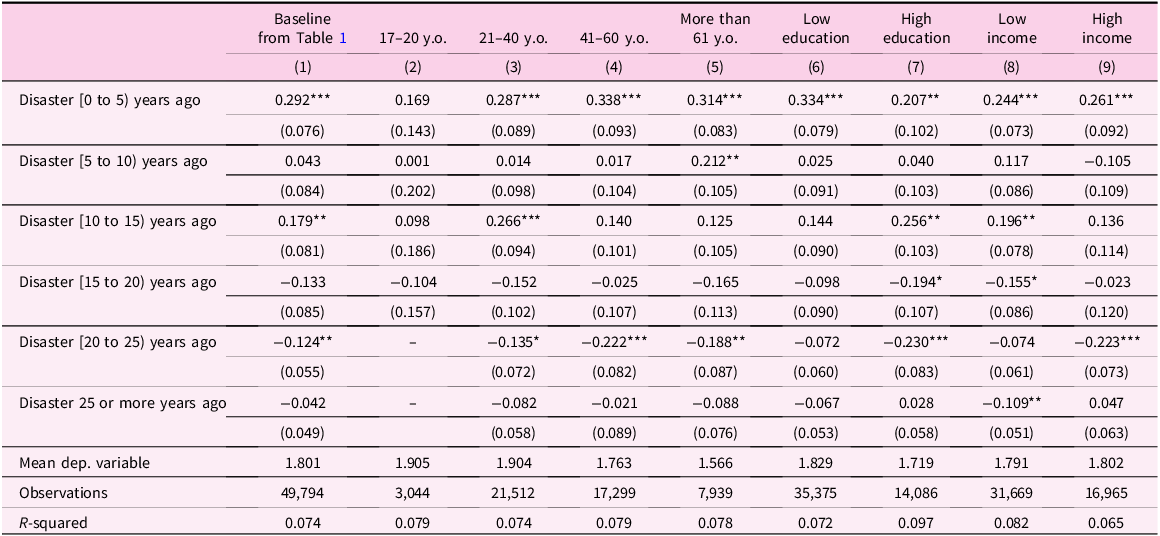
Table 2. Long description
The table presents data on the effects of disasters over different time periods across various age groups and socioeconomic characteristics. It has 9 columns and 10 rows, including the header row. The columns are labeled as follows: Baseline from Table 1, 17–20 y.o., 21–40 y.o., 41–60 y.o., More than 61 y.o., Low education, High education, Low income, and High income. The rows are labeled with different time periods since the disaster occurred: Disaster [0 to 5 years ago], Disaster [5 to 10 years ago], Disaster [10 to 15 years ago], Disaster [15 to 20 years ago], Disaster [20 to 25 years ago], Disaster 25 or more years ago, Mean dep. variable, Observations, and R-squared. Each cell contains a value with standard errors in parentheses. Notable trends include stronger effects for older individuals and less-educated individuals compared to the baseline specification.
Notes: The table shows the results for any natural disaster (extreme temperature, drought, earthquake, flood, landslide, (dry) mass movement, storm, and volcanic eruption). OLS results are reported. ***p < 0.01, **p < 0.05, *p < 0.1. Robust standard errors clustered at the region level are in parentheses. Each regression includes controls for age and its square, biological sex, latitude, longitude, a dummy for 2018, a dummy for not being born during the studied disaster period, and country fixed effects.
5.2. Robustness checks related to migration issues
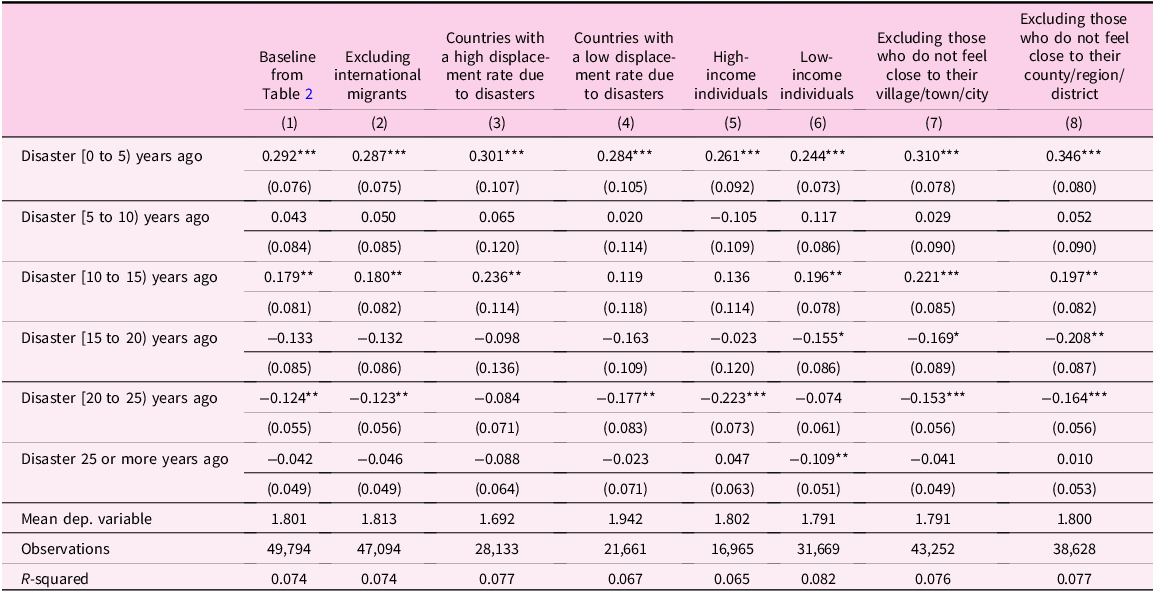
We conduct several robustness checks to ensure that migration issues do not affect our results. Table 3 presents the results of these robustness checks. First, we test that the results are not driven by the immigration of individuals who are more likely to justify IPV. For instance, international migrants may bring their values, cultural norms, habits, and experiences from the countries of their origin (e.g., Angelini et al., Reference Angelini, Casi and Corazzini2015; Galli & Russo, Reference Galli and Russo2019; Litina et al., Reference Litina, Moriconi and Zanaj2016; Norris & Inglehart, Reference Norris and Inglehart2012; Pavlik et al., Reference Bologna Pavlik, Lujan Padilla and Powell2019). If those attitudes and cultural traits are positively related to IPV acceptance, our results may overestimate the effects of natural disasters. To test whether this is the case, we exclude international migrants from the analysis sample and compare the results with the baseline. As shown in column 2 of Table 3, the results remain robust compared to the baseline model in Table 1. This alleviates concerns about the potential effects of immigration by individuals with a higher acceptance of IPV.
Robustness checks related to migration issues
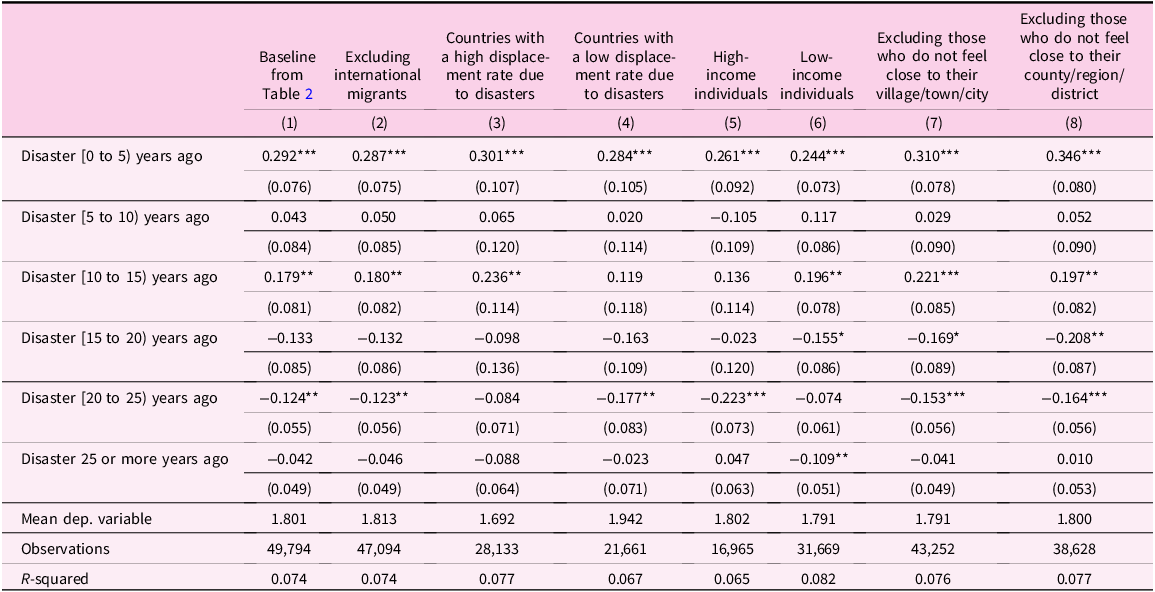
Table 3. Long description
The table presents data on the impact of disasters on migration issues across various scenarios. It has 8 columns and 11 rows, including headers and footers. The columns are labeled as follows: Baseline from Table 2, Excluding international migrants, Countries with a high displacement rate due to disasters, Countries with a low displacement rate due to disasters, High-income individuals, Low-income individuals, Excluding those who do not feel close to their village/town/city, and Excluding those who do not feel close to their country/region/district. The rows are labeled with different time frames for disasters: Disaster [0 to 5 years ago], Disaster [5 to 10 years ago], Disaster [10 to 15 years ago], Disaster [15 to 20 years ago], Disaster [20 to 25 years ago], Disaster 25 or more years ago, Mean dep. variable, Observations, and R-squared. Each cell contains numerical values representing the impact of disasters on migration issues under different scenarios. Notable trends include varying impacts of disasters over different time frames and across different groups.
Notes: The table shows the results for any type of natural disaster (extreme temperature, drought, earthquake, flood, landslide, (dry) mass movement, storm, and volcanic eruption). OLS results are reported. ***p < 0.01, **p < 0.05, *p < 0.1. Robust standard errors clustered at the region level are in parentheses. Each regression includes controls for age and its square, biological sex, latitude, longitude, a dummy for 2018, a dummy for not being born in the studied period of disaster, and country fixed effects.
Second, in response to natural disasters, individuals may either choose to migrate or be forced to migrate from disaster areas (see Berlemann & Steinhardt, Reference Berlemann and Friedrich Steinhardt2017; Boustan et al., Reference Boustan, Kahn and Rhode2012; Fan et al., Reference Fan, Fisher-Vanden and Allen Klaiber2018; Gröger & Zylberberg, Reference Gröger and Zylberberg2016; Mahajan & Yang, Reference Mahajan and Yang2020; McIntosh, Reference McIntosh2008; Sheldon & Zhan, Reference Sheldon and Zhan2022). If those who migrate from disaster-affected areas are also less likely to justify IPV, this may affect our results. Given that there is no information on internal migration in our sample, we can only test the issue of out-migration indirectly and do this in several ways: (1) divide the analysis sample into countries with high- and low-population displacement rates due to natural disasters; (2) compare the results for high- and low-income individuals, and (3) proxy for internal migration by attachment to the place of residence and test whether excluding those who are not attached to their locality or region affects our findings.
We first divide the analysis sample into countries with high and low rates of population displacement due to natural disasters.Footnote 11 In countries with high displacement rates, our results may more closely reflect the attitudes of those who remained in disaster-affected areas than those of the general population. That is, if stayers are selected based on specific unobservable individual characteristics that are also related to attitudes toward abuse, e.g., personality traits or cultural preferences, our results might be biased. Comparing columns 3 and 4 in Table 3, we see that this is not the case: the differences in coefficient estimates from 0 to 4 years after a disaster are not statistically significant because the confidence intervals overlap. The results also do not differ from the baseline specification in Table 1. Some differences are observed only regarding the longevity of the disaster’s effects. In countries with low rates of disaster-related displacement, the IPV-enforcing effects of disasters are not observed 4 years after the disaster. In addition, individuals in countries with low displacement rates become anti-IPV more quickly than those in countries with high displacement rates. However, these differences in estimates are likely related to the severity of disasters in those countries rather than to migration issues per se.
We then also compare the results for high- and low-income individuals (columns 5 and 6 in Table 3). A priori, it is unclear whether high- or low-income individuals are more likely to migrate from disaster-affected areas. On the one hand, “environmental migrants” are more likely to have higher incomes and be less financially constrained, since disasters increase liquidity constraints and fixed costs of migration (Drabo & Mbaye, Reference Drabo and Mously Mbaye2015; Gröger & Zylberberg, Reference Gröger and Zylberberg2016; Sheldon & Zhan, Reference Sheldon and Zhan2022). If they are also less likely to justify IPV, this may lead to an overestimation of the effect of natural disasters on attitudes toward IPV. However, several theoretical arguments may limit the potential effect of the emigration of high-income individuals with anti-IPV attitudes on our estimates. First, environmental factors may not be the primary drivers of migration decisions. Low-income individuals who seek better economic opportunities are also more likely to move out of the disaster area and to stay in host (non-disaster) destinations (Eyer et al., Reference Eyer, Dinterman, Miller and Rose2018; Fan et al., Reference Fan, Fisher-Vanden and Allen Klaiber2018; Goldbach, Reference Goldbach2017; Landry et al., Reference Landry, Bin, Hindsley, Whitehead and Wilson2007). Also, disaster-driven migration is often temporary, and many environmental migrants return in the short term (Groen & Polivka, Reference Groen and Polivka2010; Landry et al., Reference Landry, Bin, Hindsley, Whitehead and Wilson2007; Paxson & Rouse, Reference Paxson and Elena Rouse2008). Moreover, post-disaster reconstruction and public interventions may attract highly educated, high-income individuals to disaster locations (Boustan et al., Reference Boustan, Kahn and Rhode2012; Groen & Polivka, Reference Groen and Polivka2010). Low-income individuals may even be discouraged from returning to post-disaster locations (Groen & Polivka, Reference Groen and Polivka2010; Paxson & Rouse, Reference Paxson and Elena Rouse2008). In this case, our model will provide a lower bound on the effect of natural disasters on IPV acceptance.
In columns 5 and 6 of Table 3, we show that natural disasters affect high- and low-income individuals similarly, alleviating concerns about sample composition bias affecting our results. The results also do not statistically differ from the baseline specification in Table 1. While the emigration of high-income individuals who do not justify IPV might be an alternative explanation for our findings, the existing evidence on post-disaster migration and our robustness checks do not support it.
It might be that more socially disadvantaged populations are more likely to remain in disaster-prone areas because they cannot afford to live in areas with fewer shocks. If those population groups are also more likely to justify IPV, our results may overestimate the effects of natural disasters. To alleviate this concern, we examine whether results differ between high- and low-income individuals across regions with high and low disaster frequencies. The results are presented in Table A4 in the appendix. The confidence intervals of the estimate “Disaster [0 to 5) years ago” overlap, suggesting no statistical differences in the effects of experiencing a disaster in the past 5 years on the IPV acceptance of high- and low-income individuals in regions with a high disaster frequency (columns 6 and 7 in Table A4). We also find that 10 years after a disaster, high-income individuals in high-frequency areas are statistically more likely to justify IPV than low-income individuals in those areas, while 20 years after a disaster, low-income individuals are statistically less likely to justify IPV than high-income individuals in those areas. These findings suggest that potentially different location choices of high- and low-income individuals are unlikely to affect our estimates of the effects of natural disasters on IPV acceptance. The results also do not differ between high-income individuals in areas with different disaster frequencies (columns 6 and 8 in Table A4) and between low-income individuals in those areas (columns 7 and 9 in Table A4).
Finally, we exclude individuals who are not attached to their locality or region of residence, as they are more likely to migrate (Landry et al., Reference Landry, Bin, Hindsley, Whitehead and Wilson2007), and test whether this changes the results compared to the baseline specification. These results are presented in columns 7 and 8 of Table 3. In both cases, the confidence intervals overlap with those from the baseline specification, suggesting that potential out-migration from disaster-affected areas likely does not affect our estimates of the effects of natural disasters on IPV acceptance.Footnote 12
In summary, a battery of robustness checks suggests that potential changes in the sample composition due to the immigration or emigration of individuals with specific characteristics and potentially different IPV attitudes are unlikely to be the major explanation for our results.
5.3. Robustness checks related to the model specification
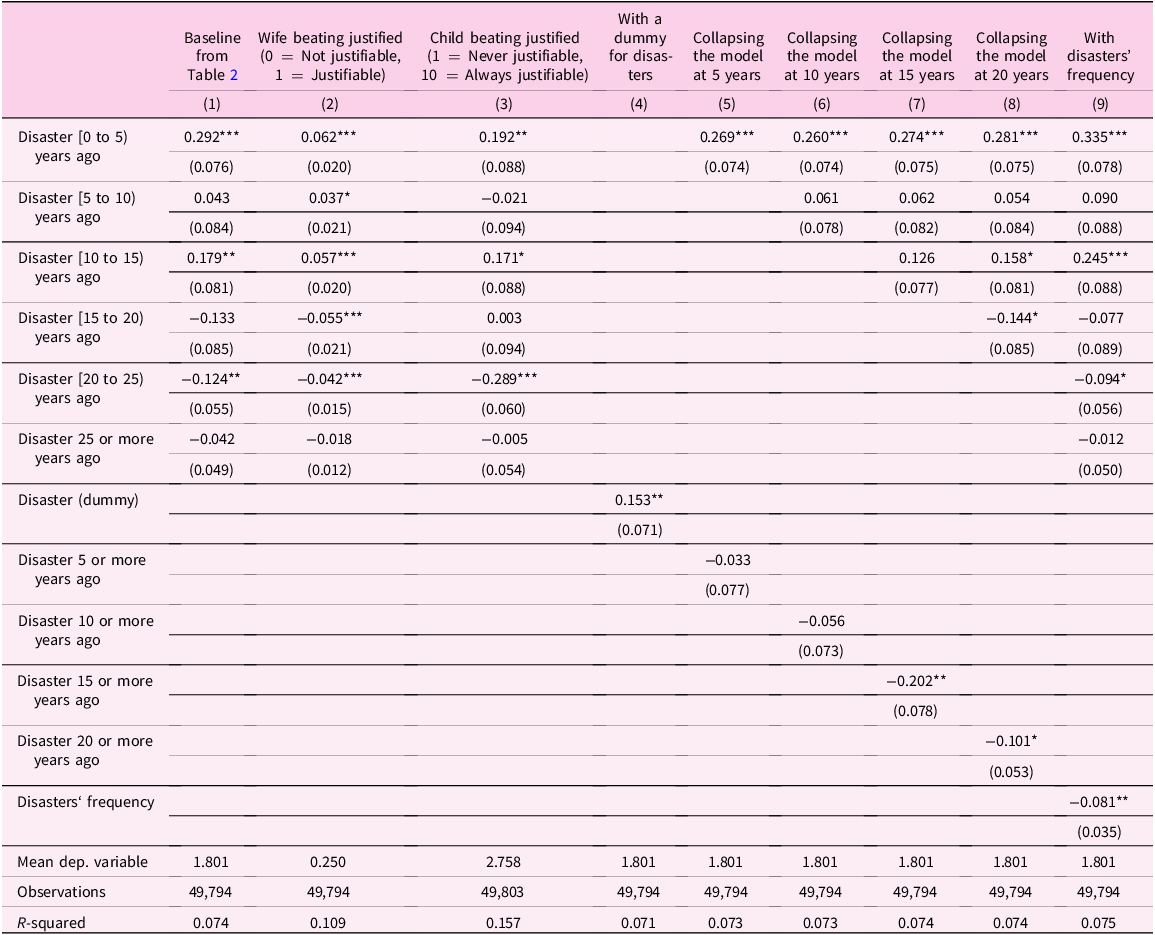
Next, we test whether the model specification influences our results (see Table 4). We first recode the dependent variable as a dummy that equals 1 if a respondent justifies the IPV and 0 if the respondent thinks the IPV is never justifiable. Compared with the baseline model in Table 1, the pattern of results remains similar (see column 2 in Table 4). When we then redefine disasters as a dummy equal to 1 if respondents experienced a disaster at any time in their lives and 0 otherwise (column 4 in Table 4), the disaster effect is quantitatively smaller than in the baseline model. This suggests that failing to account for the long-lasting effects of natural disasters may lead to underestimating their impact on individual attitudes and further justifies analyzing the dynamic impact of disasters.
Additional robustness checks

Table 4. Long description
The table presents data on the impact of disasters on attitudes towards intimate partner violence (IPV). It includes nine columns and multiple rows, with each row representing different time frames since a disaster occurred. The columns are labeled as follows: Baseline from Table 2, Wife beating justified, Child beating justified, With a dummy for disasters, Collapsing the model at 5 years, Collapsing the model at 10 years, Collapsing the model at 15 years, Collapsing the model at 20 years, and With disasters’ frequency. Each row provides values for these columns, indicating the effect of disasters on the justification of IPV. Notable trends include significant values for disasters occurring 0 to 5 years ago and 10 to 15 years ago, with varying impacts on the justification of wife beating and child beating. The table also includes a dummy variable for disasters and examines the frequency of disasters.
Notes: The table shows the results for any type of natural disaster (extreme temperature, drought, earthquake, flood, landslide, (dry) mass movement, storm, and volcanic eruption). OLS results are reported. ***p < 0.01, **p < 0.05, *p < 0.1. Robust standard errors clustered at the region level are in parentheses. Each regression includes controls for age and its square, biological sex, latitude, longitude, a dummy for 2018, and country fixed effects.
In addition, following the methodology proposed by Oster (Reference Oster2019), we examine whether unobservable factors affect our results in the model with a dummy variable for natural disasters presented in column 4 of Table 4. The findings suggest that the influence of unobservable factors would need to be at least 27.9 times higher to render the effect of natural disasters on IPV acceptance statistically insignificant. That is, unobserved factors are unlikely to affect our results.
In column 3 of Table 4, we also present results using an alternative dependent variable: acceptance of beating children. Compared to the IPV justification, the pattern of results remains similar, although the initial effect of natural disasters on the acceptance of beating children is quantitatively smaller than that of IPV.
In addition, we test whether the structure of our model design affects our results. To this end, we present findings that redefine the baseline model specification by including fewer periods post-disaster (columns 5–8 in Table 4 for 5, 10, 15, and 20 years post-disaster, respectively). As shown, the results in the baseline specification remain robust to such modifications.
We then include the frequency of disasters as an additional control in our model to account for potential anticipation effects. That is, we may expect that in areas with more frequent disasters, individuals may anticipate and become accustomed to them, implying that their effect on the IPV justification could be smaller in magnitude. As shown in column 9 in Table 4, the estimated effect of 0–5 years after a disaster is slightly larger in magnitude compared to the baseline, but the confidence intervals intersect, suggesting that the results remain robust to this model modification and controlling for the frequency of disasters does not alter the findings of the baseline model. In Figure A2, we also present simulations with a hypothetically increased frequency of disasters. With increased frequency, the effect of disasters remains stable, as confidence intervals intersect with the baseline specification in Table 1. However, we may still expect that more frequent disasters will spur adaptation, as suggested by the finding that disaster frequency, by itself, reduces the IPV acceptance (column 9 in Table 4).
We then check whether specific countries drive the results. To this end, we exclude one country from the sample at a time and estimate the baseline specification in Equation (1). The results in Figure A3 suggest that our findings are not sensitive to sample composition.
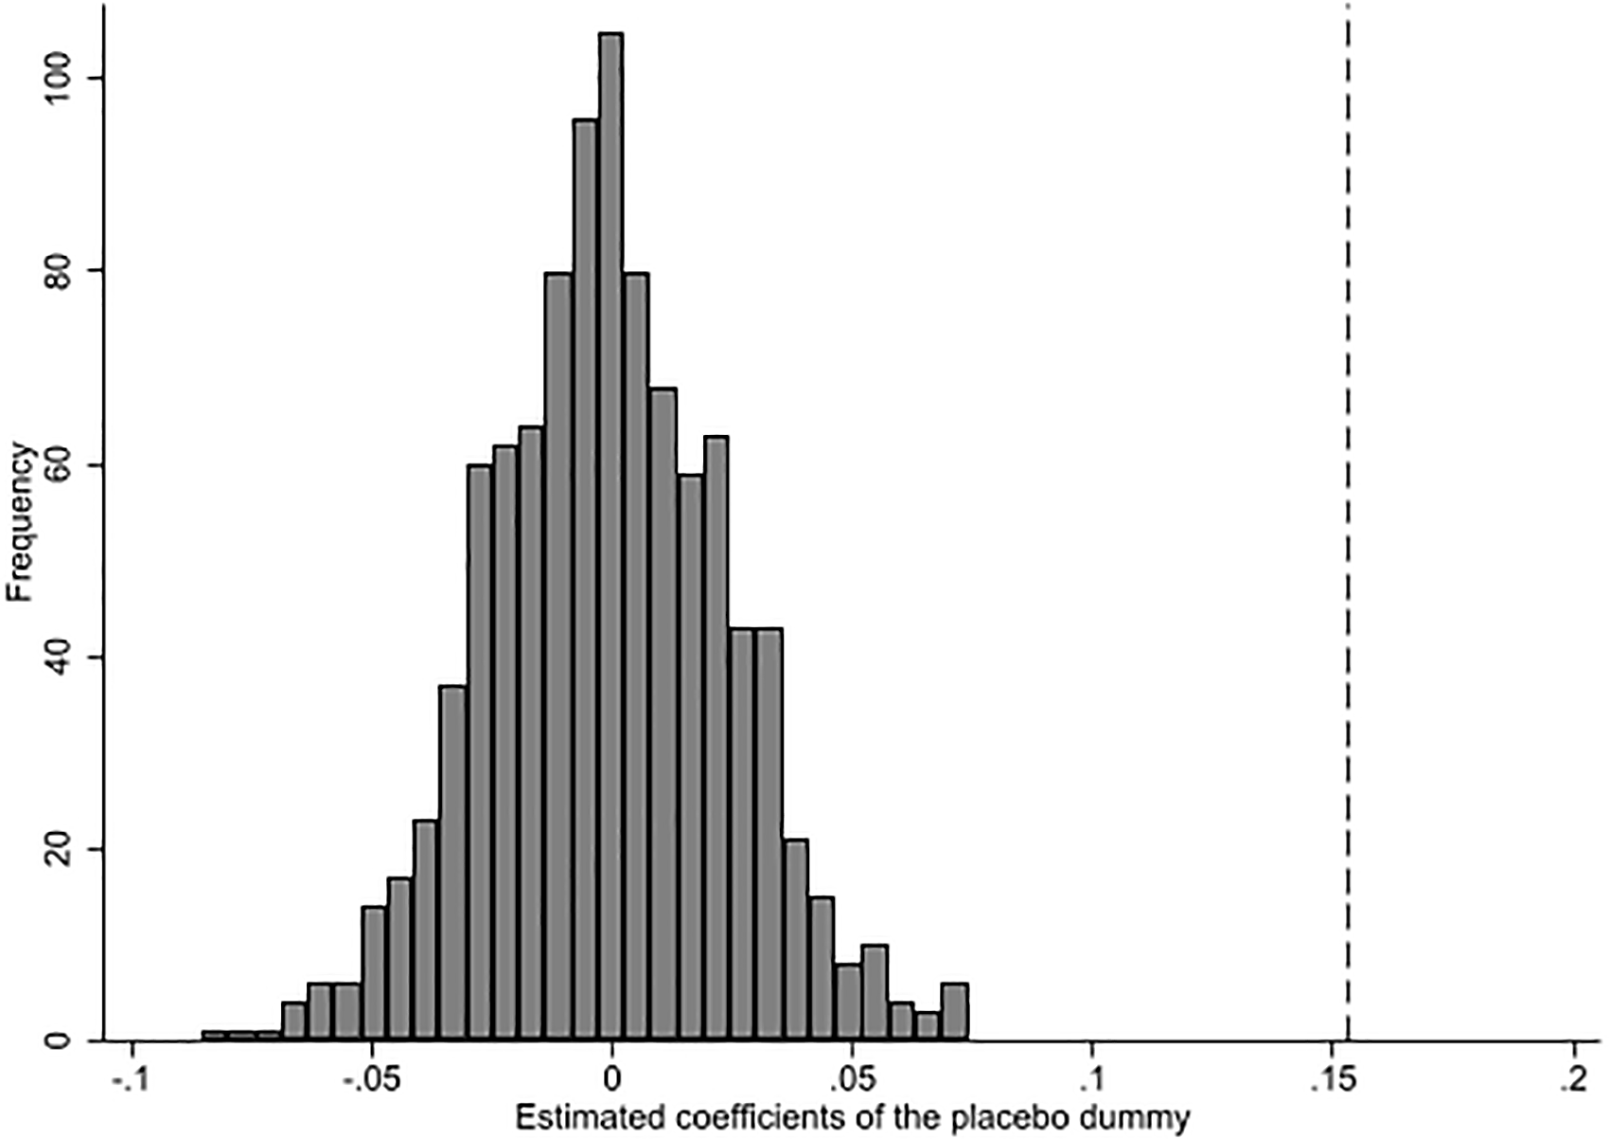
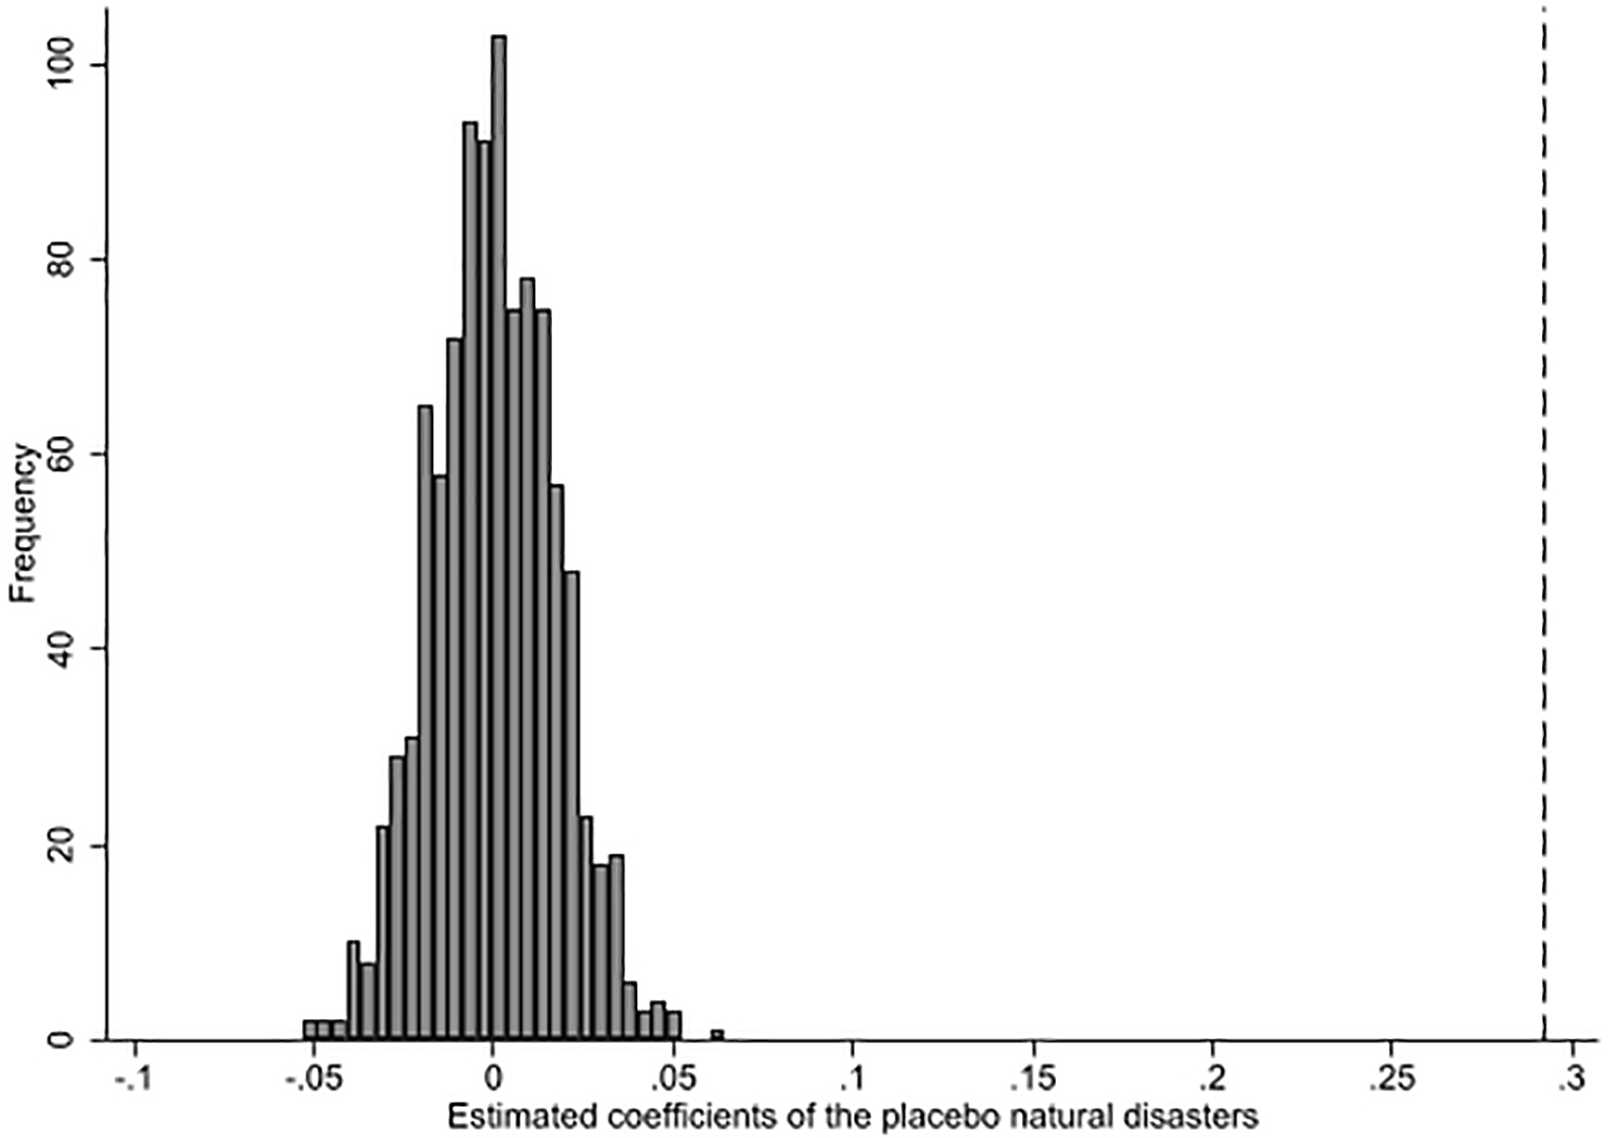
Finally, we run a falsification test by randomly assigning respondents to placebo natural-disaster locations and checking whether the placebo natural disasters affect IPV justification. Given our data structure, we are unable to formally test for pre-trends in our model, and this falsification test ensures that the actual treated and control groups differ only by disaster experience.Footnote 13 If placebo natural disasters also affect IPV acceptance, this may imply that the treatment effect of disasters we find in our baseline model is attributable to other differences between the treatment and control groups rather than to the actual disaster experience. That is, the pre-trend assumption may be violated in this case. Figure 4 shows that the impact of experiencing a placebo natural disaster (defined as a dummy variable) is centered around zero and is statistically significant in only 6% of 1,000 simulations. Corresponding simulations for the effects of placebo natural disasters [0–5) years ago are presented in Figure 5 and yield similar results. These falsification tests support our model identification and reassure that our baseline results are not a data artifact.
Distribution of the estimated effect of placebo natural disasters on IPV acceptance.
Notes: The figure shows the estimated effects of placebo natural disasters on IPV acceptance based on 1,000 simulations, assigning respondents to locations where no actual disaster happened. The dashed line corresponds to the effect of natural disasters measured as a dummy (column 4 in Table 4). The results are for experiencing any type of natural disaster (extreme temperature, drought, earthquake, flood, landslide, (dry) mass movement, storm, and volcanic eruption). Each regression includes controls for age and its square, biological sex, latitude, longitude, a dummy for 2018, a dummy for not being born in the studied period of disaster, and country fixed effects.
Source: Authors’ construction.

Distribution of the estimated effect of placebo natural disasters [0–5) years ago on IPV acceptance.
Notes: The figure shows the estimated effects of placebo natural disasters [0–5) years ago on IPV acceptance based on 1,000 simulations, assigning respondents to locations where no actual disaster happened. The dashed line corresponds to the baseline effect of natural disasters (column 1 in Table 1). The results are for experiencing any type of natural disaster (extreme temperature, drought, earthquake, flood, landslide, (dry) mass movement, storm, and volcanic eruption). Each regression includes controls for age and its square, biological sex, latitude, longitude, a dummy for 2018, a dummy for not being born in the studied period of disaster, and country fixed effects.
Source: Authors’ construction.

5.4. Mechanisms
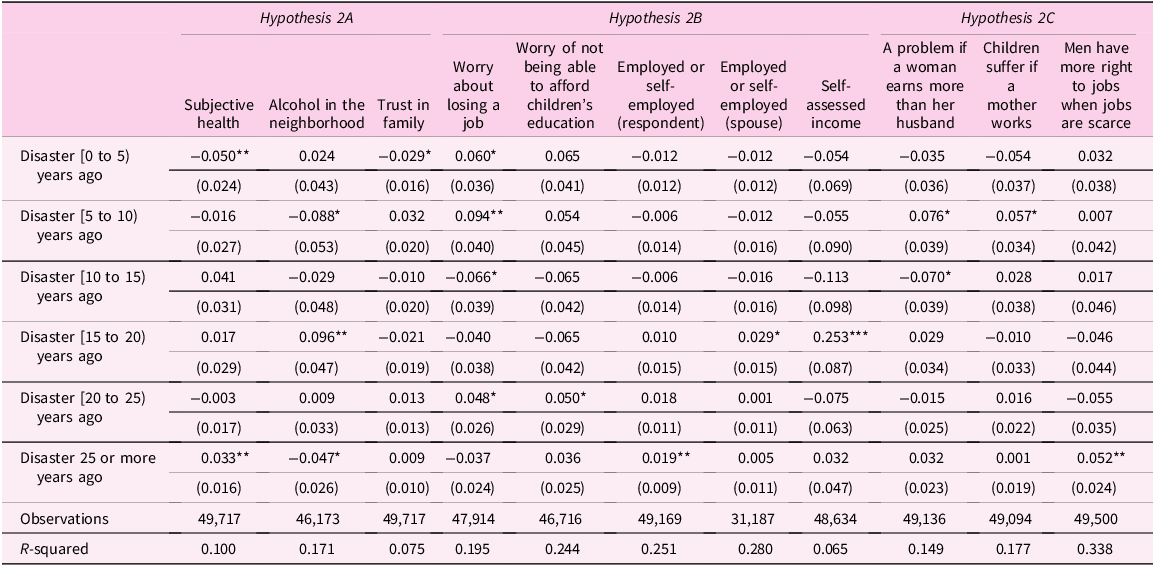
Table 5 presents the results of testing specific mechanisms behind the relationship between natural disasters and IPV acceptance. As shown in panel (1) of Table 5, in the short run, natural disasters lead to subjective health and family trust deterioration. This supports the theories of expressive violence, implying that natural disasters may lead to psychological distress, increasing the likelihood of intrahousehold conflicts. Importantly, this short-run deterioration in subjective health and family trust coincides with the largest and most significant increase in IPV acceptance documented in Table 1 (the 0–5-year window), lending support to the psychological distress channel as a potential driver of the main result. Regarding alcohol consumption, we find no short-run effect of natural disasters, whereas in the medium- and long-run (5 to 10 and more than 25 years after a disaster), alcohol consumption decreases. The observed reductions in alcohol consumption may reflect resource constraints and reduced purchasing power following disasters, or a community-level suppression of alcohol use as households seek to stabilize under prolonged adversity. While context-specific studies such as Barros and Xu (Reference Barros and Xu2025) document a positive role for alcohol in the disaster–IPV relationship in Peru, our global evidence does not replicate this finding at the aggregate level. Hypothesis 2A therefore receives support through the subjective health and family trust sub-components, but not through the alcohol channel.
Mechanisms

Table 5. Long description
The table presents data on the impact of natural disasters on various social and economic factors over different time periods. It includes columns for subjective health, alcohol in the neighborhood, trust in family, worry about losing a job, worry of not being able to afford children’s education, employed or self-employed (respondent), employed or self-employed (spouse), self-assessed income, a problem if a woman earns more than her husband, children suffer if a mother works, and men have more right to jobs when jobs are scarce. The rows are categorized by the time since the disaster occurred, ranging from 0 to 5 years ago to 25 or more years ago. Each cell contains a value representing the impact, with standard errors in parentheses. Notable trends include the deterioration of subjective health and family trust in the short run, a decrease in alcohol consumption in the medium and long run, and varying impacts on employment and income over different time periods.
Notes: The table shows the results for any natural disaster (extreme temperature, drought, earthquake, flood, landslide, (dry) mass movement, storm, and volcanic eruption). OLS results are reported. ***p < 0.01, **p < 0.05, *p < 0.1. Robust standard errors clustered at the region level are in parentheses. Each regression includes controls for age and its square, biological sex, latitude, longitude, a dummy for 2018, a dummy for not being born during the studied disaster period, and country fixed effects. See Table A1 for variable definitions.
Panel (2) of Table 5 shows the results of testing Hypothesis 2B. In line with the hypothesis, natural disasters increase the fear of losing employment. This effect is long-lasting: the fears are alleviated only in the medium run (10 to 15 years after a disaster), suggesting that natural disasters increase feelings of economic insecurity, which may, in turn, facilitate acceptance of IPV. Interestingly, this effect operates through anticipated rather than realized economic hardship. In the short- and medium-run, we find no effects of disasters on respondents’ actual employment, their spouses’ employment, and their self-assessed household income. However, positive changes in the household’s economic situation occur only 15 years or more after the disaster. Hence, these results suggest that subjective economic uncertainty can be an important driver of increased IPV acceptance in the aftermath of disasters.
In panel (3) of Table 5, we show the results of testing Hypothesis 2C. Beyond the psychological and economic channels, disasters may also reshape the cultural norms, triggering the revival of traditional gender roles that normalize male authority and the use of violence to enforce it. We find no support for this hypothesis in the short run. However, in the medium-run (5 to 10 years after a disaster) and long-run (25 or more years post-disaster), natural disasters may still reinforce traditional gender norms and thus lead to IPV. This aligns with the literature, suggesting that social and cultural norms are slowly changing. The medium-run shift toward traditional gender norms precedes the second elevated window of IPV acceptance observed in Table 1 (the 10–15-year period), suggesting that gradually consolidating changes in gender norms may feed into IPV acceptance with a lag, even as the initial psychological distress has largely dissipated.
In sum, we find that natural disasters are likely to trigger psychological distress and economic insecurity fears that, in turn, lead to an increase in IPV acceptance. The psychological distress channel, captured through subjective health and family trust, appears in the short run, aligning with expressive violence theories that emphasize the role of frustration and emotional cues in precipitating IPV. The economic insecurity channel operates primarily through heightened fear of job loss rather than realized income or employment losses, suggesting that uncertainty and anticipated deprivation can be behaviorally consequential independently of actual adverse outcomes. The gender norms channel could be at work in the medium and long run, since norm change unfolds slowly and may consolidate as communities revert to traditional structures in the face of prolonged adversity.
6. Conclusion
This paper documents the long-lasting effects of natural disasters on the acceptance of IPV. Compared to individuals in localities with no natural disasters, those living in disaster localities are more likely to accept IPV up to 15 years after a disaster. These findings can be explained by deterioration in subjective health and family trust, and by fears of household economic insecurity in the aftermath of disasters.
These findings have several implications. First, the effects of natural disasters on IPV attitudes that we document are likely to reflect increases in the actual IPV incidence. Indeed, as Heise and Kotsadam (Reference Heise and Kotsadam2015) show, the presence of norms that justify IPV is a significant predictor of IPV occurrence among individuals. Thus, providing psychological, legal, and medical support to residents in post-disaster areas is as important as post-disaster reconstruction and the mitigation of economic damage. Second, beyond economic damages, our study suggests that natural disasters may durably shape individual attitudes. Thus, given that the frequency and severity of natural disasters are likely to increase globally due to climate change, targeted IPV prevention measures should be designed to educate and empower vulnerable population groups.
Third, our findings carry direct implications for climate adaptation policies, particularly in contexts characterized by fragile or contested gender norms. Climate adaptation strategies, including disaster preparedness plans, post-disaster reconstruction programs, and resilience-building initiatives, should explicitly incorporate a gender-sensitive dimension that addresses the heightened risk of IPV in the aftermath of extreme events. In societies where gender norms are already susceptible to reversal towards more traditional, male-dominant arrangements under conditions of stress and scarcity, generic adaptation measures risk inadvertently reinforcing the social conditions that enable IPV. Integrating IPV prevention into climate adaptation frameworks, for instance, through community-based awareness programs, support for women’s economic autonomy, and gender-responsive resource allocation in disaster relief, is thus not only a welfare imperative but also a structural contribution to building more resilient and equitable communities in the face of increasing climate risks.
Our study opens several avenues for future research. First, while we contribute to understanding the societal implications of natural disasters globally by focusing on IPV attitudes, the consequences of climate change for individual attitudes and preferences are likely to be even broader, affecting various spheres of life. Thus, a multidisciplinary approach is needed to examine the consequences of disasters and to design prevention, adaptation, and mitigation measures. Second, our focus in this paper is on the endorsement of physical violence against women (and children), whereas natural disasters are likely to affect other forms of violence against these, as well as other groups in society, including emotional and sexual violence, femicide, or controlling behaviors. Understanding the impact of natural disasters on a wider spectrum of violence and the associated norms is an important direction for future research. Third, we have offered insights into the likely mechanisms underlying the relationship between natural disasters and the endorsement of physical IPV. However, our investigation relies on proxies within the limits of our dataset and is constrained in its ability to offer formal, comprehensive tests of different theories of violence and their predictions. Moving beyond this limitation will require detailed datasets to capture and identify the specific pathways of the effect of natural disasters on violence against women, including granular individual- and household-level data on alcohol consumption, mental health trajectories, intra-household bargaining, and gender norm evolution across disaster contexts.
Supplementary material
The supplementary material for this article can be found at https://doi.org/10.1017/dem.2026.10026.
Acknowledgements
All views expressed in this paper are those of the authors and do not represent the official views of organizations with which the authors are affiliated. We thank Ioannis Tzimas, Zahra Jamal, Carolin Schneider, and Richard Dwumfour for research assistance. Part of this paper was written while Vladimir Otrachshenko was a Senior Researcher at the Center for International Development and Environmental Research (ZEU) at the Justus-Liebig-University, Giessen, Germany.
Author contributions
Astghik Mavisakalyan: Conceptualization; Writing – Original Draft Preparation; Writing – Review & Editing. Vladimir Otrachshenko: Conceptualization; Data Curation; Formal Analysis; Methodology; Writing – Original Draft Preparation; Writing – Review & Editing. Olga Popova: Conceptualization; Data Curation; Methodology; Writing – Original Draft Preparation; Writing – Review & Editing.
Funding statement
Astghik Mavisakalyan receives funding from the Australian Government through the Australian Research Council Centre of Excellence for the Elimination of Violence Against Women (Project No. CE230100004).
Competing interests
The authors have no conflicts of interest to report.


 Open access

