1. Introduction
Laminar–turbulent transition control is one of the crucial issues in the design of future super/hypersonic vehicles, which has attracted ever-growing interest over several decades (Chernyshev, Kiselev & Kuryachii Reference Chernyshev, Kiselev and Kuryachii2011; Fedorov Reference Fedorov2011). Distinctions between laminar and turbulent flow include but are not limited to skin friction coefficient, heat transfer rate and the ability to resist flow separation, which result in significant differences in flight performance. Consequently, depending on the application background, either delaying the onset of turbulence or forcing boundary layer transition is required. The aim of transition delay is to reduce the frictional drag or surface heat transfer, which can enhance the economy and security of the aircraft. However, in some specific scenarios, such as the scramjet inlet (Berry et al. Reference Berry, Daryabeigi, Wurster and Bittner2010), the shock-induced flow separation in the inlet cowl lip will obstruct mass flow capture. Thus, in order to secure the normal start of supersonic intake, techniques of forcing boundary-layer transition are needed to suppress the shock induced flow separation in such a case.
In the past several decades, several passive and active methods have been proposed to force the boundary-layer transition, including discrete roughness elements (Corke et al. Reference Corke, Arndt, Matlis and Semper2018), vortex generators (Verma & Chidambaranathan Reference Verma and Chidambaranathan2015, Reference Verma and Chidambaranathan2017), suction and blowing (Sharma et al. Reference Sharma, Shadloo, Hadjadj and Kloker2019; Sun et al. Reference Sun, Qu, Liu, Yao and Bai2020), wall perturbation and air jets (Lysenko et al. Reference Lysenko, Gaponov, Smorodsky, Yermolaev and Kosinov2019). Although some of these methods have already been applied in practical engineering, the drawbacks are obvious. For example, the operation system of suction and blowing is complex and expensive, which trades off its benefits (Babinsky & Ogawa Reference Babinsky and Ogawa2008). Similarly, vortex generators will inevitably introduce parasitic drag especially in the off-design condition (Panaras & Lu Reference Panaras and Lu2015). Therefore, advanced boundary-layer transition control methods with a simple structure and less form drag need to be developed urgently.
Plasma actuators, characterized by a simple geometry, fast response time and wide-band operating frequency, overcome the issues faced by the previous passive flow control devices, and thus have attracted widespread attention from the flow control community (Cattafesta & Sheplak Reference Cattafesta and Sheplak2011; Starikovskiy & Aleksandrov Reference Starikovskiy and Aleksandrov2021). Actually, plenty of research has been carried out to control flow transition with plasma actuators (Dorr & Kloker Reference Dorr and Kloker2016; Yadala et al. Reference Yadala, Hehner, Serpieri, Benard, Dorr, Kloker and Kotsonis2018). In the case of a subsonic boundary layer, major attention is focused on delaying the transition location to achieve turbulent drag reduction, and Thomas et al. (Reference Thomas, Corke, Duong, Midya and Yates2019) has made significant progress in this field over the past several years. Similar needs are also valid for supersonic and hypersonic flows, for the purpose of reducing both the friction drag and thermal loads on the aircraft surface (Schuele, Corke & Matlis Reference Schuele, Corke and Matlis2013). As for shock-induced flow separation control with plasma actuators, two strategies can be deployed: one to control the shock wave/boundary layer interaction (SWBLI) itself to manipulate the shock wave, which has been proven effective by extensive investigations (Webb, Clifford & Samimy Reference Webb, Clifford and Samimy2013; Kinefuchi, Starikovskiy & Miles Reference Kinefuchi, Starikovskiy and Miles2017; Deshpande & Poggie Reference Deshpande and Poggie2018; Tang et al. Reference Tang, Wu, Guo, Sun and Luo2020b), and the other to force the upstream boundary-layer transition, which is studied insufficiently.
Earlier studies attempted to use glow plasma discharge to promote flow transition in supersonic (Yatskikh et al. Reference Yatskikh, Ermolaev, Kosinov and Semionov2015) and hypersonic flow (Li, Zhang & Lee Reference Li, Zhang and Lee2020; Zhang, Li & Lee Reference Zhang, Li and Lee2020). However, attention was placed on the development of unstable modes triggered by discharge, and plasma actuation was never used as a direct method to introduce sufficiently strong disturbances which force boundary-layer transition in a short distance. To date, only Polivanova & Sidorenko (Reference Polivanova and Sidorenko2018) have tried to utilize spark discharge triggered flow transition as a mean to suppress laminar flow separation. Although promising results have been demonstrated in terms of the variation of separated flow, the physics pertaining to plasma-induced laminar–turbulent transition remains unclear.
To fill the above knowledge gap, this paper performs an experimental investigation on supersonic flat-plate boundary-layer tripping using a spanwise pulsed spark discharge array (SP-PSDA) operated at 8 kHz. Nanoparticle planar laser scattering (NPLS) measurements are performed in the  $x$–
 $y$ plane and
 $x$–
 $z$ plane, respectively, to visualize the control effect of SP-PSDA. Section 2 provides the details about the experimental set-up and measurement schemes. Baseline and controlled flows of a Mach 3.0 flat-plate boundary layer are introduced in § 3.1, which includes the temporal evolution of the supersonic boundary layer in side and top view, respectively. The hairpin vortex packets evolved from plasma-induced structures are further analysed in detail in § 3.2, and a conceptual model is proposed to reveal the hairpin vortex generation process.
2. Methodology
2.1. Experimental set-up
The experiments are conducted in a Mach 3.0 wind tunnel at the National University of Defense Technology, China, with a typical free-stream turbulence level of less than 2 % (He et al. Reference He, Yi, Zhao, Tian and Chen2011). The wind tunnel is operated in suction-type mode with a unit Reynolds number of  $7.49\times 10^{6}\,\textrm {m}^{-1}$, and other details of incoming flow parameters are listed in table 1. A smooth flat-plate model with a length of
 $L=200\,\textrm {mm}$ and a width of
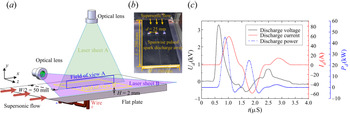
 $W=100\,\textrm {mm}$ is employed, resulting in a laminar boundary-layer flow with zero pressure gradient. The schematic of the experimental set-up is illustrated in figure 1(a). The NPLS technique, details of which will be introduced in the next subsection, is used to visualize the subtle flow structure of the boundary layer in the present study. Two orthogonal laser sheets with a thickness of approximately 0.5 mm, namely laser sheets A and B, are used to obtain the NPLS images in the
 $x$–
 $y$ plane and
 $x$–
 $z$ plane, where the regions of interest are indicated by blue and yellow boxes, respectively. The field of view A (FOV A) with dimensions of
 $98\times 65\,\textrm {mm}^{2}$ reflects the flow structures in the midspan
 $x - y$ plane of the test model, and the field of view B (FOV B) with dimensions of
 $131\times 88\,\textrm {mm}^{2}$ reflects the flow structures in the streamwise–spanwise plane at a height of
 $H=2\,\textrm {mm}$ from the flat surface.
Main parameters of the incoming flow;  $Ma_{\infty }$,
 $Re/m$,
 $U_{\infty }$,
 $\rho$,
 $P_0$,
 $T_0$,
 $P_s$ and
 $T_s$ stand for the free-stream Mach number, the unit Reynolds number, the free-stream velocity, the free-stream density, the total pressure, the total temperature and the static pressure and temperature.

(a) Schematic of the experimental set-up for NPLS measurements. (b) Discharge image of the spanwise plasma actuator array. (c) Representative discharge waveform in one cycle.

A spanwise array of three pulsed spark discharge plasma actuators are mounted 80 mm downstream of the flat-plate leading edge to force boundary-layer transition. In order to ensure the two-dimensional features of the actuated flow field, the spanwise spacing between adjacent actuators is set as 25 mm to divide the flat plate equally. Each actuator contains two copper electrodes (1 mm diameter), which have a gap of 5 mm and are flush mounted on the flat surface to avoid additional disturbances input. Note that for short-time supersonic wind tunnel tests of the order of several seconds, copper electrodes have been widely used by researchers (Yatskikh et al. Reference Yatskikh, Ermolaev, Kosinov and Semionov2015; Polivanova & Sidorenko Reference Polivanova and Sidorenko2018), and no noticeable erosion/oxidation were found in this experiment. The plasma actuator array is connected in series by the red wires and driven by one parameterized nanosecond high-voltage pulsed power. Once the applied voltage reaches the breakdown voltage, the three discharge channels will be bridged quickly. The actual discharge picture of the SP-PSDA is displayed in figure 1(b).
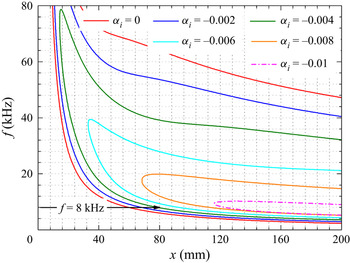
Linear stability theory (LST) is invoked to determine the optimal actuation frequency of the plasma actuator array, and the solver used to compute the amplification rate ( $\alpha _{i}$) has been developed by Wang et al. (Reference Wang, Li, Liu and Li2020). For a fixed spanwise wavenumber as defined by the spanwise spacing of the actuator array, i.e.
 $\beta =2{\rm \pi} /25\,\textrm {mm}\approx 0.25\,\textrm {mm}^{-1}$, the contour of
 $\alpha _{i}$ for different actuation frequencies and streamwise positions is shown in figure 2. The contour level of
 $\alpha _{i}=0$ represents the neutral curve of the first mode instability wave. As evident, only if the disturbance frequency is greater than 6 kHz will the instability of boundary layer be amplified immediately at the actuation location of
 $x=80$ mm. Moreover, as the frequency increases from 6 to 14 kHz, the amplification rate grows. However, considering the performance of our power supply will severely degrade at above 10 kHz due to an insufficient recharging time of the internal capacitors (Tang et al. Reference Tang, Wu, Guo, Liang and Luo2020a), the actuation frequency is fixed as 8 kHz in this paper.
Contour of constant amplification rate  $\alpha _{i}$ obtained from LST.

The representative electrical waveform in one discharge cycle is acquired by the high-voltage probe (Tektronix P6015A) and current monitor (Pearson 6585), as shown in figure 1(c). The maximum breakdown voltage  $U_d$ and peak discharge current
 $I_d$ are 3.25 kV and 58.7 A, respectively. Note that the electrical waveform oscillation is attributed to the characteristics of the RLC series circuit (Belinger et al. Reference Belinger, Naude, Cambronne and Caruana2014). Furthermore, the discharge power was also calculated by integrating the product of the voltage and current waveforms. It can be found that the peak discharge power is 45.2 kW and the effective discharge duration of one cycle is approximately
 $2\,\mathrm {\mu }\textrm {s}$, resulting in a total energy deposition of approximately 20 mJ in one single pulse. Thus, the average power of the SP-PSDA is 160 W.
2.2. NPLS measurement system
The NPLS, serving as a novel contactless optical measurement technique, is adopted for flow visualization in this paper. By recording the scattered light intensity, which is in proportion to the local particle concentration, NPLS to some extent reflects the density variation of the flow field (Zhao et al. Reference Zhao, Yi, Tian and Cheng2009) and is specialized to the visualization of fine flow structures. Due to its noticeable advantages of high spatial-temporal resolution and high signal-to-noise ratio, the NPLS method has been successfully applied by several super/hypersonic researchers (Zhuang et al. Reference Zhuang, Tan, Huang, Liu and Zhang2018a, Reference Zhuang, Tan, Wang, Li and Guo2019) in recent years, and its working principle and technical validation have been demonstrated in detail by Zhao et al. (Reference Zhao, Yi, Tian and Cheng2009).
In this experiment, the NPLS measurement system is comprised of a Q-switched dual-cavity Nd:YAG laser (Beamtech Vlite-Extra), a CCD camera (IMPERX E11M5), a  $\textrm {TiO}_2$ nanoparticle generator and a synchronous controller. The pulsed laser has a wavelength of 532 mm with a maximum pulse energy of 520 mJ, and the width of pulse duration is 6 ns, which indicates that the exposure time of the camera is short enough to freeze the flow structures with a minimum time averaging effect. The CCD camera with the full-frame sensors of 10.68 megapixels (
 $4000\times 2672$) operated at a sampling frequency of 2 Hz. Simultaneously, a Sigma Macro 105 mm prime lens is mounted on the camera to obtain the close-up view of the regions of interest, namely FOV A and FOV B, resulting in a final spatial resolution of
 $24.4\,\mathrm {\mu }\textrm {m}\,\textrm {pixel}^{-1}$ and
 $32.5\,\mathrm {\mu }\textrm {m}\,\textrm {pixel}^{-1}$, respectively. Additionally, a particle generator is used to produce the nano-level tracer particles
 $\textrm {TiO}_2$, whose following characteristic has been validated by Zhao et al. (Reference Zhao, Yi, Tian and Cheng2009). A programmable timing unit is used to synchronize the time series of the whole measurement system.
3. Results
3.1. Evolution of the supersonic boundary layer after plasma actuation
NPLS images in the  $x$–
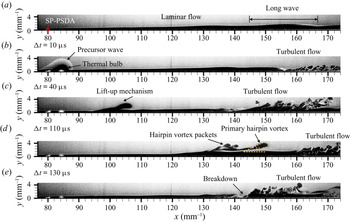
 $y$ plane are first captured to reveal the laminar–turbulent transition process with and without actuation. Figure 3(a) shows the natural transition process of a supersonic laminar boundary layer in baseline. In the side view of the centreline ranging from
 $x=80$ to
 $x=170$ mm, it can be found that the breakdown of the boundary layer to turbulence does not occur. Although long-wave structures, which may result from the boundary-layer instability due to free-stream turbulence, are observed at the end of the shooting region in the baseline case, the supersonic boundary layer still holds a laminar state. Additionally, as indicated by the red arrows, the plasma actuator array is located at
 $x=80$ mm, where the boundary-layer thickness is approximately
 $\delta =0.8$ mm.
Temporal evolution of the supersonic boundary layer under SP-PSDA actuation in the  $x$–
 $y$ plane (FOV A). (a) Baseline. (b–e) Actuation. The plasma actuator array is located at
 $x=80$ mm as the red arrows shown.

Then, based on the unsteady characteristics of plasma actuation, four characteristic phases after actuation are selected to form the pseudo-time sequence of the evolution of boundary-layer transition, namely figure 3(b–e). The corresponding time level is also given, which is estimated by dividing the streamwise propagation distance of the thermal bulb by the flow velocity. It is obvious that the objective of the forced boundary-layer transition has been well achieved under SP-PSDA actuation. The turbulent flow, which did not occur in figure 3(a), is obviously observed in figure 3(b–e). The transition point could be moved to  $x=140$ mm in the best case. More importantly, the control mechanism of the SP-PSDA is revealed through the fine visualization of the flow field evolution.
As the plasma actuator array switched on, it can be observed first that the typical plasma-induced structures are generated in figure 3(b), including the precursor wave and thermal bulb, which still clings to the wall surface at  $\Delta t = 10\ {\rm \mu}{\rm s}$. Then, attributed to the lift-up mechanism (Kline et al. Reference Kline, Reynolds, Schraub and Runstadler1967), the head of the thermal bulb gradually lifts from the flat-plate surface in the process of travelling downstream. Under the strong shear force of the wall, the velocity propagation of the head is faster than the bottom portion of the thermal bulb, resulting in the further stretching of the head and producing the primary hairpin vortex. Based on figure 3(d), the head of the primary hairpin vortex displays a locus inclined at approximately
 $30^{\circ }$ to the plate wall, which in good agreement with the conclusion published by Zhou et al. (Reference Zhou, Adrian, Balachandar and Kendall1999). Moreover, the hairpin vortex packets are further produced following the primary hairpin vortex, which conforms to the evolution law of hairpin vortex structures in the later stage of the laminar–turbulent transition. What is more, the appearance of the hairpin vortex packets indicates the intense momentum exchange inside the boundary layer, which will accelerate the laminar–turbulent transition process. Eventually, the sudden breakdown of laminar flow to turbulence happens, as shown in figure 3(e). It can be concluded that the hairpin vortex packets evolved from the thermal bulb play a vital role in laminar breakdown to turbulence control.
In order to further investigate the relationship between the subtle flow structures induced by SP-PSDA and the breakdown of the supersonic boundary layer, the NPLS images in the  $x$–
 $z$ plane are captured to obtain the top view of the flow structure evolution, whose FOV ranges from
 $x=80$ to
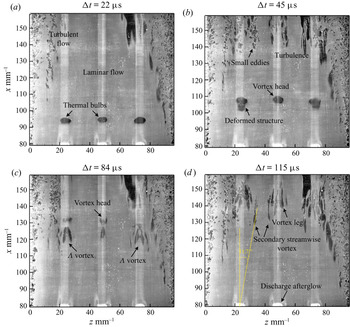
 $x=160$ mm in the streamwise direction. Similarly, four characteristic phases after plasma actuation are selected to display the complete boundary-layer tripping process (see figure 4a–d).
Laminar–turbulent transition process under SP-PSDA in the  $x$–
 $z$ plane (FOV B).

Based on the top view at a height of  $H=2$ mm, it can be found that the state of the boundary layer exhibits obvious spanwise inhomogeneity. The middle region with no vortex structures indicates a laminar flow state, whereas in the vicinity of plate lateral edges, turbulent flow is presented. The trigger of turbulence on both sides of the model is attributed to the sharp leading edge, which introduces a constant cusp disturbance source. Figure 4(a) shows the plasma-induced initial flow structures after plasma discharge. Note that a strong discharge afterglow can be observed at each of the actuation locations of
 $x=80$ mm, which indirectly indicates the normal operation of the plasma actuator array. This strong afterglow causes the overexposure of the local sensor and further induces a non-physical white streak along the pixel row direction, which is a known feature of inter-line transfer CCD camera (Raffel et al. Reference Raffel, Willert, Scarano, Kähler, Wereley and Kompenhans2018).
Three thermal bulbs, produced by the SP-PSDA, are recorded downstream of the actuation position. At this moment, these thermal bulbs retain their locally two-dimensional feature along the spanwise direction. Then, with the thermal bulbs travelling downstream, the heads of three high thermal regions will gradually lift up and be stretched by the shear force. Consequently, the thermal regions begin to present the obvious three-dimensional features in the spanwise direction, as shown in figure 4(b). Subsequently, with the further action of the strong shear force between the mainstream and boundary layer, the deformed structures are further stretched into a pair of streamwise vortices, whose connection part forms the  $\varLambda$ vortex structures which have been observed in figure 4(c). Based on the previously published literature (Herbert Reference Herbert1988), the
 $\varLambda$ vortex is the primary stage of the three-dimensional hairpin vortex. Thus, in figure 4(d), the two legs of the hairpin vortex are observed immediately after the
 $\varLambda$ vortex, as expected. Simultaneously, the secondary streamwise vortices induced by the hairpin vortex are also captured. It can be found that the spanwise growth angle of the vortex structures is approximately
 $12^{\circ }$, which agrees well with the results from Adrian (Reference Adrian2007). Finally, the large-scale vortex structures will be broken up into small eddies, and the breakdown of laminar flow to turbulence occurs. Note that similar vortex evolution process has also been observed in previous subsonic transition research (Meyer, Rist & Kloker Reference Meyer, Rist and Kloker2003), which indicates that the transition process at different flow velocities may be unified.
3.2. Conceptual model of the hairpin vortex generation process
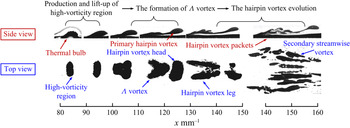
Based on the above analysis, it can be found that the hairpin vortex evolved from the thermal bulbs plays a crucial role in the laminar–turbulent transition control. Therefore, the generation process of the artificial hairpin vortex induced by SP-PSDA is further discussed in detail. In this subsection, a feature extraction tool based on machine learning, namely ilastik (Sommer et al. Reference Sommer, Straehle, Koethe and Hamprecht2011), is adopted to distinguish the plasma-induced flow structures in NPLS images. The tool of ilastik has been widely applied in the biological field, and has been gradually accepted by the researchers in fluid mechanics in recent years (Zhuang et al. Reference Zhuang, Tan, Li, Guo and Sheng2018b). As shown in figure 5, the plasma-induced flow structures are extracted from the original NPLS images. The top and side views of the coherent structures at different streamwise positions are shown together in the synthetic image.
The artificial hairpin vortex generation process.

According to the synthetic image, the artificial hairpin vortex generation process can be divided into three stages: the production and lift-up of the high-vorticity region, formation of the  $\varLambda$ vortex and evolution of the hairpin vortex. In the first stage, the thermal bulb produced by the SP-PSDA actually can be regarded as the high-vorticity region with low density and high thermal energy. At the beginning, the high-vorticity structure clings to the wall surface. However, the head of the high-vorticity region gradually lifts up because of the existence of an upward-induced velocity in the process of downstream propagation, which is in good agreement with the Biot–Savart law (Zhou et al. Reference Zhou, Adrian, Balachandar and Kendall1999). Note that the lift up of the vorticity region from wall surface means that the shear action between fluids will inevitably result in the rotation, namely, the vortex structure will be developed soon.
Subsequently, the evolution of the coherent structure enters the second stage. Besides the further lift up of the vorticity region, the coherent structure is also locally stretched in the streamwise direction due to the large velocity gradient close to the wall. The elongated neck can be observed in the side view. Additionally, in the top view, instead of the raw spanwise two-dimensional coherent structure in the first stage, the three-dimensional characteristic structure emerges. Especially at the streamwise location of  $x=120 - 130$ mm, the typical
 $\varLambda$ vortex structure is captured. The missing piece between the head and
 $\varLambda$ vortex is because part of the elongated neck happens not to be in the current shooting plane.
Finally, with the  $\varLambda$ vortex travelling downstream, the nonlinear instability of the coherent structure is further strengthened by the continued strong shearing and stretching in the streamwise direction. The formation of the artificial hairpin vortex enters the final stage, namely, the hairpin vortex evolution. On the one hand, the primary hairpin vortex, as well as the following hairpin vortex packets, take shape in succession as the side view shows. On the other hand, the number of coherent vortex structures in the spanwise plane increases, which is attributed to the ejection and sweep motions induced by the hairpin vortex packets. Except for the two legs of the hairpin vortex, secondary streamwise vortices, as well as tertiary streamwise vortices, are also observed.
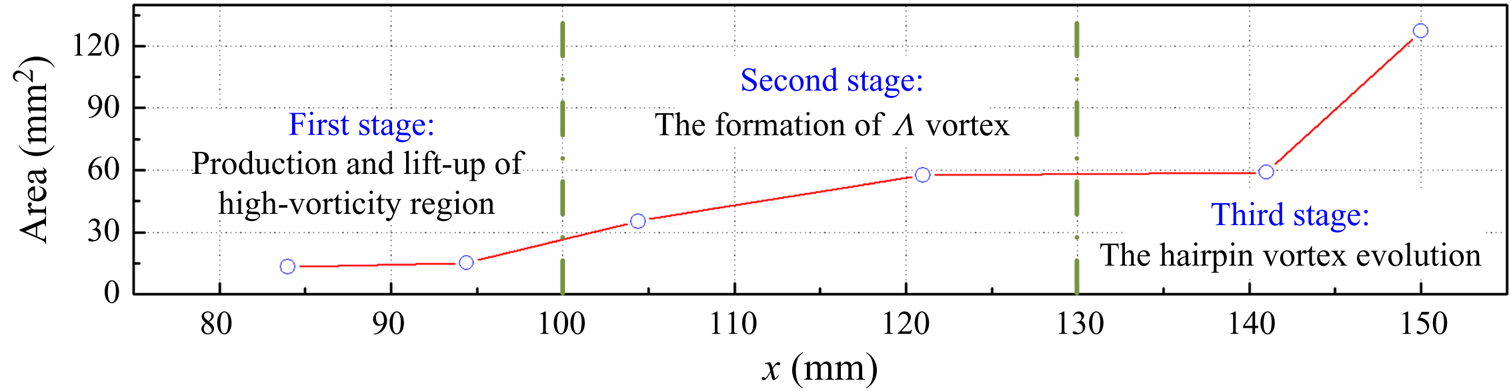
Furthermore, the area of the coherent structures in the top view (FOV B) were further extracted at different time instants. As shown in figure 6, the area of plasma-induced structures increases slowly in the first stage, indicating the disturbance may be still experiencing a linear growth. Then, with the lift-up mechanism arising, the growth is suddenly boosted in the second stage, potentially corresponding to the transient growth of the disturbance (Hanifi, Schmid & Henningson Reference Hanifi, Schmid and Henningson1996). Finally, the hairpin vortex takes shape, and the laminar–turbulent transition enters the final strong nonlinear dynamics stage. The flow randomization process is further accelerated and the turbulent region is extended rapidly.
Temporal evolution of vortex structure area in FOV B.

4. Concluding remarks
The present investigation provides an experimental proof of successful supersonic laminar–turbulent transition control at  $Ma=3.0$ using a plasma actuator array. A contactless optical measurement technique, NPLS, is used for the visualization of subtle boundary-layer flow structures in baseline and controlled flows. In the baseline case, the laminar boundary layer is at the typical linear growth stage of the natural transition. However, once the SP-PSDA, with a power of 160 W, is turned on, the boundary layer is rapidly tripped in a short propagation distance.
Two orthogonal FOVs are chosen for observation in the present study so as to reflect the three-dimensional evolution of the supersonic laminar–turbulent transition controlled by SP-PSDA. Based on FOV A, the classic flow phenomenon that the high-vorticity region lifts up and further stretches in the streamwise direction is captured. Then, the vital flow structures in laminar–turbulent transition, namely hairpin vortex packets, evolve successfully, and play an important role in the final breakdown of the boundary layer to turbulence. Simultaneously, the top views of the plasma-induced coherent structures are also investigated through FOV B. Several characteristic vortex structures, which often appear during the evolution of a hairpin vortex, are observed, including the  $\varLambda$ vortex and the secondary streamwise vortices, which indirectly proves the existence of the hairpin vortex structures. It is revealed that the plasma actuation possesses the ability to induce an artificial hairpin vortex.
Finally, a conceptual model of the hairpin vortex generation process is proposed to preliminarily reveal the control mechanism of the forced boundary-layer transition using SP-PSDA, which is divided into three stages: production and lift-up of the high-vorticity region, formation of the  $\varLambda$ vortex and evolution of the hairpin vortex. Such studies offer a novel method for boundary-layer tripping and may be valuable in future aircraft design.
Funding
This research is financially funded by the National Natural Science Foundation of China (Grant No. 52025064, 12002384 and 91941105).
Declaration of interests
The authors report no conflict of interest.