1 Introduction
Shock wave–turbulent boundary layer interactions (SBLIs) occur whenever a shock sweeps across the boundary layer developing on a wall surface, and as a consequence they have great interest in aeronautics and aerospace engineering. SBLIs are found in several situations of practical importance, such as the wing–fuselage and tail–fuselage junctions of an aircraft, helicopter blades, supersonic intakes, overexpanded nozzles, launch vehicles during the ascent phase, etc. Typically, these phenomena have a significant drawback on aerodynamic performance, yielding loss of efficiency of aerodynamic surfaces, and unwanted wall pressure fluctuations, possibly leading to vibration and fatigue of structural components, and to localized heat transfer loads, especially in the presence of flow separation (Dolling Reference Dolling2001; Smits & Dussauge Reference Smits and Dussauge2006; Babinsky & Harvey Reference Babinsky and Harvey2011). A large number of experimental and numerical studies, along with the concurrent development of flow control techniques, have been carried out in past decades, but nevertheless the unsteady features and the turbulence amplification mechanisms conveyed by SBLIs are not fully understood, remaining a challenging state-of-the-art research problem.
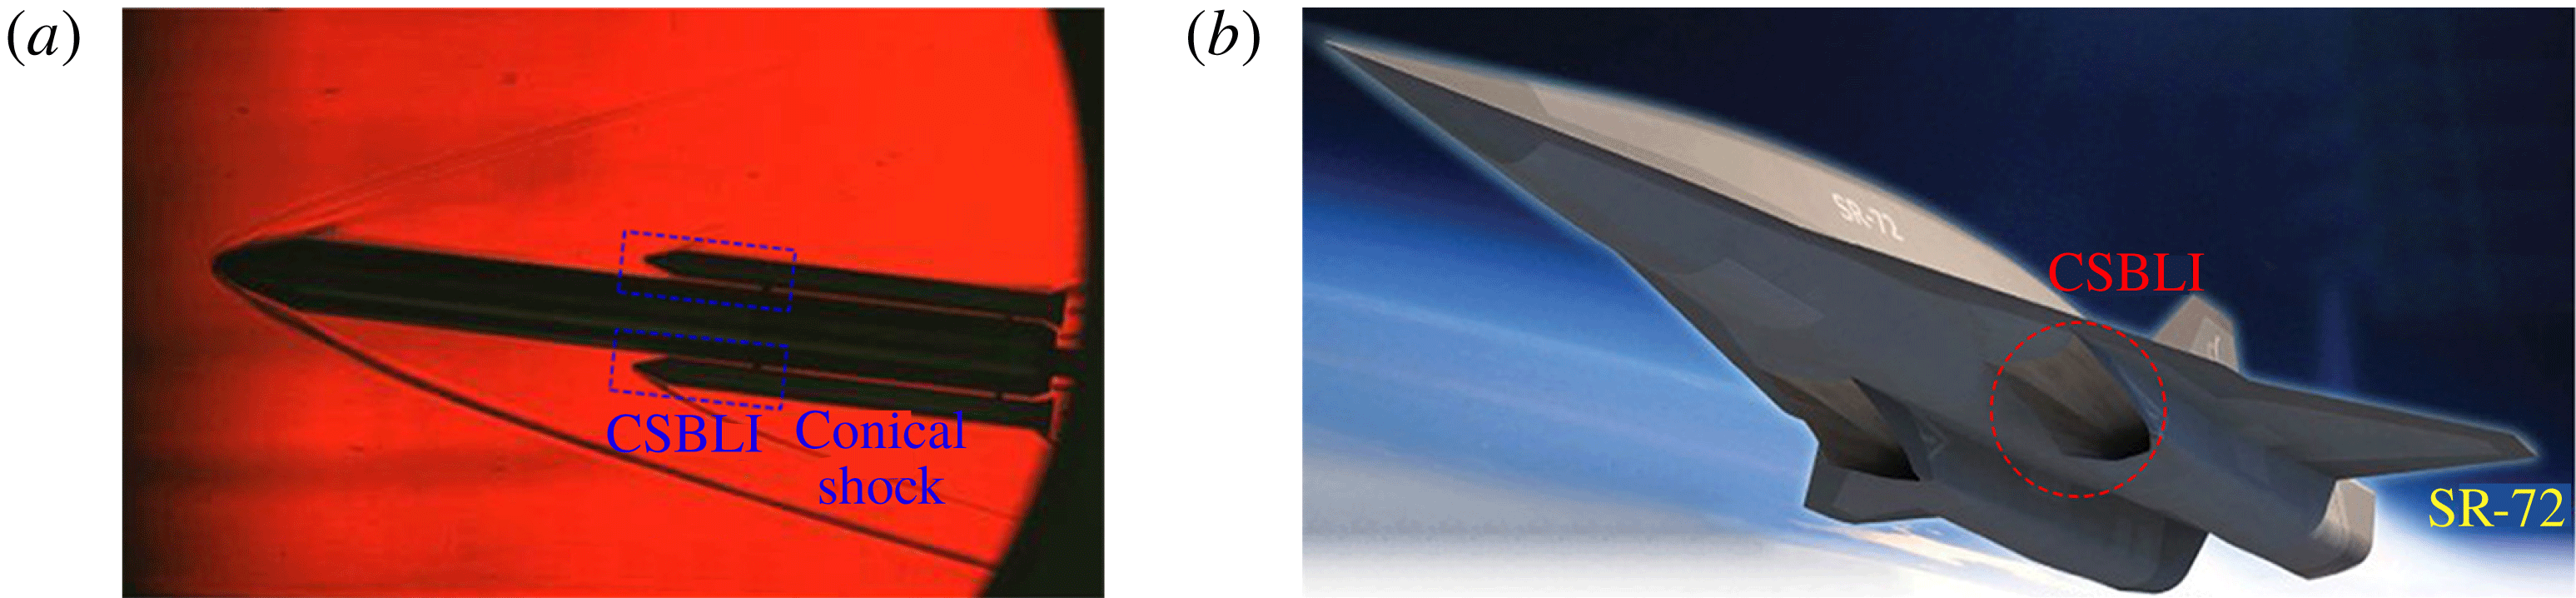
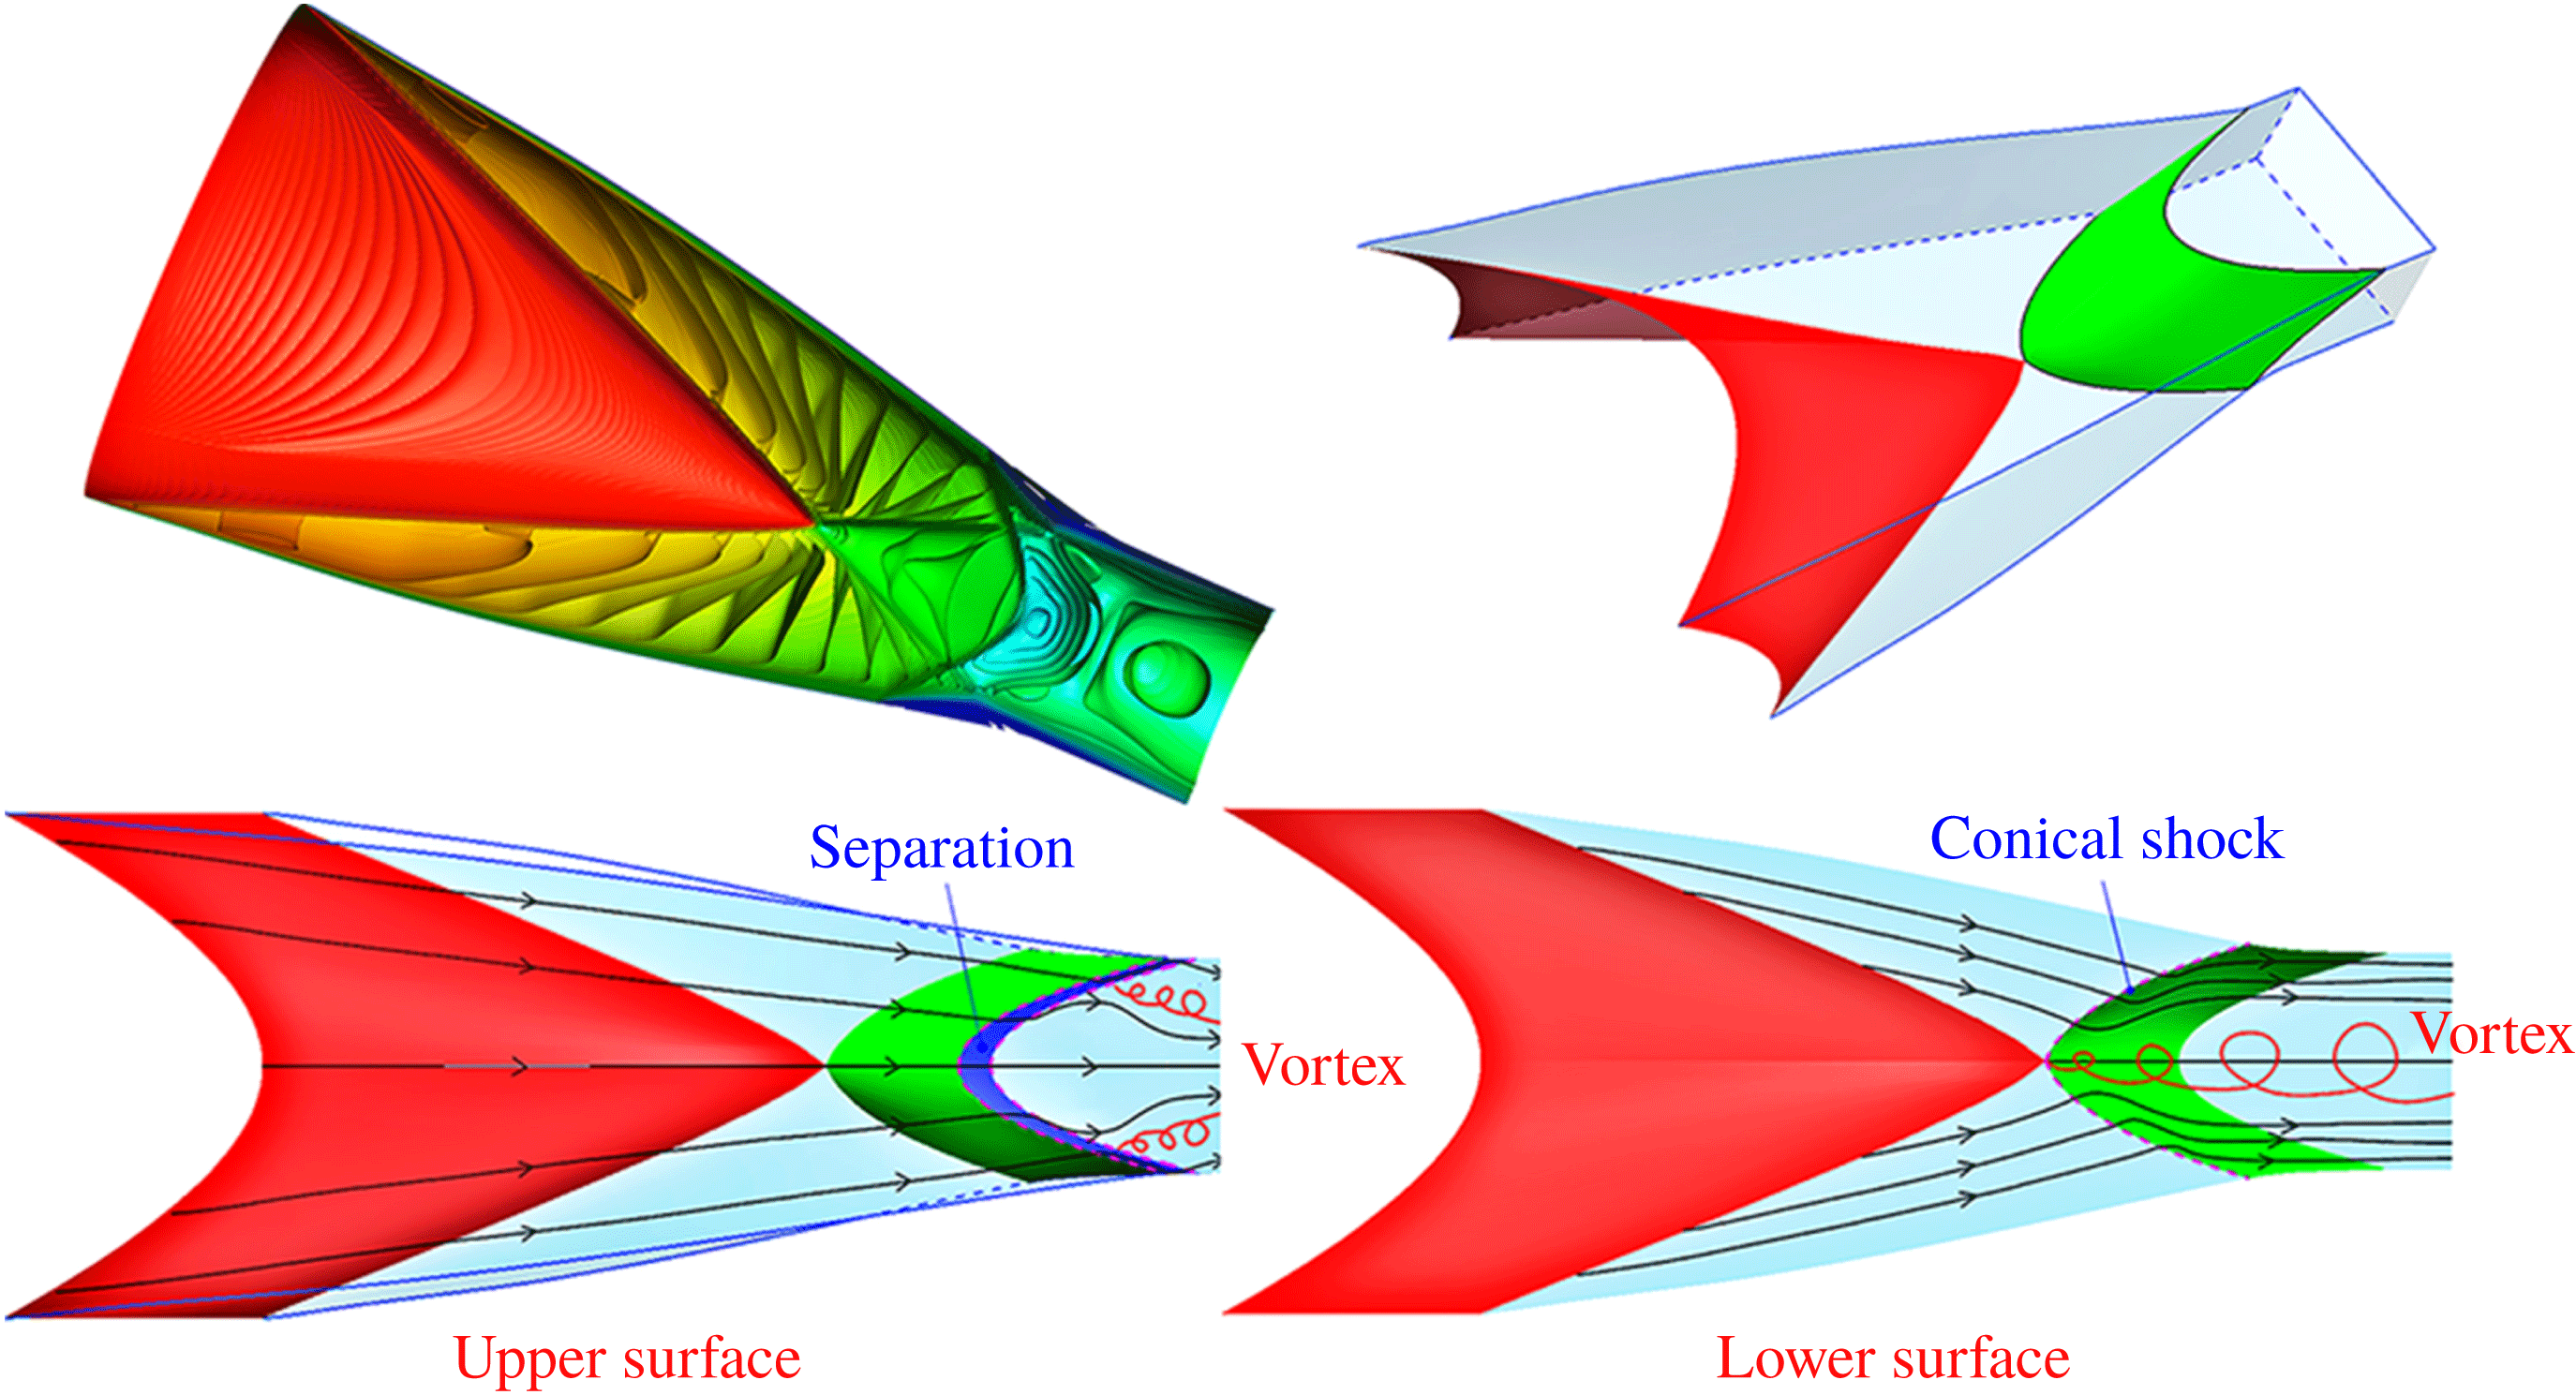
Most studies of SBLIs have been carried out in idealized settings involving geometrically two-dimensional configurations, and/or using simplified modelling approaches (Délery & Dussauge Reference Délery and Dussauge2009; DeBonis et al. Reference DeBonis, Oberkampf, Wolf, Orkwis, Turner, Babinsky and Benek2012; Morgan et al. Reference Morgan, Duraisamy, Nguyen, Kawai and Lele2013). As a common conclusion, these investigations have proved that turbulence models have the ability to capture the mean flow features such as the pressure loads and the interaction length scales, but obviously they cannot capture the unsteady features and correctly predict flow separation. The most relevant studies on SBLIs in geometrically two-dimensional configurations have been carried out experimentally or numerically through high-fidelity simulations (Adams Reference Adams2000; Dupont, Haddad & Debieve Reference Dupont, Haddad and Debieve2006; Pirozzoli & Grasso Reference Pirozzoli and Grasso2006; Smits & Dussauge Reference Smits and Dussauge2006; Pirozzoli & Bernardini Reference Pirozzoli and Bernardini2011a ; Touber & Sandham Reference Touber and Sandham2011; Hadjadj Reference Hadjadj2012). The overall picture involves a boundary layer that develops under adverse pressure gradient (APG) conditions, with the effects of the shock being felt upstream of the impingement as a result of propagation of information in the subsonic part of the boundary layer. If the shock is strong enough, separation takes place and pressure shows a plateau in the separation region, with a typical low-frequency motion of the shock system and of the separation bubble. Turbulence experiences amplification while traversing the shock, and it undergoes a relaxation process as it proceeds past the interaction region. However, SBLIs occurring in flow conditions of practical relevance are almost invariably three-dimensional in nature. Most often, shock waves are generated by finite-sized bodies, and interact with turbulent boundary layers developing on solid surfaces. Conical shocks in particular are frequently found in high-speed vehicles, in both external and internal flows, for which examples are provided in figure 1. In the supersonic ascent phase, multi-body launch vehicles feature conical shock–boundary layer interactions (CSBLIs) associated with reflection of the booster-generated shocks with the main body of the launcher (see figure 1 a; from Sziroczak & Smith (Reference Sziroczak and Smith2016)). CSBLIs also occur in internal flows as in the hypersonic wave-catcher (inward-turning) intake adopted on the SR-72 vehicle (Zuo, Huang & Xia Reference Zuo, Huang and Xia2016; Zuo & Huang Reference Zuo and Huang2018), sketched in figure 1(b). As shown in figure 2, the initially conical shock wave covers the intake edge, and it reflects as another conical shock impinging on the upper surface.
CSBLIs in a launch vehicle during the ascent phase (a) and in the air intake of the hypersonic SR-72 vehicle (b).

Sketch of flow structure in a wave-catcher inward-turning intake (Zuo & Huang Reference Zuo and Huang2018). Red and green surfaces are conical shocks, the purple surface is the separation region, and red lines are a sketch of vortices caused by CSBLIs.

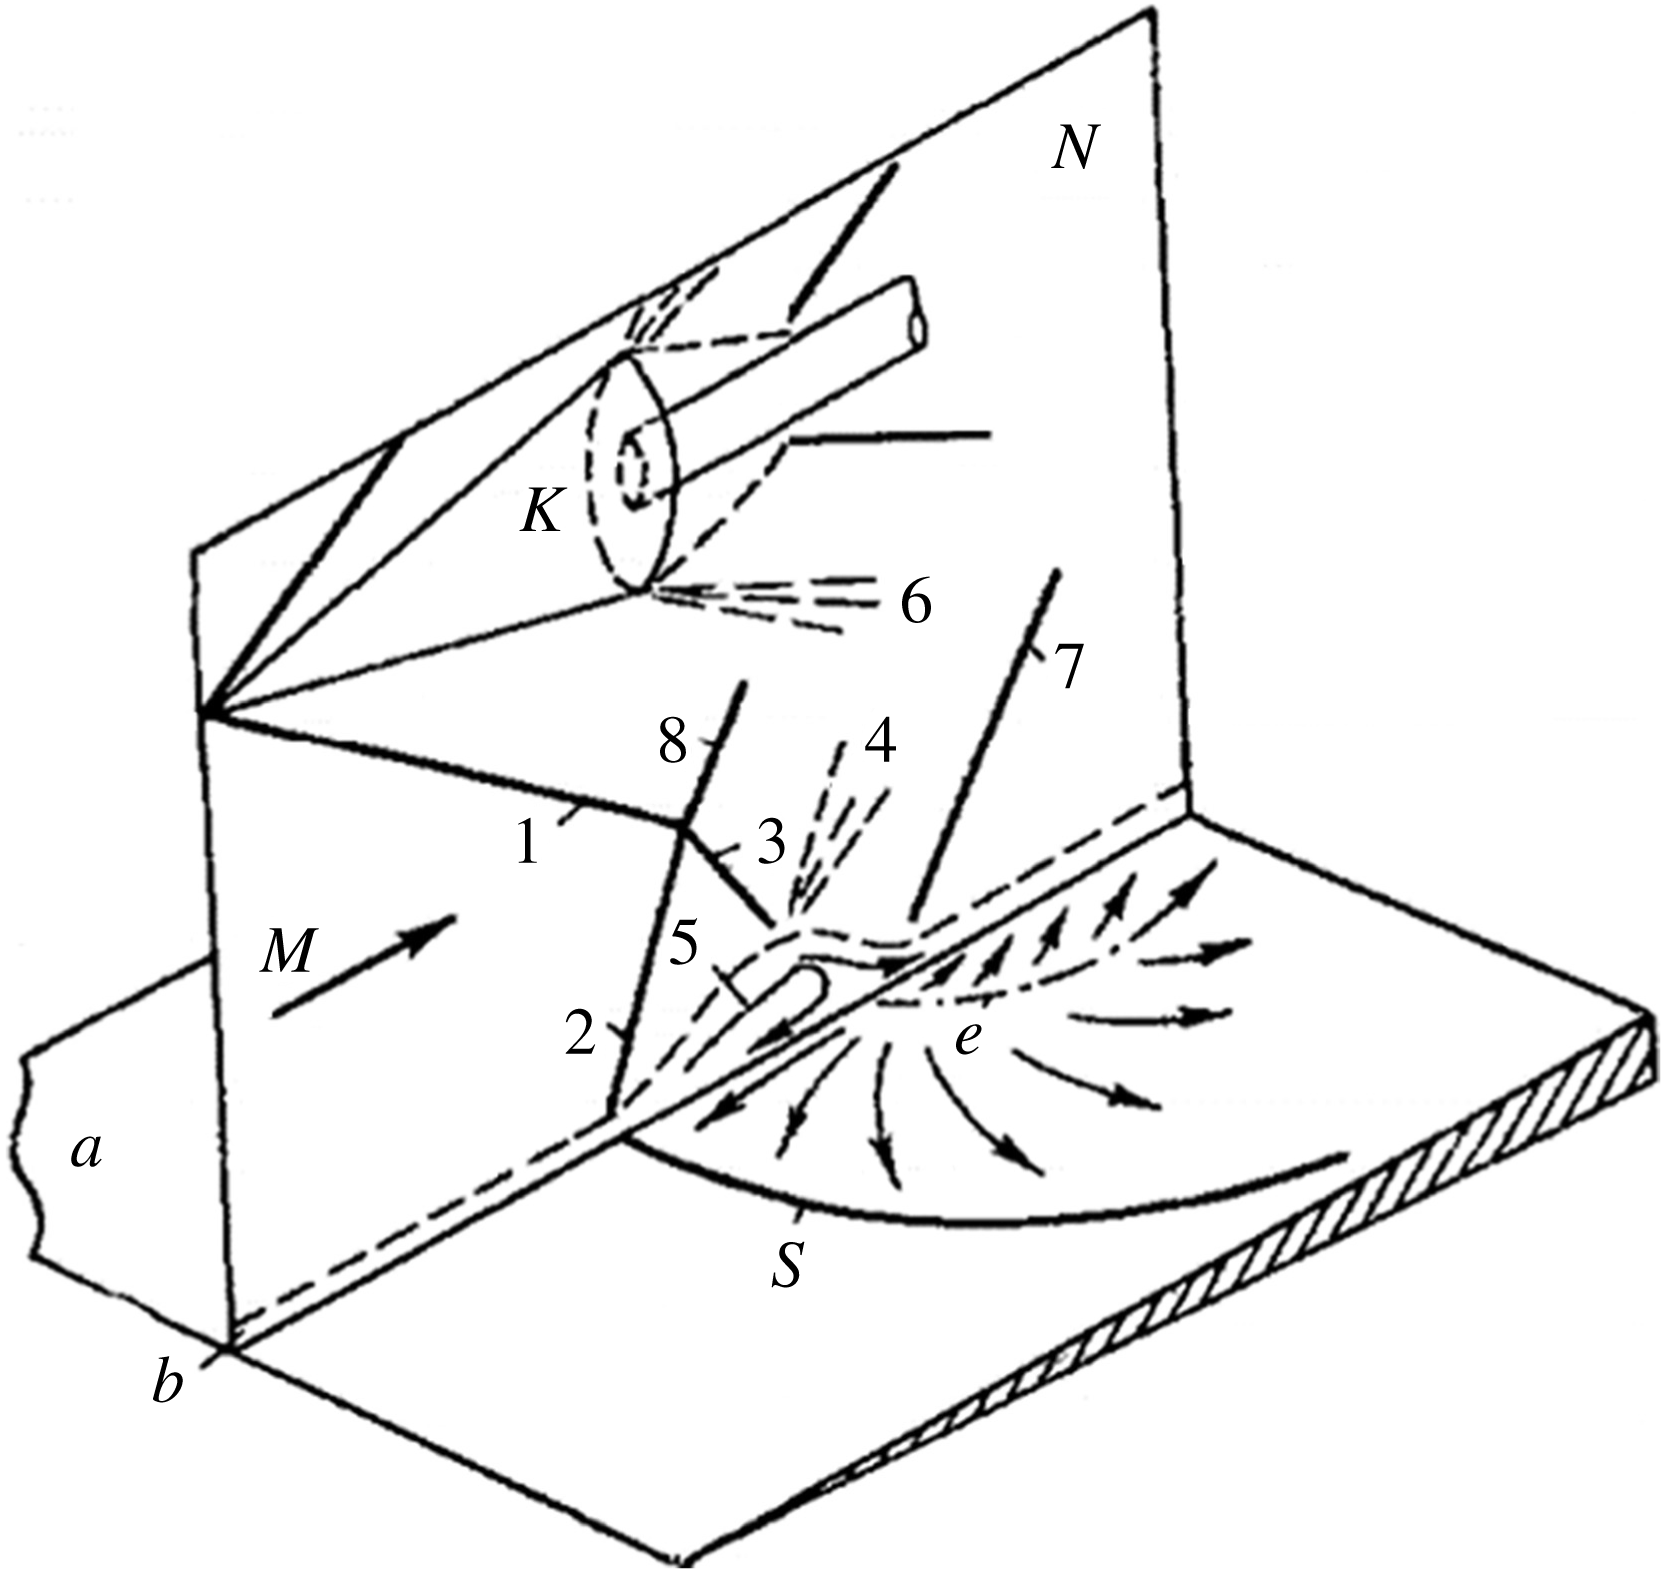
Flow-field structure of strong CSBLIs under separation condition (Panov Reference Panov1968). Numbered solid lines are conical shock traces; numbered dashed lines are rarefaction waves; 5 is the separation region, delimited in the wall plane by S (separation) and e (reattachment).

The analysis of CSBLIs is inherently more difficult than for planar SBLIs, in that the flow field past a conical shock is not uniform, and the wall pressure rise is not uniform along the boundary layer transverse direction; hence the resulting limiting wall streamlines are not parallel. Moreover, non-uniformity of the imposed shear yields a variety of complex vortical structures which interact and merge while becoming entrained in the main flow. A greater challenge is also encountered in the numerical simulation of CSBLIs, mainly because of the slow convergence of the flow statistics in the absence of directions with spatial homogeneity. The leading features of CSBLIs are sketched in figure 3, taken from Panov (Reference Panov1968). The shock generator K generates the incident conical shock 1, and 2 is the three-dimensional separation shock associated with separation of the boundary layer. The approaching flow that passes through shock 2 is deflected upwards, and after passing through shock 3 and rarefaction wave 4, the separated boundary layer is directed at some angle towards the plate surface. Shock 7 then arises to realign the outer flow to the wall-parallel direction. The boundary layer, which separates along line S (coalescence line), reattaches along line e (divergence line). As in the case of the later analysis, the rarefaction wave 6 emanating from the trailing edge of the shock-generating device can also enter into play, thus further complicating the analysis of the flow in the interaction region. The overall phenomenon, with special reference to the separation region 5, is inherently three-dimensional in nature.
A mathematical analysis of CSBLIs was carried out by Migotsky & Morkovin (Reference Migotsky and Morkovin1951). One of the main conclusions was that, even when regular reflection is possible at the leading edge of the interaction zone, transition to Mach reflection will occur somewhere along the spanwise direction. Gai & Teh (Reference Gai and Teh2000) experimentally investigated the interaction of the shock wave produced by a conical shock with a planar turbulent boundary layer, at free-stream Mach number 2. By varying the cone opening angles from
 $14^{\circ }$
to
 $30^{\circ }$
, both attached and separated conditions were achieved. The results showed that the incident shock imposes a significant pressure gradient in the spanwise direction, yielding strong cross-flow and the formation of a horseshoe vortex whose signature was evident in surface oil-flow visualizations, and whose size and strength gradually reduce away from the symmetry plane. Notably, the pressure rise for incipient separation was found to be less than for the geometrically two-dimensional case. Hale (Reference Hale2015) studied the impingement of a conical shock wave on a plane turbulent boundary layer at Mach number 2.05, and gathered information by means of surface oil-flow, pressure-sensitive paint and particle image velocimetry techniques. The experimental data suggested that the interaction causes locally two-dimensional separation near the centreline, and three-dimensional separation away from this region, with fluid propagating away from the centreline. Significant spanwise and streamwise expansion was observed right downstream of the interaction leading edge, unlike in equivalent geometrically two-dimensional wedge-generated SBLIs. The results further gave hints for instantaneous boundary layer separation, and showed that the interaction tends to suppress large-scale vortical structures in the incoming boundary layer.
Based on the survey of the state of the art in CSBLIs, we believe that further study is appropriate. In particular, we find that limited information about the detailed three-dimensional structure of the interaction has been gained through experiments, and no high-fidelity computation, i.e. large-eddy simulation and/or direct numerical simulation (DNS), has been reported so far. Hence, we believe that a DNS-based analysis of CSBLIs can help the research community to achieve an improved physical understanding of the phenomenon, and to develop better turbulence models for simplified predictions. To make our analysis sufficiently general, we consider a relatively simple geometrical set-up, whereby a fully developed turbulent boundary layer progresses on a flat solid surface, and the shock wave generated by a circular cone with axis parallel to the wall is made to interact with it, mimicking the experimental flow conditions of Hale (Reference Hale2015).
The paper is organized as follows. The numerical methodology is described in § 2; the results are presented in § 3, covering a quantitative analysis of the mean and statistical properties of the flow field. Concluding remarks are given in § 4.
2 Computational strategy
We solve the three-dimensional Navier–Stokes equations for a perfect Newtonian gas. The molecular viscosity
 $\unicode[STIX]{x1D707}$
is assumed to obey Sutherland’s law, and the thermal conductivity
 $k$
is related to
 $\unicode[STIX]{x1D707}$
through
 $k=c_{p}\unicode[STIX]{x1D707}/Pr$
, where the molecular Prandtl number
 $Pr$
is assumed to be 0.72. The Cartesian solver used for the present analysis was extensively tested for compressible wall-bounded flows, and also in the presence of impinging shocks (Pirozzoli, Bernardini & Grasso Reference Pirozzoli, Bernardini and Grasso2010; Pirozzoli & Bernardini Reference Pirozzoli and Bernardini2011a
). The main feature of the solver is the use of a conservative discretization of the convective fluxes, which combines sixth-order central non-dissipative discretization in smooth parts of the flow field and seventh-order weighted essentially non-oscillatory (WENO) discretization in shocked regions, the switch between the two being controlled by a shock sensor based on the ratio of local dilatation to vorticity modulus (Pirozzoli Reference Pirozzoli2011). For the purpose of hybridization, critical grid nodes are first marked and then padded with four nodes on both sides to ensure that the stencil of the underlying non-dissipative scheme does not cross shocked zones. Improved numerical stability for the central discretization in smooth parts of the flow is achieved by splitting the convective derivatives as (Pirozzoli Reference Pirozzoli2010)
 $$\begin{eqnarray}\frac{\unicode[STIX]{x2202}\unicode[STIX]{x1D70C}u_{j}\unicode[STIX]{x1D711}}{\unicode[STIX]{x2202}x_{j}}=\frac{1}{4}\frac{\unicode[STIX]{x2202}\unicode[STIX]{x1D70C}u_{j}\unicode[STIX]{x1D711}}{\unicode[STIX]{x2202}x_{j}}+\frac{1}{4}\left(u_{j}\frac{\unicode[STIX]{x2202}\unicode[STIX]{x1D70C}\unicode[STIX]{x1D711}}{\unicode[STIX]{x2202}x_{j}}+\unicode[STIX]{x1D70C}\frac{\unicode[STIX]{x2202}u_{j}\unicode[STIX]{x1D711}}{\unicode[STIX]{x2202}x_{j}}+\unicode[STIX]{x1D711}\frac{\unicode[STIX]{x2202}\unicode[STIX]{x1D70C}u_{j}}{\unicode[STIX]{x2202}x_{j}}\right)+\frac{1}{4}\left(\unicode[STIX]{x1D70C}u_{j}\frac{\unicode[STIX]{x2202}\unicode[STIX]{x1D711}}{\unicode[STIX]{x2202}x_{j}}+\unicode[STIX]{x1D70C}\unicode[STIX]{x1D711}\frac{\unicode[STIX]{x2202}u_{j}}{\unicode[STIX]{x2202}x_{j}}+u_{j}\unicode[STIX]{x1D711}\frac{\unicode[STIX]{x2202}\unicode[STIX]{x1D70C}}{\unicode[STIX]{x2202}x_{j}}\right),\end{eqnarray}$$
where
 $\unicode[STIX]{x1D711}$
stands for a generic transported fluid property. The continuous derivative operators are then replaced with central finite difference approximations using a locally conservative formulation (Pirozzoli Reference Pirozzoli2010), which guarantees global conservation of mass, momentum and total energy through the telescopic property and simplifies hybridization with the WENO algorithm. An important property of the convective split form (2.1) is that it leads to kinetic energy preservation for inviscid, incompressible flow, guaranteeing strong numerical stability without reverting to upwinding or filtering. The diffusive terms in the Navier–Stokes equations are also approximated with sixth-order central differences after being expanded to Laplacian form to guarantee finite molecular dissipation at all resolved wavelengths. Time advancement is performed by means of a standard three-stage third-order explicit Runge–Kutta algorithm.
2.1 Computational domain
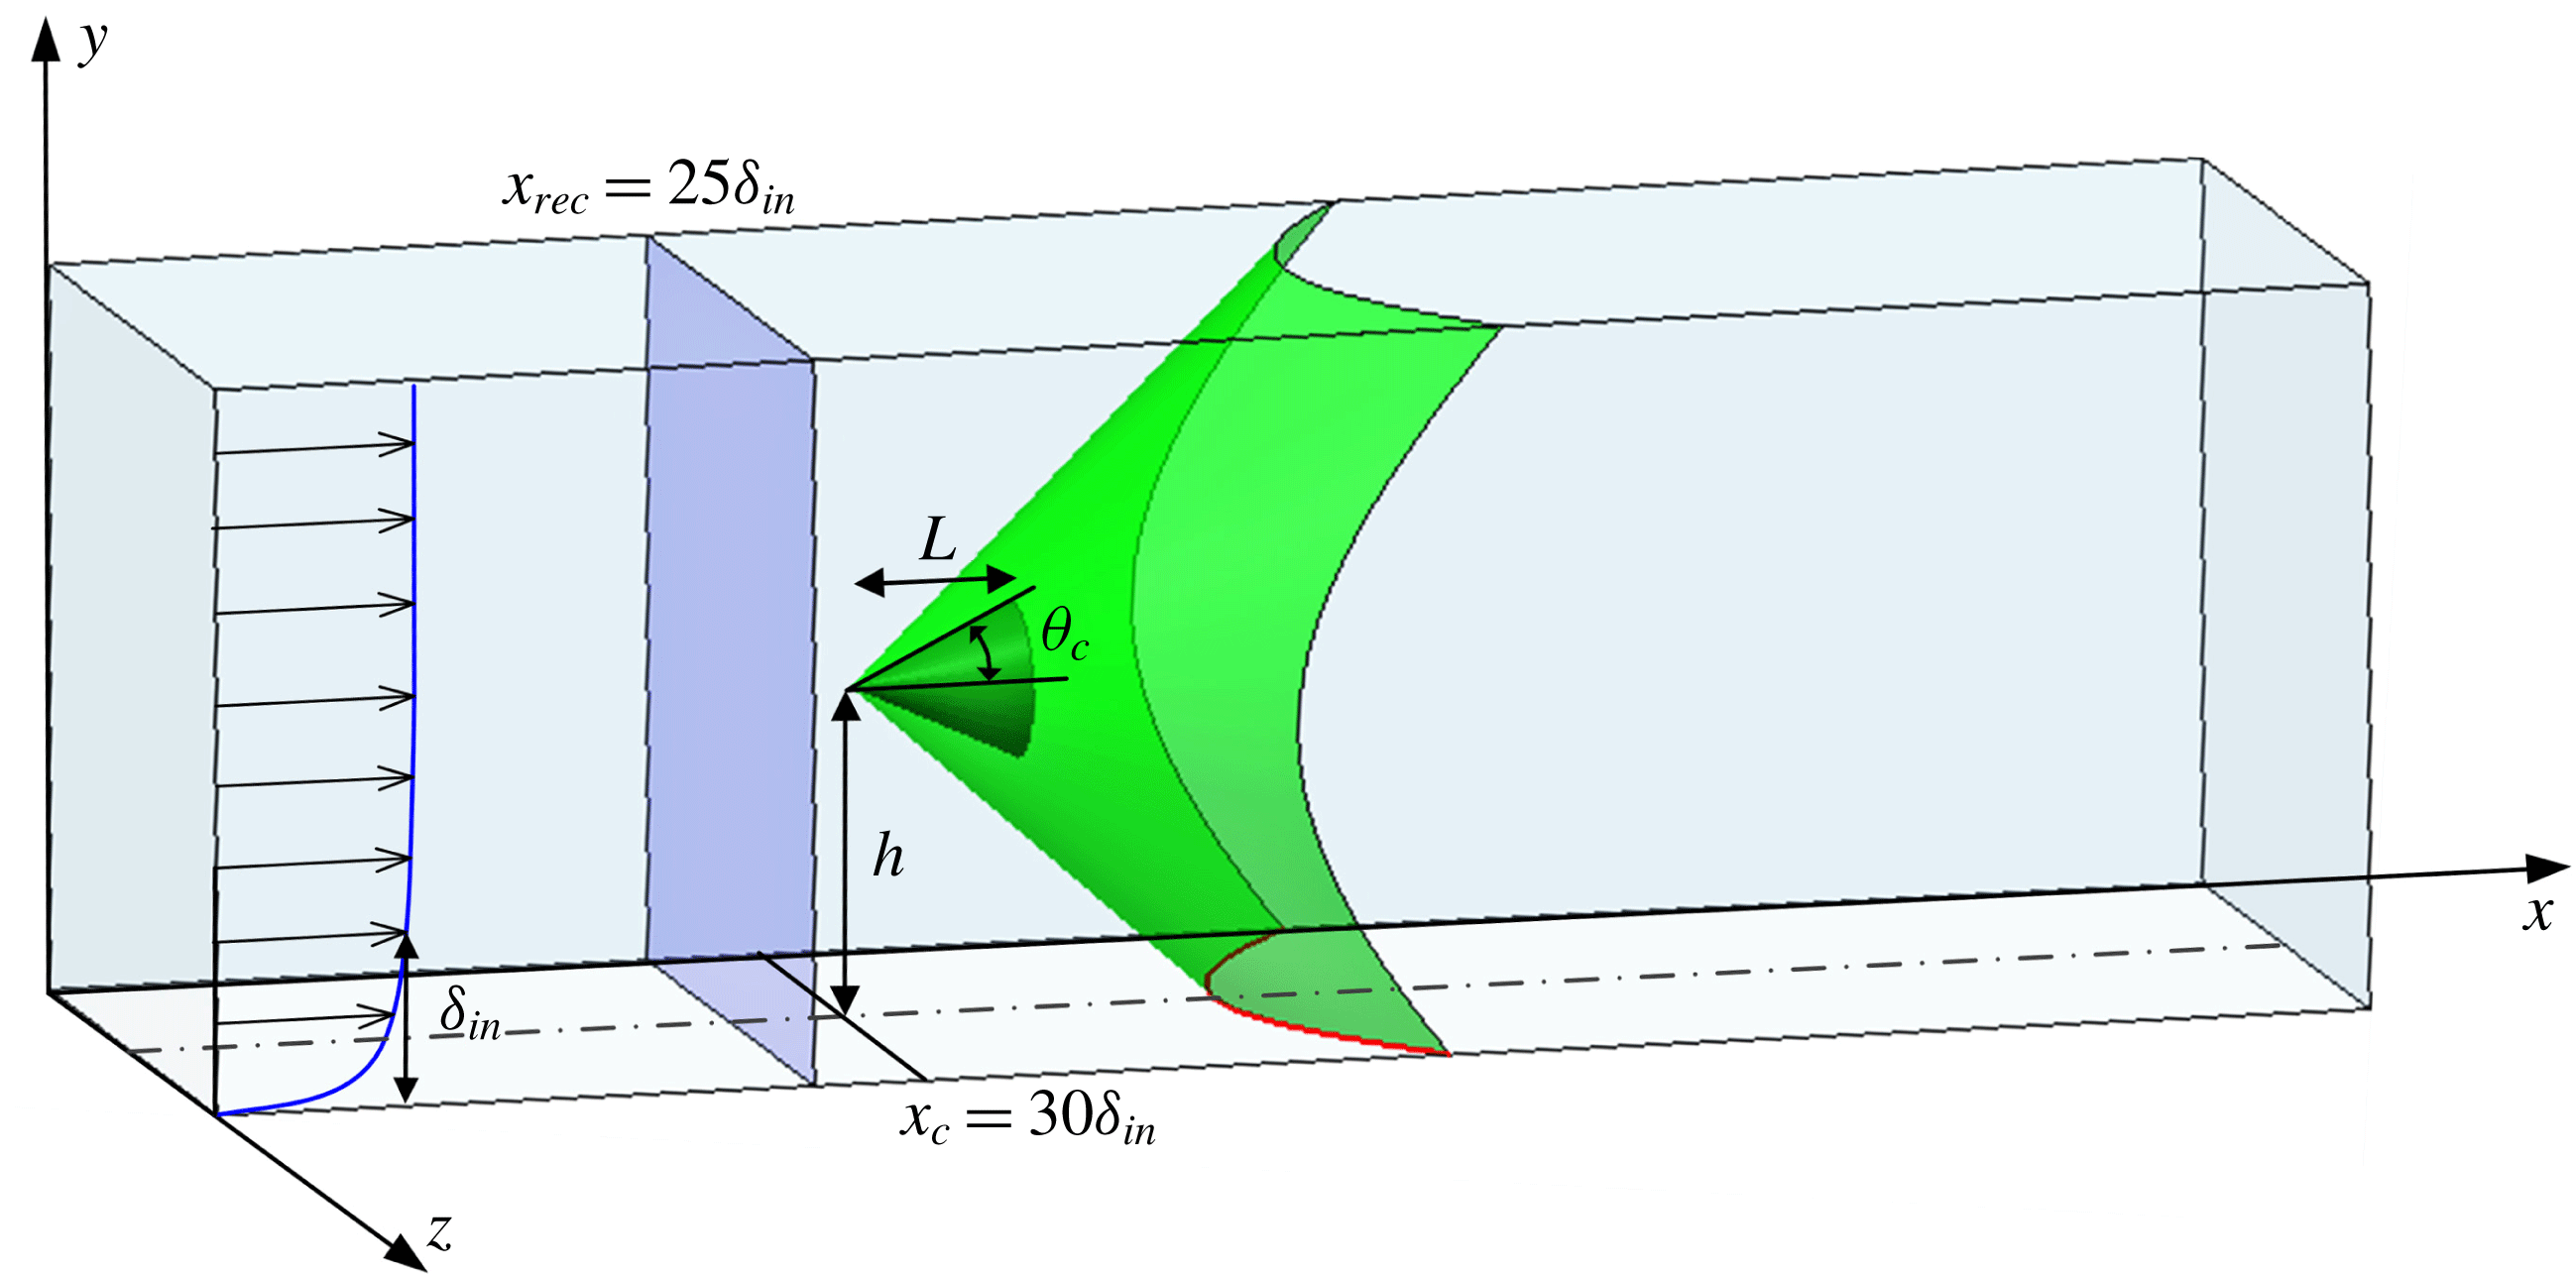
Sketch of the computational domain for CSBLI analysis. Here
 $\unicode[STIX]{x1D6FF}_{in}$
is the inflow boundary layer thickness,
 $x_{rec}$
is the boundary layer recycling station and
 $x_{c}$
is the
 $x$
coordinate of the cone leading edge. The green surface depicts the conical shock, whose wall trace is highlighted in red.

The computational domain employed for the simulation is sketched in figure 4. The choice of the streamwise extent (
 $L_{x}=150\unicode[STIX]{x1D6FF}_{in}$
, with
 $\unicode[STIX]{x1D6FF}_{in}$
the inflow boundary layer thickness) is dictated by the requirement of having a sufficient boundary layer development region past the inflow and to analyse the recovery region past the interacting shock. The spanwise length (
 $L_{z}=60\unicode[STIX]{x1D6FF}_{in}$
) guarantees that no spurious coherence develops in the upstream boundary layer, and allows numerical blocking from the side boundaries to be minimized. The domain height (
 $L_{y}=30\unicode[STIX]{x1D6FF}_{in}$
) is such that numerical wave reflections from the upper boundary are also minimized. Based on previous experience with DNS of SBLIs and of a set of preliminary simulations, the domain has been discretized with a grid including
 $1536\times 384\times 1280$
nodes. Uniform spacing is used in the streamwise and spanwise directions, whereas nodes are clustered in the wall-normal (
 $y$
) direction according to a hyperbolic sine stretching function up to
 $y/\unicode[STIX]{x1D6FF}_{in}=6.5$
. In terms of wall units evaluated in the undisturbed boundary layer upstream of the interaction zone, the streamwise and spanwise spacings are
 $\unicode[STIX]{x0394}x^{+}\approx 10$
and
 $\unicode[STIX]{x0394}z^{+}\approx 5$
, respectively, whereas the spacing in the wall-normal direction ranges between
 $0.7$
at the wall and
 $12$
. Here and elsewhere, the
 $+$
subscript is used to denote normalization with respect to the friction velocity
 $u_{\unicode[STIX]{x1D70F}}=\sqrt{\unicode[STIX]{x1D70F}_{w}/\unicode[STIX]{x1D70C}_{w}}$
(where
 $\unicode[STIX]{x1D70F}_{w}$
and
 $\unicode[STIX]{x1D70C}_{w}$
are the wall shear stress and density), and the viscous length scale
 $\unicode[STIX]{x1D6FF}_{v}=\unicode[STIX]{x1D708}_{w}/u_{\unicode[STIX]{x1D70F}}$
(where
 $\unicode[STIX]{x1D708}_{w}$
is the wall kinematic viscosity). As a further a posteriori check, we have computed the local Kolmogorov length scale according to
 $\unicode[STIX]{x1D702}=(\overline{\unicode[STIX]{x1D708}}^{3}/\unicode[STIX]{x1D700})^{1/4}$
, with the isotropic dissipation rate estimated from
 $$\begin{eqnarray}\unicode[STIX]{x1D700}=2\overline{\unicode[STIX]{x1D708}}\left(\widetilde{S_{ij}^{\prime \prime }S_{ij}^{\prime \prime }}-\frac{1}{3}\widetilde{\frac{\unicode[STIX]{x2202}u_{k}^{\prime \prime }}{\unicode[STIX]{x2202}x_{k}}\frac{\unicode[STIX]{x2202}u_{l}^{\prime \prime }}{\unicode[STIX]{x2202}x_{l}}}\right).\end{eqnarray}$$
We have found that the effective grid spacing
 $\unicode[STIX]{x1D6E5}=(\unicode[STIX]{x0394}x\unicode[STIX]{x0394}y\unicode[STIX]{x0394}z)^{1/3}$
is nowhere larger than approximately three local Kolmogorov length scales, which is more than sufficient for DNS. Velocity and pressure spectra were also analysed, and shown to yield no spurious energy pile-up at the smallest resolved wavenumbers.
2.2 Treatment of shock generator
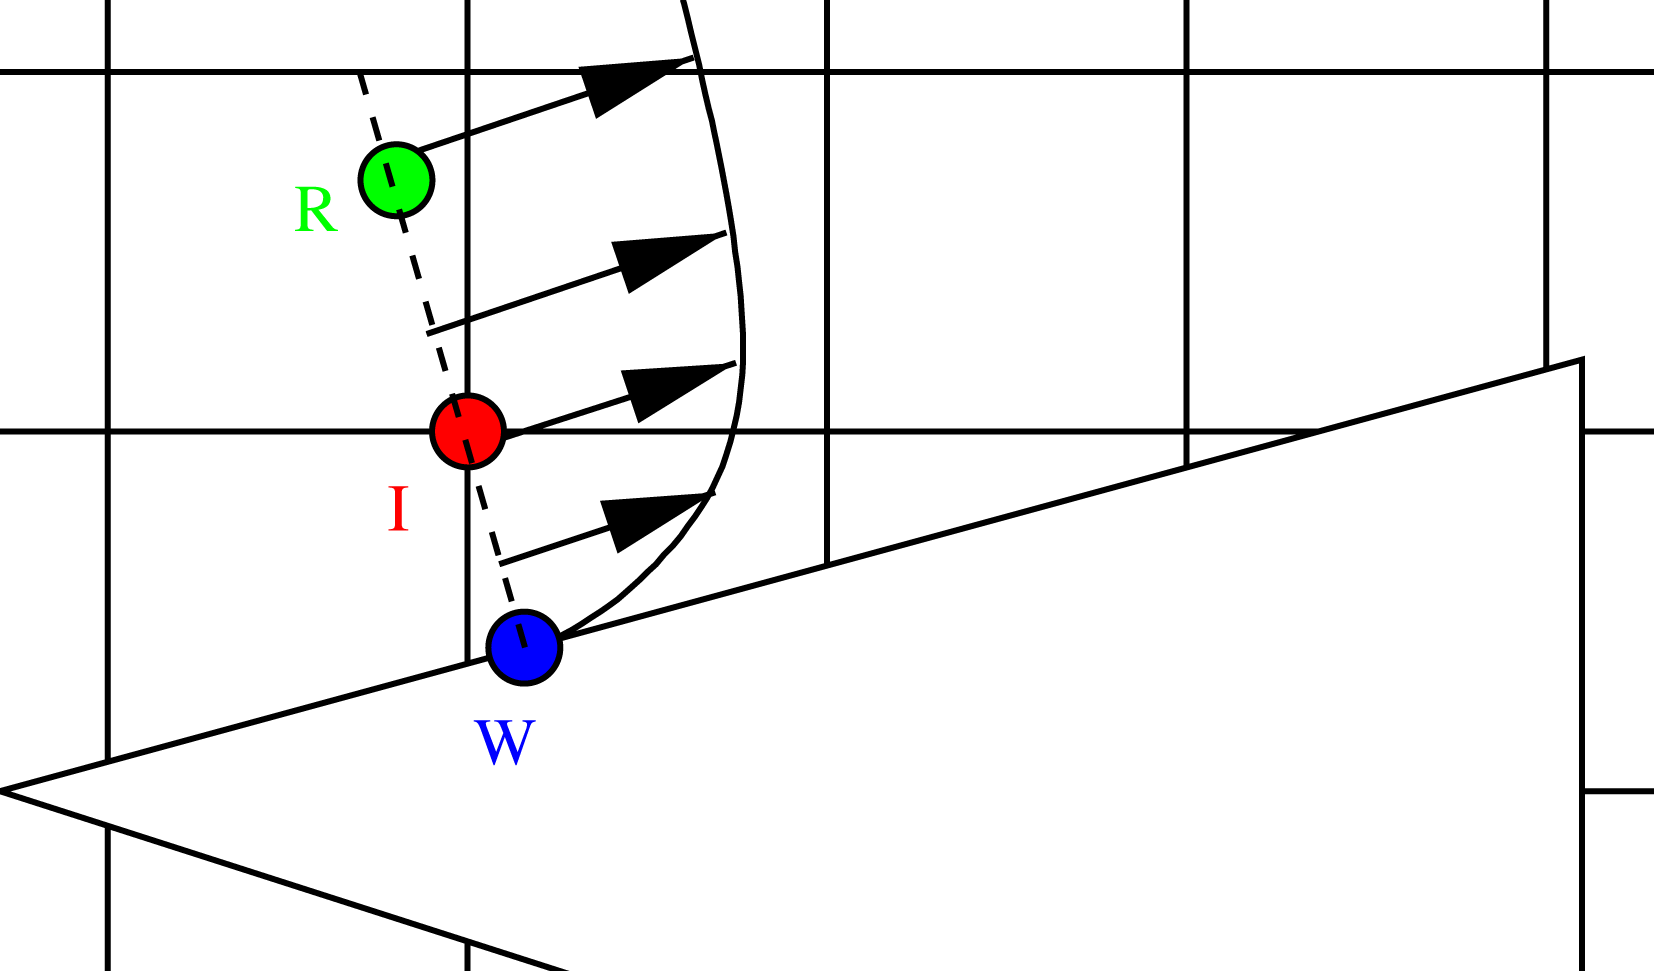
Sketch of the immersed-boundary treatment. I is the interface node, and W and R are the corresponding wall-normal foot and reflected control point.

In order to accommodate the conical shock generator in the Cartesian mesh used for the DNS, we rely on the immersed-boundary method, using the direct forcing approach of Fadlun et al. (Reference Fadlun, Verzicco, Orlandi and Mohd-Yusof2000), in which the Navier–Stokes equations are replaced by suitable interpolation formulae at the interface nodes between solid and fluid. A geometrical preprocessor based on the ray tracing algorithm (O’Rourke Reference O’Rourke1998) is applied to tag solid and fluid nodes. Once the fluid nodes are located, we identify the subset of nodes for which discretization of the Navier–Stokes equations involves the use of solid nodes, which are tagged as interface nodes and used to indirectly prescribe desired values to the conservative variables conditions at the fluid/body interface. For that purpose (see figure 5), for each interface node (I) a wall-normal line is considered, along which a control point (R) is considered, at fixed distance from the wall foot (W), where the flow variables are interpolated from neighbouring grid nodes. An equilibrium wall function is then used to define the flow variables at I based on those at R (Tessicini et al. Reference Tessicini, Iaccarino, Fatica, Wang and Verzicco2002). Implementation details are provided in Bernardini, Modesti & Pirozzoli (Reference Bernardini, Modesti and Pirozzoli2016). The cone is resolved with approximately 72, 56 and 138 grid intervals in the streamwise, wall-normal and spanwise directions, respectively, and the distance of the reflected control points from the nearest wall expressed in local wall units along the cone ranges between 3 and 70. We believe that, although the boundary layer on the cone is certainly not well resolved, this is not a major shortcoming, as the cone simply serves as a disturbing element to force a spatially varying pressure gradient onto the underlying boundary layer. The validity of the approach is confirmed by later comparison with experiments.
2.3 Flow conditions
The flow conditions are selected to be as close as possible to the reference experiment of Hale (Reference Hale2015). The shock is generated by a circular cone with height
 $L/\unicode[STIX]{x1D6FF}_{in}=6.835$
and half opening angle
 $\unicode[STIX]{x1D703}_{c}=25^{\circ }$
. The apex of the cone is at
 $x_{c}=30\unicode[STIX]{x1D6FF}_{in}$
, and its axis is parallel to the wall at a distance
 $h/\unicode[STIX]{x1D6FF}_{in}=13.67$
(see figure 4). The upstream flow has Mach number
 $M_{\infty }=2.05$
, and the Reynolds number based on the inflow boundary layer thickness is
 $Re_{\unicode[STIX]{x1D6FF}_{in}}=5000$
. The latter is approximately a factor of 50 less than the reference experiment, but, as will be shown later, this is not the cause of major quantitative differences.
A critical issue in the numerical simulations of spatially developing flows is the prescription of suitable inflow conditions to achieve a fully developed boundary layer state within the shortest possible fetch. In the present DNS, this is achieved through a rescaling–recycling procedure (Xu & Martin Reference Xu and Martin2004), whereby a cross-stream slice of the flow field is extracted at every Runge–Kutta substep at the recycling station
 $x_{rec}$
, and fed back to the inflow upon suitable rescaling. This approach generates a realistic turbulent boundary layer within a short distance from the inflow, and it allows one to control the skin friction and thickness of the simulated boundary layer. To minimize spurious time periodicity that may result from application of quasi-periodic boundary conditions in the streamwise direction, the recycling station is set at
 $x_{rec}=25\unicode[STIX]{x1D6FF}_{in}$
, also sufficiently upstream of the cone apex. Non-reflecting characteristic boundary conditions are applied to the outflow, at the top boundary and in the spanwise direction for
 $x>x_{rec}$
, whereas spanwise periodicity is assumed for
 $x\leqslant x_{rec}$
. Unsteady characteristic boundary conditions are specified at the bottom no-slip wall (Poinsot & Lele Reference Poinsot and Lele1992), with temperature set to its adiabatic value. Flow statistics have been collected from time
 $t_{0}u_{\infty }/\unicode[STIX]{x1D6FF}_{in}\approx 216$
to time
 $t_{f}u_{\infty }/\unicode[STIX]{x1D6FF}_{in}\approx 1572$
, at intervals of
 $\unicode[STIX]{x0394}t\,u_{\infty }/\unicode[STIX]{x1D6FF}_{in}\approx 0.1$
. The long sampling time is needed to achieve convergence of pointwise statistics in time in the absence of homogeneous directions, and it makes the present calculation quite time-consuming. The statistical analysis is carried out by splitting the instantaneous quantities into their mean and fluctuating components, using either the standard Reynolds decomposition (
 $\,f=\overline{f}+f^{\prime }$
) or the density-weighted (Favre) decomposition (
 $\,f=\widetilde{f}+f^{\prime \prime }$
), where
 $\widetilde{f}=\overline{\unicode[STIX]{x1D70C}f}/\overline{\unicode[STIX]{x1D70C}}$
.
3 Results
3.1 Characterization of the incoming boundary layer
Properties of incoming turbulent boundary layer at the reference station
 $x_{ref}=27.5\unicode[STIX]{x1D6FF}_{in}$
:
 $M_{e}=u_{e}/c_{e}$
;
 $Re_{\unicode[STIX]{x1D703}}=\unicode[STIX]{x1D70C}_{e}u_{e}\unicode[STIX]{x1D703}/\unicode[STIX]{x1D707}_{e}$
;
 $Re_{\unicode[STIX]{x1D6FF}_{2}}=\unicode[STIX]{x1D70C}_{e}u_{e}\unicode[STIX]{x1D703}/\unicode[STIX]{x1D707}_{w}$
;
 $Re_{\unicode[STIX]{x1D70F}}=\unicode[STIX]{x1D70C}_{w}u_{\unicode[STIX]{x1D70F}}\unicode[STIX]{x1D6FF}/\unicode[STIX]{x1D707}_{w}$
;
 $C_{f}=2\unicode[STIX]{x1D70F}_{w}/(\unicode[STIX]{x1D70C}_{e}u_{e}^{2})$
;
 $H=\unicode[STIX]{x1D6FF}^{\ast }/\unicode[STIX]{x1D703}$
; and
 $H_{i}=\unicode[STIX]{x1D6FF}_{i}^{\ast }/\unicode[STIX]{x1D703}_{i}$
. The subscript
 $e$
denotes properties evaluated at the edge of the boundary layer.

A necessary check is that the incoming boundary layer is properly developed prior to interaction with the conical shock. For that purpose, we consider a reference station at
 $x_{ref}=27.5\unicode[STIX]{x1D6FF}_{in}$
, located upstream of the cone leading edge. The global boundary layer properties at this station are listed in table 1, where
 $\unicode[STIX]{x1D6FF}$
is the
 $99\,\%$
thickness,
 $\unicode[STIX]{x1D6FF}^{\ast }$
is the displacement thickness
 $$\begin{eqnarray}\unicode[STIX]{x1D6FF}^{\ast }=\int _{0}^{\unicode[STIX]{x1D6FF}_{e}}\left(1-\frac{\bar{\unicode[STIX]{x1D70C}}}{\unicode[STIX]{x1D70C}_{e}}\frac{\bar{u}}{u_{e}}\right)\,\text{d}y,\end{eqnarray}$$
and
 $\unicode[STIX]{x1D703}$
is the momentum thickness
 $$\begin{eqnarray}\unicode[STIX]{x1D703}=\int _{0}^{\unicode[STIX]{x1D6FF}_{e}}\frac{\bar{\unicode[STIX]{x1D70C}}}{\unicode[STIX]{x1D70C}_{e}}\frac{\bar{u}}{u_{e}}\left(1-\frac{\bar{u}}{u_{e}}\right)\,\text{d}y,\end{eqnarray}$$
the upper integration limit
 $\unicode[STIX]{x1D6FF}_{e}$
denoting the edge of the rotational part of the boundary layer, defined as the point where the mean spanwise vorticity becomes less than
 $0.005u_{\infty }/\unicode[STIX]{x1D6FF}_{in}$
(Pirozzoli et al.
Reference Pirozzoli, Bernardini and Grasso2010). The subscript
 $e$
is used to denote the corresponding external flow properties. Table 1 reports equivalent incompressible boundary layer properties evaluated by setting to unity the density ratios in (3.1) and (3.2), and referred to with the subscript
 $i$
; it also shows the same parameters for the reference experiment of Hale (Reference Hale2015), which has much higher Reynolds number.
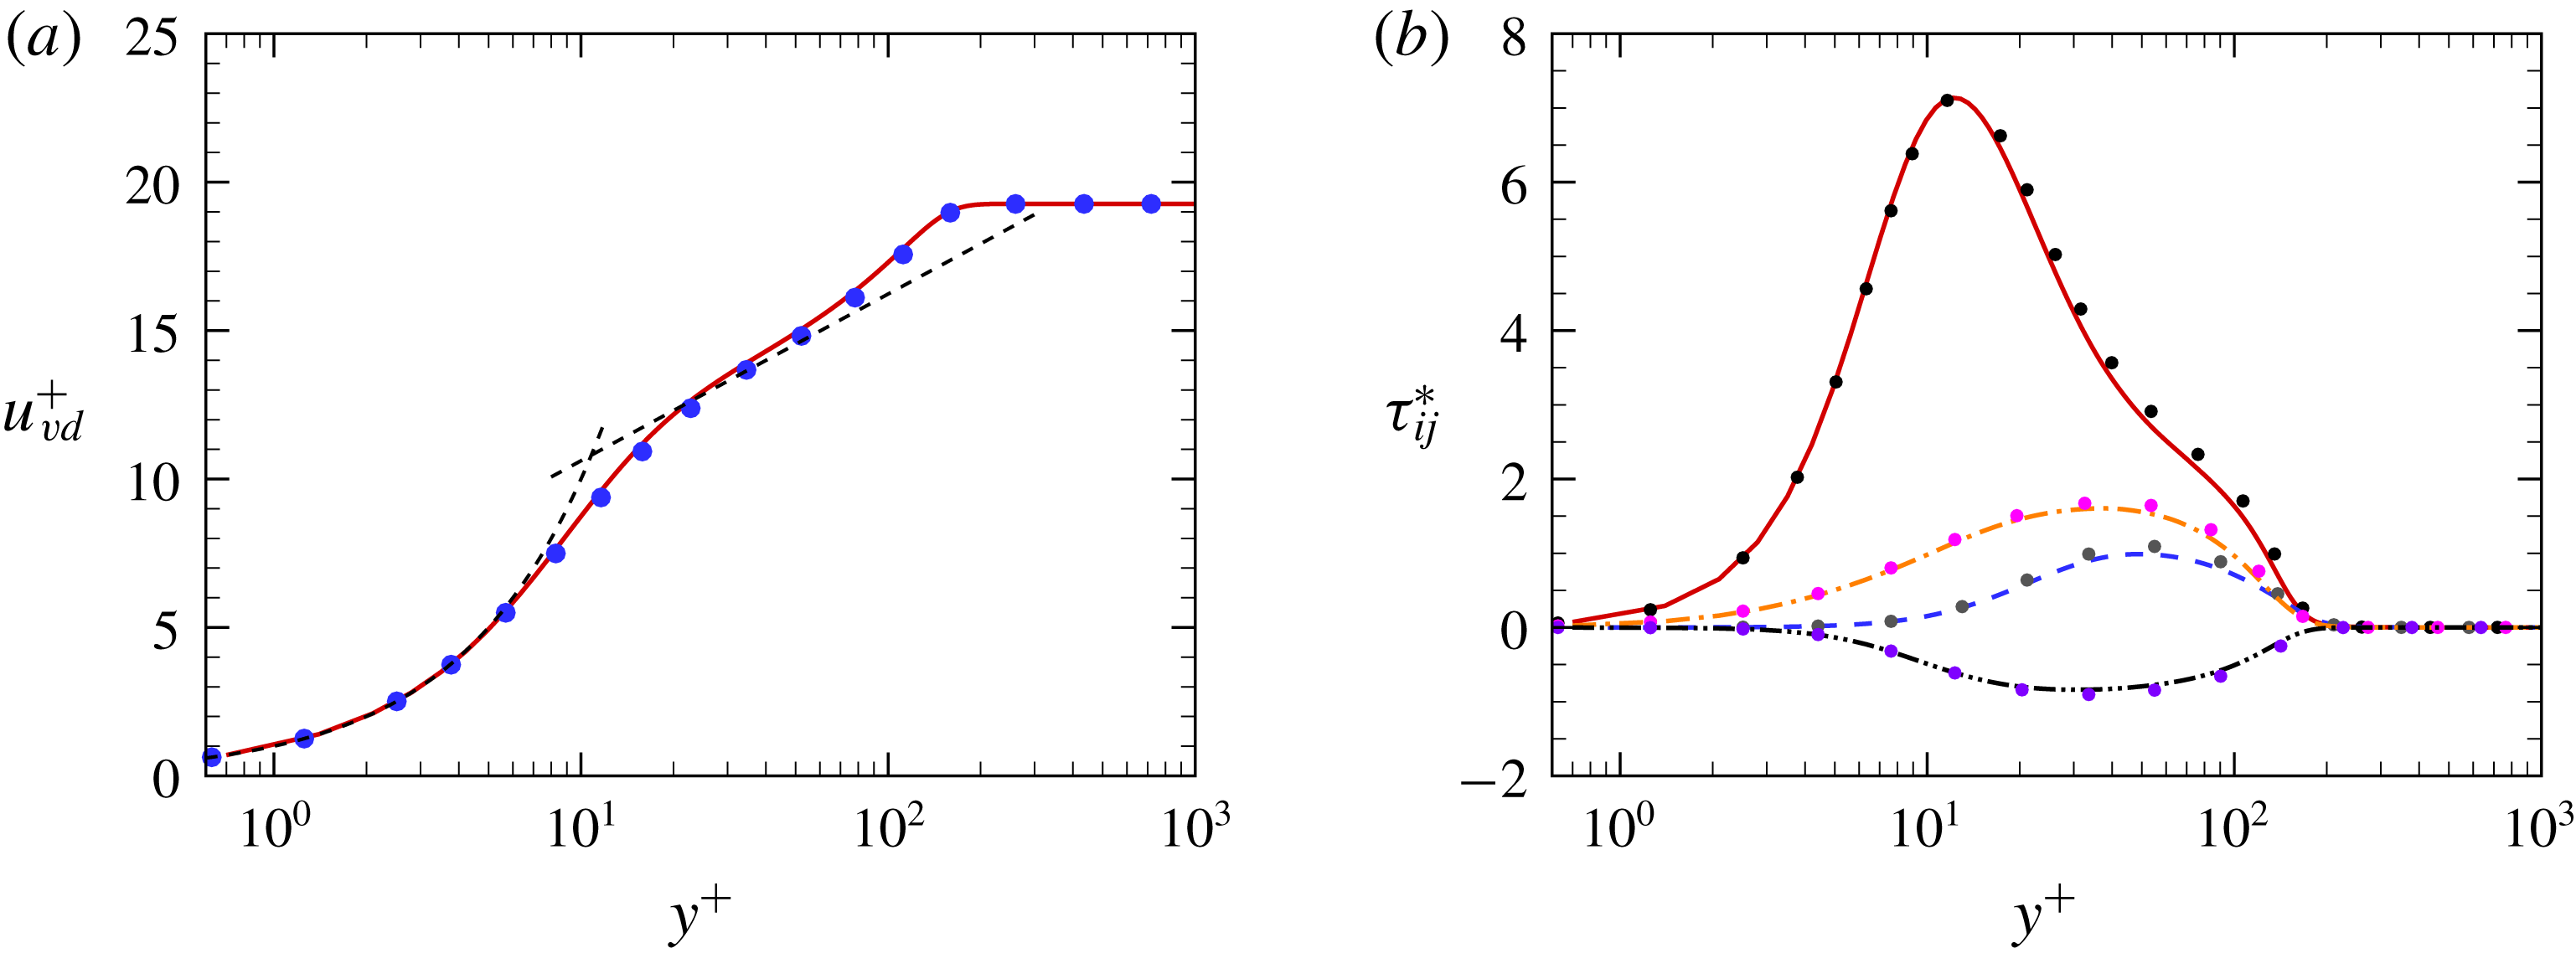
Van Driest transformed mean streamwise velocity (a), and density-scaled turbulent stresses (b) at the reference station (
 $x_{ref}=27.5\unicode[STIX]{x1D6FF}_{in}$
). Lines refer to the present DNS data, and symbols to reference data (Pirozzoli & Bernardini Reference Pirozzoli and Bernardini2011b
) at
 $M_{\infty }=2$
. In panel (a) the dashed line denotes a compound of
 $u^{+}=y^{+}$
and
 $u^{+}=5.0+1/0.41\log y^{+}$
. In panel (b) we show
 $\unicode[STIX]{x1D70F}_{11}^{\ast }$
(solid),
 $\unicode[STIX]{x1D70F}_{22}^{\ast }$
(dashed),
 $\unicode[STIX]{x1D70F}_{33}^{\ast }$
(dot-dashed) and
 $\unicode[STIX]{x1D70F}_{12}^{\ast }$
(dot-dot-dashed).

The van Driest effective velocity
 $$\begin{eqnarray}u_{vd}=\int _{0}^{\bar{u}}\left(\frac{\bar{\unicode[STIX]{x1D70C}}}{\bar{\unicode[STIX]{x1D70C}}_{w}}\right)^{1/2}\,\text{d}\bar{u},\end{eqnarray}$$
is used in figure 6(a) to compare with boundary layer data at very similar flow conditions (Pirozzoli & Bernardini Reference Pirozzoli and Bernardini2011b
), with minor difference in Mach number. The same solver was used, and the only relevant difference in the computational set-up was the location of the recycling station, which was set at
 $x_{rec}=50\unicode[STIX]{x1D6FF}_{in}$
. Comparison with the reference data is quite good, and in particular the velocity profiles show linear behaviour up to
 $y^{+}\simeq 5$
, as expected for adiabatic boundary layers (Smits & Dussauge Reference Smits and Dussauge2006), and a narrow range with near-logarithmic variation. Comparison of the density-scaled velocity correlations
 $$\begin{eqnarray}\unicode[STIX]{x1D70F}_{ij}^{\ast }=\frac{\overline{\unicode[STIX]{x1D70C}}\widetilde{u_{i}^{\prime \prime }u_{j}^{\prime \prime }}}{\unicode[STIX]{x1D70F}_{w}},\end{eqnarray}$$
is also shown in figure 6(b). The agreement with the reference data is again quite good, which leads us to conclude that the upstream boundary layer corresponds well to a healthy state of equilibrium wall turbulence.
3.2 General flow organization
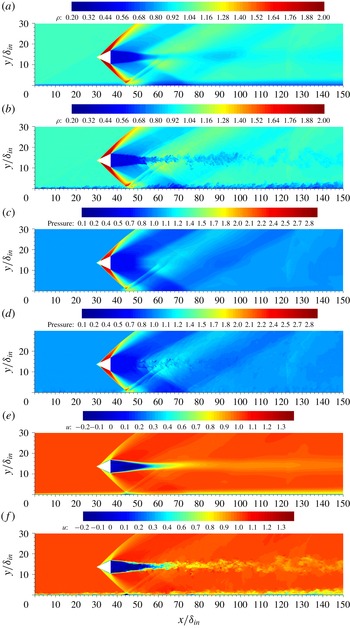
Visualization of time-averaged (a,c,e) and instantaneous (b,d,f) flow field in the symmetry plane (
 $z=0$
). The blank region corresponds to the conical shock generator. Panels (a,b) density,
 $0.2\leqslant \bar{\unicode[STIX]{x1D70C}}/\unicode[STIX]{x1D70C}_{\infty }\leqslant 2.0$
; panels (c,d) pressure,
 $0.1\leqslant \bar{p}/p_{\infty }\leqslant 2.9$
; and panels (e,f) streamwise velocity,
 $-0.2\leqslant \bar{u}/u_{\infty }\leqslant 1.4$
. Colour scales from blue to red, as shown.

Having established the properties of the incoming boundary layer, we proceed to describe the main features of the flow upon interaction with the conical shock. For that purpose, time-averaged and instantaneous fields of density, pressure and streamwise velocity are shown in the symmetry plane in figure 7. The flow exhibits an overall organization similar to experimental observations (Hale Reference Hale2015), with the shock wave generated by the cone impinging on the bottom wall surface, thus leading to CSBLIs. This is clearly seen in the density field, which well highlights the overall wave pattern. The main interacting shock is generated as straight at the cone surface, and subsequently it bends backwards upon merging with the expansion fan that arises at the cone trailing edge. A continuous compression may be inferred from the pressure contours along the cone surface, which may be justified by recalling that the flow is not uniform past conical shocks, unlike for planar shocks. The shock impinges on the bottom wall at
 $x/\unicode[STIX]{x1D6FF}_{in}\approx 45$
. The streamwise velocity contours in figure 7(e) well highlight the thickening of the boundary layer in this region. As also in canonical planar interactions (Pirozzoli & Grasso Reference Pirozzoli and Grasso2006), the reflected wave system consists of a precursor wave associated with the upstream influence mechanism, and a trailing wave associated with boundary layer reattachment. The panels in figure 7 also bring out the presence of an extended low-speed region in the wake of the cone with turbulent flow, which is closed by a conical recompression shock (Herrin & Dutton Reference Herrin and Dutton1994), originating at
 $x/\unicode[STIX]{x1D6FF}_{in}\approx 50$
, and interacting with the developing boundary layer at
 $x/\unicode[STIX]{x1D6FF}_{in}\approx 75$
. An additional weak compression wave is also seen to be generated at the upper boundary of the computational domain owing to imperfect radiation of numerical disturbances, and hitting the wall at
 $x/\unicode[STIX]{x1D6FF}_{in}\approx 100$
. The dynamical character of the reflected shock system, which oscillates back and forth, may be clearly appreciated in supplementary movie 1 (available at https://doi.org/10.1017/jfm.2019.558).
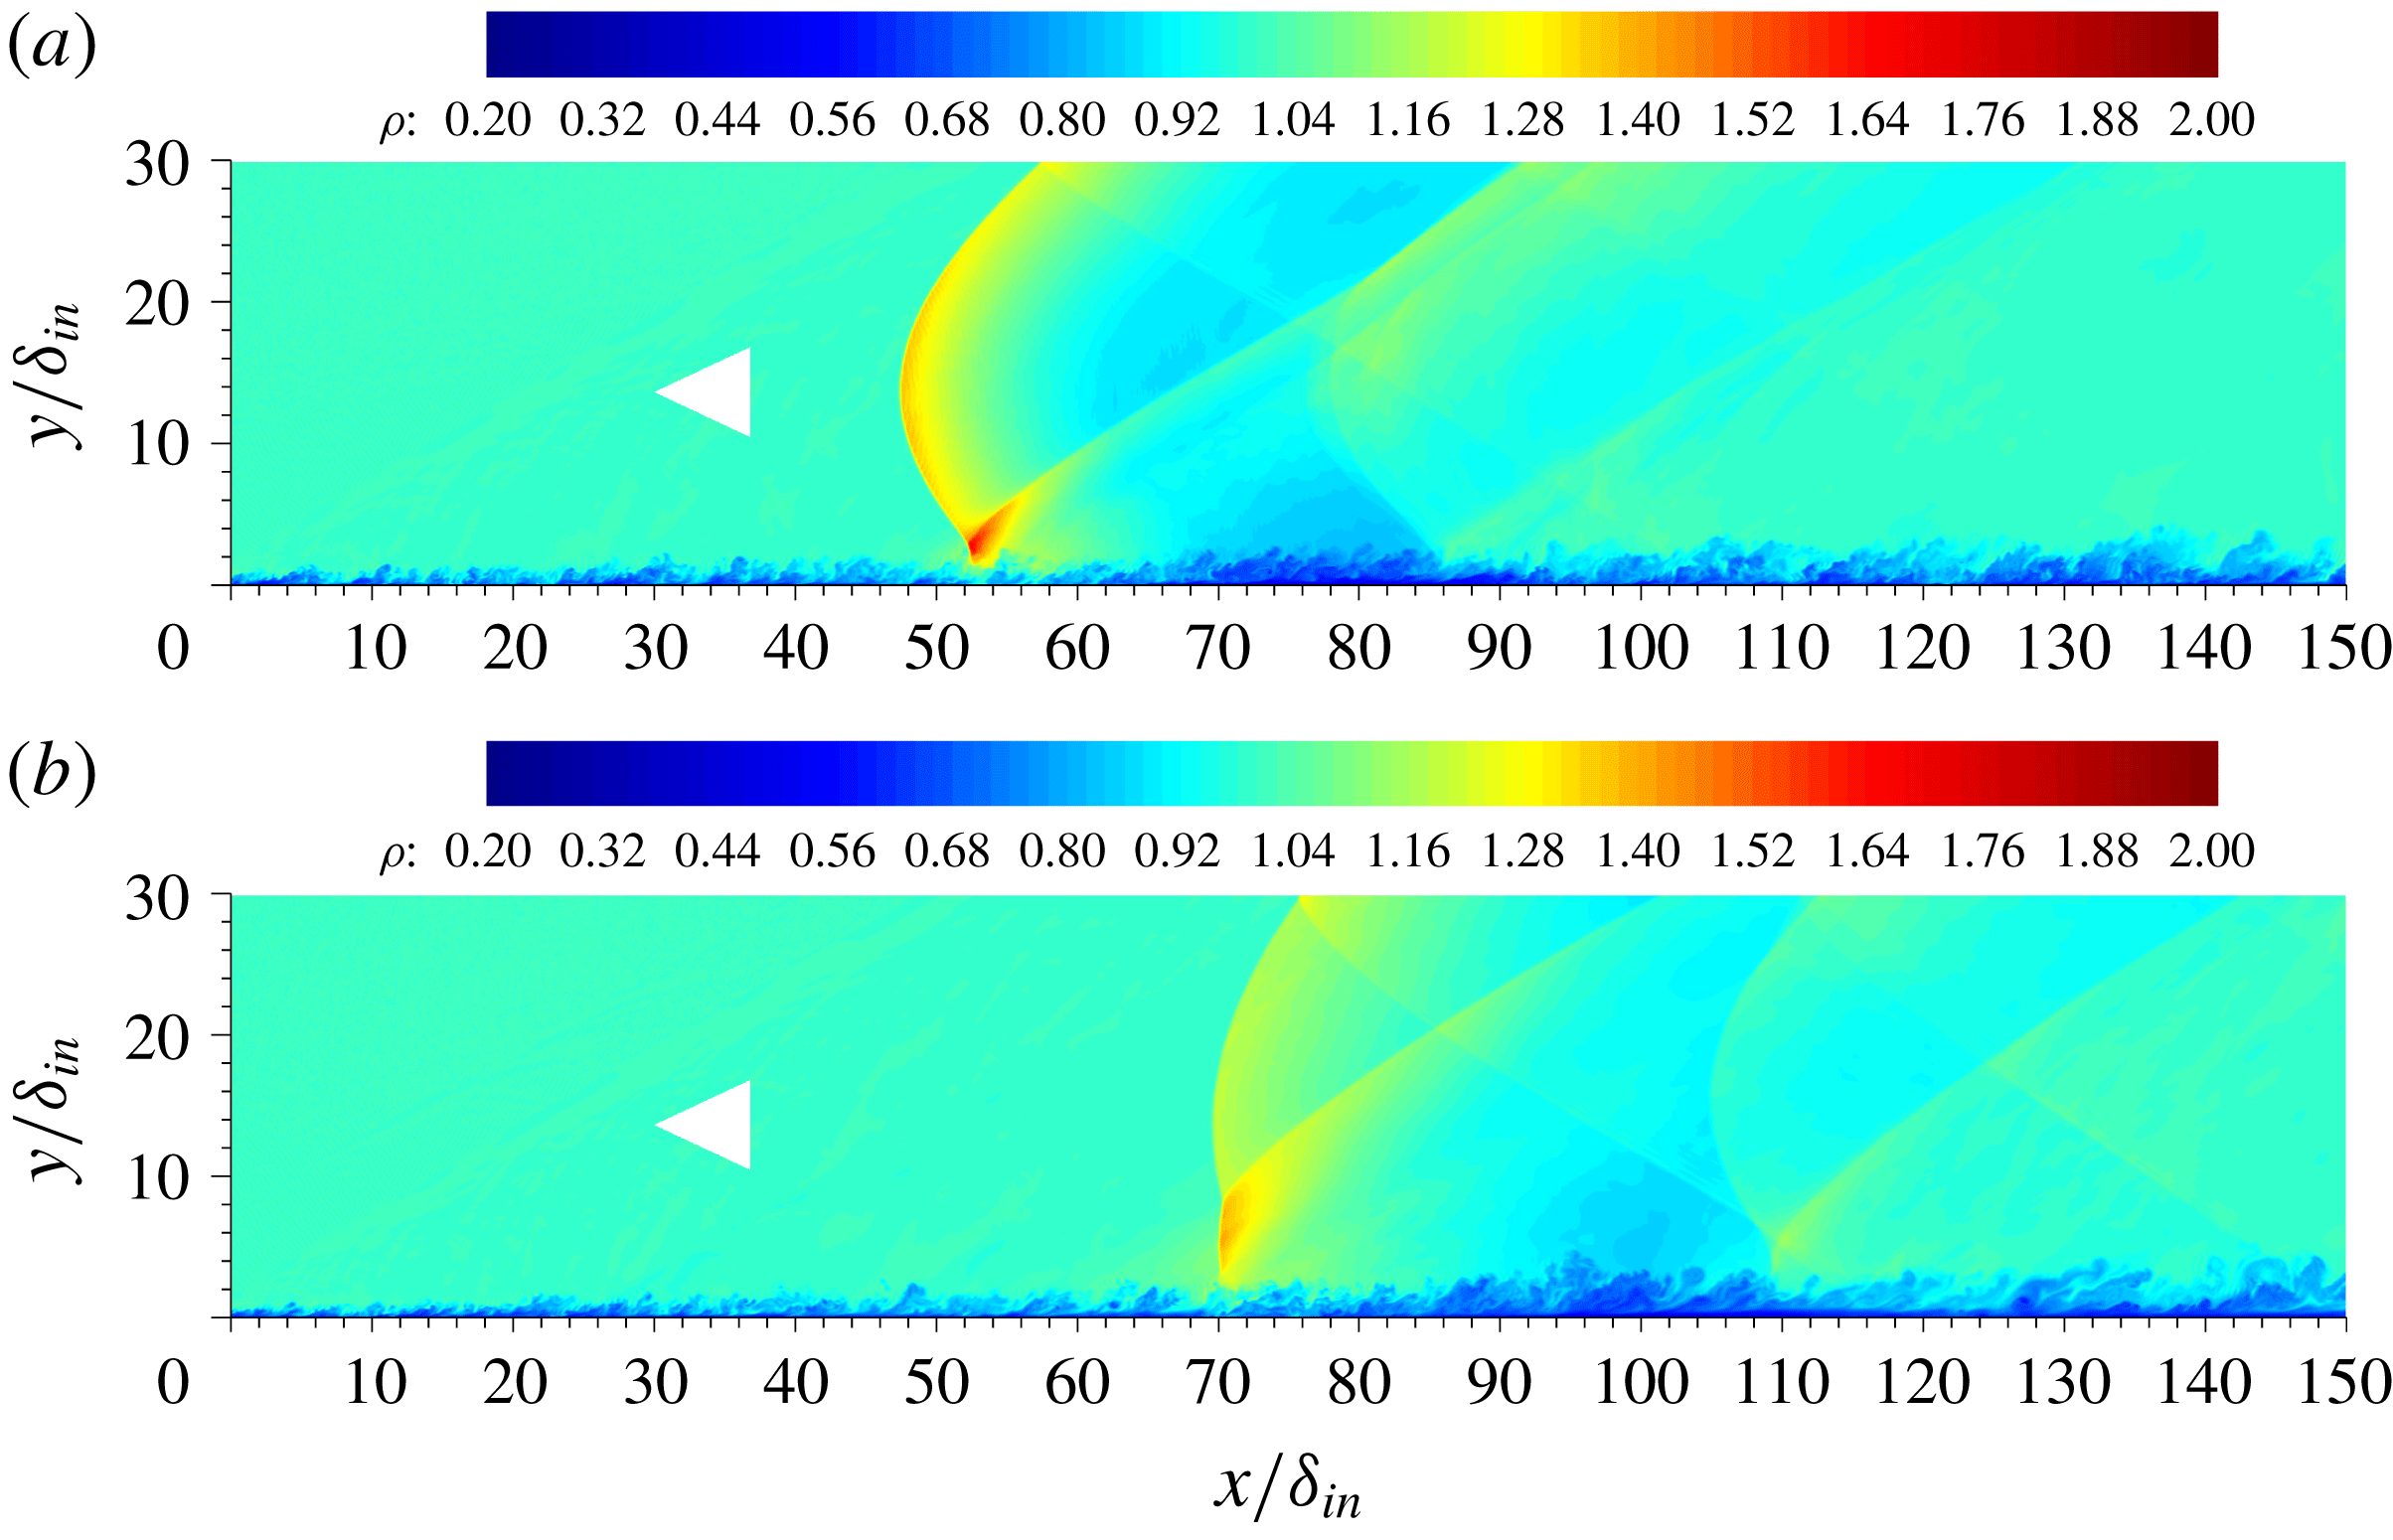
Instantaneous density contours at
 $z/\unicode[STIX]{x1D6FF}_{in}=-15$
(a) and
 $z/\unicode[STIX]{x1D6FF}_{in}=-30$
(b). Contours are shown for
 $0.2\leqslant \unicode[STIX]{x1D70C}/\unicode[STIX]{x1D70C}_{\infty }\leqslant 2.0$
, from blue to red. The cone trace in the symmetry plane is shown for reference purposes.

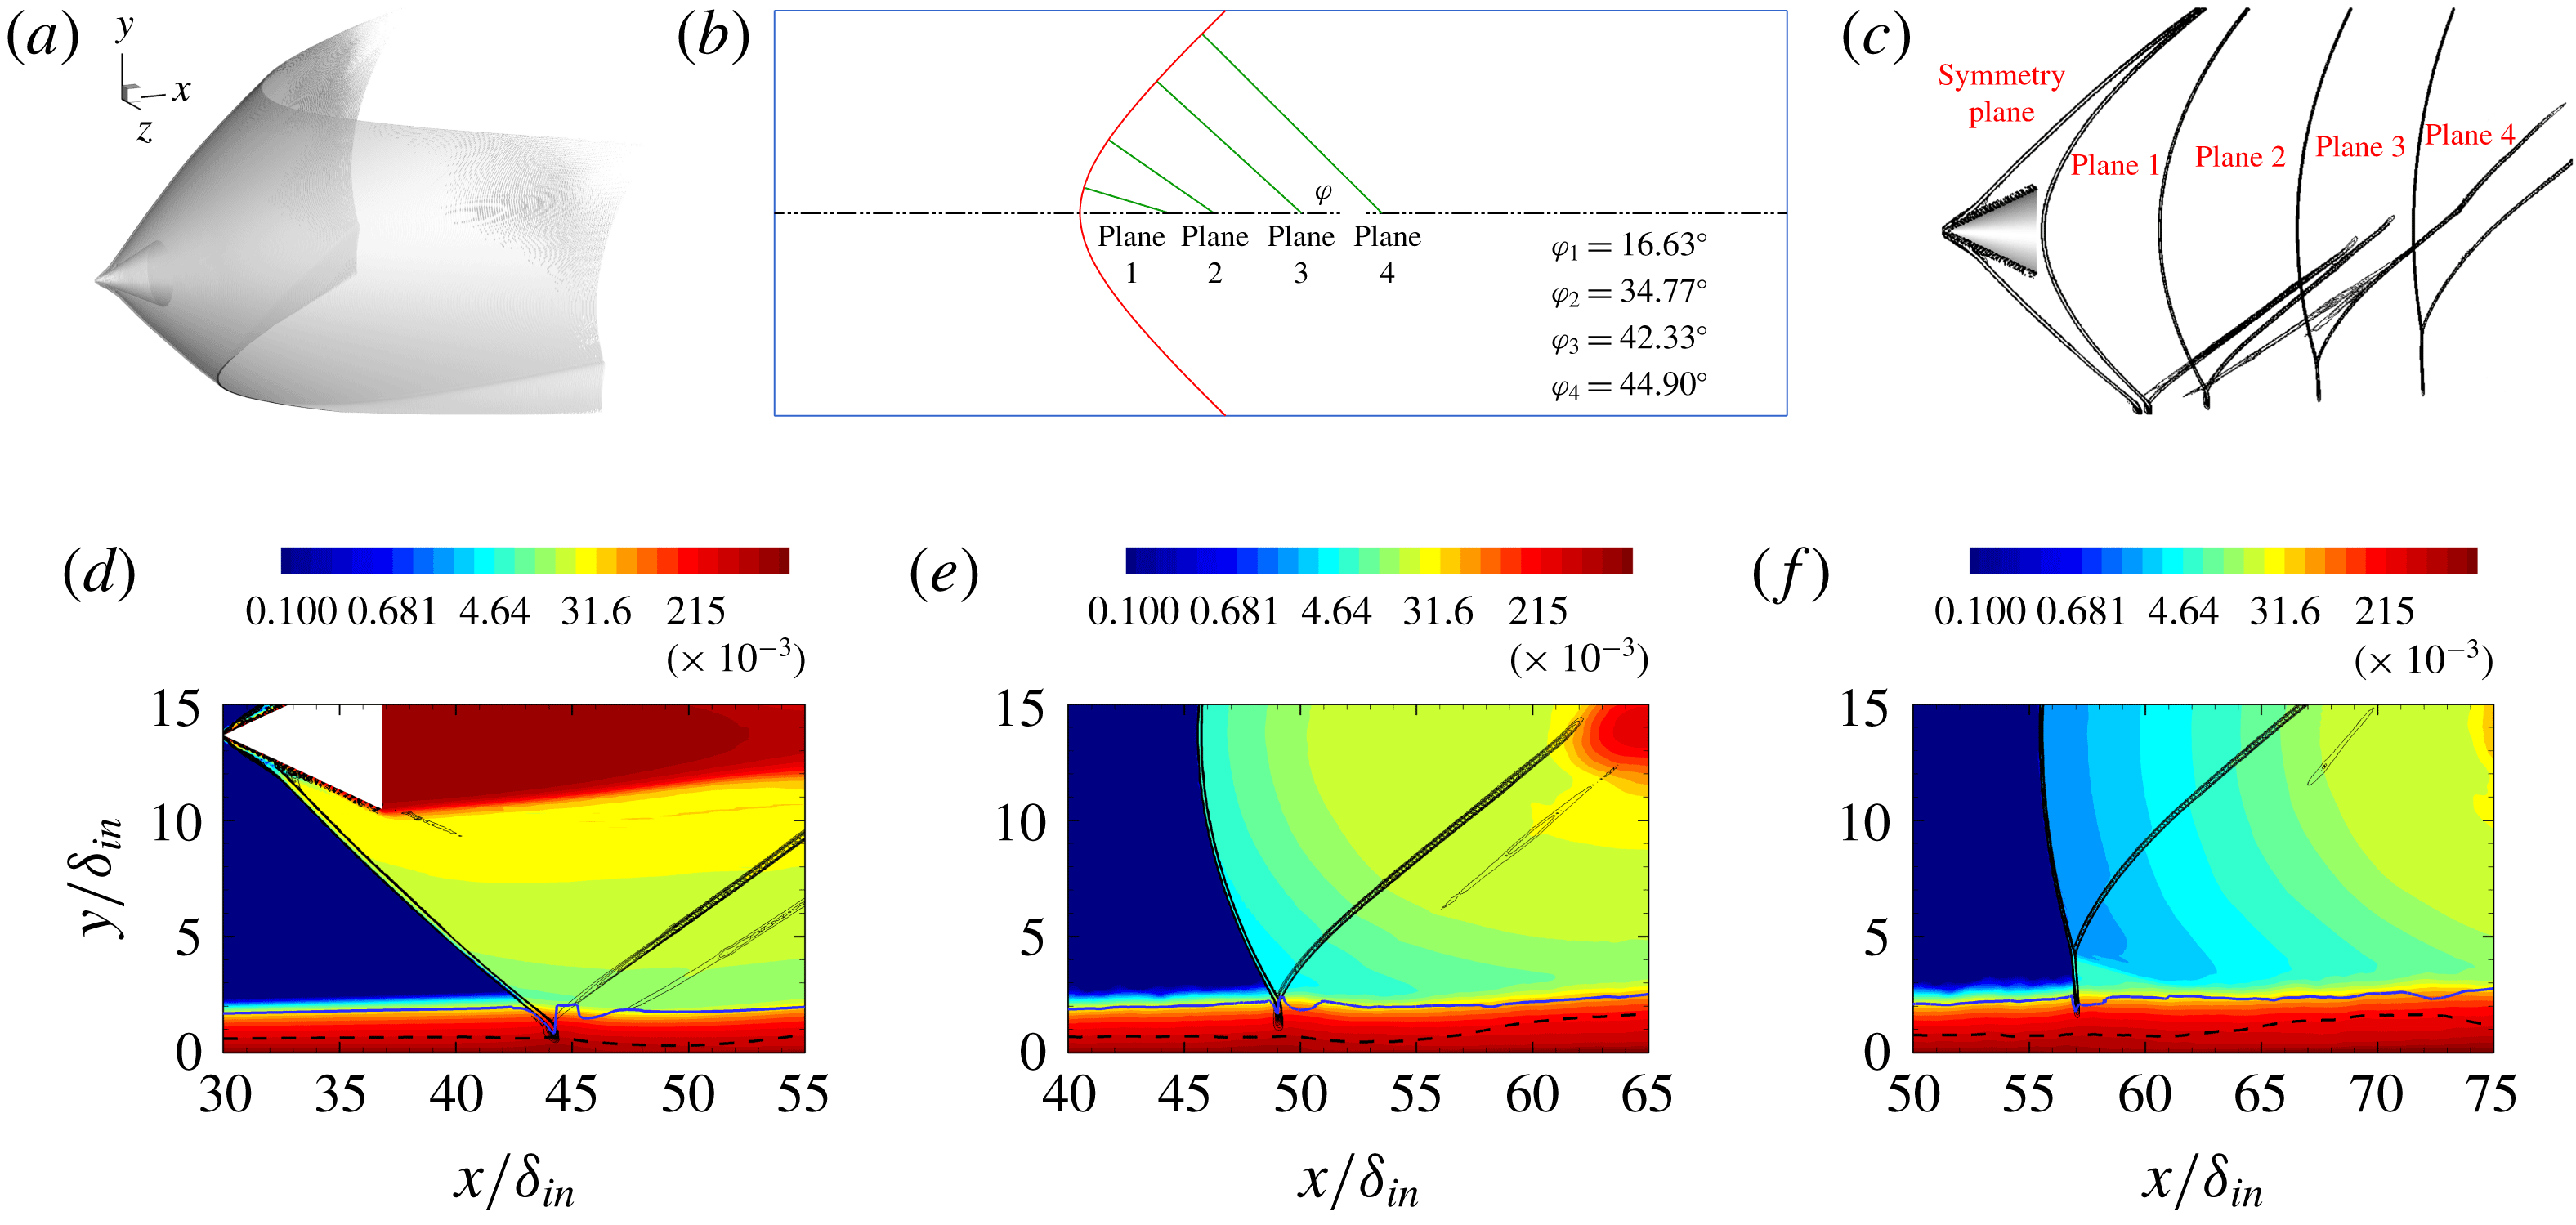
To understand the three-dimensional character of the flow field, wall-normal/streamwise sections at two additional spanwise locations are reported in figure 8, where instantaneous density contours are plotted using the same style as in figure 7. Figure 8 shows that the conical shock traces are not straight lines, as in the symmetry plane, but rather they have hyperbolic shape, as should be the case. Additional features should also be noted. First, in particular, we find that reflection of the primary interaction shock changes from regular to Mach type (Migotsky & Morkovin Reference Migotsky and Morkovin1951). Second, the density jump across the shock decreases gradually owing to flow three-dimensionality and interaction of the expansion fan originating at the cone trailing edge. Third, the wake recompression shock has a similar structure as the primary conical shock, and its in-wall trace is also hyperbolic.
Migotsky & Morkovin (Reference Migotsky and Morkovin1951) theoretically analysed the reflection of a conical shock from a planar surface in the limit of strictly inviscid flow. They predicted that transition from regular to Mach reflection should occur at a critical value of the angle formed by the normal to the shock trace in the wall plane with the streamwise direction (
 $\unicode[STIX]{x1D711}$
; see figure 9
b). At the flow conditions under scrutiny here, transition should occur for
 $\unicode[STIX]{x1D711}\approx 9^{\circ }$
. In order to visualize the shock structure in the present DNS, in figure 9 we show contours of the shock sensor. Information is also provided in figure 9 in a series of planes normal to the shock wall trace. To clarify the occurrence of different types of shock reflection, in figure 9(d–f) we show contours of the thermodynamic entropy (
 $s=p/\unicode[STIX]{x1D70C}^{\unicode[STIX]{x1D6FE}}$
), on which are superimposed the estimated boundary layer edge (solid blue line) and the mean sonic line (black dashed line), as a lower boundary for shock existence. The analysis here is complicated by the presence of the boundary layer, which is itself the cause of a substantial increase of entropy from the free stream towards the wall, and which causes refraction of the shock wave as it penetrates layers with lower speed, masking the possible occurrence of triple points inside the boundary layer. Outside the boundary layer, the reflection type is easily classified upon inspection of the thermodynamic entropy in the neighbourhood of the candidate triple point, which is higher for fluid crossing the normal shock foot as compared to fluid crossing the two oblique shocks. Based on the available data, we may conclude that reflection is likely to be of regular type for control planes 1 and 2, whereas it is certainly of Mach type starting at control plane 3, for which a distinct triple point emerges outside the boundary layer. Accordingly, higher entropy is observed for fluid particles travelling underneath the triple point than above.
Analysis of shock structure: isosurface of shock sensor (a); nomenclature for analysis in wall-normal planes (b); shock sensor in control planes (c); and entropy contours in symmetry plane (d), plane 2 (e) and plane 3 (f). The blue solid line and the black dashed line in panels (d–f) represent, respectively, the boundary layer edge and the sonic line. Entropy levels are logarithmically spaced in the range
 $10^{-5}\leqslant s\leqslant 1.0$
.

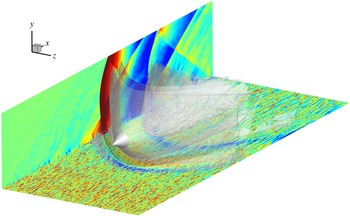
Three-dimensional view of CSBLIs. The shock structure is educed through the pressure isosurface
 $p=1.1p_{\infty }$
. Streamwise velocity contours are shown for
 $-0.3<u/u_{\infty }<2.3$
(colour scale from blue to red) in a near-wall plane at
 $y^{+}=10.5$
. Pressure contours are shown in a side plane for
 $0.8<p/p_{\infty }<1.2$
(colour scale from blue to red). Supplementary movie 2 is available for this figure.

A three-dimensional rendering of the flow structures is provided in figure 10, which includes isosurfaces of pressure, streamwise velocity contours in a near-wall plane, and pressure contours in a side plane. Figure 10 qualitatively brings out the strong relationship between the shock system and the boundary layer evolution, also observed in planar shock interactions (Pirozzoli & Bernardini Reference Pirozzoli and Bernardini2011a ; Aubard, Gloerfelt & Robinet Reference Aubard, Gloerfelt and Robinet2013). Specifically, figure 10 shows the presence of elongated streaks of high- and low-speed momentum in the zero pressure gradient (ZPG) region. As the boundary layer penetrates the first APG region, it experiences strong retardation, and a region of low momentum forms past the upstream branch of the interacting shock. Streaks are found to re-form quickly past the reflected shock, and they undergo a second suppression/re-formation cycle across the second APG zone associated with wall impingement of the recompression shock.
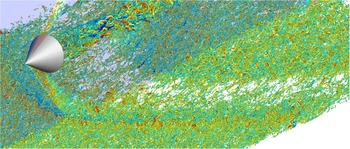
Vortical structures in CSBLIs. Vortices are educed through the isosurface of the swirling strength (
 $\unicode[STIX]{x1D706}_{ci}=1.24u_{\infty }/\unicode[STIX]{x1D6FF}_{in}$
), and coloured with the wall-normal velocity (
 $-0.37<v/u_{\infty }<0.37$
; colour scale from blue to red). Supplementary movie 3 is available for this figure.

The interaction of the boundary layer with a conical shock has a strong impact on the structure and number of vortical eddies populating the near-wall region. In figure 11 we report a three-dimensional rendering of vortical structures detected as isosurfaces of the swirling strength, defined as the imaginary part of the complex conjugate eigenvalue of the velocity gradient tensor (Zhou et al. Reference Zhou, Adrian, Balachandar and Kendall1999). Visual inspection of many flow samples (see supplementary movie 3) shows a vortex population in the ZPG region, which is similar to that found in incompressible boundary layers (Wu & Moin Reference Wu and Moin2009), including some hairpin-shaped vortices as well as more asymmetric, cane-shaped vortices. The vortices tend to disappear in the favourable pressure gradient (FPG) region, and to re-form past the recompression shock, but setting a lower threshold would still show weaker eddies in the expansion zone. Many hairpin-shaped vortices are also observed in the wake region past the shock generator, which propagate downstream, evolving into ring-shaped eddies.
3.3 Wall pressure
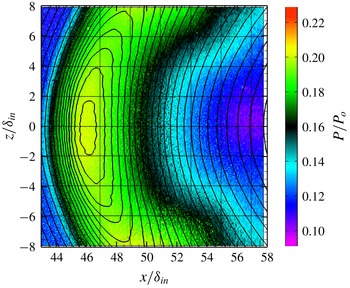
Mean wall pressure as obtained from experiments (Hale Reference Hale2015; flooded contours) and from DNS (black lines). Contour levels are shown for
 $0.09<p/p_{0}<0.23$
, where
 $p_{0}$
is the free-stream total pressure.

An important feature in shock–boundary layer interactions is the steady and unsteady wall pressure load, which may have an important impact on the behaviour of the underlying structural components. The mean wall pressure
 $\bar{p}_{w}$
across the interaction zone is compared in figure 12 with the experimental data of Hale (Reference Hale2015), obtained with pressure-sensitive paint. Good agreement is observed in the fore part of the pressure map, whereas differences are observed in the aft part, where the experiment exhibits a change of curvature of the isolines, which was attributed to sidewall effects. In order to verify this speculation, two Reynolds-averaged Navier–Stokes (RANS) simulations have been carried out at the same flow conditions as the experiment, one with the same spanwise domain as the experiment, and one with the same spanwise domain as the DNS (figures are omitted for brevity). Similar behaviour of wall pressure as in the experiment was in fact observed in the small domain, whereas the same behaviour as DNS was observed in the wider domain, which supports spanwise confinement as being responsible for the observed differences.
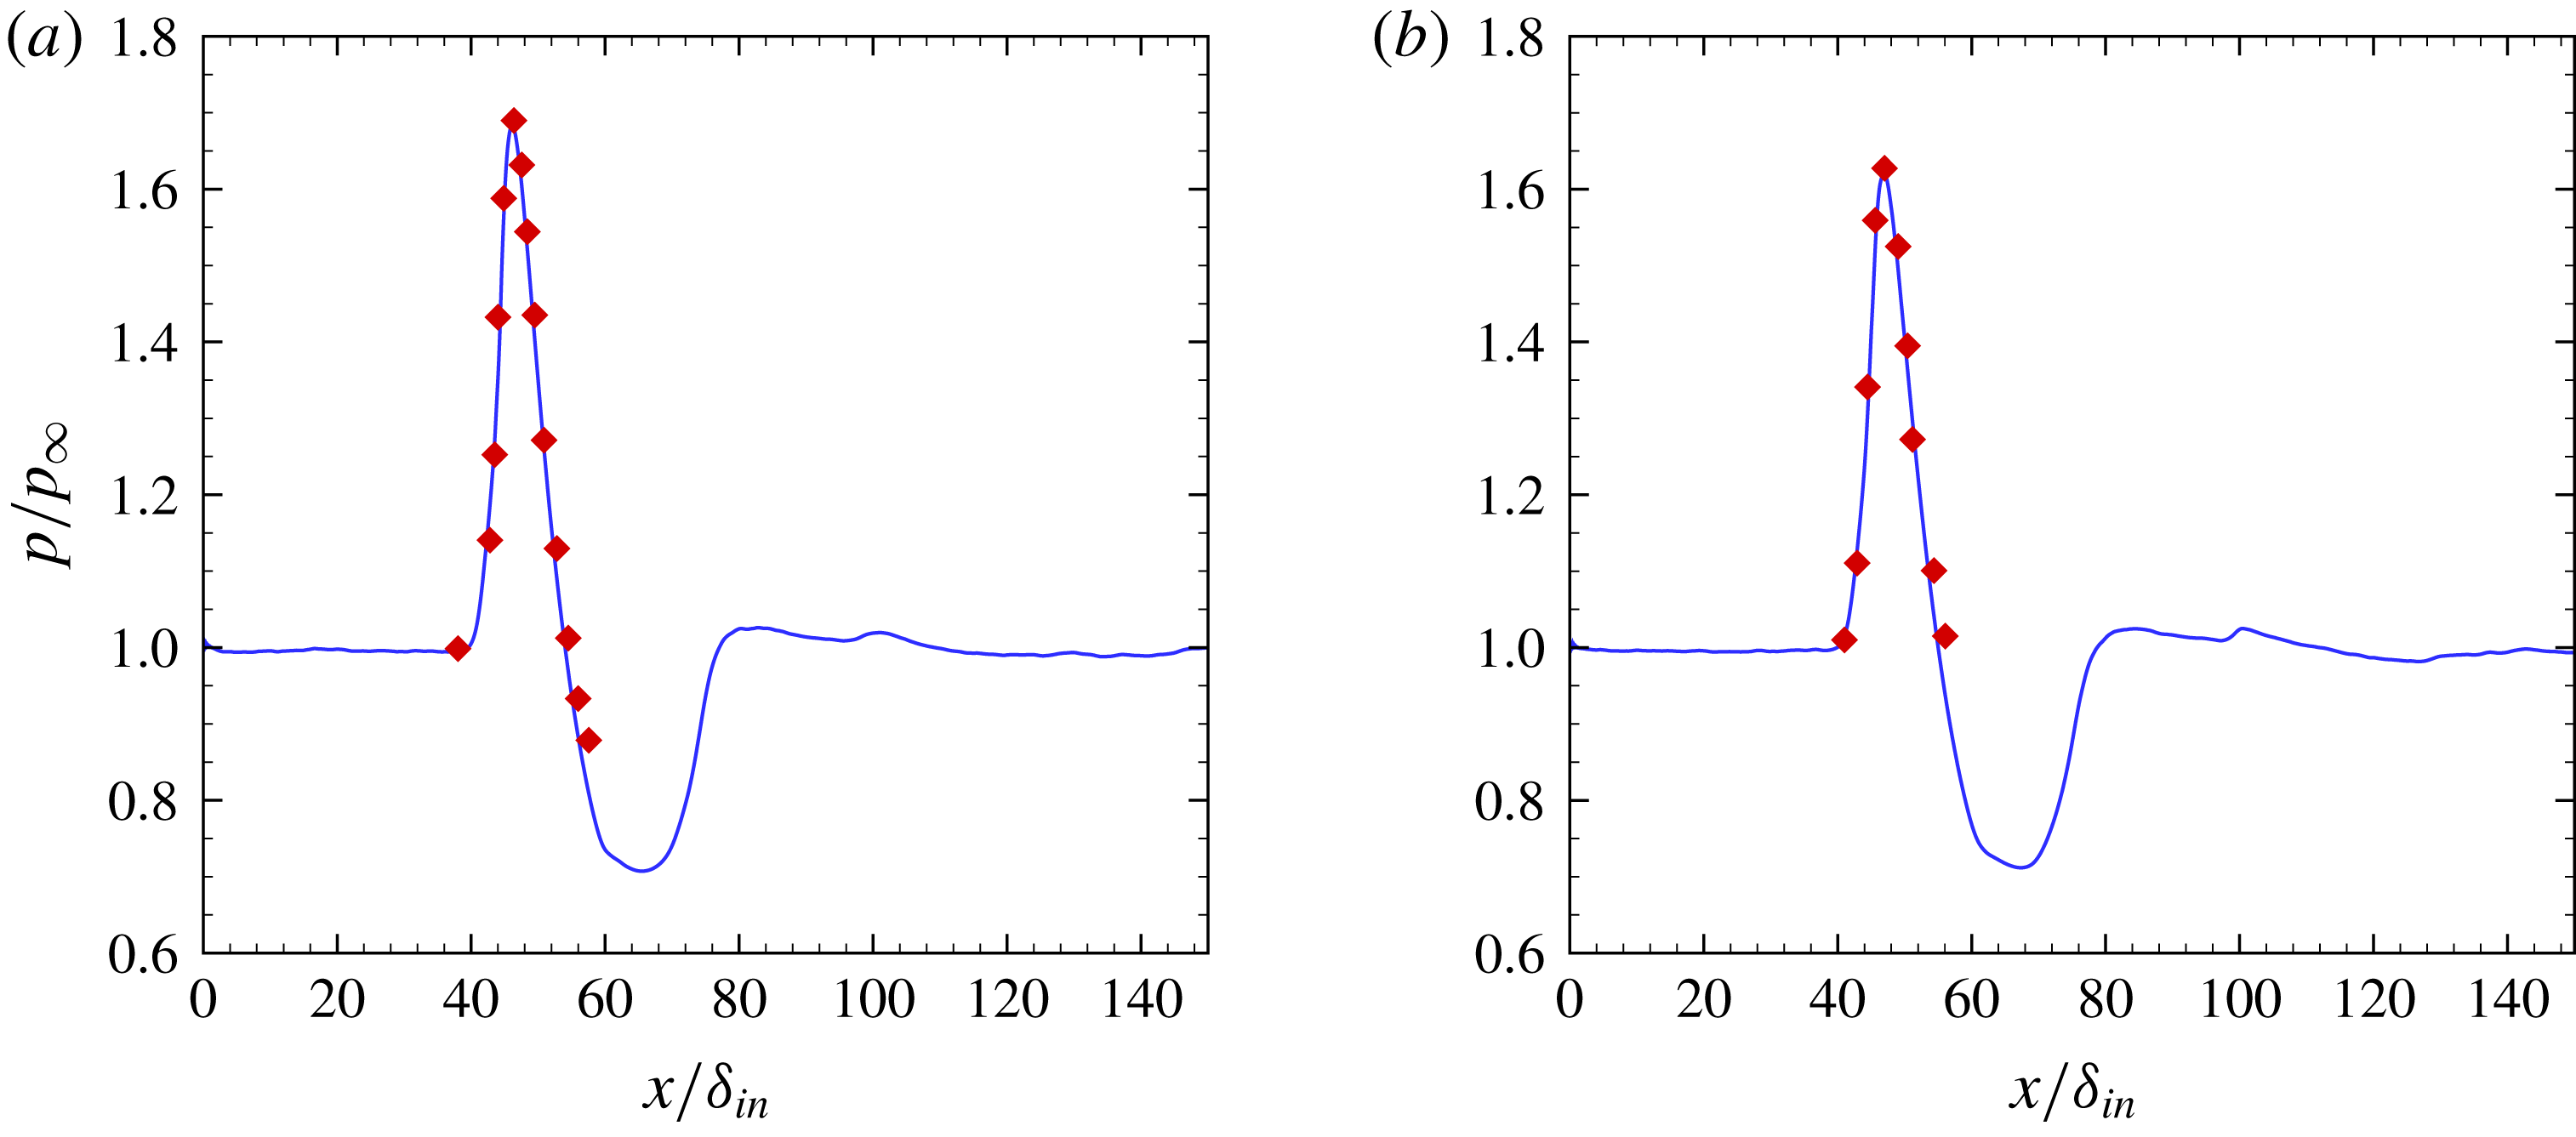
Despite the described differences and the previously cited Reynolds-number disparity, figure 12 shows nevertheless favourable comparison, at least limited to the experimental measurement window. This is better seen in figure 13, where we show mean pressure profiles at two spanwise locations. The figure brings out well the N-wave wall signature of the conical shock, with pressure rising sharply at the nominal shock impingement location, then decreasing almost linearly to a value that is lower than the free-stream value, and increasing again upon impingement of the recompression shock. The peak value along the symmetry line is attained at approximately
 $x/\unicode[STIX]{x1D6FF}_{in}\approx 46$
, whereas the peak is slightly shifted downstream at the other spanwise station, owing to the hyperbolic shape of the shock foot. After passing through the shock, pressure decreases upon passage of the expansion waves generated at the cone trailing edge. As flow develops downstream, pressure rises again in the second APG region (
 $x/\unicode[STIX]{x1D6FF}_{in}\approx 66$
). Finally, the flow returns to a nearly ZPG condition. It should be noted that the same wall pressure pattern was observed in the experiments of Gai & Teh (Reference Gai and Teh2000).
Mean wall pressure profiles at different spanwise positions:
 $z/\unicode[STIX]{x1D6FF}_{in}=0$
(a) and
 $z/\unicode[STIX]{x1D6FF}_{in}=4.35$
(b). Lines, DNS; symbols, experiment (Hale Reference Hale2015).

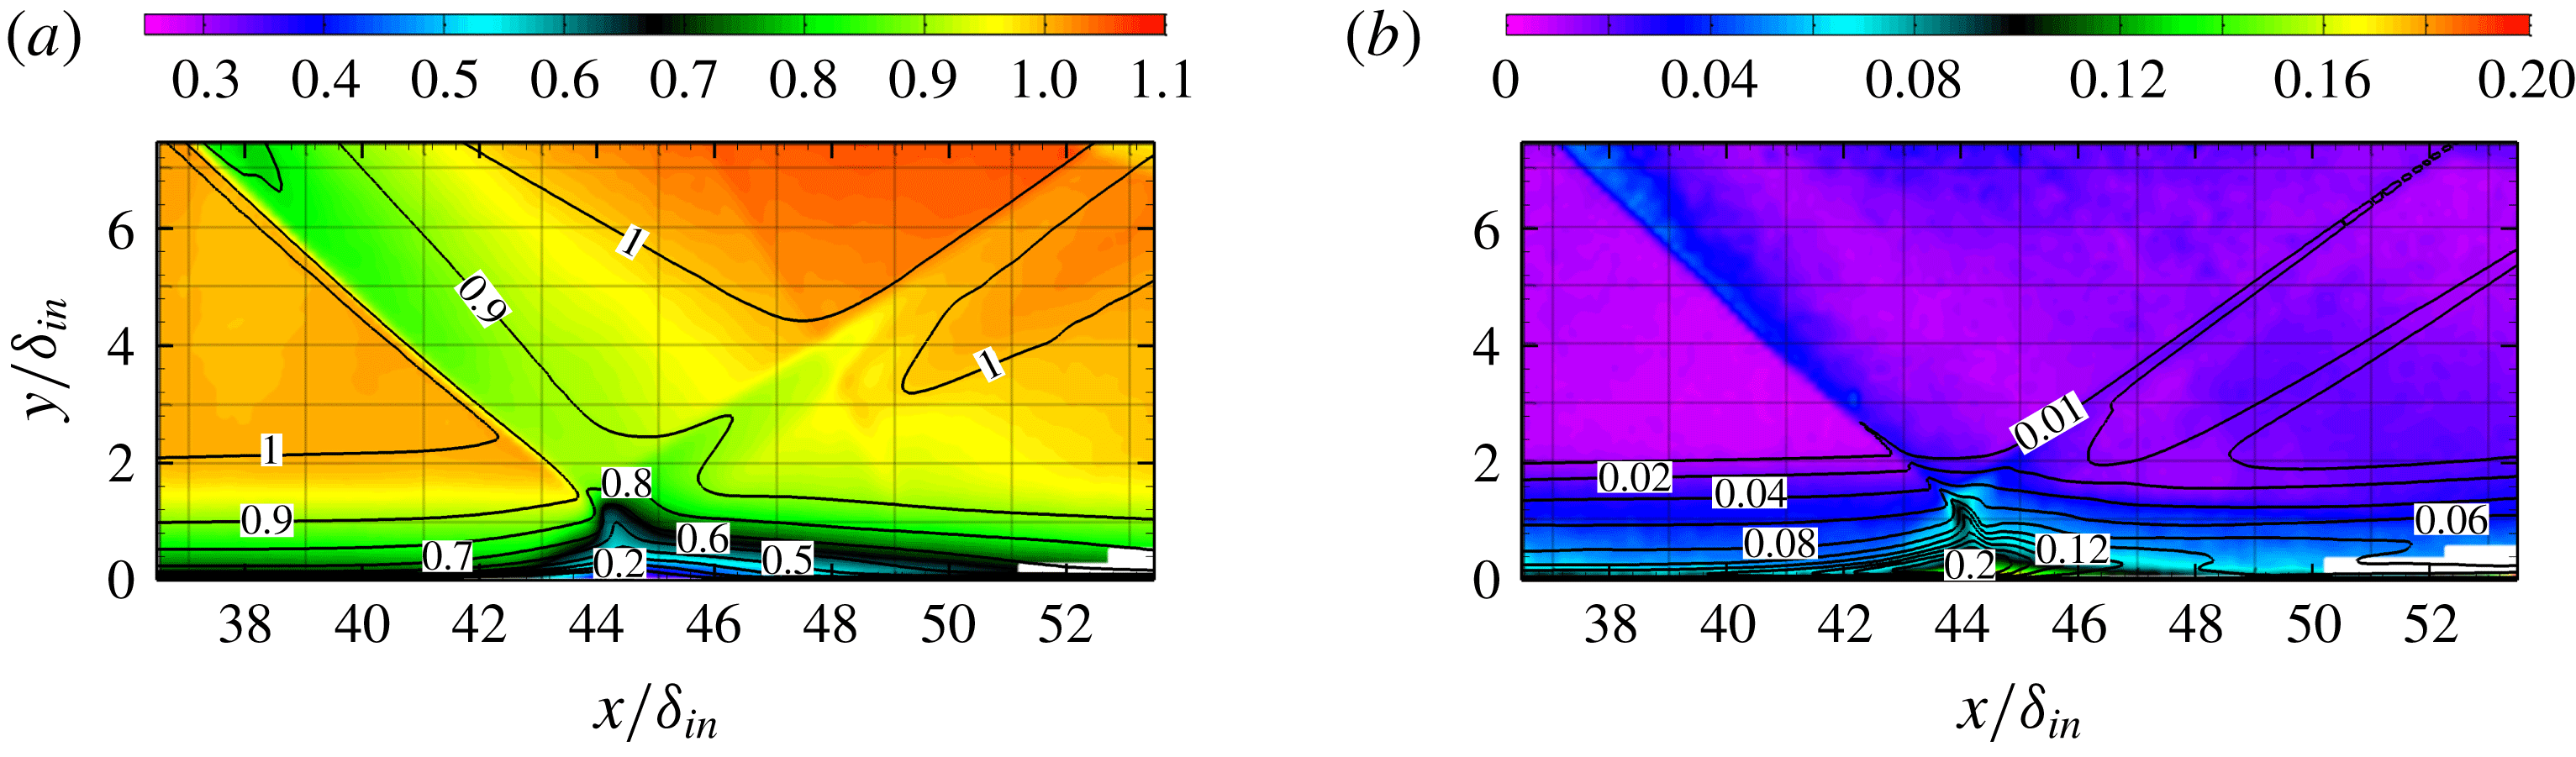
Further comparison with experimental data is shown in figure 14, where the streamwise velocity component and its root mean square (r.m.s.) are considered. The comparison of the mean velocity is quite favourable for
 $y/\unicode[STIX]{x1D6FF}_{in}\geqslant 0.2$
, although largely different Reynolds numbers yield visibly different upstream influence, whereas particle image velocimetry (PIV) data for
 $y/\unicode[STIX]{x1D6FF}_{in}\leqslant 0.2$
are probably not reliable. Similar considerations also apply to
 $u_{rms}$
, although differences are enhanced in the region of maximum turbulence intensity. Based on the comparison reported in the previous figures, we can confidently conclude that the DNS results adequately reproduce the flow physics.
Mean streamwise velocity (a) and streamwise velocity r.m.s. (b) comparison between DNS (lines) and experiment (Hale Reference Hale2015; flooded contours). Contours are shown for
 $0.2<u/u_{\infty }<1.1$
,
 $0<u_{rms}/u_{\infty }<0.2$
.

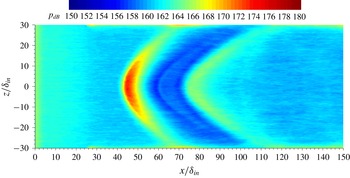
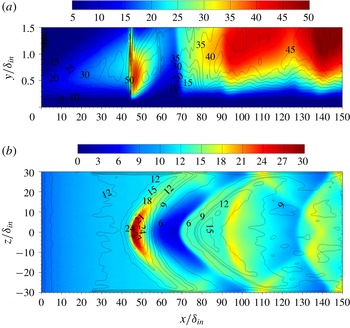
Contours of r.m.s. pressure fluctuations (
 $p_{rms}$
) in the wall plane, in dB scale,
 $p_{dB}=20\log _{10}(p_{rms}/(2\times 10^{-5}~\text{Pa}))$
, assuming
 $p_{\infty }=1$
atm. Contour levels are shown from
 $150$
to
 $180$
, from blue to red.

The r.m.s. pressure fluctuation contours are shown in figure 15. Strong spatial connection of this distribution is found with that of the vortical structures shown in figure 11. In particular, the largest values of
 $p_{rms}$
are found at the interacting shock foot, especially around the symmetry axis where the shock is stronger. Consistent decrease of the fluctuating pressure loads is observed past the incident shock in the FPG region, which is depleted with eddies. A secondary peak is observed further downstream, corresponding to re-formation of the vortical structures. Numerical artifacts should be noted on the side boundaries, which are due to the imperfect nature of the numerical radiating boundary conditions, especially in the presence of waves not propagating orthogonally to the computational boundary. These effects are, however, confined to a narrow layer adjacent to the boundaries.
3.4 Boundary layer development
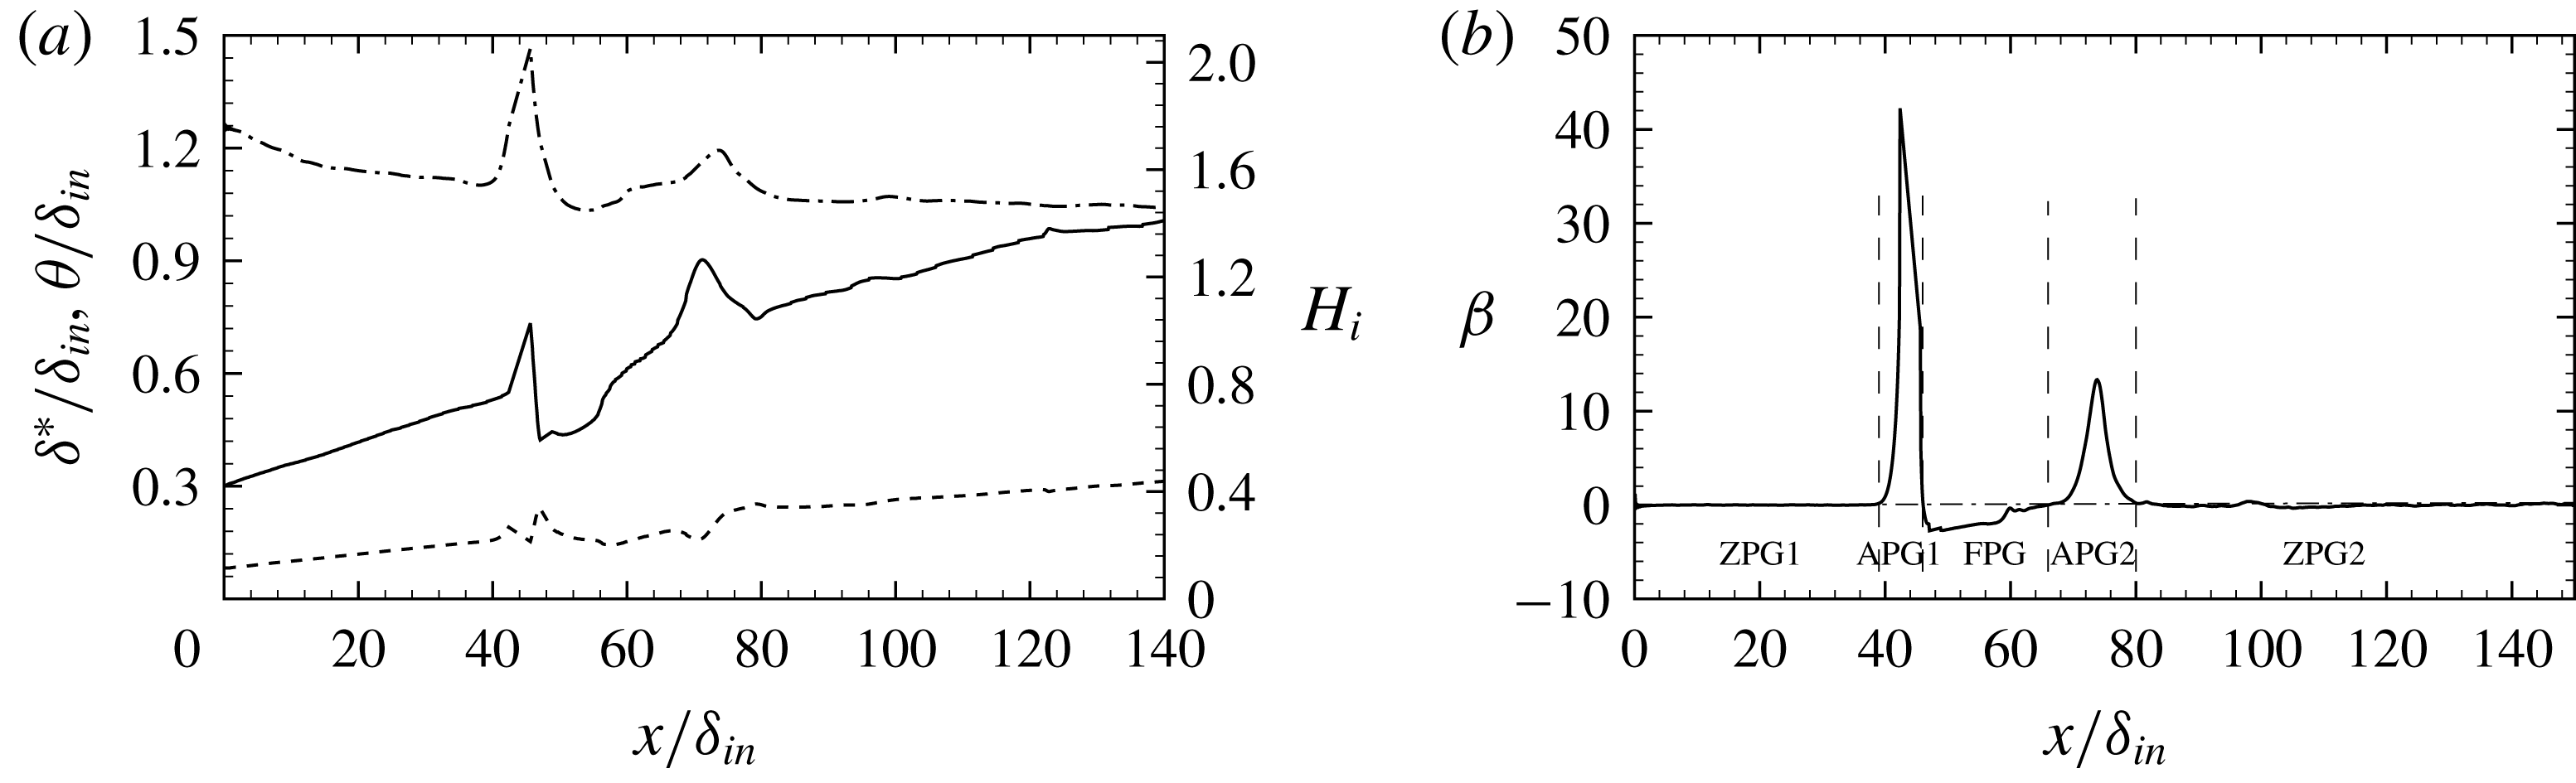
Streamwise evolution of boundary layer properties in the symmetry plane: (a) displacement thickness (solid), momentum thickness (dashed) and shape factor (dot-dashed). (b) Clauser pressure gradient parameter.

In order to characterize the spatial development of the wall boundary layer, we analyse the distributions of the displacement and momentum thicknesses, defined in (3.1) and (3.2). The streamwise distributions of the displacement thickness (
 $\unicode[STIX]{x1D6FF}^{\ast }$
), of the momentum thickness (
 $\unicode[STIX]{x1D703}$
) and of the incompressible shape factor (
 $H_{i}=\unicode[STIX]{x1D6FF}_{i}^{\ast }/\unicode[STIX]{x1D703}_{i}$
) along the symmetry plane are shown in figure 16(a). Upstream of the cone leading edge,
 $H_{i}$
varies between 1.55 and 1.75, as appropriate for canonical ZPG boundary layers at low Reynolds number (Wu & Moin Reference Wu and Moin2009). Corresponding to the leading edge of the interaction zone, the displacement thickness increases sharply, whereas the momentum thickness is relatively unaffected. Hence, the shape factor attains a maximum value
 $H_{i}\approx 2.0$
, indicating a less full velocity profile. The displacement thickness undergoes a sudden drop in the FPG region followed by gradual recovery, and a new peak is observed in the second APG region, also corresponding to a peak of
 $H_{i}$
. Past
 $x/\unicode[STIX]{x1D6FF}_{in}\approx 90$
, the boundary layer recovers an equilibrium state, which is an ideal continuation of the undisturbed upstream state.
Non-equilibrium states of boundary layers upon imposed pressure gradient are traditionally analysed in terms of Clauser pressure gradient parameter, defined as (Clauser Reference Clauser1954)
 $$\begin{eqnarray}\unicode[STIX]{x1D6FD}=\frac{\unicode[STIX]{x1D6FF}^{\ast }}{\unicode[STIX]{x1D70C}_{w}u_{\unicode[STIX]{x1D70F}}^{2}}\frac{\text{d}\bar{p}_{w}}{\text{d}x},\end{eqnarray}$$
whose distribution along the symmetry axis is shown in figure 16(b). According to the DNS data, the flow field may be divided into five parts: ZPG1, the upstream ZPG region, with
 $\unicode[STIX]{x1D6FD}\approx 0$
; APG1, the first APG region, where
 $\unicode[STIX]{x1D6FD}$
exhibits a sharp positive peak; FPG, where
 $\unicode[STIX]{x1D6FD}$
is negative as the flow accelerates; APG2, the second APG region, where
 $\unicode[STIX]{x1D6FD}$
attains a second positive peak; and ZPG2, the downstream ZPG region where equilibrium conditions are recovered.
Castillo & George (Reference Castillo and George2001) proposed that the proper velocity scale for the outer part of the boundary layer is the external velocity
 $u_{e}$
rather than the friction velocity, and accordingly they introduced a modified pressure gradient parameter defined as
 $$\begin{eqnarray}\unicode[STIX]{x1D6EC}=\frac{\unicode[STIX]{x1D6FF}}{\unicode[STIX]{x1D70C}_{e}u_{e}^{2}\,\text{d}\unicode[STIX]{x1D6FF}/\text{d}x}\frac{\text{d}\bar{p}_{w}}{\text{d}x}=-\frac{\unicode[STIX]{x1D6FF}}{u_{e}\,\text{d}\unicode[STIX]{x1D6FF}/\text{d}x}\frac{\text{d}u_{e}}{\text{d}x},\end{eqnarray}$$
where
 $\unicode[STIX]{x1D6FF}$
is any measure of the boundary layer thickness. They suggested that, at least in the absence of mean flow separation, the admissible equilibrium states corresponding to self-similar velocity distributions must have a constant value of
 $\unicode[STIX]{x1D6EC}$
, which in turn implies power-law dependence of the boundary layer thickness on the external velocity, namely
 $$\begin{eqnarray}\unicode[STIX]{x1D6FF}\sim u_{e}^{-1/\unicode[STIX]{x1D6EC}}.\end{eqnarray}$$
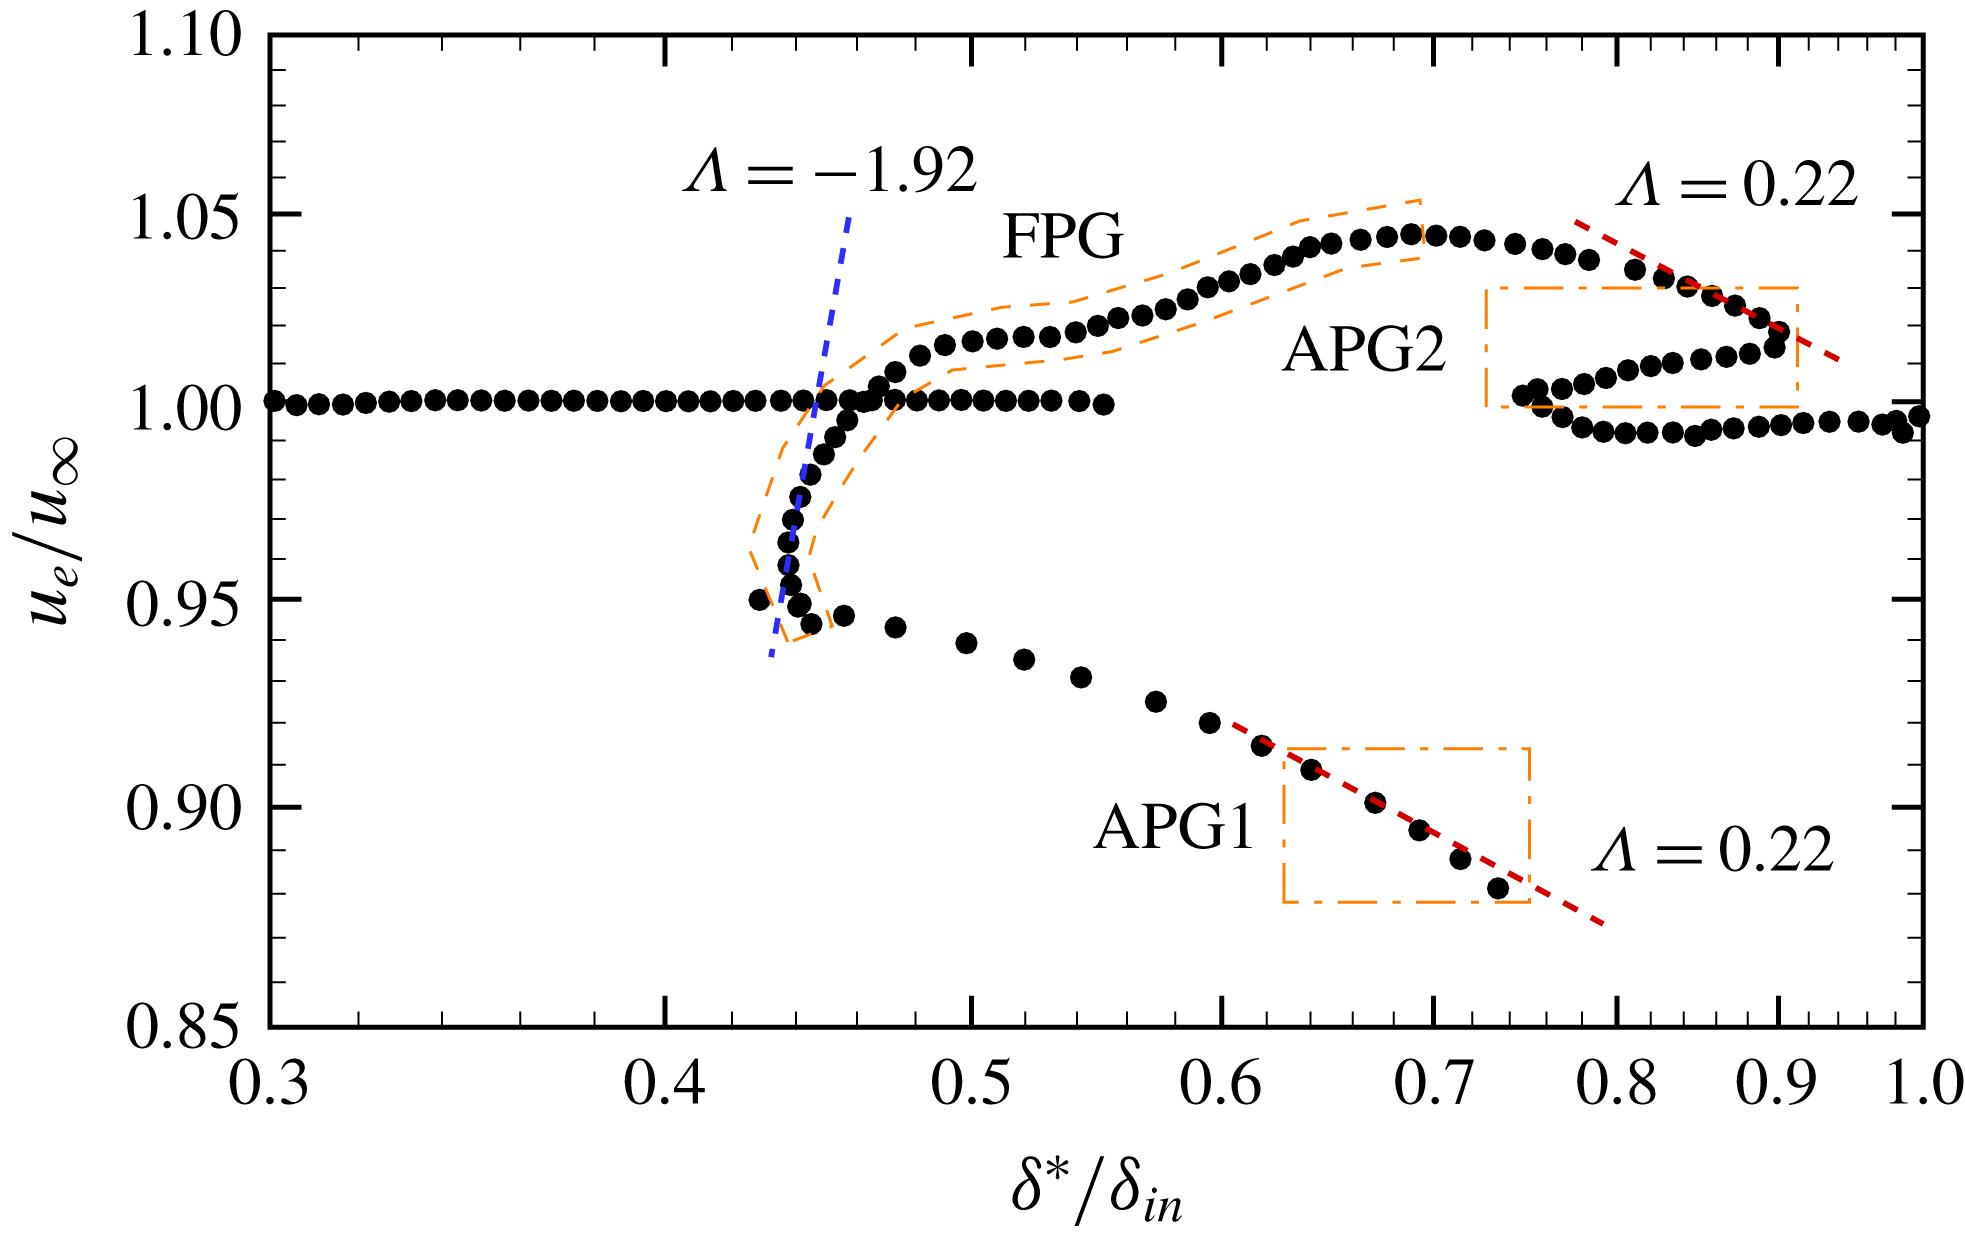
It was found that most experimental data for boundary layers in adverse and favourable pressure gradients are in fact in equilibrium according to this definition, and three values of
 $\unicode[STIX]{x1D6EC}$
were found to be possible:
 $\unicode[STIX]{x1D6EC}=0.22$
in APG,
 $\unicode[STIX]{x1D6EC}=-1.92$
in FPG and
 $\unicode[STIX]{x1D6EC}=0$
in ZPG. This is scrutinized in figure 17, where we show the boundary layer external velocity
 $u_{e}$
(evaluated at
 $y=\unicode[STIX]{x1D6FF}_{e}$
, as explained in § 3.1) as a function of the boundary layer displacement thickness. Figure 17 suggests very partial success of theoretical predictions, mainly limited to the APG regions, where scaling not far from the predicted
 $\unicode[STIX]{x1D6EC}=0.22$
is observed, whereas the FPG region seems to have a behaviour very different from the theoretical equilibrium state.
External velocity as a function of boundary layer displacement thickness along the symmetry plane. Dashed lines denote the power-law scalings given in (3.7).

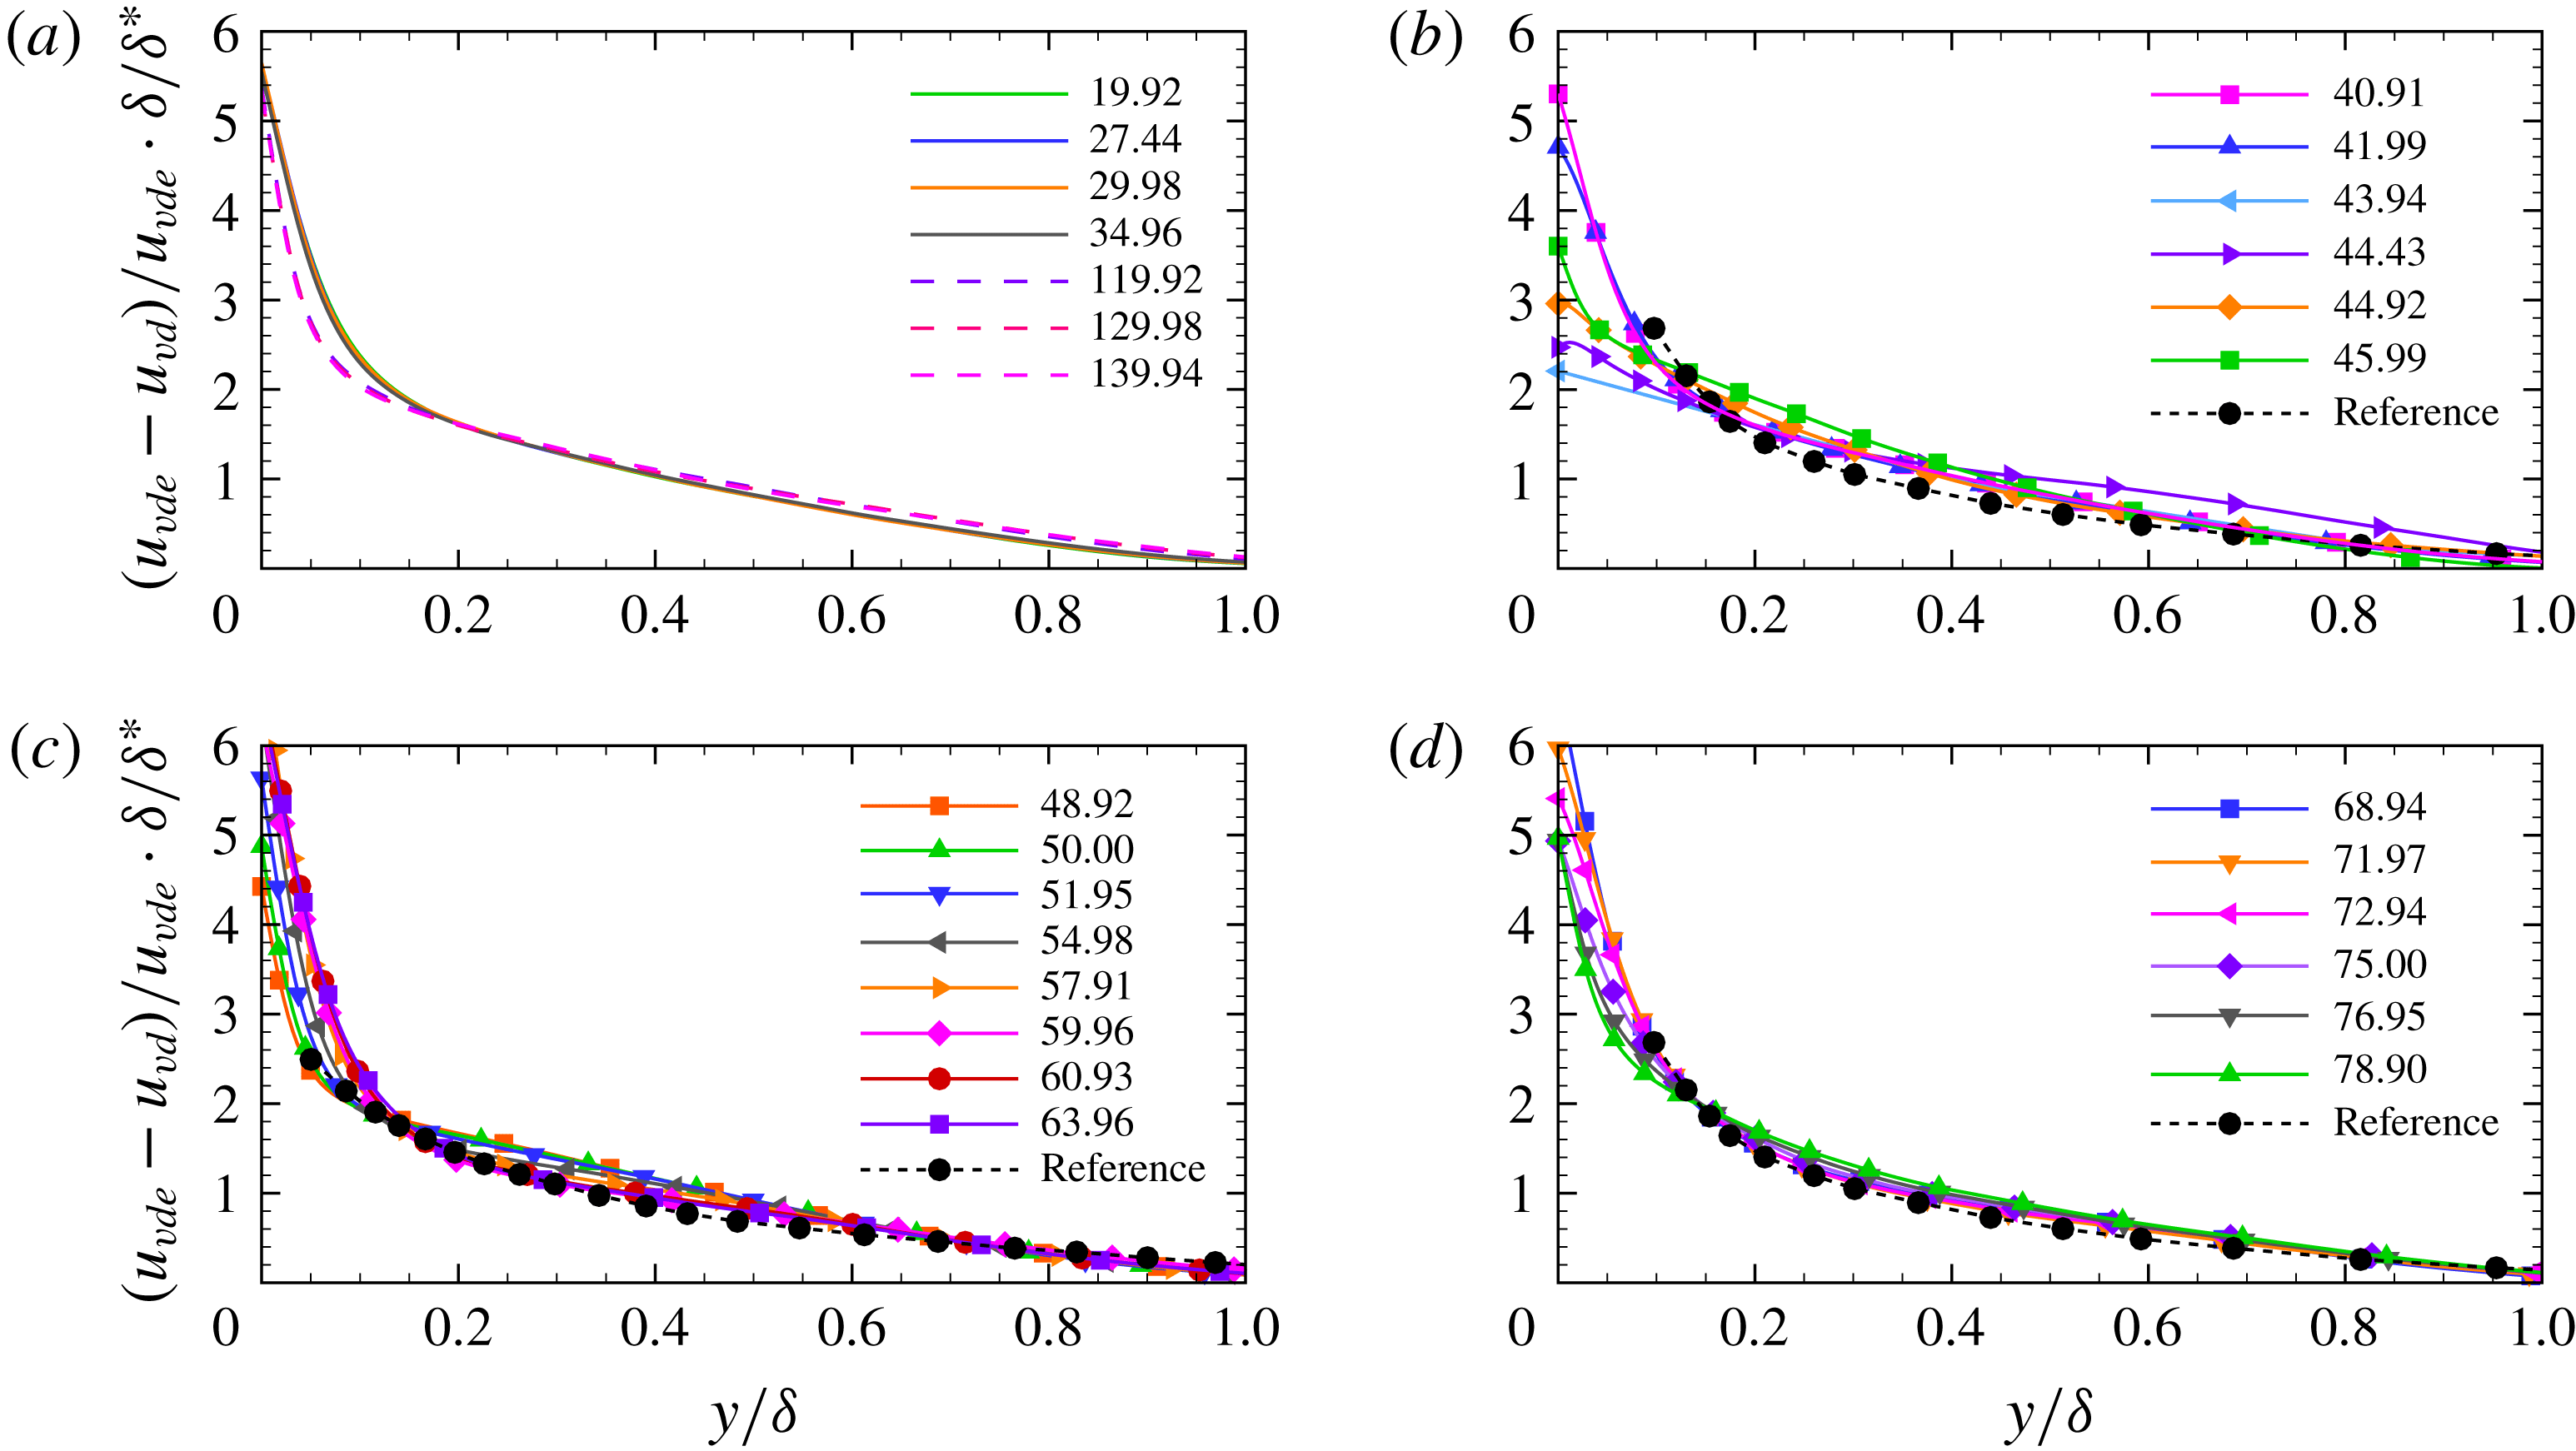
Mean velocity defect profiles at different streamwise stations in regions ZPG1 + ZPG2 (a), APG1 (b), FPG (c) and APG2 (d). Reference data from Song & Eaton (Reference Song and Eaton2004) and Aubertine & Eaton (Reference Aubertine and Eaton2005) are shown in panels (c) and (b,d), respectively.

Self-similarity of the velocity profiles in the various zones is checked in figure 18, where we show the van Driest transformed velocity multiplied by
 $\unicode[STIX]{x1D6FF}/\unicode[STIX]{x1D6FF}^{\ast }$
to remove effects of upstream conditions and local Reynolds number on the outer velocity profile (Zagarola & Smits Reference Zagarola and Smits1998). In the ZPG1 and ZPG2 regions, the velocity profiles do in fact collapse onto a single curve, with the obvious exception of the near-wall region, which suffers Reynolds-number dependence. Similar considerations can be made for the FPG and APG2 regions, which show a good degree of universality, and in which the defect velocity profiles well match reference experimental data for FPG flows (Song & Eaton Reference Song and Eaton2004) and for APG flows (Aubertine & Eaton Reference Aubertine and Eaton2005). Not surprisingly, large deviations from a common distribution are observed in the APG1 region, which experiences strong APG conditions and in which the flow even undergoes mean separation.
3.5 Analysis of flow reversal
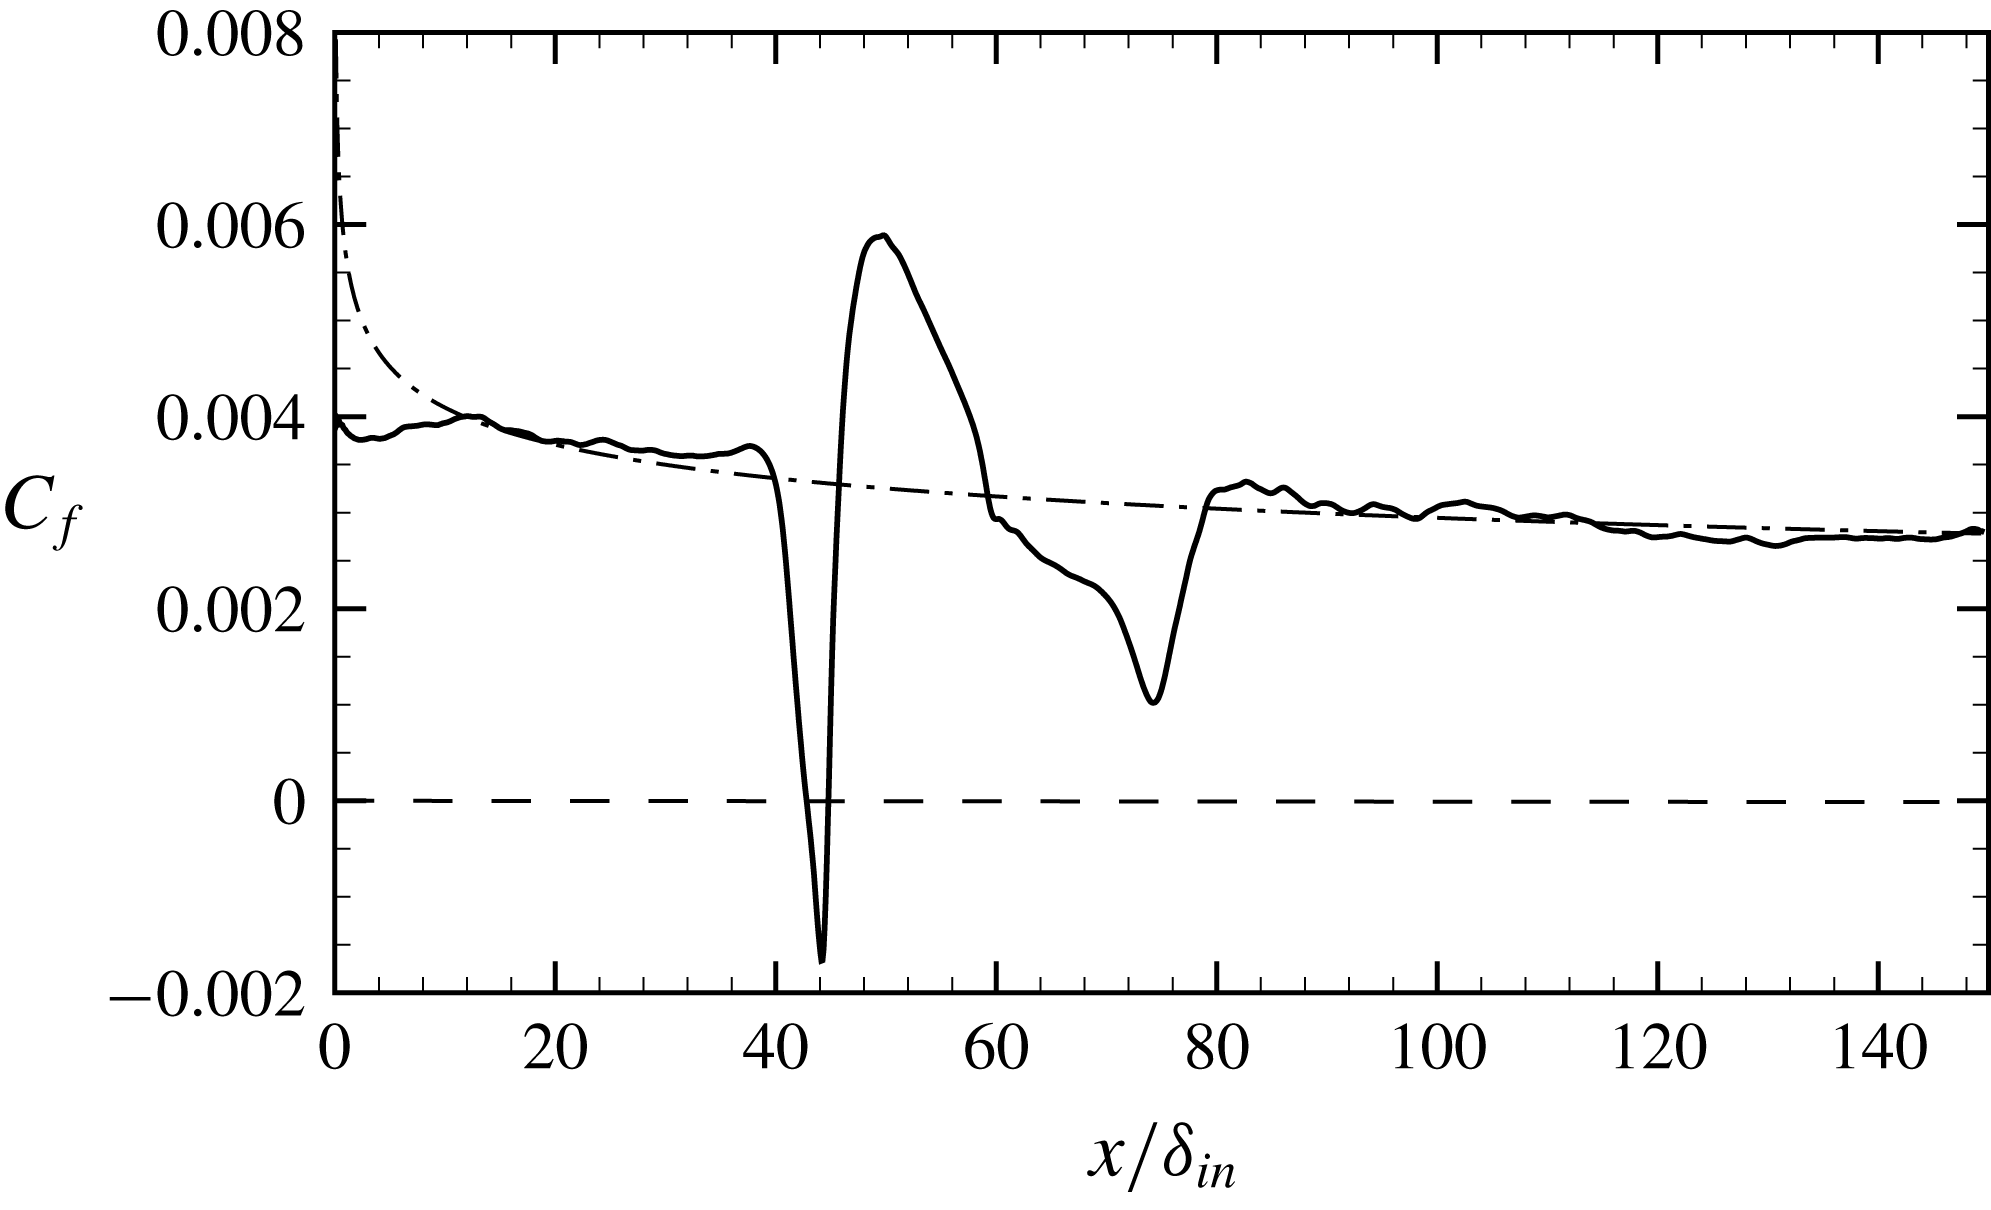
Mean friction coefficient in the symmetry plane. The dash-dotted line refers to (3.8).

The imposed APG causes flow retardation along with locally reversed flow. The distribution of the mean friction coefficient
 $C_{f}=2\unicode[STIX]{x1D70F}_{w}/\unicode[STIX]{x1D70C}_{\infty }u_{\infty }^{2}$
, with
 $\unicode[STIX]{x1D70F}_{w}=\unicode[STIX]{x1D707}_{w}(\unicode[STIX]{x2202}\tilde{u} /\unicode[STIX]{x2202}y)_{w}$
, is shown in the symmetry plane in figure 19. Upstream of the interaction zone and in the downstream ZPG2 region the friction coefficient well follows the power-law behaviour predicted by simple theory (Smits & Dussauge Reference Smits and Dussauge2006), namely
 $$\begin{eqnarray}C_{f}=kRe_{x}^{-1/7},\end{eqnarray}$$
with
 $k=0.0192$
, with the obvious exception of the inflow region where the boundary layer is not properly developed yet. Mean flow reversal in the symmetry plane is observed in the APG1 region, whereas
 $C_{f}$
overshoots its upstream value in the FPG region right past the reattachment point. A secondary minimum of
 $C_{f}$
is found in the APG2 region, where, however, the flow is not detached in the mean sense.
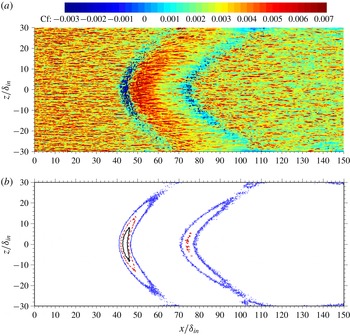
Instantaneous contours of wall friction (a) and of flow reversal probability
 $\overline{\unicode[STIX]{x1D6FE}}$
(b) at the wall surface. The contour levels
 $\overline{\unicode[STIX]{x1D6FE}}=0.5$
(solid), 0.2 (dashed) and 0.01 (dotted) are shown in panel (b).

Additional insight into the nature of wall flow reversal may be gained from figure 20, where we show the instantaneous wall friction and the statistical frequency of events with wall flow reversal (say
 $\overline{\unicode[STIX]{x1D6FE}}$
). Figure 20(a) shows that both the APG1 and APG2 regions feature a substantial fraction of flow reversal events, which are, however, scattered and interspersed with regions of attached flow. On the other hand, the FPG region is depleted with reverse flow events, and it features friction excess over the upstream value. The intermittency data are shown in figure 20(b). The data can be interpreted in light of the classification proposed by Simpson (Reference Simpson1989), according to which: incipient detachment occurs with instantaneous backflow 1 % of the time; intermittent transitory detachment occurs with instantaneous backflow 20 % of the time; and transitory detachment (amounting to mean flow reversal) happens with 50 % probability of instantaneous backflow. According to figure 20(b), mean flow reversal is found to occur only in the APG1 region around the symmetry line, whereas the flow becomes unidirectional in the mean away from the symmetry axis where the pressure gradient is milder. Hence, the reversed flow region tends to become narrower along the
 $z$
direction, eventually vanishing at
 $z\approx \pm 7.7\unicode[STIX]{x1D6FF}_{in}$
. Transitory detachment is observed in both the APG1 and APG2 regions, to a much lesser extent in the latter case. Interestingly, an extended region with incipient detachment is observed in both APG zones, with no significant size difference.
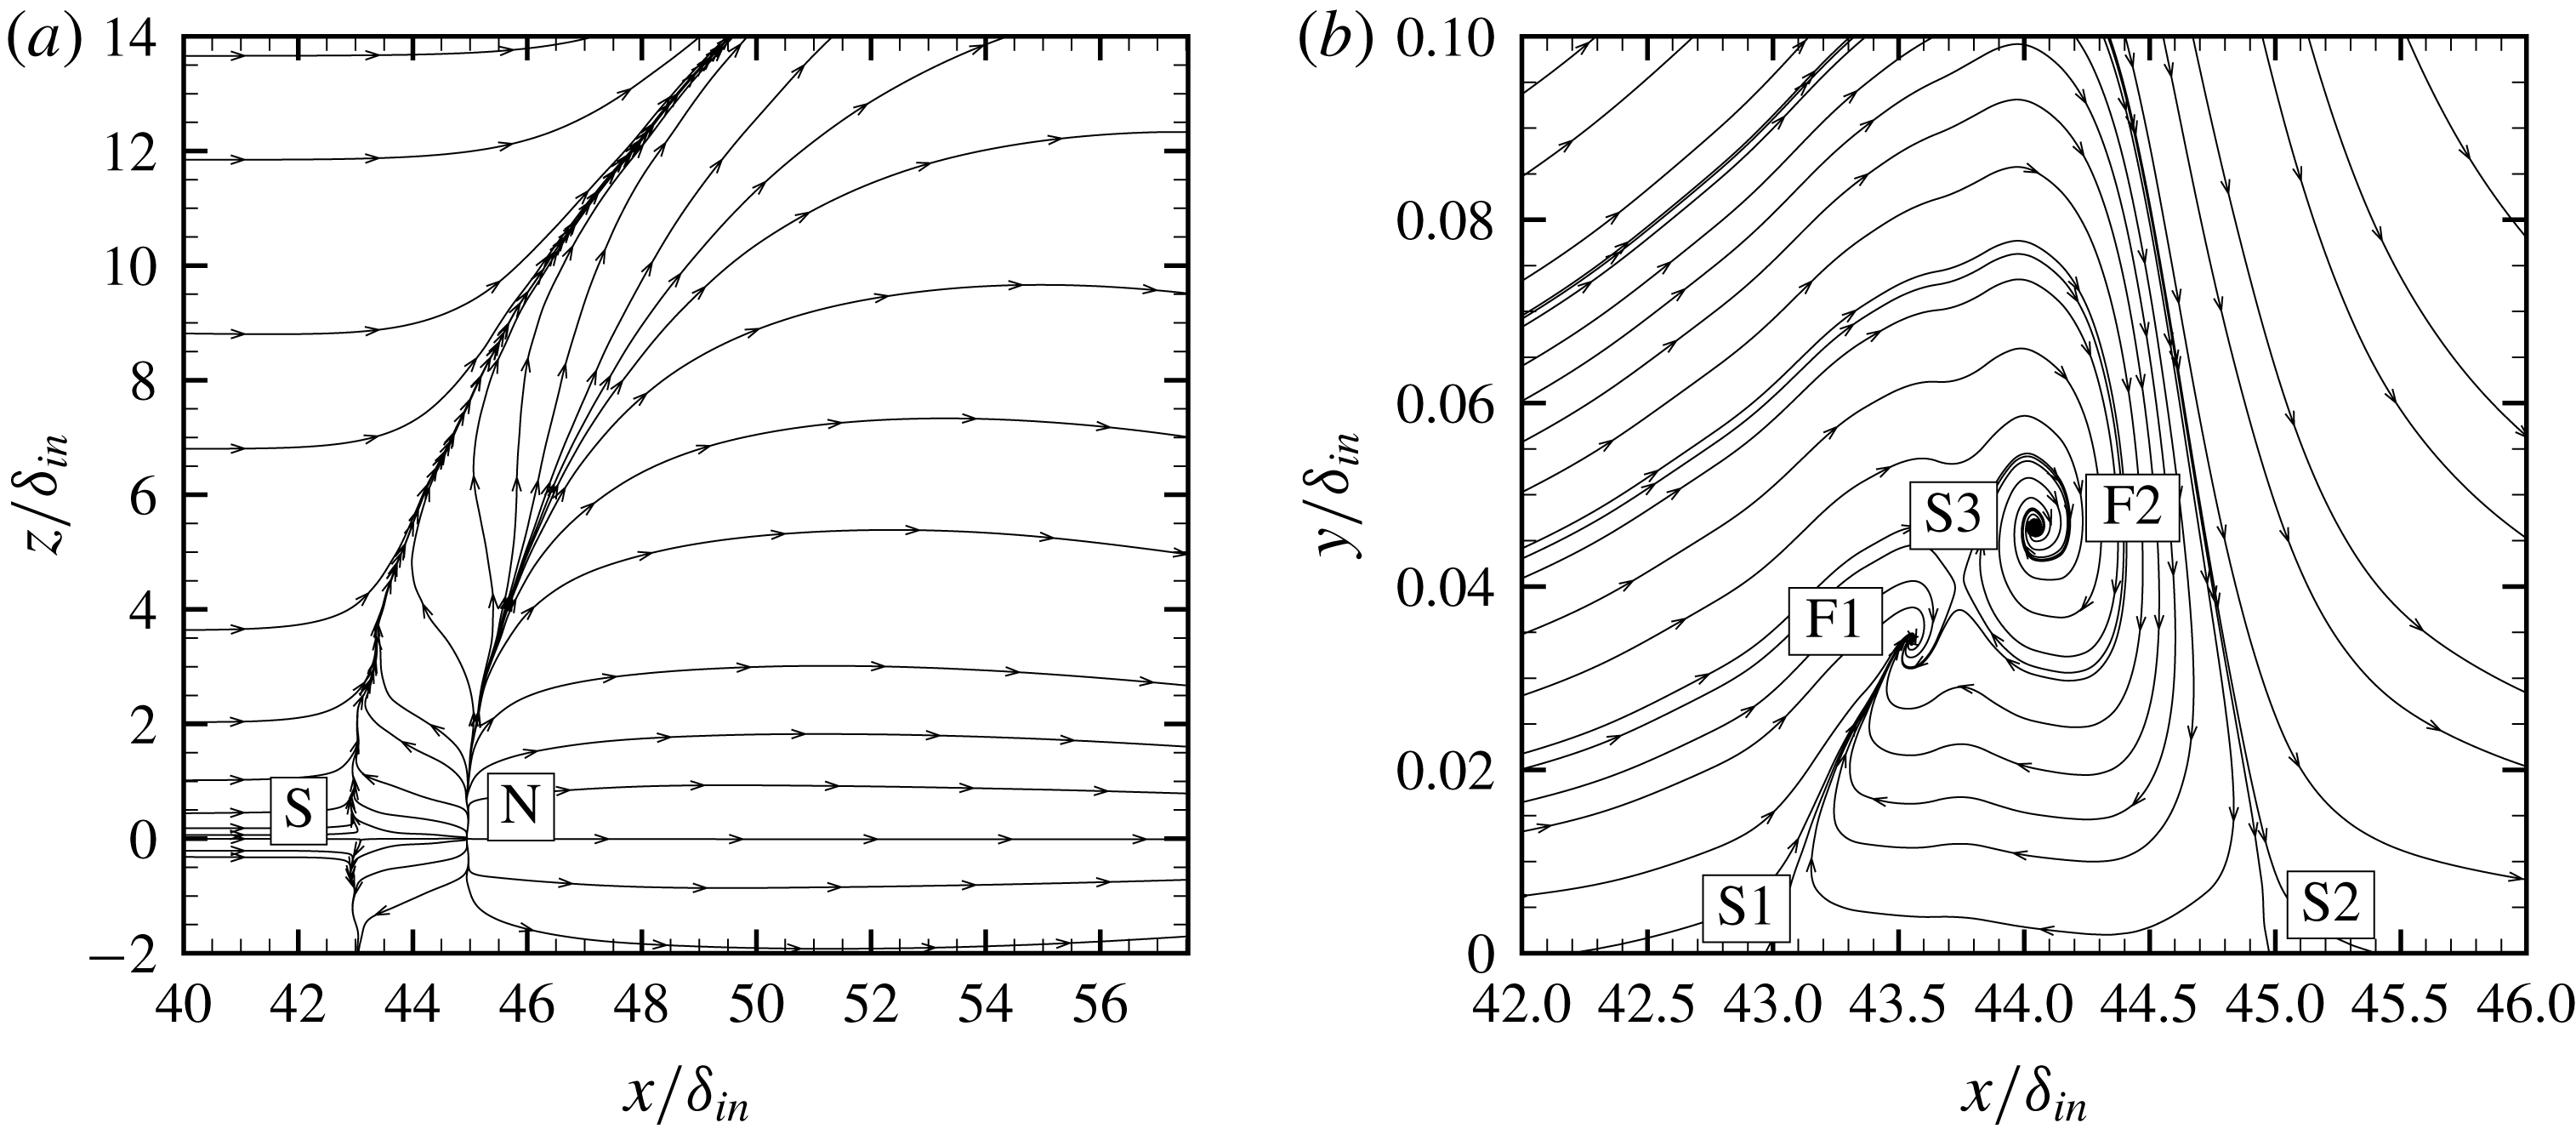
Limit wall streamlines of mean flow field (a), and streamtraces in the symmetry plane (b), highlighting critical points: N, nodes; S, saddle points; F, foci. Note that the axes in panel (b) are not to the same scale.

The flow topology is further brought out from the analysis of the limit streamtraces in the wall plane and of the streamtraces in the symmetry plane, reported in figure 21. The wall limiting streamlines exhibit a pattern similar to that resulting from separation induced by an obstacle (Délery Reference Délery2001), and the flow features a saddle point associated with three-dimensional flow separation, which emanates from a line of coalescence (separation), and spirals into the vortical centre (Dallmann Reference Dallmann1983; Knight et al.
Reference Knight, Horstman, Bogdonoff and Shapey1987). The three-dimensionality of the flow is also reflected in the streamlines shown in figure 21(b) being open, whereas the streamlines should be closed in two-dimensional steady flow. The flow past the line of coalescence is characterized by the presence of a node at
 $x/\unicode[STIX]{x1D6FF}_{in}\approx 45$
in the symmetry plane associated with a divergence line (attachment). The wall streamtraces are issued from the nodal point and partly converge into the coalescence line and partly are deflected downstream. This wall pattern is classically associated with the formation of a horseshoe vortex bending in the downstream direction, as is clarified in figure 21(b). A very similar organization was also recovered in the experiments of Gai & Teh (Reference Gai and Teh2000). Visualization in the symmetry plane highlights the presence of two saddle points at the wall (S1 and S2), being respectively the signature of the separation and reattachment point, and, according to the classification of Chong, Perry & Cantwell (Reference Chong, Perry and Cantwell1990), two foci of stable type (F1 and F2), separated by a third saddle point (S3). This is to indicate that the horseshoe vortex is in fact split into two branches, which merge together on moving away from the symmetry plane (not shown). It should be noted that the region of reversed flow, which may be defined as the region between the wall and the streamtrace entering saddle point S2, is quite shallow, extending up to
 $y_{R}/\unicode[STIX]{x1D6FF}_{in}\approx 0.11$
. Hence the aspect ratio of the separation bubble is very small, being
 , which is a typical value for turbulent separation bubbles, but much less than laminar ones (Kiya & Sasaki Reference Kiya and Sasaki1983).
3.6 Turbulence statistics
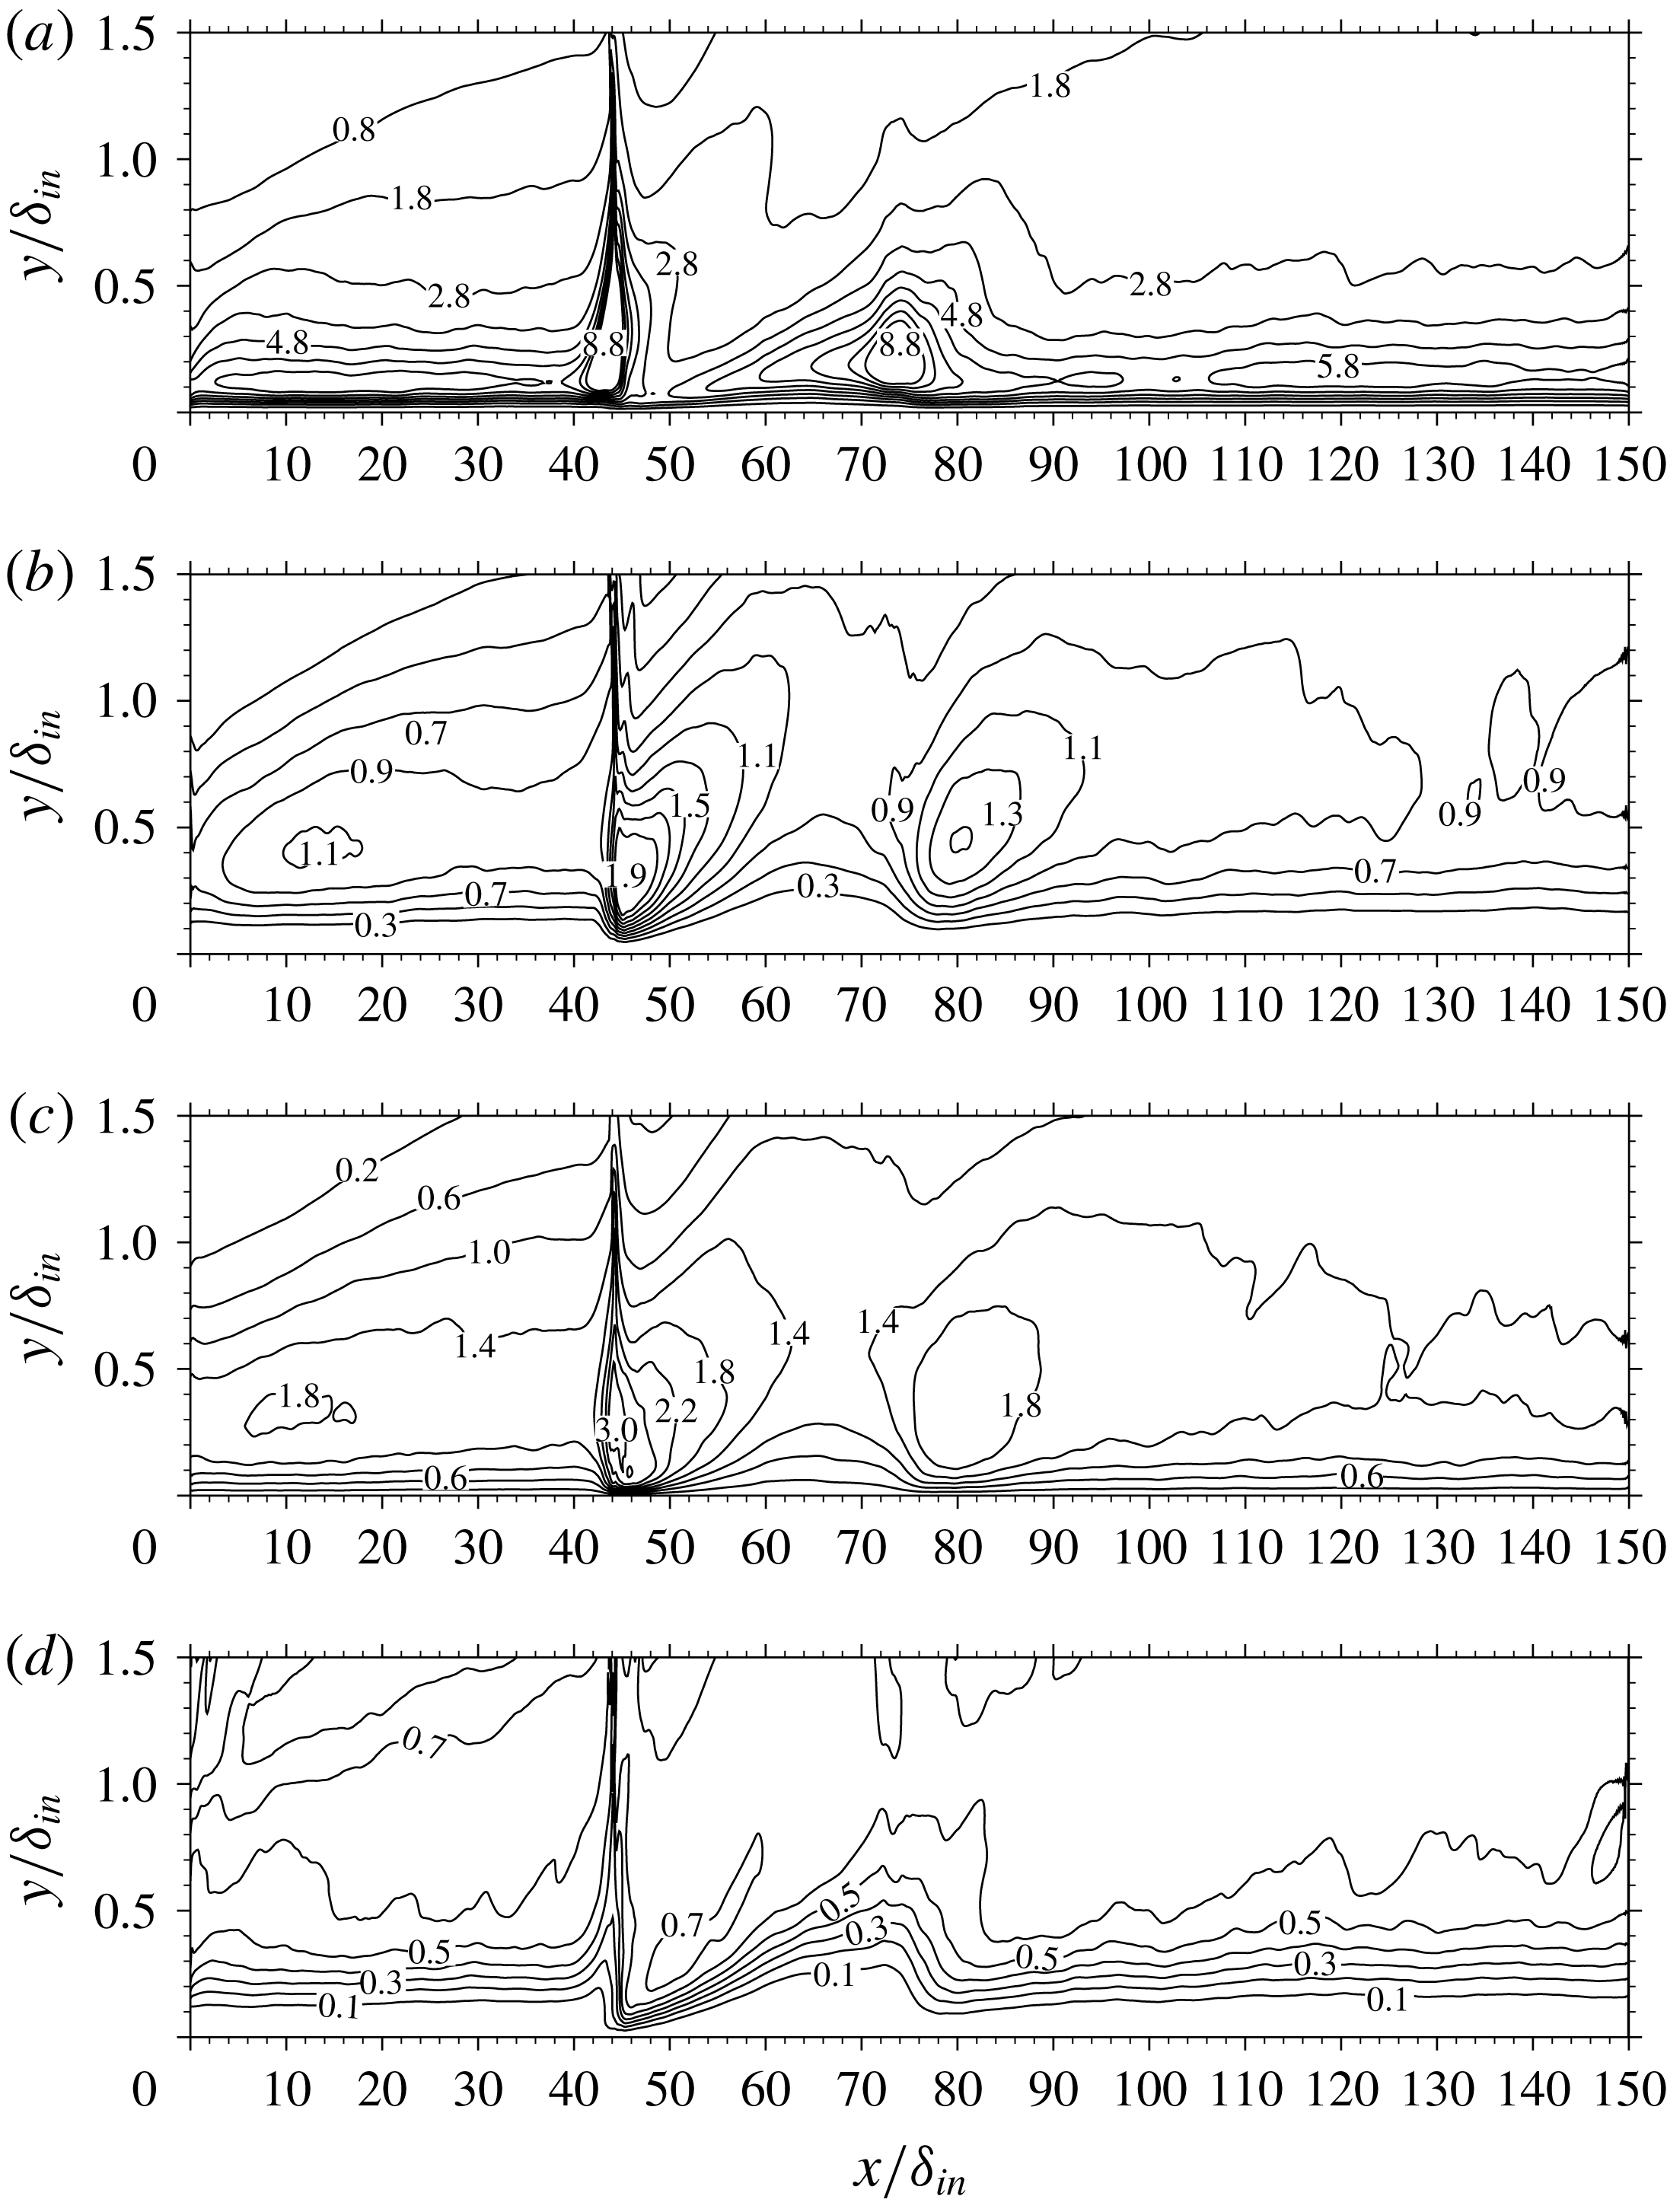
Maps of density-scaled turbulence intensities
 $(\overline{\unicode[STIX]{x1D70C}}/\unicode[STIX]{x1D70C}_{w})\widetilde{{u_{i}^{\prime \prime }}^{2}}$
in the symmetry plane, normalized by friction velocity at the upstream reference station (a)
 $i=1$
, (b)
 $i=2$
and (c)
 $i=3$
and anisotropy indicator (d), as defined in (3.9).

The structural modifications of boundary layer turbulence upon interaction with the conical shock are analysed in this section. For that purpose, contours of the density-scaled velocity correlations
 $\overline{\unicode[STIX]{x1D70C}}/\unicode[STIX]{x1D70C}_{w}\widetilde{u_{i}^{\prime \prime }u_{j}^{\prime \prime }}$
in the symmetry plane are shown in figure 22, upon normalization by the friction velocity at the upstream reference station,
 ${u_{\unicode[STIX]{x1D70F}}}_{ref}$
. Figure 22 supports the general amplification of all turbulence intensities across the APG zones, but to different extents. Specifically, the longitudinal velocity variance is amplified (with respect to its upstream value) by a factor of approximately 2 through the APG1 zone, and by 1.6 in APG2. Similar amplifications are found for the wall-normal velocity correlation, whereas the spanwise velocity variance increases by a factor of 1.8 across APG1, and by a factor of 1.1 in APG2. As expected, peaks of the normal turbulent stresses in the ZPG zones are found to lie closer to the wall for the streamwise component, and further away for the other components. To better highlight modifications of the turbulent stress tensor, in figure 22 we show the map of the Reynolds stress anisotropy function (Lumley Reference Lumley1978), defined as
 $$\begin{eqnarray}F=1+9II+27III,\end{eqnarray}$$
where
 $II$
and
 $III$
are the invariants of the anisotropy stress tensor,
 $b_{ij}=\unicode[STIX]{x1D70F}_{ij}^{\ast }/\unicode[STIX]{x1D70F}_{ii}^{\ast }-\frac{1}{3}\unicode[STIX]{x1D6FF}_{ij}$
, and which is a measure of the approach to either two-component turbulence (corresponding to
 $F=0$
) or a three-component isotropic state (corresponding to
 $F=1$
). Consistent with previous DNS data, figure 22 shows that in ZPG regions
 $F$
is increasing from a nearly zero value at the wall where the flow is dominated by streaks, to a nearly uniform value of approximately
 $0.6$
in the outer part of the boundary layer. As the flow crosses the interacting shock in the APG1 region, the anisotropy indicator increases at any given
 $y$
, indicating approach of turbulence to an isotropic state. The opposite effect is observed in the FPG region, which shows a consistent decrease of this indicator, accompanied by the previously noted re-formation of the streaks, and again an increase is observed in the APG2 region, prior to relaxation to an equilibrium state.
Eddy viscosity normalized by free-stream molecular viscosity (
 $\unicode[STIX]{x1D707}_{T}/\unicode[STIX]{x1D707}_{\infty }$
) in the symmetry plane (a) and in the plane
 $y=0.25\unicode[STIX]{x1D6FF}_{in}$
(b), as obtained from DNS (lines) and from RANS with the Spalart–Allmaras model (flooded contours).

The DNS database developed herein can be profitably exploited for testing hypotheses and checking predictions of turbulence closures. In the following, we explore the predictive power and limitations of the Boussinesq hypothesis, which postulates a linear relationship between the anisotropic turbulent stress tensor and the mean strain tensor through a scalar eddy viscosity
 $\unicode[STIX]{x1D707}_{T}$
,
 $$\begin{eqnarray}-\overline{\unicode[STIX]{x1D70C}u_{i}^{\prime \prime }u_{j}^{\prime \prime }}=2\unicode[STIX]{x1D707}_{T}\tilde{S}_{ij}^{\ast }-\frac{2}{3}\overline{\unicode[STIX]{x1D70C}}\unicode[STIX]{x1D705}\unicode[STIX]{x1D6FF}_{ij},\quad \tilde{S}_{ij}^{\ast }=\frac{1}{2}\left(\frac{\unicode[STIX]{x2202}\tilde{u} _{i}}{\unicode[STIX]{x2202}x_{j}}+\frac{\unicode[STIX]{x2202}\tilde{u} _{j}}{\unicode[STIX]{x2202}x_{i}}\right)-\frac{1}{3}\frac{\unicode[STIX]{x2202}\tilde{u} _{k}}{\unicode[STIX]{x2202}x_{k}}\unicode[STIX]{x1D6FF}_{ij},\end{eqnarray}$$
with
 $\unicode[STIX]{x1D705}=\frac{1}{2}\widetilde{u_{k}^{\prime \prime }u_{k}^{\prime \prime }}$
the turbulence kinetic energy. An effective eddy viscosity can be extracted from DNS through contraction
 $$\begin{eqnarray}\unicode[STIX]{x1D707}_{T}=-\frac{\left(\overline{\unicode[STIX]{x1D70C}u_{i}^{\prime \prime }u_{j}^{\prime \prime }}-\frac{2}{3}\overline{\unicode[STIX]{x1D70C}}\unicode[STIX]{x1D705}\unicode[STIX]{x1D6FF}_{ij}\right)\tilde{S}_{ij}^{\ast }}{2\tilde{S}_{ij}^{\ast }\tilde{S}_{ij}^{\ast }}.\end{eqnarray}$$
This is compared in figure 23 with the eddy viscosity obtained with RANS based on the Spalart–Allmaras one-equation model (Spalart & Allmaras Reference Spalart and Allmaras1992) in its classical form, without use of any compressibility correction. Good qualitative agreement is observed both in the symmetry plane and in a representative wall-parallel plane, with the eddy viscosity increasing in APG zones and decreasing in FPG zones and moving away from the symmetry plane. Quantitative differences are obviously present, and RANS is found to generally underestimate
 $\unicode[STIX]{x1D707}_{T}$
, especially upstream of the interaction, whereas the agreement improves downstream of the incident shock, owing to the previously noted flow isotropization. Additional discrepancies are due to the different prediction of the trailing shock position, which is further upstream in RANS owing to incorrect prediction of the recirculation extent past the shock-generating cone. It should also be noted that DNS tends to yield two distinct peaks in the region of maximum
 $\unicode[STIX]{x1D707}_{T}$
, whereas RANS predicts a single peak.
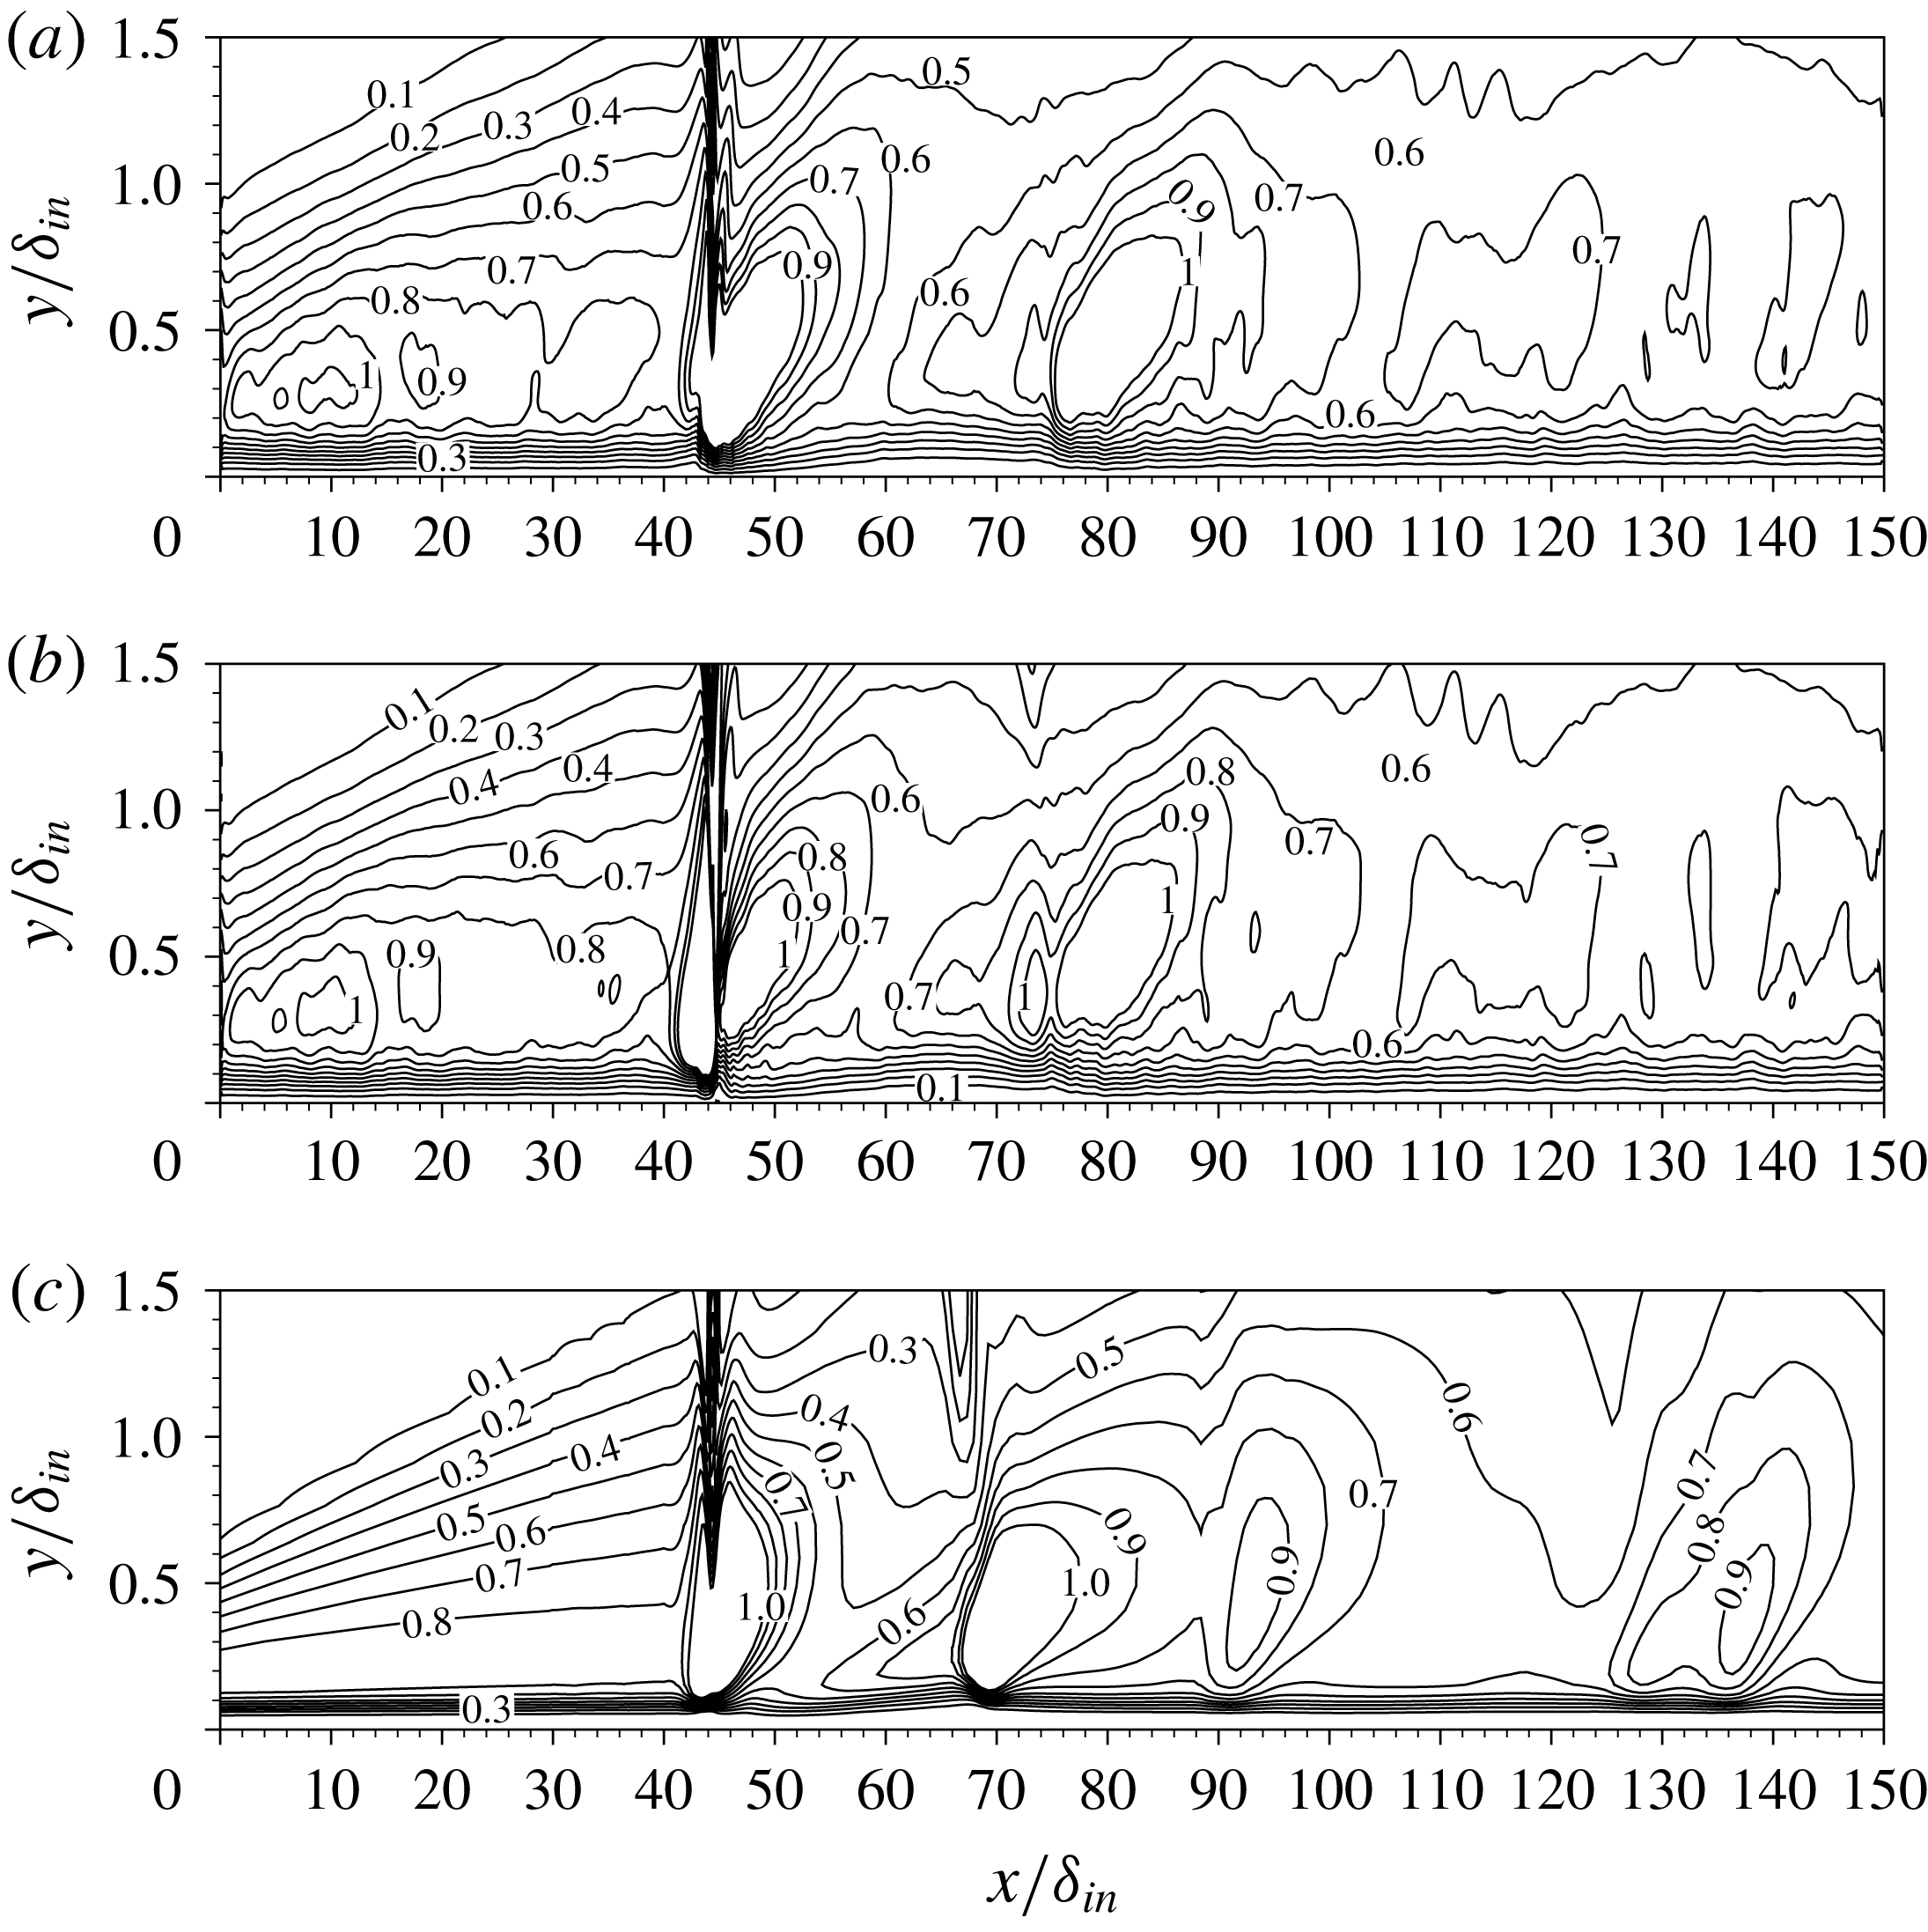
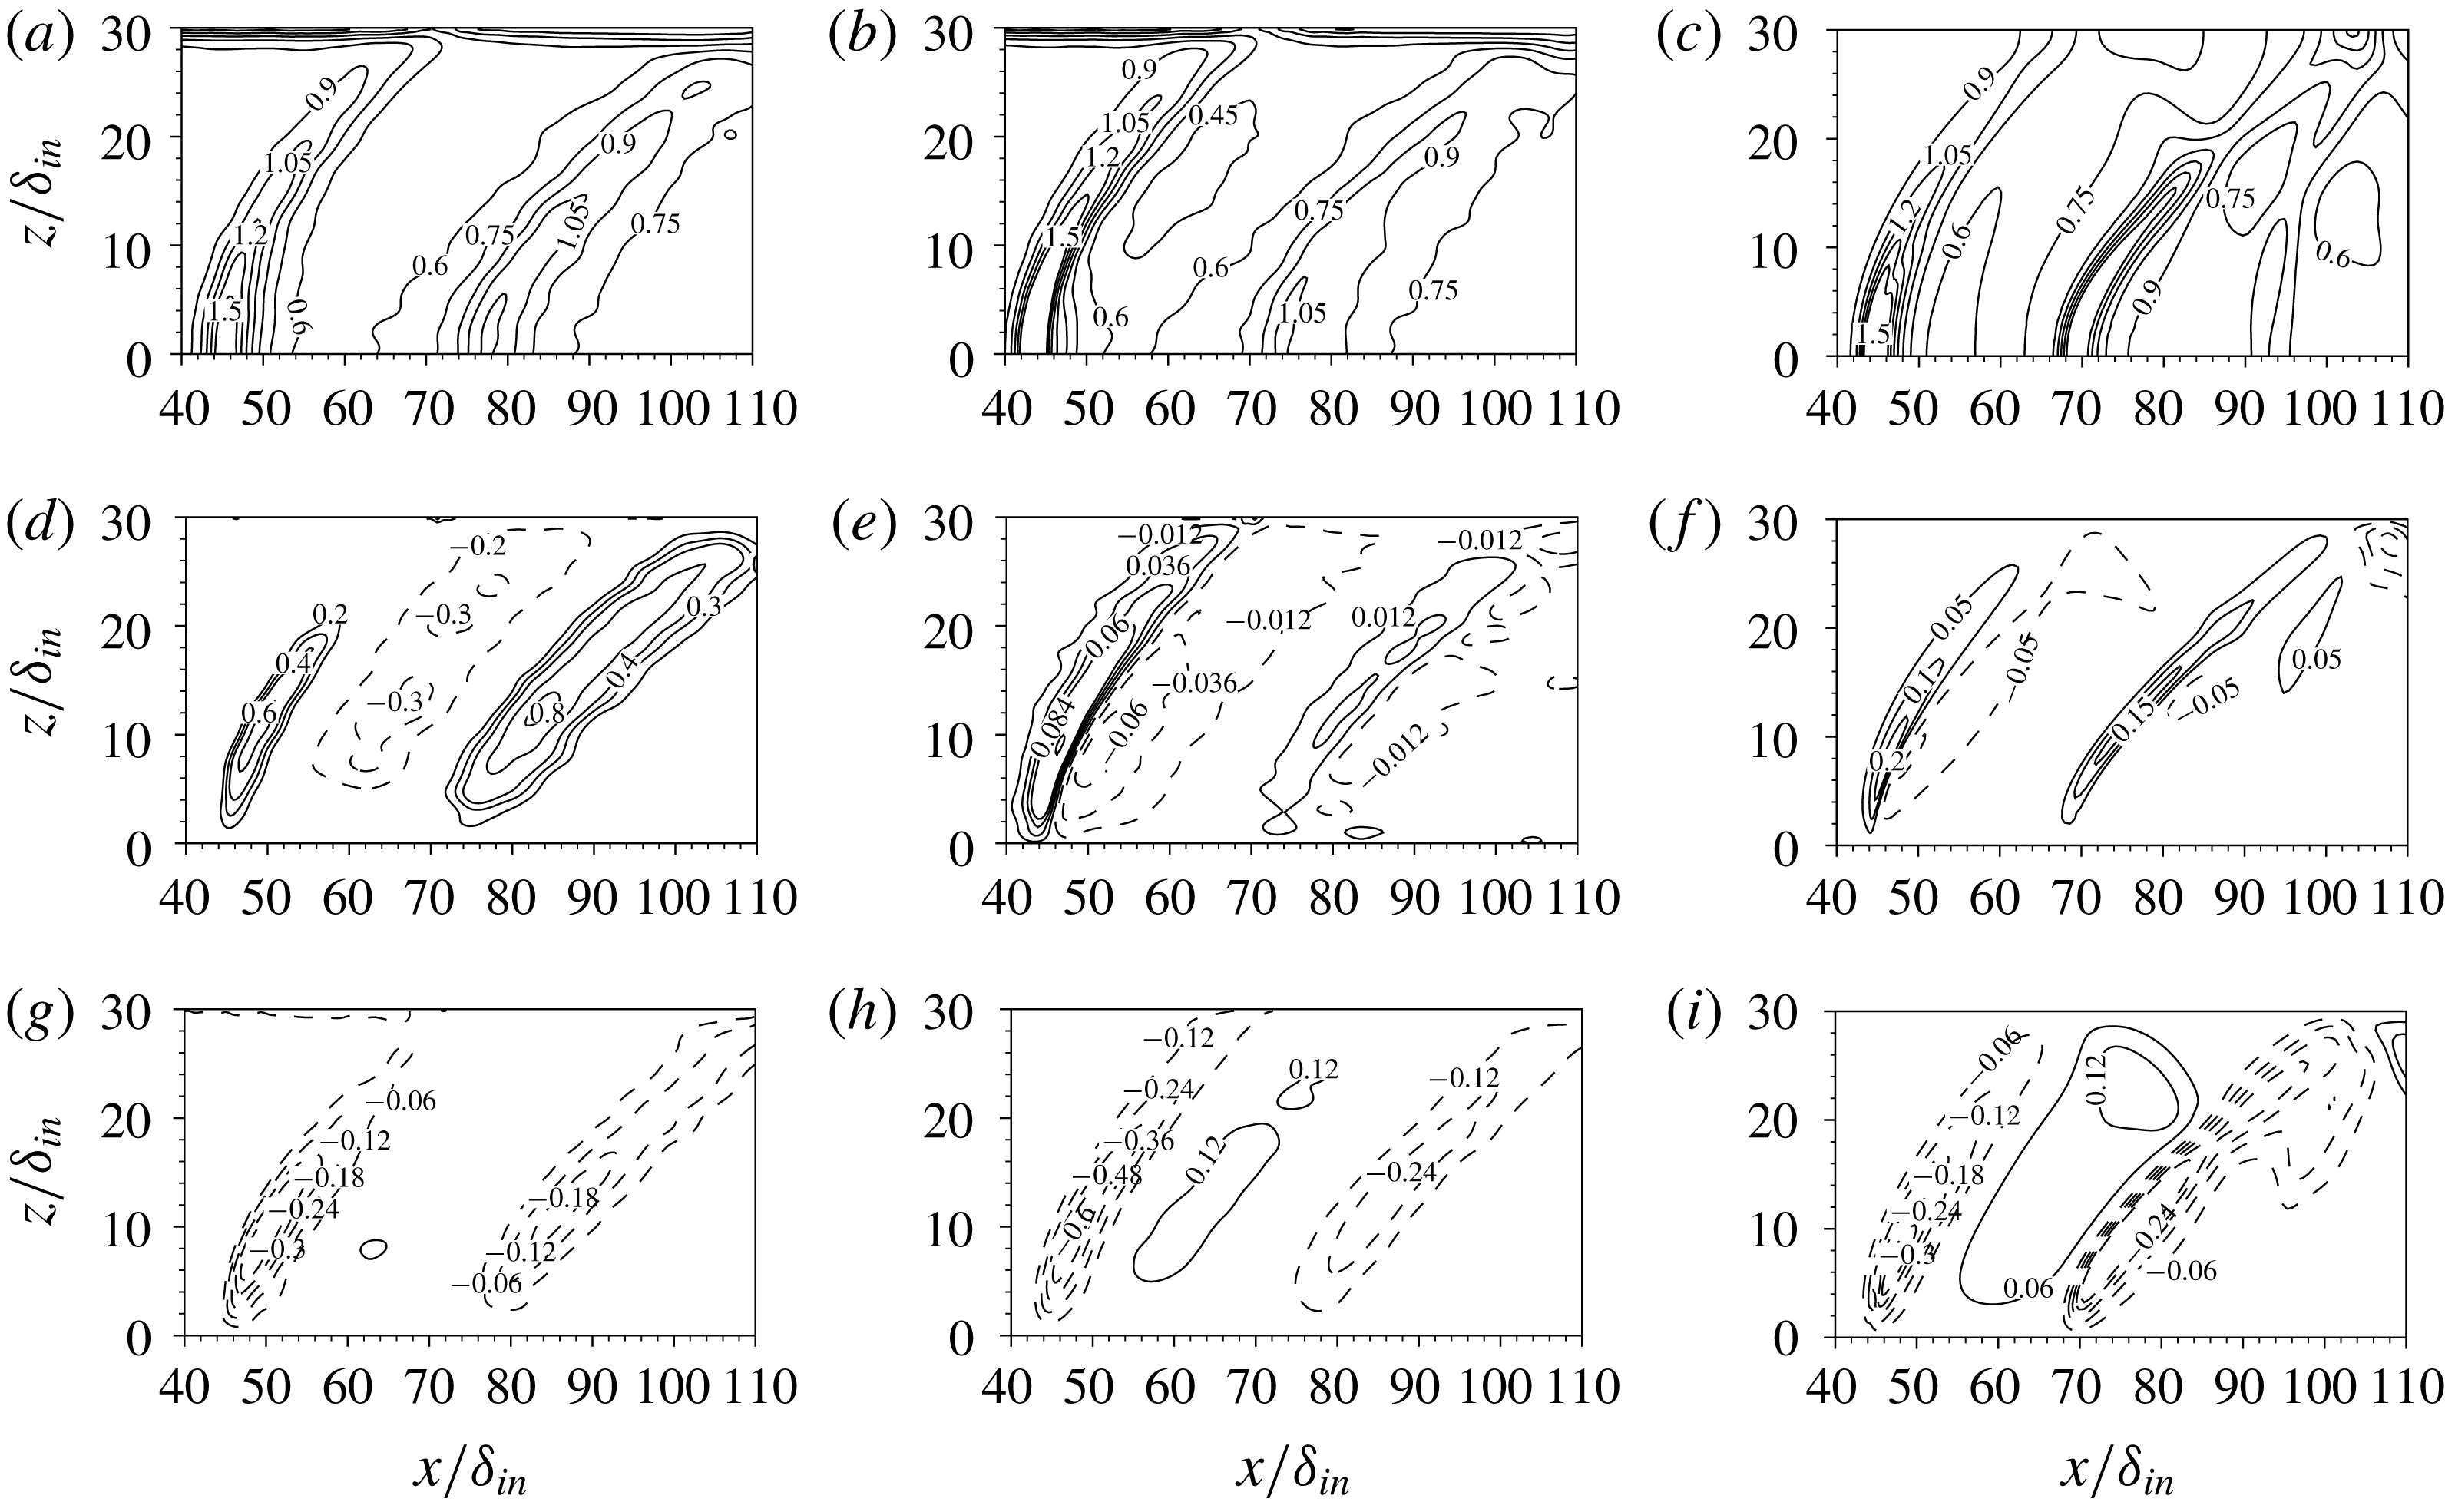
Maps of density-scaled primary turbulent shear stress
 $-(\overline{\unicode[STIX]{x1D70C}}/\unicode[STIX]{x1D70C}_{w})\widetilde{u^{\prime \prime }v^{\prime \prime }}$
in the symmetry plane, normalized by friction velocity at the upstream reference station, as obtained from DNS (a), from eddy-viscosity hypothesis (b) and from RANS (c).

We now proceed to compare the computed Reynolds stress distributions with those modelled using the Boussinesq closure, with
 $\unicode[STIX]{x1D707}_{T}$
either determined after equation (3.11), or as predicted from RANS. The analysis here is limited to the off-diagonal Reynolds stress components, as the diagonal stresses are known to be poorly predicted by any linear eddy-viscosity model (Speziale Reference Speziale1987), which is also the case here. As seen in figure 24, the primary shear stress
 $-\overline{\unicode[STIX]{x1D70C}u^{\prime \prime }v^{\prime \prime }}$
is recovered with excellent accuracy when the ‘exact’
 $\unicode[STIX]{x1D707}_{T}$
(3.11) is used, which is not unexpected, as the other off-diagonal stresses are zero at the symmetry plane, and diagonal terms only contribute where anisotropy is significant. Good prediction is also achieved by RANS, with the previously noted differences in the vicinity of the trailing shock. This observation supports the generally acknowledged effectiveness of classical RANS for unidirectionally sheared flows.
Maps of density-scaled turbulent shear stresses in a wall-parallel plane (
 $y=0.25\unicode[STIX]{x1D6FF}_{in}$
), normalized by friction velocity at the upstream reference station, as obtained from DNS (a,d,g), with
 $\unicode[STIX]{x1D707}_{T}$
determined from (3.11) (b,e,h) and from RANS (c,f,i): (a,b,c)
 $-(\overline{\unicode[STIX]{x1D70C}}/\unicode[STIX]{x1D70C}_{w})\widetilde{u^{\prime \prime }v^{\prime \prime }}$
, (d,e,f)
 $-(\overline{\unicode[STIX]{x1D70C}}/\unicode[STIX]{x1D70C}_{w})\widetilde{u^{\prime \prime }w^{\prime \prime }}$
, (g,h,i)
 $-(\overline{\unicode[STIX]{x1D70C}}/\unicode[STIX]{x1D70C}_{w})\widetilde{v^{\prime \prime }w^{\prime \prime }}$
. Dashed lines denote negative values.

Additional information related to the multi-dimensional character of turbulence in CSBLIs may be gained by inspecting turbulent stresses in a wall-parallel plane, as shown in figure 25. Note that, for obvious symmetry reasons, only half of the full domain span is shown. The primary shear stress
 $-\overline{\unicode[STIX]{x1D70C}u^{\prime \prime }v^{\prime \prime }}$
shows two main peaks, corresponding to the APG zones, whose intensity decreases on moving away from the symmetry plane. As previously observed in figure 24 for the symmetry plane, the Boussinesq hypothesis works quite well for this component of the turbulent stress. Similar spatial organization is also observed for the secondary shear stresses
 $-\overline{\unicode[STIX]{x1D70C}u^{\prime \prime }w^{\prime \prime }}$
and
 $-\overline{\unicode[STIX]{x1D70C}v^{\prime \prime }w^{\prime \prime }}$
, which become similar in magnitude away from the symmetry plane. However, whereas the primary shear stress is everywhere positive, the secondary stresses exhibit a change of sign from the APG to the FPG regions. As shown in figure 25, this sign variation is well captured from the simple Boussinesq closure (middle column), thus showing that the secondary shear stresses are closely related to the respective mean velocity gradients. However, it should be noted that the numerical values are underestimated by a factor of approximately 5 in the case of
 $-\overline{\unicode[STIX]{x1D70C}u^{\prime \prime }w^{\prime \prime }}$
, and generally overestimated in the case of
 $-\overline{\unicode[STIX]{x1D70C}v^{\prime \prime }w^{\prime \prime }}$
, even when the ‘exact’ eddy viscosity is used. Similar results are obtained with RANS (right column). Hence, we conclude that the Boussinesq hypothesis is still meaningful in this complex flow, although different eddy viscosities should be used for each stress component to fully exploit its potential. Possible improvements to the Boussinesq approximation were applied to canonical geometrically two-dimensional SBLIs by Gerolymos, Sauret & Vallet (Reference Gerolymos, Sauret and Vallet2004) and Emory, Pecnik & Iaccarino (Reference Emory, Pecnik and Iaccarino2011), whose predictive capabilities might be tested in this more challenging case.
4 Conclusions
The interaction of a conical shock wave with a turbulent boundary layer at free-stream Mach number
 $M_{\infty }=2.05$
, half cone angle
 $\unicode[STIX]{x1D703}_{c}=25^{\circ }$
and Reynolds number
 $Re_{\unicode[STIX]{x1D703}}\approx 630$
has been analysed by means of DNS of the compressible Navier–Stokes equations. Detailed flow statistics have been presented, including mean flow properties and turbulent fluctuations. Particular effort has been made to characterize the geometry of the shock system and the three-dimensional features of the interaction region.
Consistent with experimental observations, the mean flow pattern is found to include a main conical shock, which imposes a hyperbolic footprint on the underlying flat plate, and which causes thickening and local separation of the developing boundary layer. The incident shock is reflected as two conical shock waves, one arising because of the upstream influence mechanisms, and the second past the boundary layer reattachment. As theoretically predicted, analysis of the entropy fields obtained from DNS allows one to discern transition from regular to Mach reflection with a distinct shock stem moving away from the symmetry plane, although the transition point is probably much farther than suggested by the inviscid theory. The compression waves originating within the cone wake also tend to coalesce to form a secondary weaker conical shock, which interacts with the boundary layer further downstream. Overall, this wave pattern imparts a distinctive N-wave signature at the wall, with a primary APG region followed by an FPG region, which is then closed by a secondary APG region bringing the boundary layer back to an equilibrium state. Very good agreement of the computed wall pressure signature is found with respect to reference experimental measurements.
The imposed wall pressure gradient is responsible for strong turbulence non-equilibrium in the boundary layer. In this respect, flow visualizations in the upstream ZPG region show that the outer part of the boundary layer is populated by hairpin-shaped vortices as well as more asymmetric, cane-shaped vortices. Vortices tend to disappear in the FPG region, and to re-form past the recompression shock. Correspondingly, the near-wall streaks of high- and low-speed fluid that are present in the incoming ZPG region are suppressed in the APG regions, to quickly re-form downstream. Statistical analysis of flow reversal zones highlights mean flow separation in the primary APG zone accompanied with formation of a horseshoe vortex, whereas the secondary APG zone is characterized by intermittent detachment with scattered spots of instantaneous flow reversal.
From a quantitative standpoint we find that turbulence non-equilibrium is only partially captured by existing theoretical frameworks. In particular, we find that the self-similarity proposed by Castillo & George (Reference Castillo and George2001) is partly attained in APG zones, whereas large departures are found in the FPG zone. Different amplification of the Reynolds stress components is observed in the APG regions, accompanied by a change in the geometry of the Reynolds stress tensor. Specifically, isotropy is favoured in APG regions, whereas an anisotropic two-component state is recovered in the FPG zone, associated with re-formation of the streaks. The DNS database has been exploited to verify the validity of fundamental assumptions made in RANS turbulence closures based on the Boussinesq hypothesis. In this respect, we find that the assumed proportionality between turbulent shear stress and related mean velocity gradient applies also when three-dimensionality effects are important; only the primary shear stress is predicted with reasonable accuracy, thus suggesting that tensor eddy-viscosity models or full Reynolds stress closures might provide improved prediction. Future studies will be devoted to enlarging the DNS database by also including cases with stronger shocks and/or cone opening angles, and to further characterize the unsteady wall signature.
Acknowledgement
We acknowledge that the results reported in this paper have been achieved using the PRACE Research Infrastructure resource MARCONI based at CINECA, Casalecchio di Reno, Italy. The China Scholarship Council is gratefully acknowledged for supporting F.-Y.Z. (no. 201706830060) as a joint PhD student at Sapienza University of Rome.
Supplementary movies
Supplementary movies are available at https://doi.org/10.1017/jfm.2019.558.